
Chapter 3 homework
• Number 4: Vincent Diller
• Number 8: Tess Duffin
• Number 10: Jax Gitzes
• Number 18: Elizabeth Gombosi
• Alternate: Winston Hibberd
Chapter 4
Introduction to the Demand and Supply Framework
Supply (cont’d)
• Supply Schedule—a table that shows the quantity firms are willing and able to supply at various prices.
• Supply Curve—a graph that shows the quantities that sellers are willing and able to supply at different prices.

Market Supply
• The horizontal sum of all the individual firm supply curves.
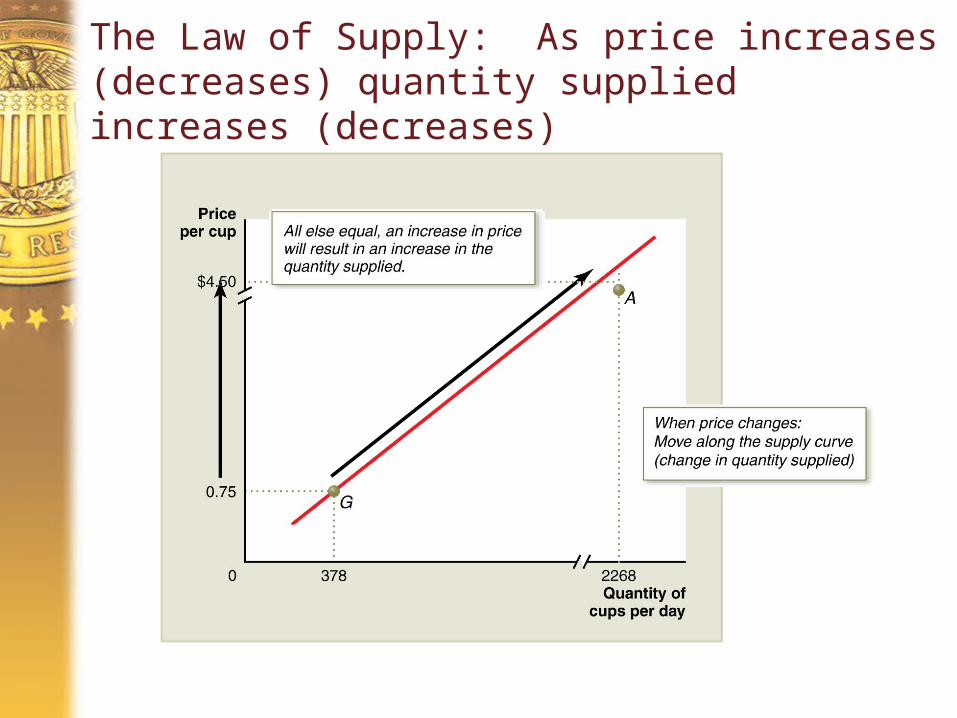
The Law of Supply: As price increases (decreases) quantity supplied increases (decreases)
Changes in Supply
• Prices of inputs (such as wages)
• Technology
• Natural disruptions (such as bad weather)
• The number of firms in the market
• Expectations
• Government policies
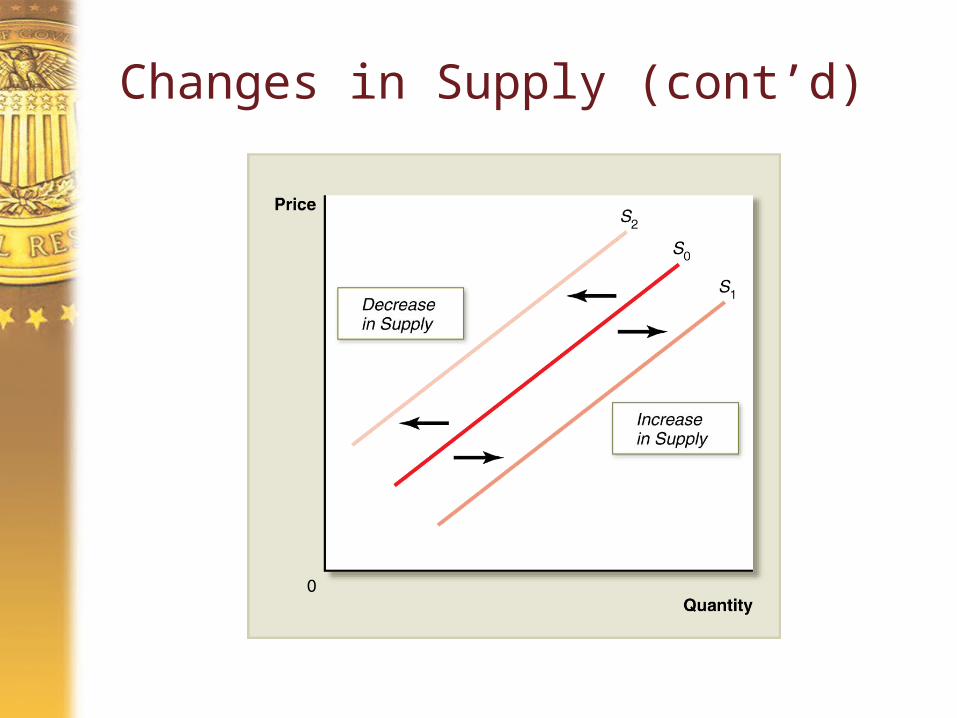
Changes in Supply (cont’d)
Equilibrium
• The price at which the quantity demanded equals the quantity supplied and the market “clears.” No tendency for price or quantity to change.
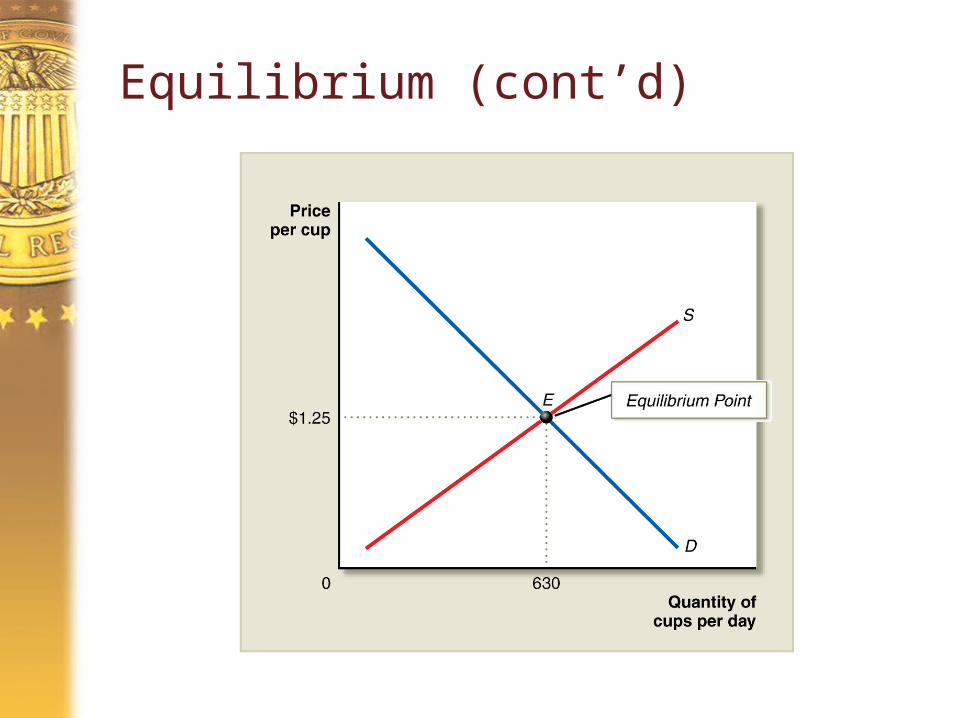
Equilibrium (cont’d)
What if we are not in equilibrium??
• Surplus or Shortage
• No direct intervention or assistance from the government or other oversight body is required to “fix” the problem The Self-Correcting Market
Surpluses
• Prices decrease: Producers are less willing and able to supply
coffee Some consumers are more willing and
able to buy coffee The market self-corrects, and the surplus is
eliminated!
Shortages
• Prices increase: Producers are more willing and able to supply
coffee Some consumers are less willing and able to
buy coffee
• The market self-corrects, and the shortage is eliminated!


