1 GWM/Edelweiss Investment Research
Edelweiss Investment Research
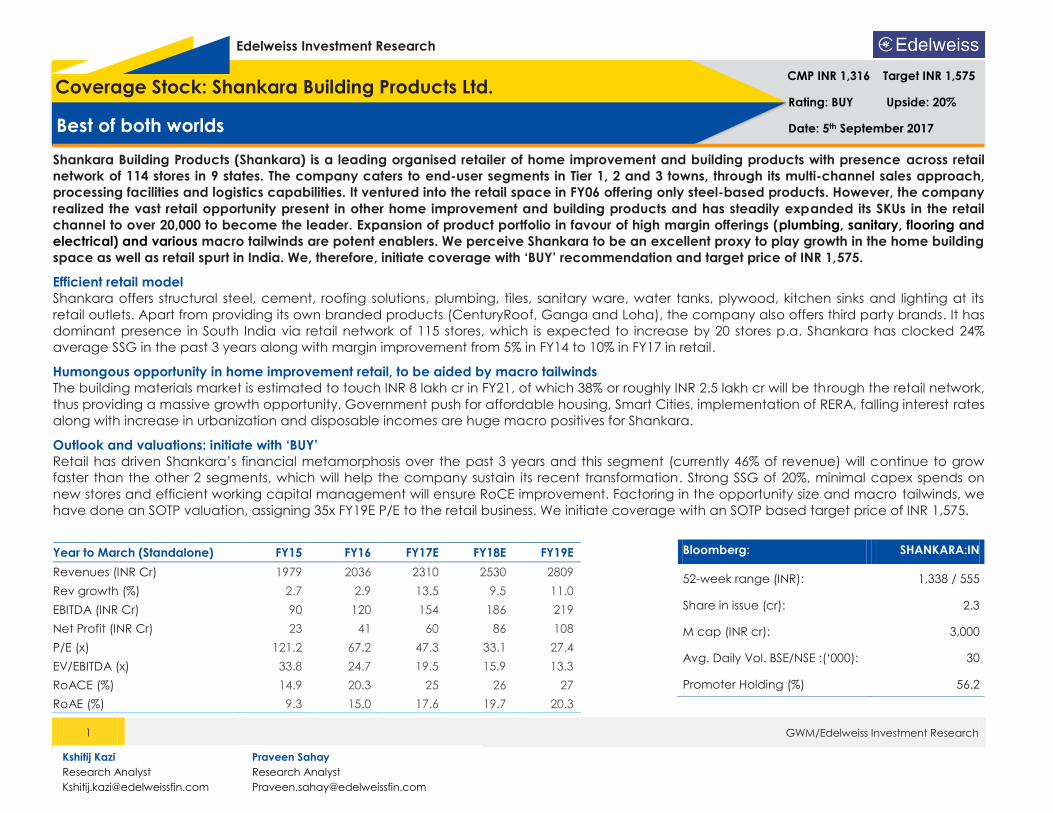
Shankara Building Products (Shankara) is a leading organised retailer of home improvement and building products with presence across retail
network of 114 stores in 9 states. The company caters to end-user segments in Tier 1, 2 and 3 towns, through its multi-channel sales approach,
processing facilities and logistics capabilities. It ventured into the retail space in FY06 offering only steel-based products. However, the company
realized the vast retail opportunity present in other home improvement and building products and has steadily expanded its SKUs in the retail
channel to over 20,000 to become the leader. Expansion of product portfolio in favour of high margin offerings (plumbing, sanitary, flooring and
electrical) and various macro tailwinds are potent enablers. We perceive Shankara to be an excellent proxy to play growth in the home building
space as well as retail spurt in India. We, therefore, initiate coverage with ‘BUY’ recommendation and target price of INR 1,575.
Efficient retail model
Shankara offers structural steel, cement, roofing solutions, plumbing, tiles, sanitary ware, water tanks, plywood, kitchen sinks and lighting at its
retail outlets. Apart from providing its own branded products (CenturyRoof, Ganga and Loha), the company also offers third party brands. It has
dominant presence in South India via retail network of 115 stores, which is expected to increase by 20 stores p.a. Shankara has clocked 24%
average SSG in the past 3 years along with margin improvement from 5% in FY14 to 10% in FY17 in retail.
Humongous opportunity in home improvement retail, to be aided by macro tailwinds
The building materials market is estimated to touch INR 8 lakh cr in FY21, of which 38% or roughly INR 2.5 lakh cr will be through the retail network,
thus providing a massive growth opportunity. Government push for affordable housing, Smart Cities, implementation of RERA, falling interest rates
along with increase in urbanization and disposable incomes are huge macro positives for Shankara.
Outlook and valuations: initiate with ‘BUY’
Retail has driven Shankara’s financial metamorphosis over the past 3 years and this segment (currently 46% of revenue) will continue to grow
faster than the other 2 segments, which will help the company sustain its recent transformation. Strong SSG of 20%, minimal capex spends on
new stores and efficient working capital management will ensure RoCE improvement. Factoring in the opportunity size and macro tailwinds, we
have done an SOTP valuation, assigning 35x FY19E P/E to the retail business. We initiate coverage with an SOTP based target price of INR 1,575.
Year to March (Standalone) FY15 FY16 FY17E FY18E FY19E
Revenues (INR Cr) 1979 2036 2310 2530 2809
Rev growth (%) 2.7 2.9 13.5 9.5 11.0
EBITDA (INR Cr) 90 120 154 186 219
Net Profit (INR Cr) 23 41 60 86 108
P/E (x) 121.2 67.2 47.3 33.1 27.4
EV/EBITDA (x) 33.8 24.7 19.5 15.9 13.3
RoACE (%) 14.9 20.3 25 26 27
RoAE (%) 9.3 15.0 17.6 19.7 20.3
Coverage Stock: Shankara Building Products Ltd.
Best of both worlds
CMP INR 1,316 Target INR 1,575
Rating: BUY Upside: 20%
Date: 5th September 2017
Bloomberg: SHANKARA:IN
52-week range (INR): 1,338 / 555
Share in issue (cr): 2.3
M cap (INR cr): 3,000
Avg. Daily Vol. BSE/NSE :(‘000): 30
Promoter Holding (%) 56.2
Kshitij Kazi
Research Analyst
Praveen Sahay
Research Analyst
Shankara Building Products Ltd.
2 GWM/Edelweiss Investment Research
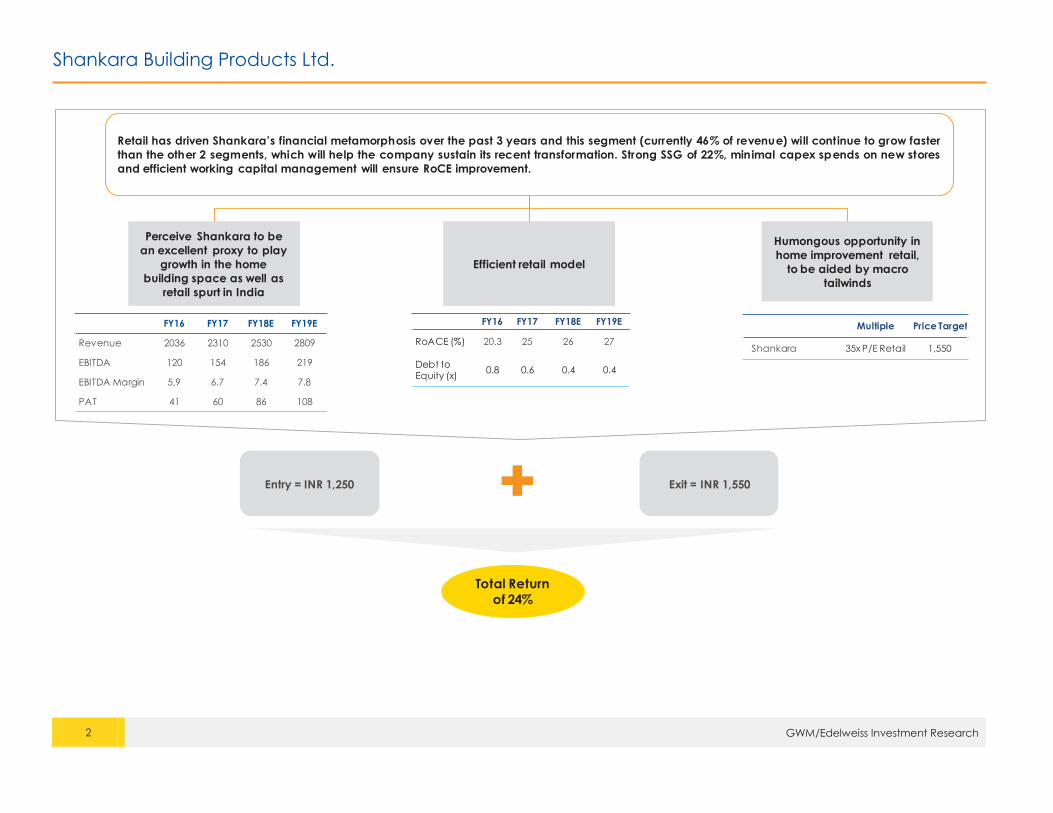
Retail has driven Shankara’s financial metamorphosis over the past 3 years and this segment (currently 46% of revenue) will continue to grow faster
than the other 2 segments, which will help the company sustain its recent transformation. Strong SSG of 22%, minimal capex spends on new stores
and efficient working capital management will ensure RoCE improvement.
Perceive Shankara to be
an excellent proxy to play
growth in the home
building space as well as
retail spurt in India
Efficient retail model
Humongous opportunity in
home improvement retail,
to be aided by macro
tailwinds
FY16 FY17 FY18E FY19E
Revenue 2036 2310 2530 2809
EBITDA 120 154 186 219
EBITDA Margin 5.9 6.7 7.4 7.8
PAT 41 60 86 108
Entry = INR 1,250 Exit = INR 1,550
Total Return
of 24%
FY16 FY17 FY18E FY19E
RoACE (%) 20.3 25 26 27
Debt to Equity (x)
0.8 0.6 0.4 0.4
Multiple Price Target
Shankara 35x P/E Retail 1,550
Shankara Building Products Ltd.
3 GWM/Edelweiss Investment Research
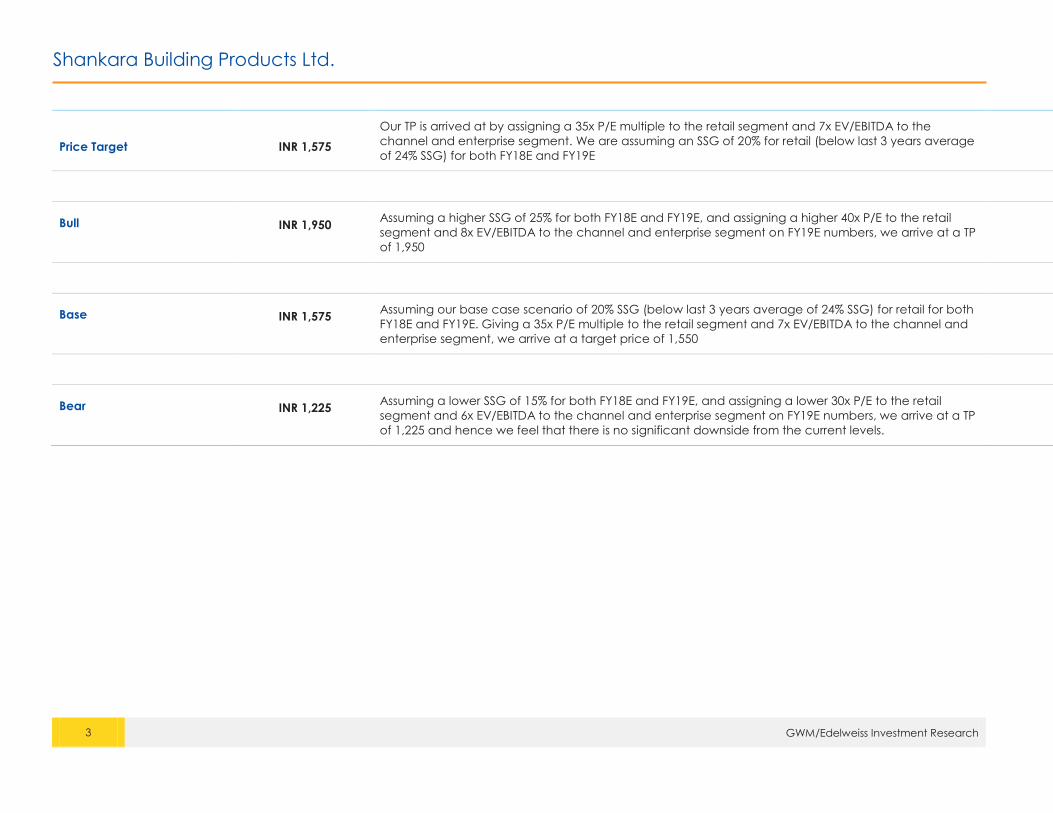
Price Target INR 1,575
Our TP is arrived at by assigning a 35x P/E multiple to the retail segment and 7x EV/EBITDA to the
channel and enterprise segment. We are assuming an SSG of 20% for retail (below last 3 years average
of 24% SSG) for both FY18E and FY19E
Bull
INR 1,950 Assuming a higher SSG of 25% for both FY18E and FY19E, and assigning a higher 40x P/E to the retail
segment and 8x EV/EBITDA to the channel and enterprise segment on FY19E numbers, we arrive at a TP
of 1,950
Base
INR 1,575 Assuming our base case scenario of 20% SSG (below last 3 years average of 24% SSG) for retail for both
FY18E and FY19E. Giving a 35x P/E multiple to the retail segment and 7x EV/EBITDA to the channel and
enterprise segment, we arrive at a target price of 1,550
Bear
INR 1,225 Assuming a lower SSG of 15% for both FY18E and FY19E, and assigning a lower 30x P/E to the retail
segment and 6x EV/EBITDA to the channel and enterprise segment on FY19E numbers, we arrive at a TP
of 1,225 and hence we feel that there is no significant downside from the current levels.
Shankara Building Products Ltd.
4 GWM/Edelweiss Investment Research
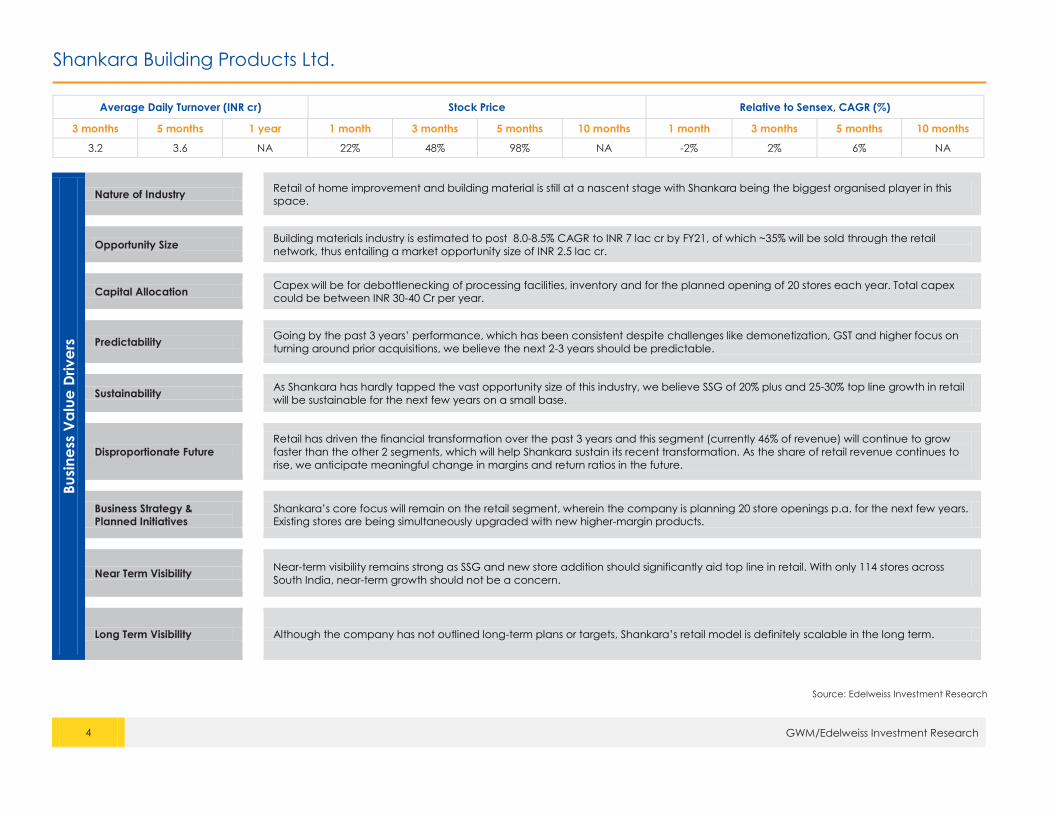
Average Daily Turnover (INR cr) Stock Price Relative to Sensex, CAGR (%)
3 months 5 months 1 year 1 month 3 months 5 months 10 months 1 month 3 months 5 months 10 months
3.2 3.6 NA 22% 48% 98% NA -2% 2% 6% NA
Bu
sin
ess
Va
lue
Driv
ers
Nature of Industry
Retail of home improvement and building material is still at a nascent stage with Shankara being the biggest organised player in this
space.
Opportunity Size
Building materials industry is estimated to post 8.0-8.5% CAGR to INR 7 lac cr by FY21, of which ~35% will be sold through the retail
network, thus entailing a market opportunity size of INR 2.5 lac cr.
Capital Allocation
Capex will be for debottlenecking of processing facilities, inventory and for the planned opening of 20 stores each year. Total capex
could be between INR 30-40 Cr per year.
Predictability
Going by the past 3 years’ performance, which has been consistent despite challenges like demonetization, GST and higher focus on
turning around prior acquisitions, we believe the next 2-3 years should be predictable.
Sustainability
As Shankara has hardly tapped the vast opportunity size of this industry, we believe SSG of 20% plus and 25-30% top line growth in retail
will be sustainable for the next few years on a small base.
Disproportionate Future
Retail has driven the financial transformation over the past 3 years and this segment (currently 46% of revenue) will continue to grow
faster than the other 2 segments, which will help Shankara sustain its recent transformation. As the share of retail revenue continues to
rise, we anticipate meaningful change in margins and return ratios in the future.
Business Strategy &
Planned Initiatives
Shankara’s core focus will remain on the retail segment, wherein the company is planning 20 store openings p.a. for the next few years.
Existing stores are being simultaneously upgraded with new higher-margin products.
Near Term Visibility
Near-term visibility remains strong as SSG and new store addition should significantly aid top line in retail. With only 114 stores across
South India, near-term growth should not be a concern.
Long Term Visibility
Although the company has not outlined long-term plans or targets, Shankara’s retail model is definitely scalable in the long term.
Source: Edelweiss Investment Research
Shankara Building Products Ltd.
5 GWM/Edelweiss Investment Research
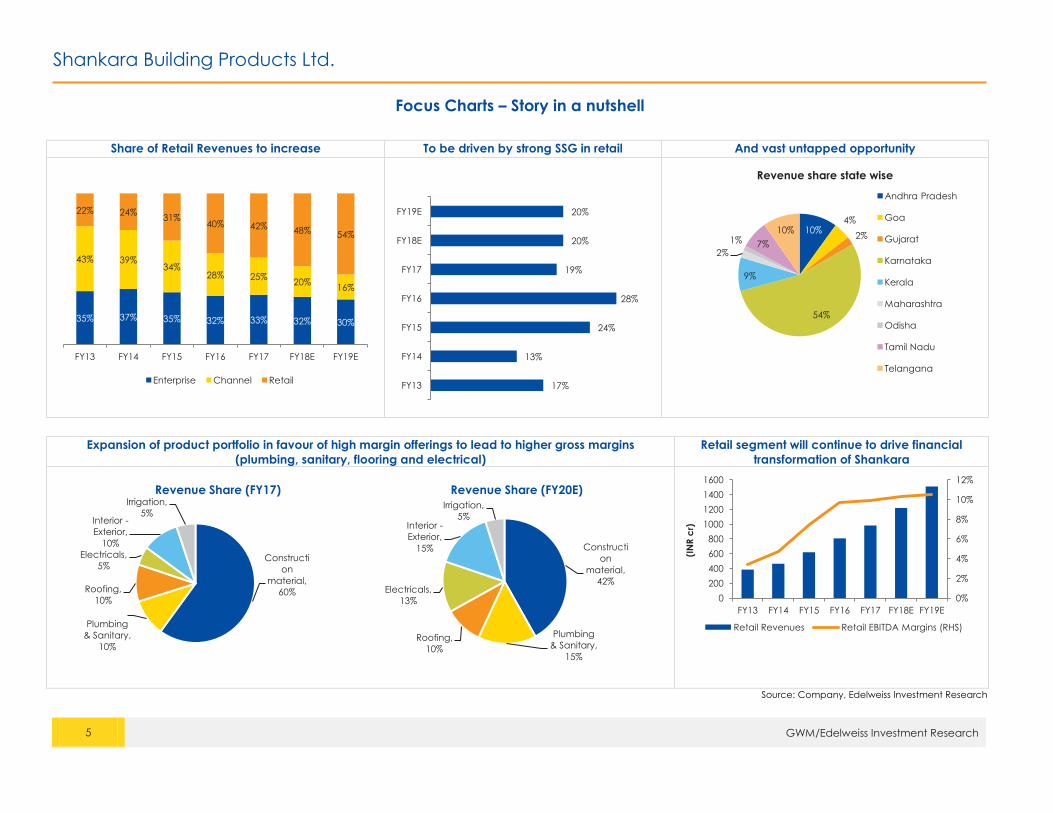
Focus Charts – Story in a nutshell
Share of Retail Revenues to increase To be driven by strong SSG in retail And vast untapped opportunity
Expansion of product portfolio in favour of high margin offerings to lead to higher gross margins
(plumbing, sanitary, flooring and electrical)
Retail segment will continue to drive financial
transformation of Shankara
Source: Company, Edelweiss Investment Research
35% 37% 35% 32% 33% 32% 30%
43% 39% 34%
28% 25% 20%
16%
22% 24% 31%
40% 42% 48% 54%
FY13 FY14 FY15 FY16 FY17 FY18E FY19E
Enterprise Channel Retail 17%
13%
24%
28%
19%
20%
20%
FY13
FY14
FY15
FY16
FY17
FY18E
FY19E
10% 4%
2%
54%
9%
2%
1% 7%
10%
Revenue share state wise
Andhra Pradesh
Goa
Gujarat
Karnataka
Kerala
Maharashtra
Odisha
Tamil Nadu
Telangana
Constructi
on
material,
60%
Plumbing
& Sanitary,
10%
Roofing,
10%
Electricals,
5%
Interior -
Exterior,
10%
Irrigation,
5%
Revenue Share (FY17)
Constructi
on
material,
42%
Plumbing
& Sanitary,
15%
Roofing,
10%
Electricals,
13%
Interior -
Exterior,
15%
Irrigation,
5%
Revenue Share (FY20E)
0%
2%
4%
6%
8%
10%
12%
0
200
400
600
800
1000
1200
1400
1600
FY13 FY14 FY15 FY16 FY17 FY18E FY19E
(IN
R c
r)
Retail Revenues Retail EBITDA Margins (RHS)
Shankara Building Products Ltd.
6 GWM/Edelweiss Investment Research
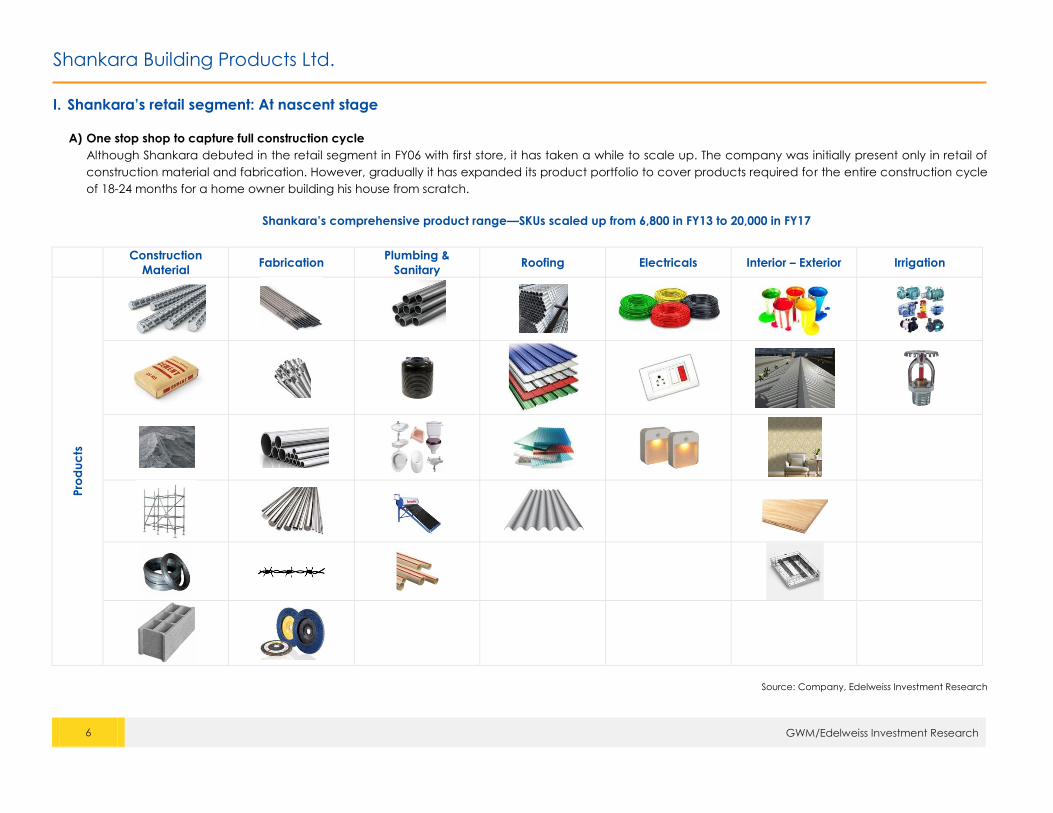
I. Shankara’s retail segment: At nascent stage
A) One stop shop to capture full construction cycle
Although Shankara debuted in the retail segment in FY06 with first store, it has taken a while to scale up. The company was initially present only in retail of
construction material and fabrication. However, gradually it has expanded its product portfolio to cover products required for the entire construction cycle
of 18-24 months for a home owner building his house from scratch.
Shankara’s comprehensive product range—SKUs scaled up from 6,800 in FY13 to 20,000 in FY17
Construction
Material Fabrication
Plumbing &
Sanitary Roofing Electricals Interior – Exterior Irrigation
Pro
du
cts
Source: Company, Edelweiss Investment Research
Shankara Building Products Ltd.
7 GWM/Edelweiss Investment Research
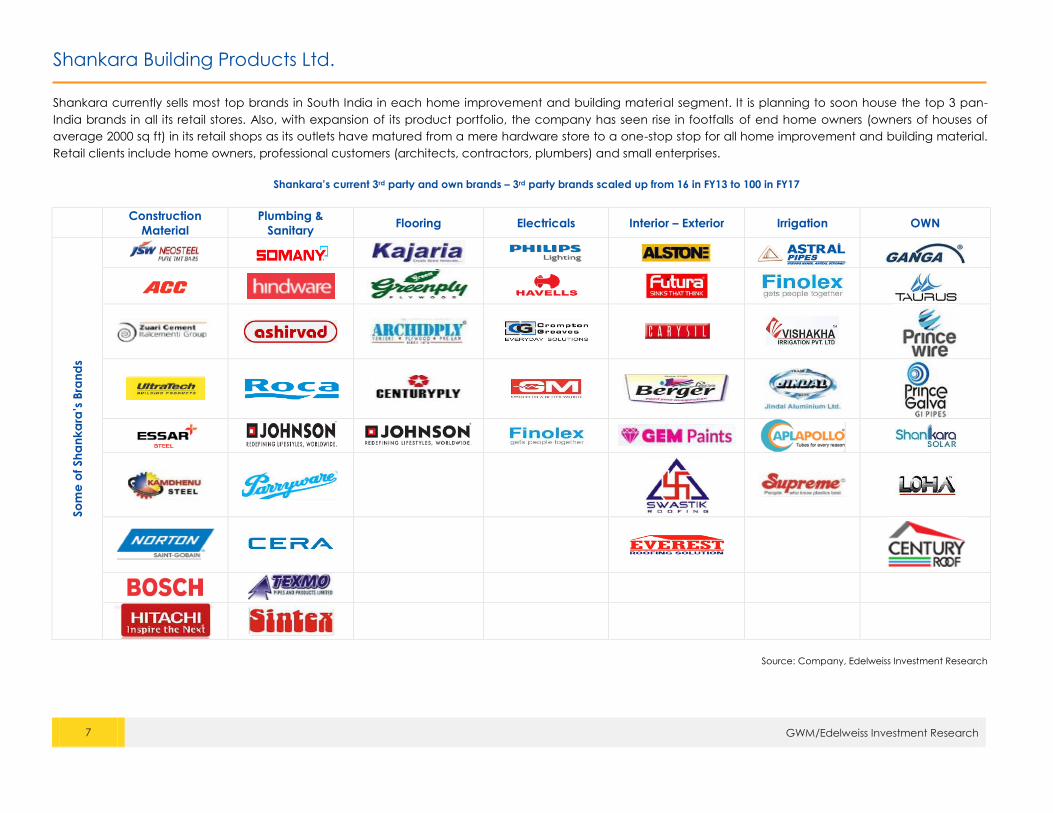
Shankara currently sells most top brands in South India in each home improvement and building material segment. It is planning to soon house the top 3 pan-
India brands in all its retail stores. Also, with expansion of its product portfolio, the company has seen rise in footfalls of end home owners (owners of houses of
average 2000 sq ft) in its retail shops as its outlets have matured from a mere hardware store to a one-stop stop for all home improvement and building material.
Retail clients include home owners, professional customers (architects, contractors, plumbers) and small enterprises.
Shankara’s current 3rd party and own brands – 3rd party brands scaled up from 16 in FY13 to 100 in FY17
Construction
Material
Plumbing &
Sanitary Flooring Electricals Interior – Exterior Irrigation OWN
So
me
of Sh
an
ka
ra’s
Bra
nd
s
Source: Company, Edelweiss Investment Research
Shankara Building Products Ltd.
8 GWM/Edelweiss Investment Research
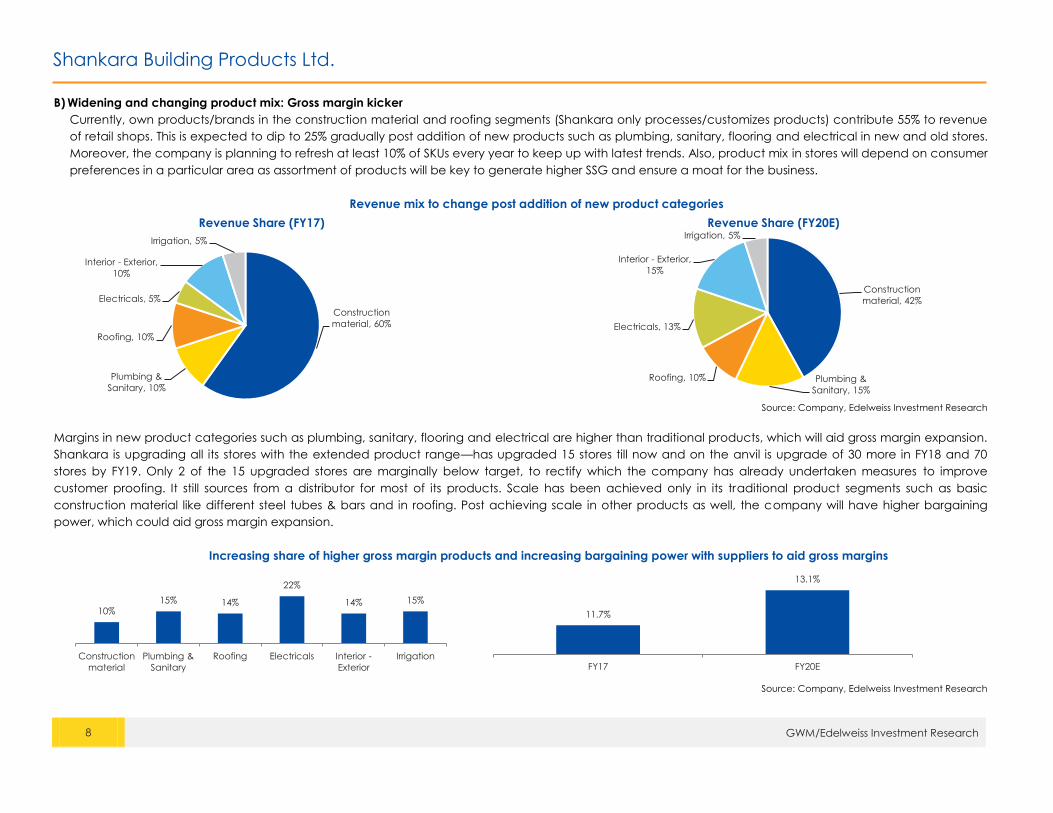
B) Widening and changing product mix: Gross margin kicker
Currently, own products/brands in the construction material and roofing segments (Shankara only processes/customizes products) contribute 55% to revenue
of retail shops. This is expected to dip to 25% gradually post addition of new products such as plumbing, sanitary, flooring and electrical in new and old stores.
Moreover, the company is planning to refresh at least 10% of SKUs every year to keep up with latest trends. Also, product mix in stores will depend on consumer
preferences in a particular area as assortment of products will be key to generate higher SSG and ensure a moat for the business.
Revenue mix to change post addition of new product categories
Source: Company, Edelweiss Investment Research
Margins in new product categories such as plumbing, sanitary, flooring and electrical are higher than traditional products, which will aid gross margin expansion.
Shankara is upgrading all its stores with the extended product range—has upgraded 15 stores till now and on the anvil is upgrade of 30 more in FY18 and 70
stores by FY19. Only 2 of the 15 upgraded stores are marginally below target, to rectify which the company has already undertaken measures to improve
customer proofing. It still sources from a distributor for most of its products. Scale has been achieved only in its traditional product segments such as basic
construction material like different steel tubes & bars and in roofing. Post achieving scale in other products as well, the company will have higher bargaining
power, which could aid gross margin expansion.
Increasing share of higher gross margin products and increasing bargaining power with suppliers to aid gross margins
Source: Company, Edelweiss Investment Research
Construction
material, 60%
Plumbing &
Sanitary, 10%
Roofing, 10%
Electricals, 5%
Interior - Exterior,
10%
Irrigation, 5%
Revenue Share (FY17)
Construction
material, 42%
Plumbing &
Sanitary, 15%
Roofing, 10%
Electricals, 13%
Interior - Exterior,
15%
Irrigation, 5%
Revenue Share (FY20E)
10% 15% 14%
22%
14% 15%
Construction
material
Plumbing &
Sanitary
Roofing Electricals Interior -
Exterior
Irrigation
11.7%
13.1%
FY17 FY20E
Shankara Building Products Ltd.
9 GWM/Edelweiss Investment Research
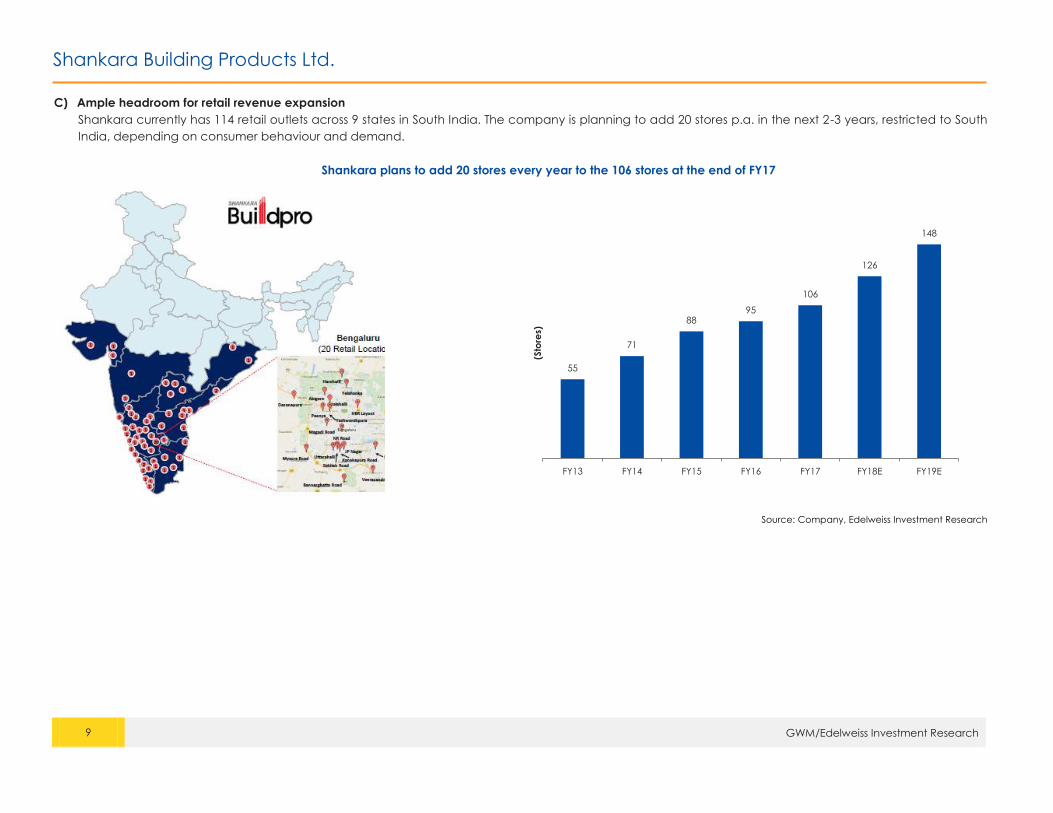
C) Ample headroom for retail revenue expansion
Shankara currently has 114 retail outlets across 9 states in South India. The company is planning to add 20 stores p.a. in the next 2-3 years, restricted to South
India, depending on consumer behaviour and demand.
Shankara plans to add 20 stores every year to the 106 stores at the end of FY17
Source: Company, Edelweiss Investment Research
55
71
88 95
106
126
148
FY13 FY14 FY15 FY16 FY17 FY18E FY19E
(Sto
res)
Shankara Building Products Ltd.
10 GWM/Edelweiss Investment Research
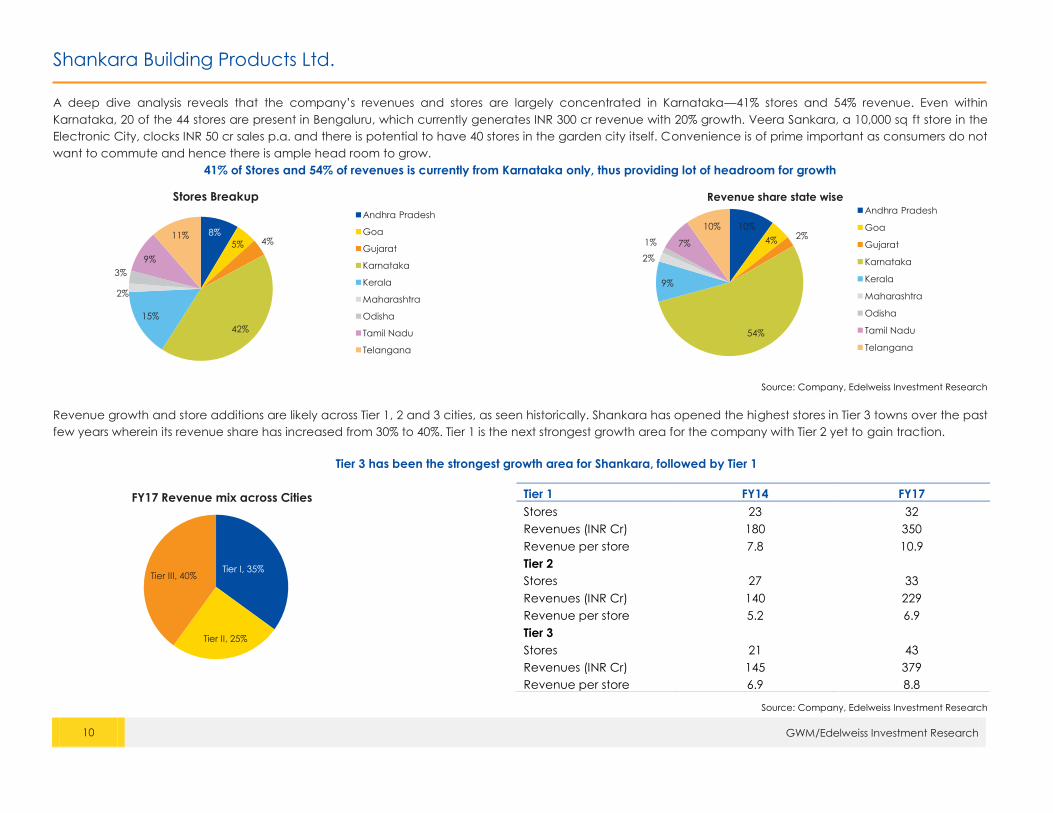
A deep dive analysis reveals that the company’s revenues and stores are largely concentrated in Karnataka—41% stores and 54% revenue. Even within
Karnataka, 20 of the 44 stores are present in Bengaluru, which currently generates INR 300 cr revenue with 20% growth. Veera Sankara, a 10,000 sq ft store in the
Electronic City, clocks INR 50 cr sales p.a. and there is potential to have 40 stores in the garden city itself. Convenience is of prime important as consumers do not
want to commute and hence there is ample head room to grow. 41% of Stores and 54% of revenues is currently from Karnataka only, thus providing lot of headroom for growth
Source: Company, Edelweiss Investment Research
Revenue growth and store additions are likely across Tier 1, 2 and 3 cities, as seen historically. Shankara has opened the highest stores in Tier 3 towns over the past
few years wherein its revenue share has increased from 30% to 40%. Tier 1 is the next strongest growth area for the company with Tier 2 yet to gain traction.
Tier 3 has been the strongest growth area for Shankara, followed by Tier 1
Source: Company, Edelweiss Investment Research
8%
5% 4%
42%
15%
2%
3%
9%
11%
Stores Breakup
Andhra Pradesh
Goa
Gujarat
Karnataka
Kerala
Maharashtra
Odisha
Tamil Nadu
Telangana
10%
4% 2%
54%
9%
2%
1% 7%
10%
Revenue share state wise Andhra Pradesh
Goa
Gujarat
Karnataka
Kerala
Maharashtra
Odisha
Tamil Nadu
Telangana
Tier I, 35%
Tier II, 25%
Tier III, 40%
FY17 Revenue mix across Cities Tier 1 FY14 FY17
Stores 23 32
Revenues (INR Cr) 180 350
Revenue per store 7.8 10.9
Tier 2
Stores 27 33
Revenues (INR Cr) 140 229
Revenue per store 5.2 6.9
Tier 3
Stores 21 43
Revenues (INR Cr) 145 379
Revenue per store 6.9 8.8
Shankara Building Products Ltd.
11 GWM/Edelweiss Investment Research
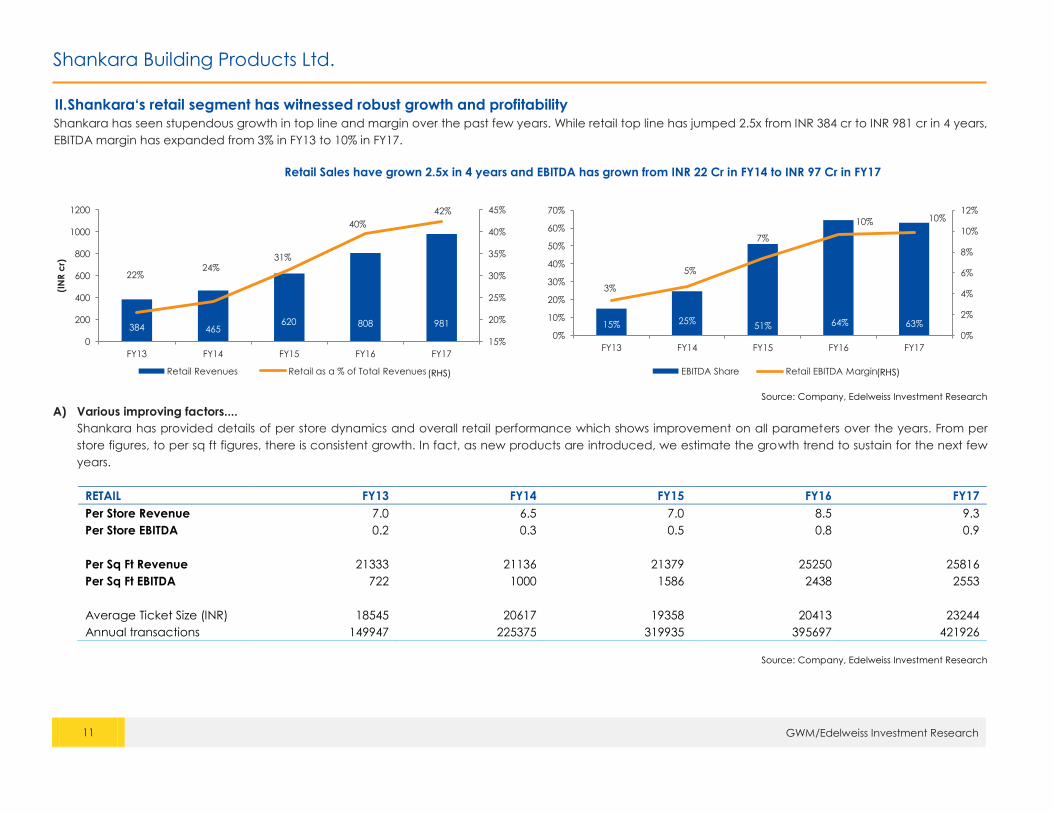
II. Shankara‘s retail segment has witnessed robust growth and profitability
Shankara has seen stupendous growth in top line and margin over the past few years. While retail top line has jumped 2.5x from INR 384 cr to INR 981 cr in 4 years,
EBITDA margin has expanded from 3% in FY13 to 10% in FY17.
Retail Sales have grown 2.5x in 4 years and EBITDA has grown from INR 22 Cr in FY14 to INR 97 Cr in FY17
Source: Company, Edelweiss Investment Research
A) Various improving factors....
Shankara has provided details of per store dynamics and overall retail performance which shows improvement on all parameters over the years. From per
store figures, to per sq ft figures, there is consistent growth. In fact, as new products are introduced, we estimate the growth trend to sustain for the next few
years.
RETAIL FY13 FY14 FY15 FY16 FY17
Per Store Revenue 7.0 6.5 7.0 8.5 9.3
Per Store EBITDA 0.2 0.3 0.5 0.8 0.9
Per Sq Ft Revenue 21333 21136 21379 25250 25816
Per Sq Ft EBITDA 722 1000 1586 2438 2553
Average Ticket Size (INR) 18545 20617 19358 20413 23244
Annual transactions 149947 225375 319935 395697 421926
Source: Company, Edelweiss Investment Research
384 465 620 808 981
22% 24%
31%
40%
42%
15%
20%
25%
30%
35%
40%
45%
0
200
400
600
800
1000
1200
FY13 FY14 FY15 FY16 FY17
(IN
R c
r)
Retail Revenues Retail as a % of Total Revenues
15% 25% 51% 64% 63%
3%
5%
7%
10% 10%
0%
2%
4%
6%
8%
10%
12%
0%
10%
20%
30%
40%
50%
60%
70%
FY13 FY14 FY15 FY16 FY17
EBITDA Share Retail EBITDA Margin (RHS) (RHS)
Shankara Building Products Ltd.
12 GWM/Edelweiss Investment Research
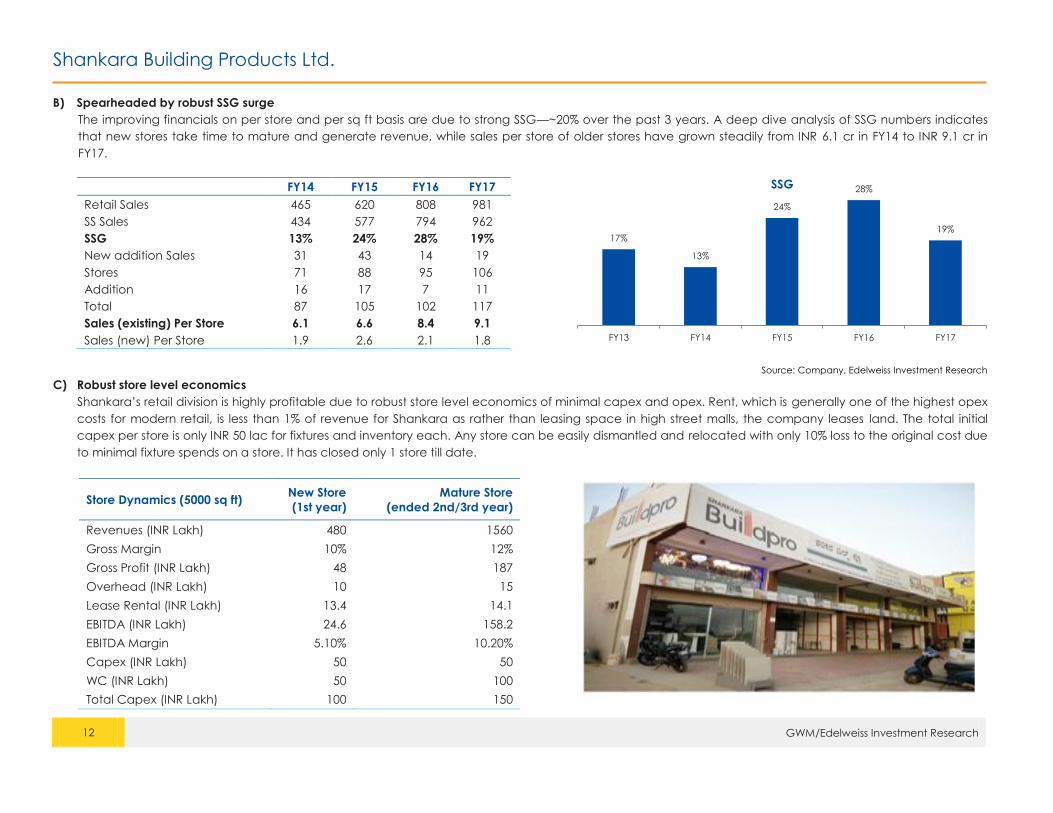
B) Spearheaded by robust SSG surge
The improving financials on per store and per sq ft basis are due to strong SSG—~20% over the past 3 years. A deep dive analysis of SSG numbers indicates
that new stores take time to mature and generate revenue, while sales per store of older stores have grown steadily from INR 6.1 cr in FY14 to INR 9.1 cr in
FY17.
FY14 FY15 FY16 FY17
Retail Sales 465 620 808 981
SS Sales 434 577 794 962
SSG 13% 24% 28% 19%
New addition Sales 31 43 14 19
Stores 71 88 95 106
Addition 16 17 7 11
Total 87 105 102 117
Sales (existing) Per Store 6.1 6.6 8.4 9.1
Sales (new) Per Store 1.9 2.6 2.1 1.8
Source: Company, Edelweiss Investment Research
C) Robust store level economics
Shankara’s retail division is highly profitable due to robust store level economics of minimal capex and opex. Rent, which is generally one of the highest opex
costs for modern retail, is less than 1% of revenue for Shankara as rather than leasing space in high street malls, the company leases land. The total initial
capex per store is only INR 50 lac for fixtures and inventory each. Any store can be easily dismantled and relocated with only 10% loss to the original cost due
to minimal fixture spends on a store. It has closed only 1 store till date.
Store Dynamics (5000 sq ft) New Store
(1st year)
Mature Store
(ended 2nd/3rd year)
Revenues (INR Lakh) 480 1560
Gross Margin 10% 12%
Gross Profit (INR Lakh) 48 187
Overhead (INR Lakh) 10 15
Lease Rental (INR Lakh) 13.4 14.1
EBITDA (INR Lakh) 24.6 158.2
EBITDA Margin 5.10% 10.20%
Capex (INR Lakh) 50 50
WC (INR Lakh) 50 100
Total Capex (INR Lakh) 100 150
17%
13%
24%
28%
19%
FY13 FY14 FY15 FY16 FY17
SSG
Shankara Building Products Ltd.
13 GWM/Edelweiss Investment Research
III. Industry Overview: Big opportunity size with macro tailwinds and no formal competition
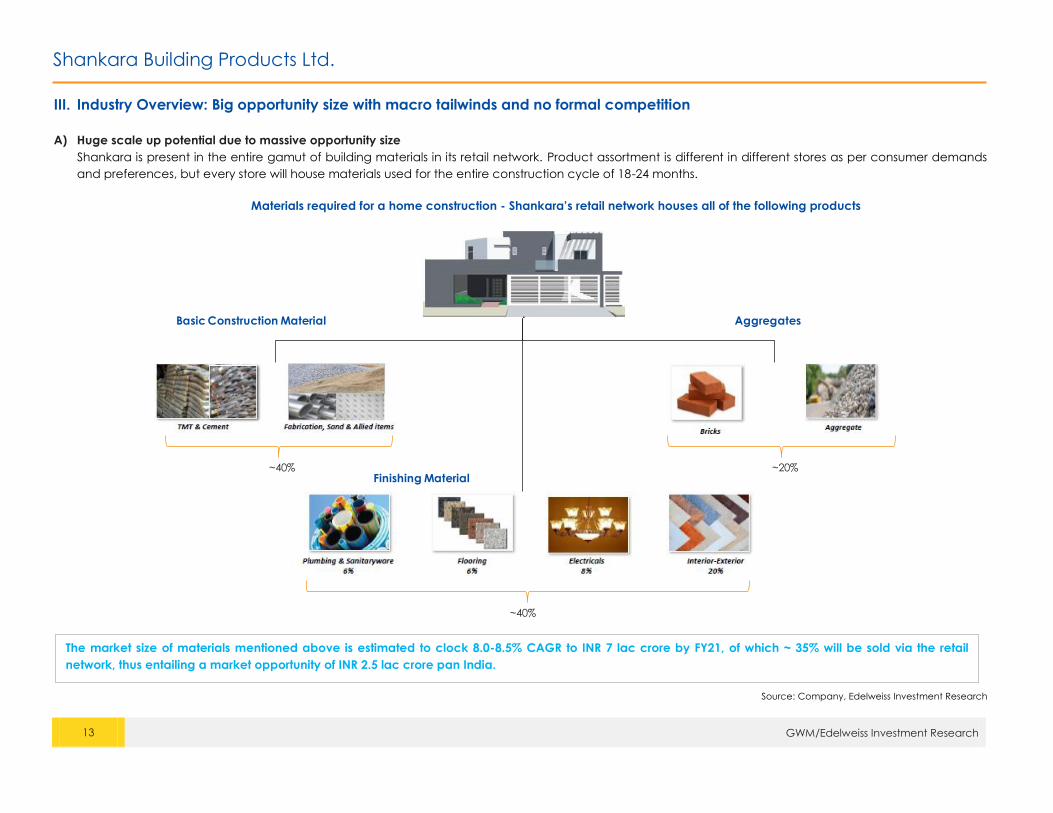
A) Huge scale up potential due to massive opportunity size
Shankara is present in the entire gamut of building materials in its retail network. Product assortment is different in different stores as per consumer demands
and preferences, but every store will house materials used for the entire construction cycle of 18-24 months.
Materials required for a home construction - Shankara’s retail network houses all of the following products
Source: Company, Edelweiss Investment Research
Basic Construction Material Aggregates
Finishing Material~40% ~20%
~40%
The market size of materials mentioned above is estimated to clock 8.0-8.5% CAGR to INR 7 lac crore by FY21, of which ~ 35% will be sold via the retail
network, thus entailing a market opportunity of INR 2.5 lac crore pan India.
Shankara Building Products Ltd.
14 GWM/Edelweiss Investment Research
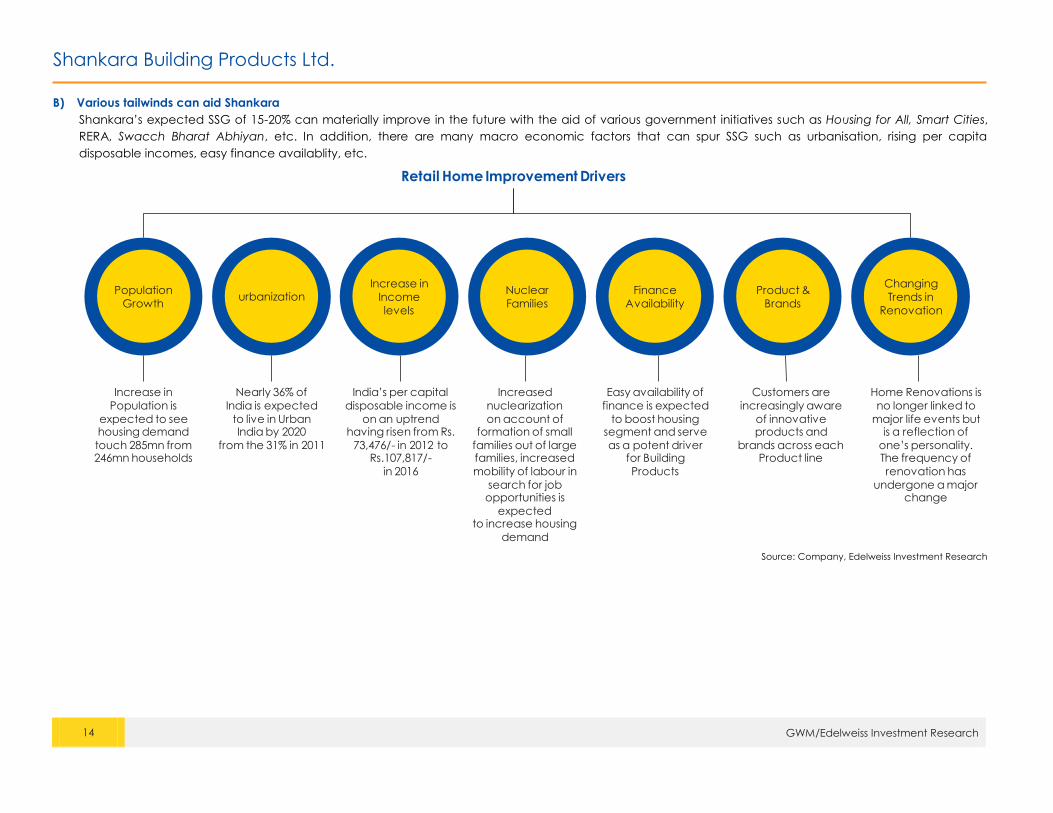
B) Various tailwinds can aid Shankara
Shankara’s expected SSG of 15-20% can materially improve in the future with the aid of various government initiatives such as Housing for All, Smart Cities,
RERA, Swacch Bharat Abhiyan, etc. In addition, there are many macro economic factors that can spur SSG such as urbanisation, rising per capita
disposable incomes, easy finance availablity, etc.
Source: Company, Edelweiss Investment Research
Population
Growthurbanization
Increase in
Income
levels
Nuclear
Families
Finance
Availability
Product &
Brands
Changing
Trends in
Renovation
Retail Home Improvement Drivers
Increase in
Population is
expected to seehousing demand
touch 285mn from246mn households
Nearly 36% of
India is expected
to live in UrbanIndia by 2020
from the 31% in 2011
India’s per capital
disposable income is
on an uptrend having risen from Rs.
73,476/- in 2012 to Rs.107,817/-
in 2016
Increased
nuclearization
on account of formation of small
families out of large families, increased
mobility of labour in
search for job opportunities is
expectedto increase housing
demand
Easy availability of
finance is expected
to boost housingsegment and serve
as a potent driverfor Building
Products
Customers are
increasingly aware
of innovative products and
brands across eachProduct line
Home Renovations is
no longer linked to
major life events but is a reflection of
one’s personality. The frequency of
renovation has
undergone a majorchange
Shankara Building Products Ltd.
15 GWM/Edelweiss Investment Research
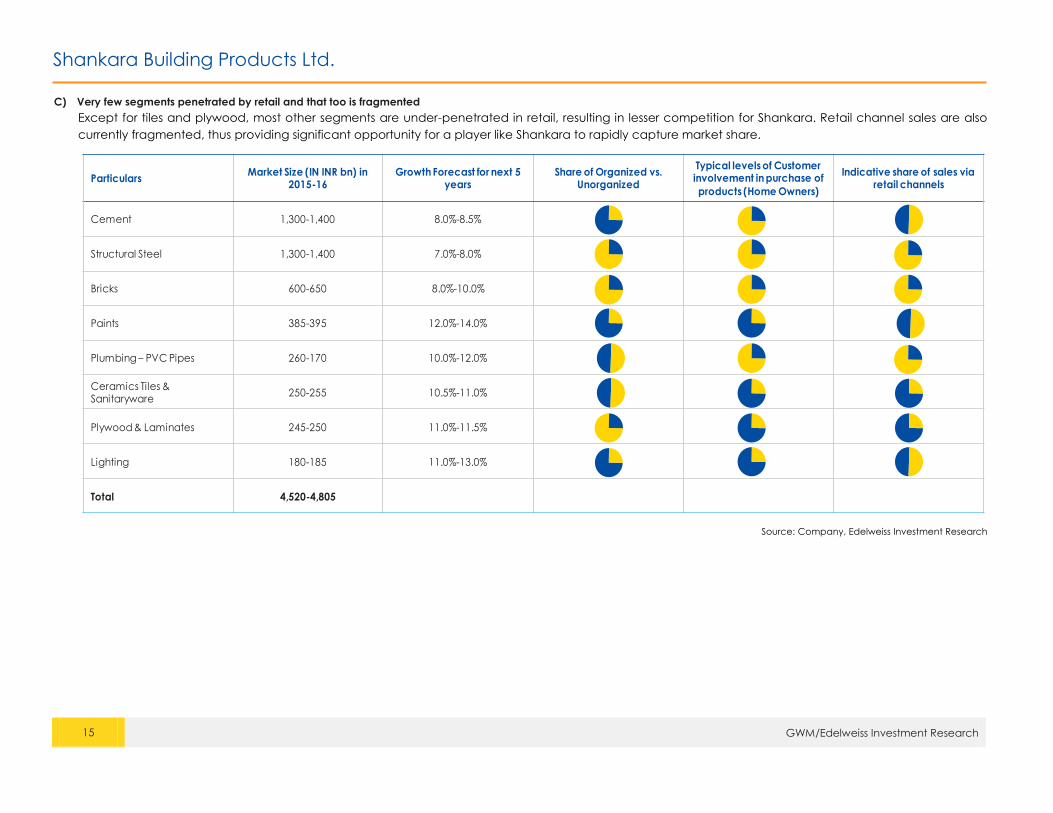
C) Very few segments penetrated by retail and that too is fragmented
Except for tiles and plywood, most other segments are under-penetrated in retail, resulting in lesser competition for Shankara. Retail channel sales are also
currently fragmented, thus providing significant opportunity for a player like Shankara to rapidly capture market share.
Source: Company, Edelweiss Investment Research
ParticularsMarket Size (IN INR bn) in
2015-16Growth Forecast for next 5
yearsShare of Organized vs.
Unorganized
Typical levels of Customer involvement in purchase of
products (Home Owners)
Indicative share of sales via retail channels
Cement 1,300-1,400 8.0%-8.5%
Structural Steel 1,300-1,400 7.0%-8.0%
Bricks 600-650 8.0%-10.0%
Paints 385-395 12.0%-14.0%
Plumbing – PVC Pipes 260-170 10.0%-12.0%
Ceramics Tiles & Sanitaryware
250-255 10.5%-11.0%
Plywood & Laminates 245-250 11.0%-11.5%
Lighting 180-185 11.0%-13.0%
Total 4,520-4,805
Shankara Building Products Ltd.
16 GWM/Edelweiss Investment Research
IV. Processing facilities contribute ~50% of retail sales and cater to the enterprise segment
Facilities give presence across value chain alongwith strong vendor network and association with brands which helps in retail
Shankara has 12 backward integrated processing facilities with an installed capacity of ~3,25,000 TPA operating at 94% capacity utilization over the past few
years. In these facilities, he company assembles and processes steel pipes, colour coated roofing sheets, bright rods, galvanized strips and cold rolled strips. It sells
these products under its own brands like Century Roof, Ganga, Loha, Taurus and Prince Galva. These products contribute 50% to sales via the retail segment.
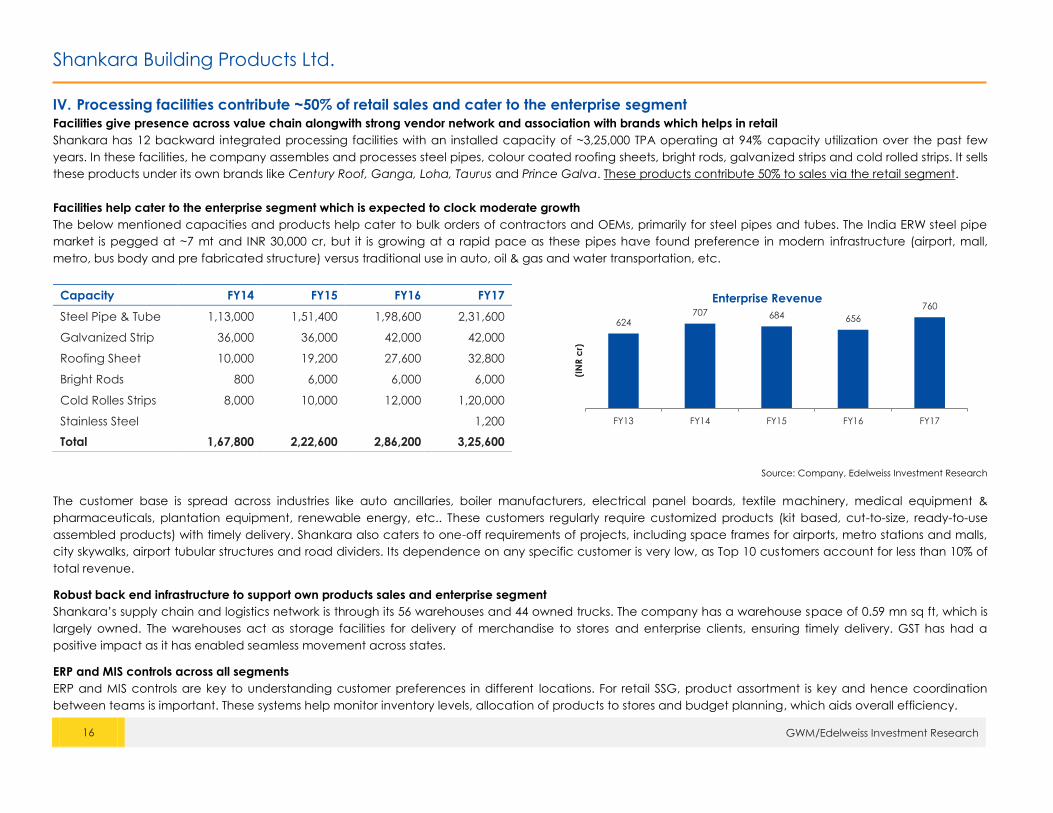
Facilities help cater to the enterprise segment which is expected to clock moderate growth
The below mentioned capacities and products help cater to bulk orders of contractors and OEMs, primarily for steel pipes and tubes. The India ERW steel pipe
market is pegged at ~7 mt and INR 30,000 cr, but it is growing at a rapid pace as these pipes have found preference in modern infrastructure (airport, mall,
metro, bus body and pre fabricated structure) versus traditional use in auto, oil & gas and water transportation, etc.
Capacity FY14 FY15 FY16 FY17
Steel Pipe & Tube 1,13,000 1,51,400 1,98,600 2,31,600
Galvanized Strip 36,000 36,000 42,000 42,000
Roofing Sheet 10,000 19,200 27,600 32,800
Bright Rods 800 6,000 6,000 6,000
Cold Rolles Strips 8,000 10,000 12,000 1,20,000
Stainless Steel
1,200
Total 1,67,800 2,22,600 2,86,200 3,25,600
Source: Company, Edelweiss Investment Research
The customer base is spread across industries like auto ancillaries, boiler manufacturers, electrical panel boards, textile machinery, medical equipment &
pharmaceuticals, plantation equipment, renewable energy, etc.. These customers regularly require customized products (kit based, cut-to-size, ready-to-use
assembled products) with timely delivery. Shankara also caters to one-off requirements of projects, including space frames for airports, metro stations and malls,
city skywalks, airport tubular structures and road dividers. Its dependence on any specific customer is very low, as Top 10 customers account for less than 10% of
total revenue.
Robust back end infrastructure to support own products sales and enterprise segment
Shankara’s supply chain and logistics network is through its 56 warehouses and 44 owned trucks. The company has a warehouse space of 0.59 mn sq ft, which is
largely owned. The warehouses act as storage facilities for delivery of merchandise to stores and enterprise clients, ensuring timely delivery. GST has had a
positive impact as it has enabled seamless movement across states.
ERP and MIS controls across all segments
ERP and MIS controls are key to understanding customer preferences in different locations. For retail SSG, product assortment is key and hence coordination
between teams is important. These systems help monitor inventory levels, allocation of products to stores and budget planning, which aids overall efficiency.
624 707 684 656
760
FY13 FY14 FY15 FY16 FY17
(IN
R c
r)
Enterprise Revenue
Shankara Building Products Ltd.
17 GWM/Edelweiss Investment Research
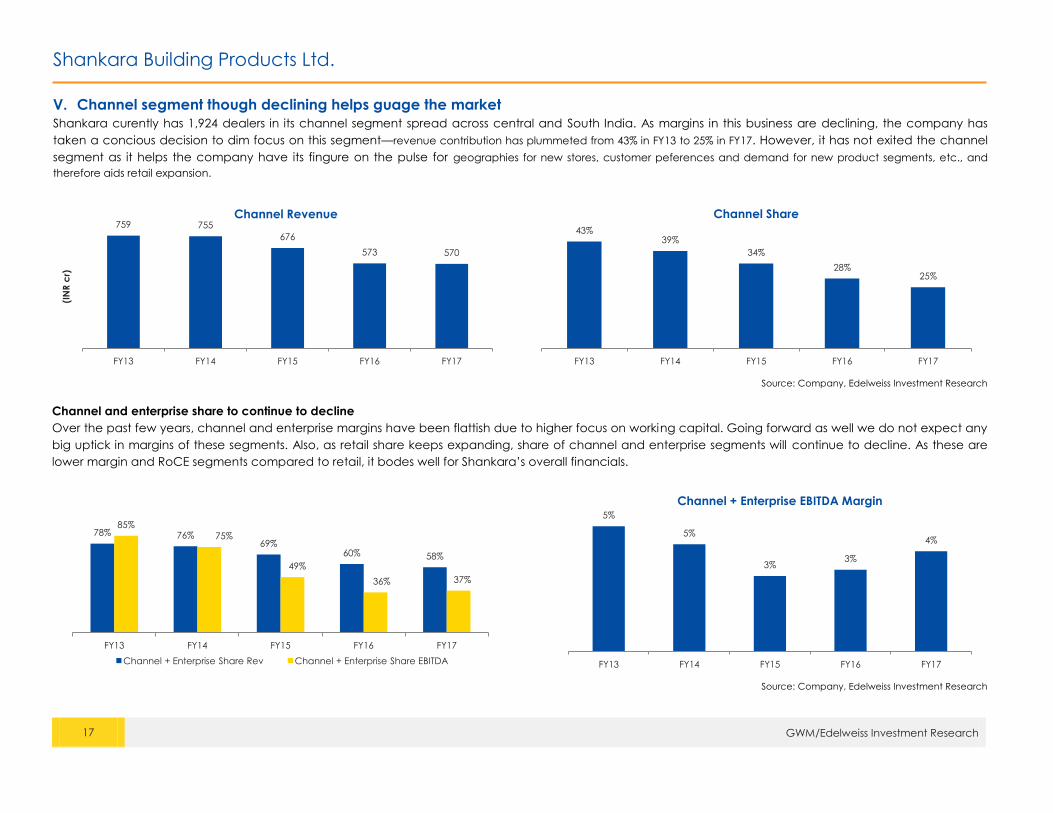
V. Channel segment though declining helps guage the market
Shankara curently has 1,924 dealers in its channel segment spread across central and South India. As margins in this business are declining, the company has
taken a concious decision to dim focus on this segment—revenue contribution has plummeted from 43% in FY13 to 25% in FY17. However, it has not exited the channel
segment as it helps the company have its fingure on the pulse for geographies for new stores, customer peferences and demand for new product segments, etc., and
therefore aids retail expansion.
Source: Company, Edelweiss Investment Research
Channel and enterprise share to continue to decline
Over the past few years, channel and enterprise margins have been flattish due to higher focus on working capital. Going forward as well we do not expect any
big uptick in margins of these segments. Also, as retail share keeps expanding, share of channel and enterprise segments will continue to decline. As these are
lower margin and RoCE segments compared to retail, it bodes well for Shankara’s overall financials.
Source: Company, Edelweiss Investment Research
759 755
676
573 570
FY13 FY14 FY15 FY16 FY17
(IN
R c
r)
Channel Revenue
43% 39%
34%
28% 25%
FY13 FY14 FY15 FY16 FY17
Channel Share
78% 76% 69%
60% 58%
85%
75%
49%
36% 37%
FY13 FY14 FY15 FY16 FY17
Channel + Enterprise Share Rev Channel + Enterprise Share EBITDA
5%
5%
3% 3%
4%
FY13 FY14 FY15 FY16 FY17
Channel + Enterprise EBITDA Margin
Shankara Building Products Ltd.
18 GWM/Edelweiss Investment Research
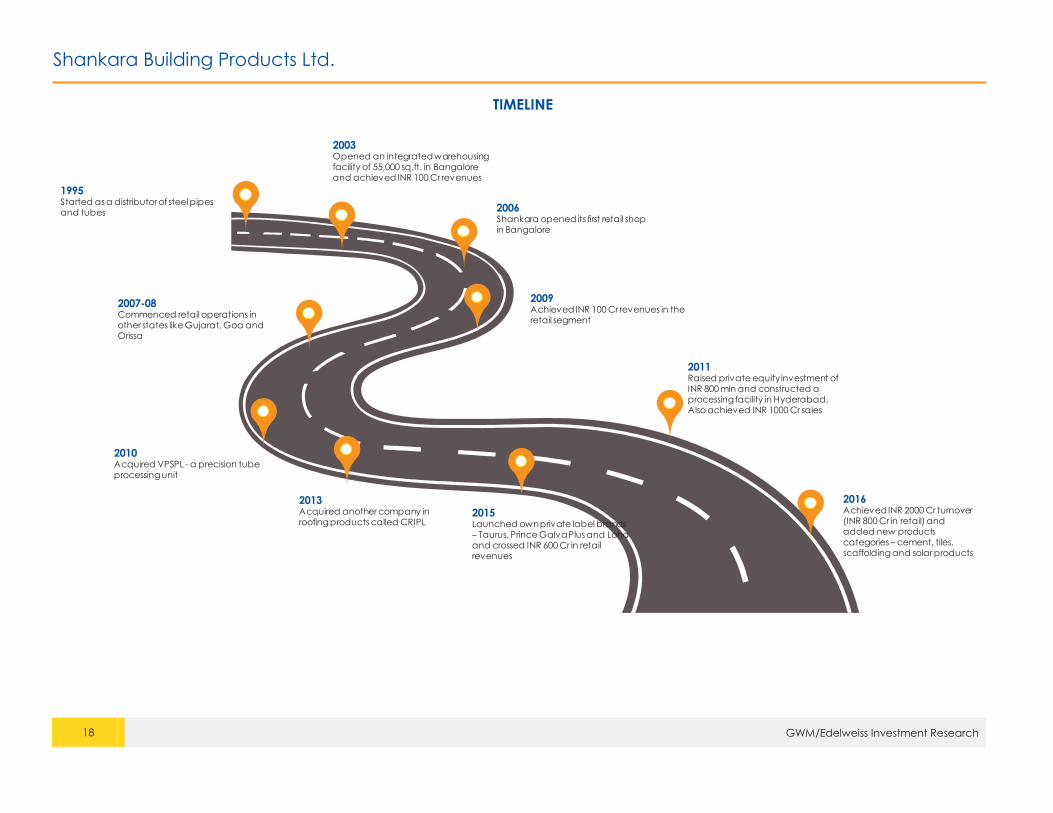
TIMELINE
1995Started as a distributor of steel pipes and tubes
2003Opened an integrated warehousing facility of 55,000 sq.ft. in Bangalore and achieved INR 100 Cr revenues
2006Shankara opened its first retail shop in Bangalore
2007-08 Commenced retail operations in other states like Gujarat, Goa and Orissa
2010Acquired VPSPL - a precision tube processing unit
2009Achieved INR 100 Cr revenues in the retail segment
2013Acquired another company in roofing products called CRIPL
2011Raised private equity investment of INR 800 mln and constructed a processing facility in Hyderabad. Also achieved INR 1000 Cr sales
2015Launched own private label brands – Taurus, Prince Galva Plus and Lohaand crossed INR 600 Cr in retail revenues
2016Achieved INR 2000 Cr turnover (INR 800 Cr in retail) and added new products categories – cement, tiles, scaffolding and solar products
Shankara Building Products Ltd.
19 GWM/Edelweiss Investment Research
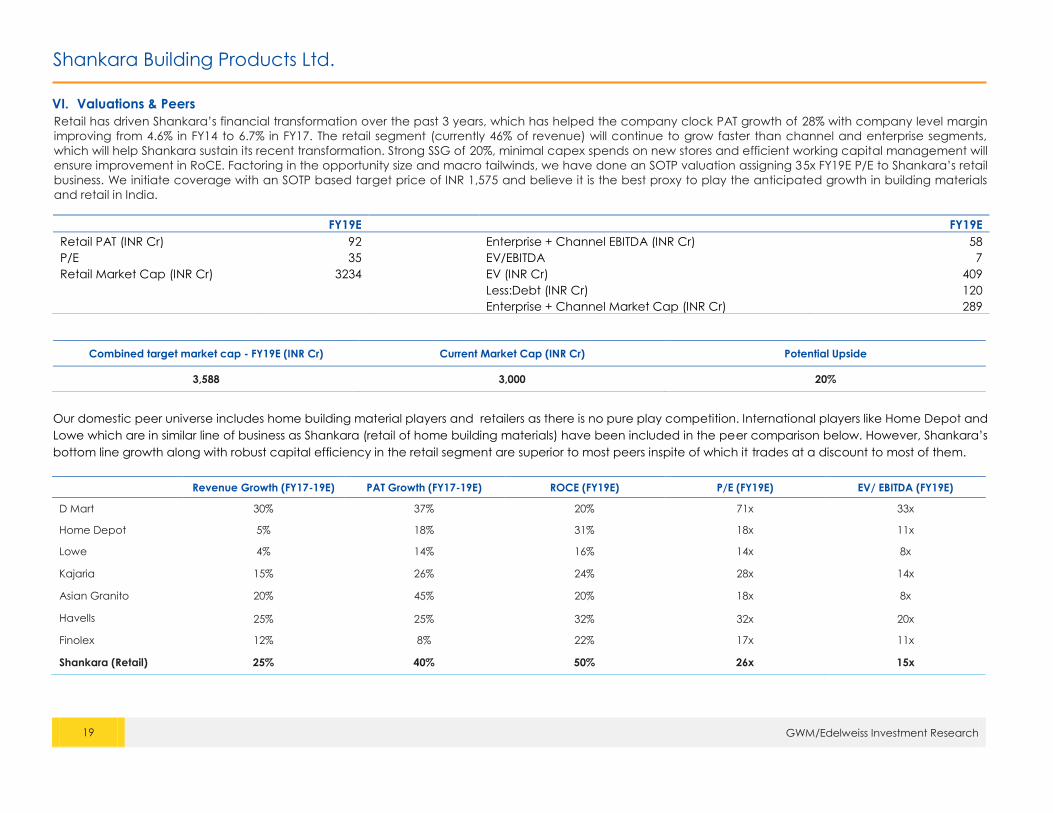
VI. Valuations & Peers
Retail has driven Shankara’s financial transformation over the past 3 years, which has helped the company clock PAT growth of 28% with company level margin
improving from 4.6% in FY14 to 6.7% in FY17. The retail segment (currently 46% of revenue) will continue to grow faster than channel and enterprise segments,
which will help Shankara sustain its recent transformation. Strong SSG of 20%, minimal capex spends on new stores and efficient working capital management will
ensure improvement in RoCE. Factoring in the opportunity size and macro tailwinds, we have done an SOTP valuation assigning 35x FY19E P/E to Shankara’s retail
business. We initiate coverage with an SOTP based target price of INR 1,575 and believe it is the best proxy to play the anticipated growth in building materials
and retail in India.
FY19E
FY19E
Retail PAT (INR Cr) 92
Enterprise + Channel EBITDA (INR Cr) 58
P/E 35
EV/EBITDA 7
Retail Market Cap (INR Cr) 3234
EV (INR Cr) 409
Less:Debt (INR Cr) 120
Enterprise + Channel Market Cap (INR Cr) 289
Combined target market cap - FY19E (INR Cr) Current Market Cap (INR Cr) Potential Upside
3,588 3,000 20%
Our domestic peer universe includes home building material players and retailers as there is no pure play competition. International players like Home Depot and
Lowe which are in similar line of business as Shankara (retail of home building materials) have been included in the peer comparison below. However, Shankara’s
bottom line growth along with robust capital efficiency in the retail segment are superior to most peers inspite of which it trades at a discount to most of them.
Revenue Growth (FY17-19E) PAT Growth (FY17-19E) ROCE (FY19E) P/E (FY19E) EV/ EBITDA (FY19E)
D Mart 30% 37% 20% 71x 33x
Home Depot 5% 18% 31% 18x 11x
Lowe 4% 14% 16% 14x 8x
Kajaria 15% 26% 24% 28x 14x
Asian Granito 20% 45% 20% 18x 8x
Havells 25% 25% 32% 32x 20x
Finolex 12% 8% 22% 17x 11x
Shankara (Retail) 25% 40% 50% 26x 15x
Shankara Building Products Ltd.
20 GWM/Edelweiss Investment Research
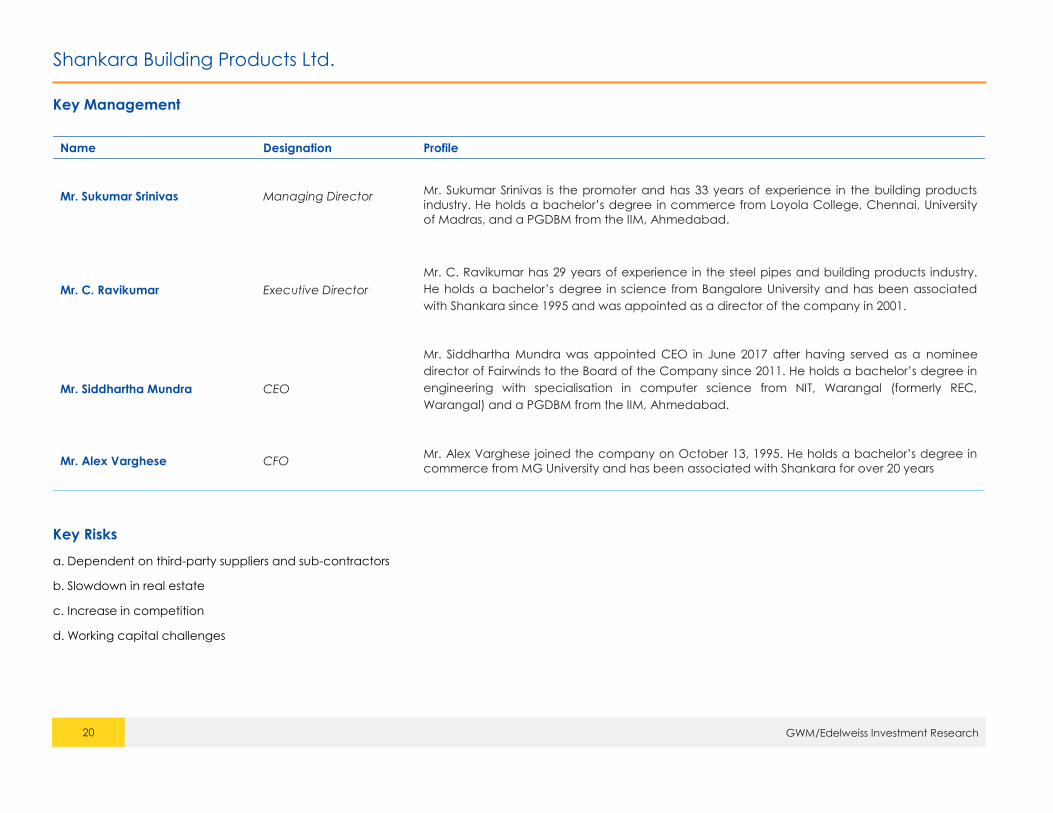
Key Management
Name Designation Profile
Mr. Sukumar Srinivas Managing Director
Mr. Sukumar Srinivas is the promoter and has 33 years of experience in the building products
industry. He holds a bachelor’s degree in commerce from Loyola College, Chennai, University
of Madras, and a PGDBM from the IIM, Ahmedabad.
Mr. C. Ravikumar Executive Director
Mr. C. Ravikumar has 29 years of experience in the steel pipes and building products industry.
He holds a bachelor’s degree in science from Bangalore University and has been associated
with Shankara since 1995 and was appointed as a director of the company in 2001.
Mr. Siddhartha Mundra CEO
Mr. Siddhartha Mundra was appointed CEO in June 2017 after having served as a nominee
director of Fairwinds to the Board of the Company since 2011. He holds a bachelor’s degree in
engineering with specialisation in computer science from NIT, Warangal (formerly REC,
Warangal) and a PGDBM from the IIM, Ahmedabad.
Mr. Alex Varghese CFO Mr. Alex Varghese joined the company on October 13, 1995. He holds a bachelor’s degree in
commerce from MG University and has been associated with Shankara for over 20 years
Key Risks
a. Dependent on third-party suppliers and sub-contractors
b. Slowdown in real estate
c. Increase in competition
d. Working capital challenges
Shankara Building Products Ltd.
21 GWM/Edelweiss Investment Research
Business Overview
Company Brief
Shankara is a leading organised retailer of home improvement and building products with presence across a retail network of 114 stores across 9 states in India.
The company caters to various end-user segments in urban and semi-urban markets through its multi-channel sales approach, processing facilities, supply chain
and logistics capabilities. Apart from providing its own branded products (CenturyRoof, Ganga and Loha), it also offers products of third party brands like
Johnson, Sintex, APL Apollo, Astral Pipes, etc. Shankara also has 12 processing facilities with an installed capacity of 3,24,200 tpa which can be scaled up as per
requirement. To cater to this growing retail network, the company has a strong logistics network comprising 56 warehouses and a fleet of 44 owned trucks to
boost last mile delivery.
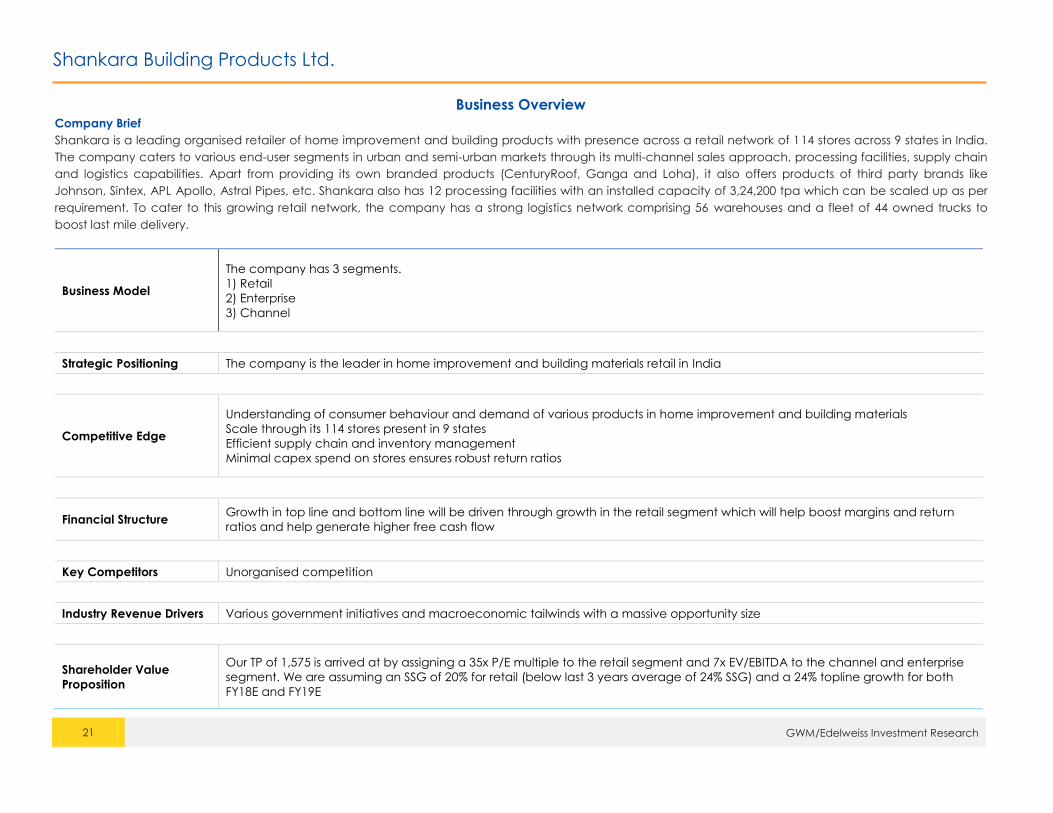
Business Model
The company has 3 segments.
1) Retail
2) Enterprise
3) Channel
Strategic Positioning The company is the leader in home improvement and building materials retail in India
Competitive Edge
Understanding of consumer behaviour and demand of various products in home improvement and building materials
Scale through its 114 stores present in 9 states
Efficient supply chain and inventory management
Minimal capex spend on stores ensures robust return ratios
Financial Structure Growth in top line and bottom line will be driven through growth in the retail segment which will help boost margins and return
ratios and help generate higher free cash flow
Key Competitors Unorganised competition
Industry Revenue Drivers Various government initiatives and macroeconomic tailwinds with a massive opportunity size
Shareholder Value
Proposition
Our TP of 1,575 is arrived at by assigning a 35x P/E multiple to the retail segment and 7x EV/EBITDA to the channel and enterprise
segment. We are assuming an SSG of 20% for retail (below last 3 years average of 24% SSG) and a 24% topline growth for both
FY18E and FY19E
Shankara Building Products Ltd.
22 GWM/Edelweiss Investment Research
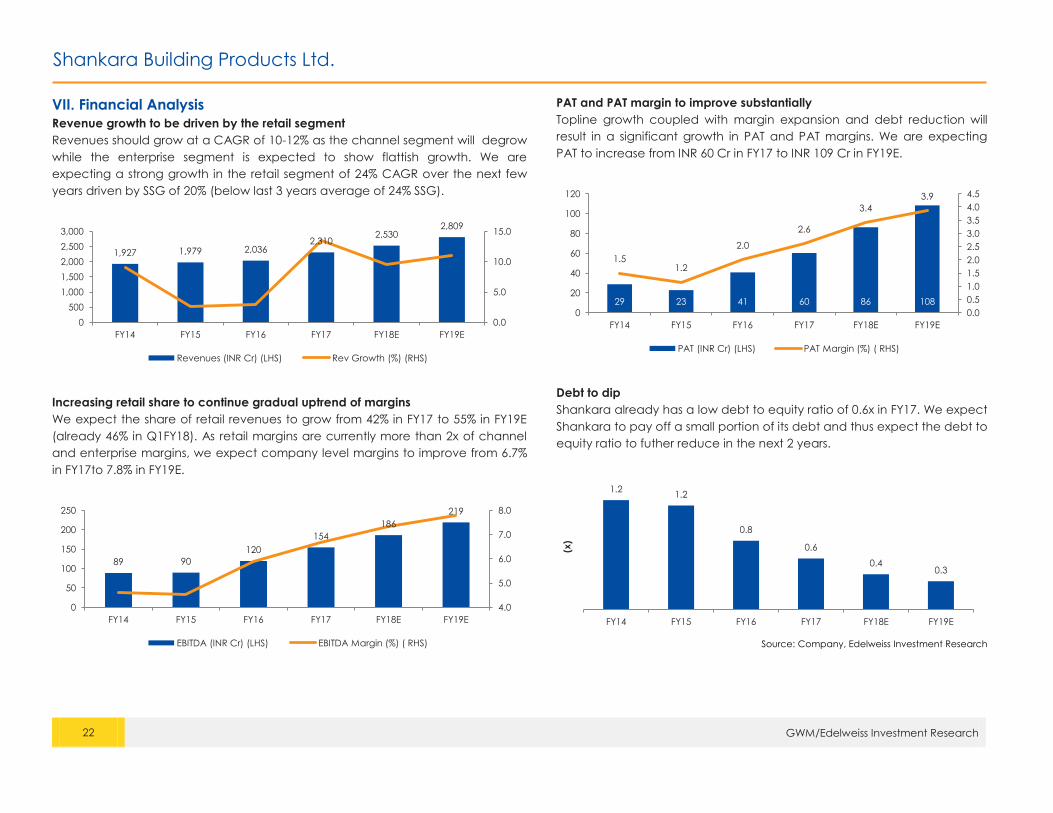
VII. Financial Analysis
Revenue growth to be driven by the retail segment
Revenues should grow at a CAGR of 10-12% as the channel segment will degrow
while the enterprise segment is expected to show flattish growth. We are
expecting a strong growth in the retail segment of 24% CAGR over the next few
years driven by SSG of 20% (below last 3 years average of 24% SSG).
Increasing retail share to continue gradual uptrend of margins
We expect the share of retail revenues to grow from 42% in FY17 to 55% in FY19E
(already 46% in Q1FY18). As retail margins are currently more than 2x of channel
and enterprise margins, we expect company level margins to improve from 6.7%
in FY17to 7.8% in FY19E.
PAT and PAT margin to improve substantially
Topline growth coupled with margin expansion and debt reduction will
result in a significant growth in PAT and PAT margins. We are expecting
PAT to increase from INR 60 Cr in FY17 to INR 109 Cr in FY19E.
Debt to dip
Shankara already has a low debt to equity ratio of 0.6x in FY17. We expect
Shankara to pay off a small portion of its debt and thus expect the debt to
equity ratio to futher reduce in the next 2 years.
Source: Company, Edelweiss Investment Research
1,927 1,979 2,036 2,310
2,530 2,809
0.0
5.0
10.0
15.0
0
500
1,000
1,500
2,000
2,500
3,000
FY14 FY15 FY16 FY17 FY18E FY19E
Revenues (INR Cr) (LHS) Rev Growth (%) (RHS)
89 90
120
154
186
219
4.0
5.0
6.0
7.0
8.0
0
50
100
150
200
250
FY14 FY15 FY16 FY17 FY18E FY19E
EBITDA (INR Cr) (LHS) EBITDA Margin (%) ( RHS)
29 23 41 60 86 108
1.5 1.2
2.0
2.6
3.4
3.9
0.0
0.5
1.0
1.5
2.0
2.5
3.0
3.5
4.0
4.5
0
20
40
60
80
100
120
FY14 FY15 FY16 FY17 FY18E FY19E
PAT (INR Cr) (LHS) PAT Margin (%) ( RHS)
1.2 1.2
0.8
0.6
0.4 0.3
FY14 FY15 FY16 FY17 FY18E FY19E
(x)
Shankara Building Products Ltd.
23 GWM/Edelweiss Investment Research
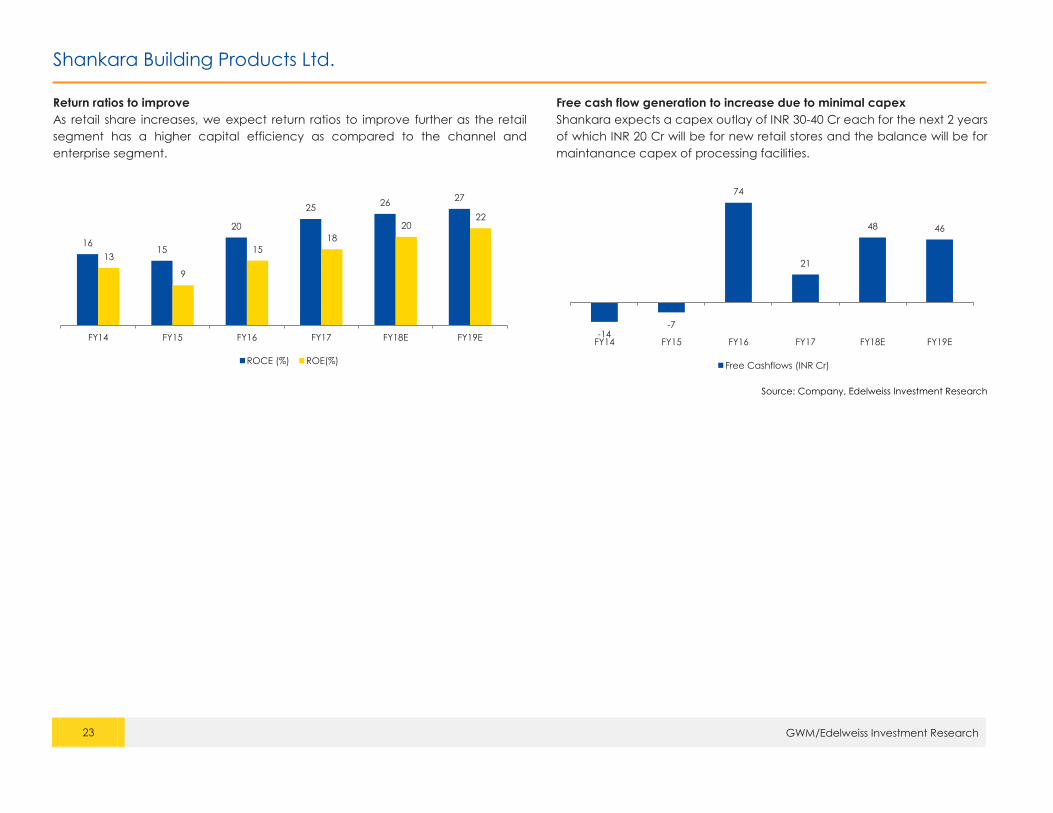
Return ratios to improve
As retail share increases, we expect return ratios to improve further as the retail
segment has a higher capital efficiency as compared to the channel and
enterprise segment.
Free cash flow generation to increase due to minimal capex
Shankara expects a capex outlay of INR 30-40 Cr each for the next 2 years
of which INR 20 Cr will be for new retail stores and the balance will be for
maintanance capex of processing facilities.
Source: Company, Edelweiss Investment Research
16 15
20
25 26
27
13
9
15
18
20 22
FY14 FY15 FY16 FY17 FY18E FY19E
ROCE (%) ROE(%)
-14 -7
74
21
48 46
FY14 FY15 FY16 FY17 FY18E FY19E
Free Cashflows (INR Cr)
Shankara Building Products Ltd.
24 GWM/Edelweiss Investment Research
Financials
Income statement (Standalone) (INR cr) Balance sheet (Standalone) Ratios
Year to March FY15 FY16 FY17 FY18E FY19E As on 31st March FY15 FY16 FY17 FY18E FY19E Year to March FY15 FY16 FY17 FY18E FY19E
Income from operations 1,979 2,036 2,310 2,530 2,809 Equity share capital 22 22 23 23 23 ROAE (%) 9.3 15.0 17.6 19.7 20.3
Direct costs 1,768 1,778 1,993 2,170 2,402 Reserves & surplus 231 269 371 457 565 ROACE (%) 14.9 20.3 24.6 25.9 26.8
Employee costs 34 41 49 54 65 Shareholders funds 253 291 394 480 588 Debtors (days) 48 50 49.3 49.3 49.3
Other expenses 122 138 163 174 188 Secured loans 293 208 209 194 194 Current ratio 3.0 2.0 2.1 2.2 2.3
Total operating expenses 1,889 1,916 2,156 2,344 2,590 Unsecured loans 0 15 15 15 15 Debt/Equity 1.2 0.8 0.6 0.4 0.4
EBITDA 90 120 154 186 219 Borrowings 293 223 224 209 219 Inventory (days) 43 46 44.2 44.2 44.2
Depreciation and amortisation 9 10 11 13 14 Sources of funds 547 514 617 689 807 Payable (days) 29 46 46.6 46.6 46.6
EBIT 81 110 143 173 204 Gross block 241 279 315 355 395 Cash conversion cycle (days) 61 50 46.9 46.9 46.9
Interest expenses 47 46 51 41 41 Depreciation 36 45 56 68 83 Debt/EBITDA 3.3 1.9 1.4 1.1 1.0
Profit before tax 35 65 93 132 164 Net block 205 233 259 286 312 Adjusted debt/Equity 1.1 0.8 0.4 0.2 0.1
Prov ision for tax 12 24 32 46 56 Total fixed assets 205 233 259 286 312
Core profit 23 41 60 86 108 Inventories 232 256 279 306 340 Valuation parameters
Profit after tax 23 41 60 86 108 Sundry debtors 260 281 312 342 380 Year to March FY15 FY16 FY17 FY18E FY19E
Adjusted net profit 23 41 60 86 108 Cash and equivalents 2 2 66 99 155 Diluted EPS (INR) 10.3 18.6 26.4 37.8 47.4
Equity shares outstanding (mn) 2 2 2 2 2 Loans and advances 12 12 13 14 16 Y-o-Y growth (%) (21.4) 80.4 41.9 43.0 25.5
EPS (INR) basic 10.3 18.6 26.4 37.8 47.4 Total current assets 506 551 671 761 891 CEPS (INR) 14.3 23.0 31.4 43.4 53.7
Diluted shares (Cr) 2.2 2.2 2 2 2.29 Sundry creditors and others 159 257 295 323 359 Diluted P/E (x) 121.2 67.2 47.3 33.1 26.4
EPS (INR) fully diluted 10.3 18.6 26.4 37.8 47.4 Prov isions 10 15 19 20 21 Price/BV(x) 10.8 9.4 7.3 6.0 4.9
Total CL & provisions 168 272 314 343 379 EV/Sales (x) 1.5 1.5 1.3 1.2 1.0
Common size metrics- as % of net revenues Net current assets 338 279 357 419 511 EV/EBITDA (x) 33.8 24.7 19.5 15.9 13.3
Year to March FY15 FY16 FY17 FY18E FY19E Net Deferred tax -10 -13 -16 -16 -16 Diluted shares O/S 2.2 2.2 2.3 2.3 2.3
Operating expenses 95.5 94.1 93.3 92.6 92.2 Uses of funds 547 514 617 689 807 Basic EPS 10.3 18.6 26.4 37.8 47.4
Depreciation 0.4 0.5 0.5 0.5 0.5 Book value per share (INR) 116 133 172 210 257 Basic PE (x) 121.2 67.2 47.3 33.1 26.4
Interest expenditure 2.4 2.3 2.2 1.6 1.4
EBITDA margins 4.5 5.9 6.7 7.4 7.8 Cash flow statement
Net profit margins 1.2 2.0 2.6 3.4 3.9 Year to March FY15 FY16 FY17 FY18E FY19E
Net profit 22 41 60 86 108
Growth metrics (%) Add: Depreciation 9 10 11 13 14
Year to March FY15 FY16 FY17 FY18E FY19E Add: Misc expenses written off/Other Assets -2 -0 -3 17 0
Revenues 2.7 2.9 13.5 9.5 11.0 Add: Deferred tax 2 3 3 0 0
EBITDA 1.0 33.6 29.1 20.5 17.6 Add: Others -0 -0 -0 -0 -0
PBT (17.8) 87.5 42.9 43.1 24.0 Gross cash flow 31 53 72 116 123
Net profit (21.4) 80.4 48.1 43.1 25.5 Less: Changes in W. C. 0 -58 14 29 36
EPS (21.4) 80.4 41.9 43.0 25.5 Operating cash flow 31 112 58 88 86
Less: Capex 38 38 37 40 40
Free cash flow -7 74 21 48 46
Shankara Building Products Ltd.
25 GWM/Edelweiss Investment Research
Edelweiss Broking Limited, 1st Floor, Tower 3, Wing B, Kohinoor City Mall, Kohinoor City, Kirol Road, Kurla(W)
Board: (91-22) 4272 2200
Vinay Khattar
Head Research
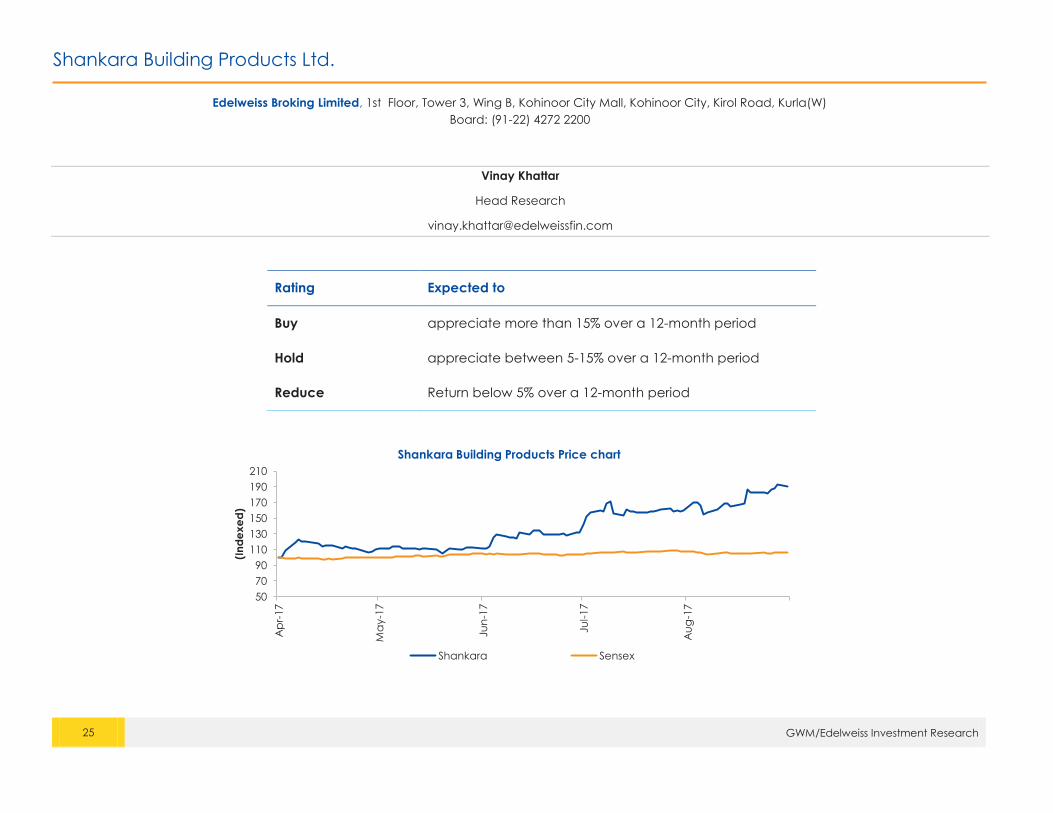
Rating Expected to
Buy appreciate more than 15% over a 12-month period
Hold appreciate between 5-15% over a 12-month period
Reduce Return below 5% over a 12-month period
50
70
90
110
130
150
170
190
210
Ap
r-17
Ma
y-1
7
Jun
-17
Jul-17
Au
g-1
7
(In
de
xe
d)
Shankara Building Products Price chart
Shankara Sensex
Disclaimer
26 GWM/Edelweiss Investment Research
Edelweiss Broking Limited (“EBL” or “Research Entity”) is regulated by the Securities and Exchange Board of India (“SEBI”) and is licensed to carry on the business of broking, depository services and related
activities. The business of EBL and its Associates (list available on www.edelweissfin.com) are organized around five broad business groups – Credit including Housing and SME Finance, Commodities, Financial
Markets, Asset Management and Life Insurance.
Broking services offered by Edelweiss Broking Limited under SEBI Registration No.: INZ000005231; Name of the Compliance Officer: Mr. Brijmohan Bohra, Email ID: [email protected]
Corporate Office: Edelweiss House, Off CST Road, Kalina, Mumbai - 400098; Tel. 18001023335/022-42722200/022-40094279
This Report has been prepared by Edelweiss Broking Limited in the capacity of a Research Analyst having SEBI Registration No.INH000000172 and distributed as per SEBI (Research Analysts) Regulations 2014.
This report does not constitute an offer or solicitation for the purchase or sale of any financial instrument or as an official confirmation of any transaction. The information contained herein is from publicly
available data or other sources believed to be reliable. This report is provided for assistance only and is not intended to be and must not alone be taken as the basis for an investment decision. The user
assumes the entire risk of any use made of this information. Each recipient of this report should make such investigation as it deems necessary to arrive at an independent evaluation of an investment in the
securities of companies referred to in this document (including the merits and risks involved), and should consult his own advisors to determine the merits and risks of such investment. The investment discussed
or views expressed may not be suitable for all investors.
This information is strictly confidential and is being furnished to you solely for your information. This information should not be reproduced or redistributed or passed on directly or indirectly in any form to any
other person or published, copied, in whole or in part, for any purpose. This report is not directed or intended for distribution to, or use by, any person or entity who is a citizen or resident of or located in any
locality, state, country or other jurisdiction, where such distribution, publication, availability or use would be contrary to law, regulation or which would subject EBL and associates / group companies to any
registration or licensing requirements within such jurisdiction. The distribution of this report in certain jurisdictions may be restricted by law, and persons in whose possession this report comes, should observe,
any such restrictions. The information given in this report is as of the date of this report and there can be no assurance that future results or events will be consistent with this information. This information is
subject to change without any prior notice. EBL reserves the right to make modifications and alterations to this statement as may be required from time to time. EBL or any of its associates / group companies
shall not be in any way responsible for any loss or damage that may arise to any person from any inadvertent error in the information contained in this report. EBL is committed to providing independent and
transparent recommendation to its clients. Neither EBL nor any of its associates, group companies, directors, employees, agents or representatives shall be liable for any damages whether direct, indirect,
special or consequential including loss of revenue or lost profits that may arise from or in connection with the use of the information. Our proprietary trading and investment businesses may make investment
decisions that are inconsistent with the recommendations expressed herein. Past performance is not necessarily a guide to future performance .The disclosures of interest statements incorporated in this report
are provided solely to enhance the transparency and should not be treated as endorsement of the views expressed in the report. The information provided in these reports remains, unless otherwise stated,
the copyright of EBL. All layout, design, original artwork, concepts and other Intellectual Properties, remains the property and copyright of EBL and may not be used in any form or for any purpose whatsoever
by any party without the express written permission of the copyright holders.
EBL shall not be liable for any delay or any other interruption which may occur in presenting the data due to any reason including network (Internet) reasons or snags in the system, break down of the system
or any other equipment, server breakdown, maintenance shutdown, breakdown of communication services or inability of the EBL to present the data. In no event shall EBL be liable for any damages,
including without limitation direct or indirect, special, incidental, or consequential damages, losses or expenses arising in connection with the data presented by the EBL through this report.
We offer our research services to clients as well as our prospects. Though this report is disseminated to all the customers simultaneously, not all customers may receive this report at the same time. We wil l not
treat recipients as customers by virtue of their receiving this report.
EBL and its associates, officer, directors, and employees, research analyst (including relatives) worldwide may: (a) from time to time, have long or short positions in, and buy or sell the securities thereof, of
company(ies), mentioned herein or (b) be engaged in any other transaction involving such securit ies and earn brokerage or other compensation or act as a market maker in the financial instruments of the
subject company/company(ies) discussed herein or act as advisor or lender/borrower to such company(ies) or have other potential/material conflict of interest with respect to any recommendation and
related information and opinions at the time of publication of research report or at the time of public appearance. EBL may have proprietary long/short position in the above mentioned scrip(s) and therefore
should be considered as interested. The views provided herein are general in nature and do not consider risk appetite or investment objective of any particular investor; readers are requested to take
independent professional advice before investing. This should not be construed as invitation or solicitation to do business with EBL.
EBL or its associates may have received compensation from the subject company in the past 12 months. EBL or its associates may have managed or co-managed public offering of securities for the subject
company in the past 12 months. EBL or its associates may have received compensation for investment banking or merchant banking or brokerage services from the subject company in the past 12 months.
EBL or its associates may have received any compensation for products or services other than investment banking or merchant banking or brokerage services from the subject company in the past 12
months. EBL or its associates have not received any compensation or other benefits from the Subject Company or third party in connection with the research report. Research analyst or his/her relative or
EBL’s associates may have financial interest in the subject company. EBL, its associates, research analyst and his/her relative may have other potential/material conflict of interest with respect to any
recommendation and related information and opinions at the time of publication of research report or at the time of public appearance.
Disclaimer
27 GWM/Edelweiss Investment Research
Participants in foreign exchange transactions may incur risks arising from several factors, including the following: ( i) exchange rates can be volatile and are subject to large fluctuations; ( ii ) the value of
currencies may be affected by numerous market factors, including world and national economic, political and regulatory events, events in equity and debt markets and changes in interest rates; and (iii)
currencies may be subject to devaluation or government imposed exchange controls which could affect the value of the currency. Investors in securities such as ADRs and Currency Derivatives, whose
values are affected by the currency of an underlying security, effectively assume currency risk.
Research analyst has served as an officer, director or employee of subject Company: No
EBL has financial interest in the subject companies: No
EBL’s Associates may have actual / beneficial ownership of 1% or more securities of the subject company at the end of the month immediately preceding the date of publication of research report.
Research analyst or his/her relative has actual/beneficial ownership of 1% or more securities of the subject company at the end of the month immediately preceding the date of publication of research
report: No
EBL has actual/beneficial ownership of 1% or more securities of the subject company at the end of the month immediately preceding the date of publication of research report: No
Subject company may have been client during twelve months preceding the date of distribution of the research report.
There were no instances of non-compliance by EBL on any matter related to the capital markets, resulting in significant and material disciplinary action during the last three years.
A graph of daily closing prices of the securities is also available at www.nseindia.com
Analyst Certification:
The analyst for this report certifies that all of the views expressed in this report accurately reflect his or her personal views about the subject company or companies and its or their securities, and no part of his
or her compensation was, is or will be, directly or indirectly related to specific recommendations or views expressed in this report.
Additional Disclaimer for U.S. Persons
Edelweiss is not a registered broker – dealer under the U.S. Securities Exchange Act of 1934, as amended (the“1934 act”) and under applicable state laws in the United States. In addition Edelweiss is not a
registered investment adviser under the U.S. Investment Advisers Act of 1940, as amended (the "Advisers Act" and together with the 1934 Act, the "Acts), and under applicable state laws in the United States.
Accordingly, in the absence of specific exemption under the Acts, any brokerage and investment services provided by Edelweiss, including the products and services described herein are not available to or
intended for U.S. persons.
This report does not constitute an offer or invitation to purchase or subscribe for any securities or solicitation of any investments or investment services and/or shall not be considered as an advertisement tool.
"U.S. Persons" are generally defined as a natural person, residing in the United States or any entity organized or incorporated under the laws of the United States. US Cit izens living abroad may also be deemed
"US Persons" under certain rules.
Transactions in securities discussed in this research report should be effected through Edelweiss Financial Services Inc.
Additional Disclaimer for U.K. Persons
The contents of this research report have not been approved by an authorised person within the meaning of the Financial Services and Markets Act 2000 ("FSMA").
In the United Kingdom, this research report is being distributed only to and is directed only at (a) persons who have professional experience in matters relating to investments falling within Article 19(5) of the
FSMA (Financial Promotion) Order 2005 (the “Order”); (b) persons falling within Article 49(2)(a) to (d) of the Order (including high net worth companies and un incorporated associations); and (c) any other
persons to whom it may otherwise lawfully be communicated (all such persons together being referred to as “relevant persons”).
This research report must not be acted on or relied on by persons who are not relevant persons. Any investment or investment activity to which this research report relates is available only to relevant persons
and will be engaged in only with relevant persons. Any person who is not a relevant person should not act or rely on this research report or any of its contents. This research report must not be distributed,
published, reproduced or disclosed (in whole or in part) by recipients to any other person.
Disclaimer
28 GWM/Edelweiss Investment Research
Additional Disclaimer for Canadian Persons
Edelweiss is not a registered adviser or dealer under applicable Canadian securities laws nor has it obtained an exemption from the adviser and/or dealer registration requirements under such law.
Accordingly, any brokerage and investment services provided by Edelweiss, including the products and services described herein, are not available to or intended for Canadian persons.
This research report and its respective contents do not constitute an offer or invitation to purchase or subscribe for any securities or solicitation of any investments or investment services.
Disclosures under the provisions of SEBI (Research Analysts) Regulations 2014 (Regulations)
Edelweiss Broking Limited ("EBL" or "Research Entity") is regulated by the Securities and Exchange Board of India ("SEBI") and is licensed to carry on the business of broking, depository services and related
activities. The business of EBL and its associates are organized around five broad business groups – Credit including Housing and SME Finance, Commodities, Financial Markets, Asset Management and Life
Insurance. There were no instances of non-compliance by EBL on any matter related to the capital markets, resulting in significant and material disciplinary action during the last three years. This research
report has been prepared and distributed by Edelweiss Broking Limited ("Edelweiss") in the capacity of a Research Analyst as per Regulation 22(1) of SEBI (Research Analysts) Regulations 2014 having SEBI
Registration No.INH000000172.


![Adi Shankara - Mark A. Foster, Ph.D. · Adi Shankara Adi Shankara with Disciples, by Raja Ravi Varma (1904) Personal Born Shankara 788 CE[1] Kaladi present-day Kochi, Kerala, India](https://cdn.vdocuments.net/doc/165x107/5e841d078ca019271820232c/adi-shankara-mark-a-foster-phd-adi-shankara-adi-shankara-with-disciples-by.jpg)


