
Columbia River Crossing Project Vancouver, Washington
Preliminary Engineering (Rating Assigned November 2011)
Summary Description
Proposed Project: Light Rail Transit 2.9 Miles, 5 Stations
Total Capital Cost ($YOE): $3,507.87 Million (includes $69.5 million in finance charges)
Section 5309 New Starts Share ($YOE): $850.00 Million (24.2%)
Annual Forecast Year Operating Cost: $8.35 Million
Ridership Forecast (2030): 22,000 Average Weekday Trips
4,100 Daily New Trips
Opening Year Ridership Forecast (2019): 13,700 Average Weekday Trips
Overall Project Rating: Medium-High
Project Justification Rating: Medium-High
Local Financial Commitment Rating: Medium Project Description: The Washington State Department of Transportation (WSDOT) proposes to construct the Columbia River Crossing multimodal project that includes replacement of Interstate 5 (I-5) bridges, new interchanges, variable electronic tolls across the new bridge, park-and-ride lots, bike and pedestrian improvements, and an extension of the existing light rail transit (LRT) system. Partner agencies include the Oregon Department of Transportation, Tri-County Metropolitan Transportation District (TriMet), Southwest Washington Regional Transportation Council (the metropolitan planning organization for Clark County), Portland Metro (the metropolitan planning organization for the Portland region), and Clark County Public Transit Benefit Area Authority (C-TRAN). The transit portion of the project includes an extension of TriMet’s Yellow Line LRT from the existing Expo Station in north Portland to Clark College in downtown Vancouver. The line would include an elevated transit structure over the North Portland Harbor, an elevated structure over the Columbia River via the new multimodal bridge, and an at-grade portion in Vancouver. It would also include the procurement of 19 light rail vehicles (LRVs) and construction of approximately 2,900 park-and-ride spaces. In addition, TriMet’s current maintenance facility at Ruby Junction in the City of Gresham would be expanded and improvements for speed and reliability to Portland’s Steel Bridge would occur. TriMet would operate the service under contract to C-TRAN. Project Purpose: Interstate 5(I-5) is the primary north/south highway from California to Canada, and the only crossing of the Columbia River in the corridor. It includes two drawbridges. Currently, congestion on I-5 reduces bus travel speeds and reliability. Congestion worsens when the bridges open to allow large river vessels to pass through. The light rail transit line would connect Portland and Vancouver and link the region’s largest and most concentrated employment area (downtown Portland) with the commercial and residential areas of Clark County. The transit project would provide direct links to the region’s other LRT lines, streetcar lines, aerial tram, Amtrak passenger rail service, and most TriMet and C-TRAN bus routes. Project Development History, Status and Next Steps: A Draft Environmental Impact Statement (EIS) for the Columbia River Crossing project was published in May 2008. The Vancouver and Portland metropolitan planning organizations adopted the locally preferred alternative into their fiscally-constrained long-range transportation plans in July 2008. FTA approved the project into preliminary engineering in December 2009. Publication of the Final EIS occurred in September 2011, and issuance
of the Record of Decision in December 2011. WSDOT anticipates receiving approval to enter final design in October 2012, a Full Funding Grant Agreement during 2013, and start of revenue operations in 2019. Significant Changes Since Last Evaluation (November 2010): The project’s capital cost decreased from $3,565.02 million to $3,507.87 million as a result of a change in bridge type recommended by an independent bridge review panel and approved by the Governors of Oregon and Washington in April 2011. Based on further design work, several costs decreased including guideway and track elements, stations, and professional services. Costs related to support facilities for maintenance, sitework, train control systems, land acquisition, vehicles, and contingency increased.
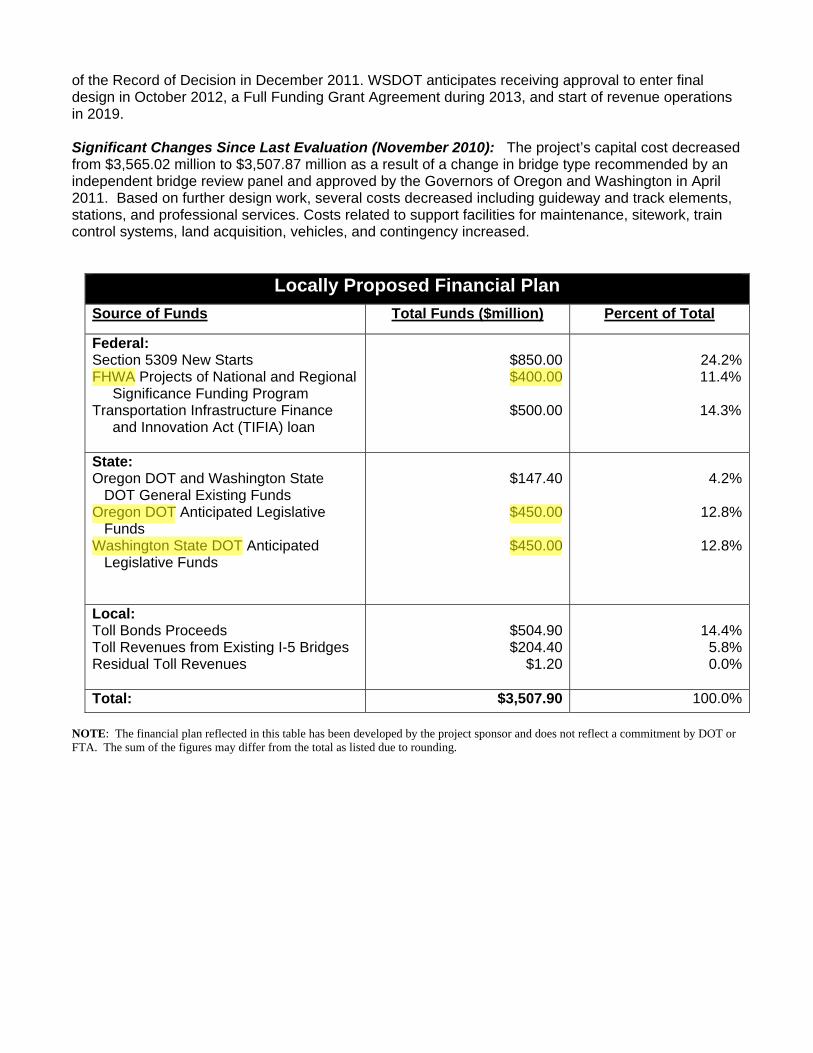
NOTE: The financial plan reflected in this table has been developed by the project sponsor and does not reflect a commitment by DOT or FTA. The sum of the figures may differ from the total as listed due to rounding.
Locally Proposed Financial Plan
Source of Funds Total Funds ($million) Percent of Total
Federal: Section 5309 New Starts FHWA Projects of National and Regional Significance Funding Program Transportation Infrastructure Finance and Innovation Act (TIFIA) loan
$850.00$400.00
$500.00
24.2% 11.4%
14.3%
State: Oregon DOT and Washington State
DOT General Existing Funds Oregon DOT Anticipated Legislative
Funds Washington State DOT Anticipated
Legislative Funds
$147.40
$450.00
$450.00
4.2%
12.8%
12.8%
Local: Toll Bonds Proceeds Toll Revenues from Existing I-5 Bridges Residual Toll Revenues
$504.90$204.40
$1.20
14.4%
5.8%0.0%
Total: $3,507.90 100.0%
Columbia River Crossing Project Vancouver, Washington
Preliminary Engineering (Rating Assigned November 2009)
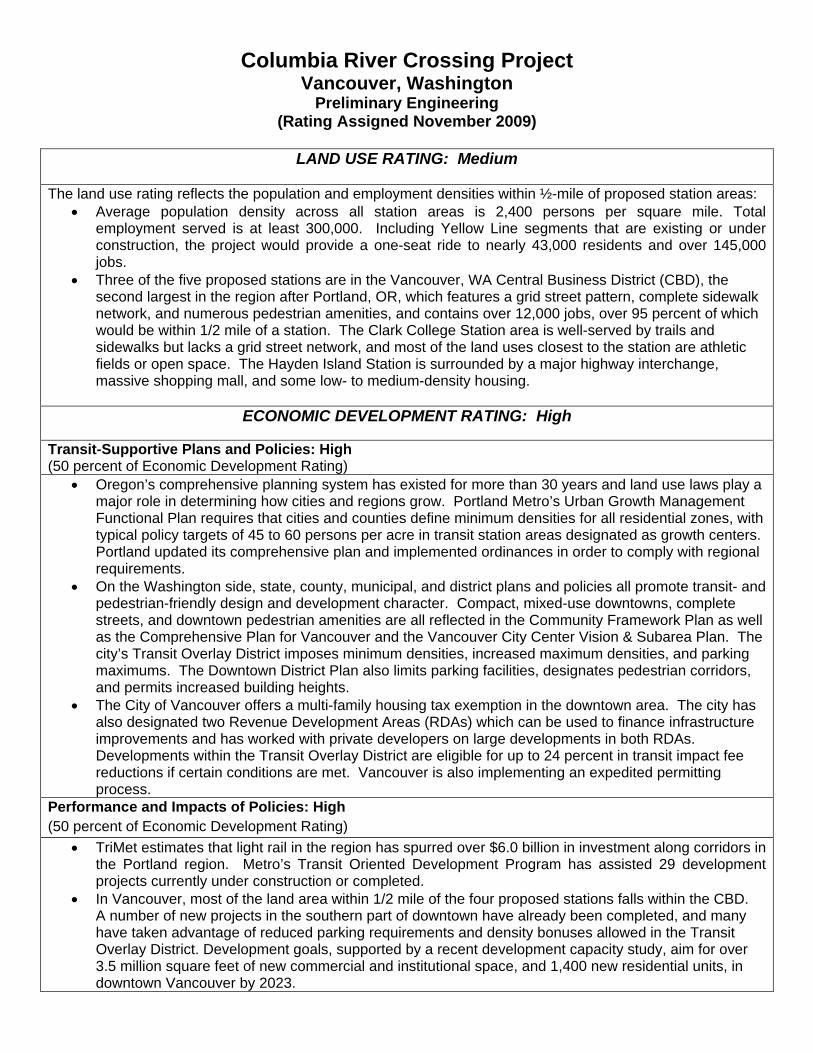
LAND USE RATING: Medium
The land use rating reflects the population and employment densities within ½-mile of proposed station areas: Average population density across all station areas is 2,400 persons per square mile. Total
employment served is at least 300,000. Including Yellow Line segments that are existing or under construction, the project would provide a one-seat ride to nearly 43,000 residents and over 145,000 jobs.
Three of the five proposed stations are in the Vancouver, WA Central Business District (CBD), the second largest in the region after Portland, OR, which features a grid street pattern, complete sidewalk network, and numerous pedestrian amenities, and contains over 12,000 jobs, over 95 percent of which would be within 1/2 mile of a station. The Clark College Station area is well-served by trails and sidewalks but lacks a grid street network, and most of the land uses closest to the station are athletic fields or open space. The Hayden Island Station is surrounded by a major highway interchange, massive shopping mall, and some low- to medium-density housing.
ECONOMIC DEVELOPMENT RATING: High
Transit-Supportive Plans and Policies: High (50 percent of Economic Development Rating)
Oregon’s comprehensive planning system has existed for more than 30 years and land use laws play a major role in determining how cities and regions grow. Portland Metro’s Urban Growth Management Functional Plan requires that cities and counties define minimum densities for all residential zones, with typical policy targets of 45 to 60 persons per acre in transit station areas designated as growth centers. Portland updated its comprehensive plan and implemented ordinances in order to comply with regional requirements.
On the Washington side, state, county, municipal, and district plans and policies all promote transit- and pedestrian-friendly design and development character. Compact, mixed-use downtowns, complete streets, and downtown pedestrian amenities are all reflected in the Community Framework Plan as well as the Comprehensive Plan for Vancouver and the Vancouver City Center Vision & Subarea Plan. The city’s Transit Overlay District imposes minimum densities, increased maximum densities, and parking maximums. The Downtown District Plan also limits parking facilities, designates pedestrian corridors, and permits increased building heights.
The City of Vancouver offers a multi-family housing tax exemption in the downtown area. The city has also designated two Revenue Development Areas (RDAs) which can be used to finance infrastructure improvements and has worked with private developers on large developments in both RDAs. Developments within the Transit Overlay District are eligible for up to 24 percent in transit impact fee reductions if certain conditions are met. Vancouver is also implementing an expedited permitting process.
Performance and Impacts of Policies: High (50 percent of Economic Development Rating)
TriMet estimates that light rail in the region has spurred over $6.0 billion in investment along corridors in the Portland region. Metro’s Transit Oriented Development Program has assisted 29 development projects currently under construction or completed.
In Vancouver, most of the land area within 1/2 mile of the four proposed stations falls within the CBD. A number of new projects in the southern part of downtown have already been completed, and many have taken advantage of reduced parking requirements and density bonuses allowed in the Transit Overlay District. Development goals, supported by a recent development capacity study, aim for over 3.5 million square feet of new commercial and institutional space, and 1,400 new residential units, in downtown Vancouver by 2023.
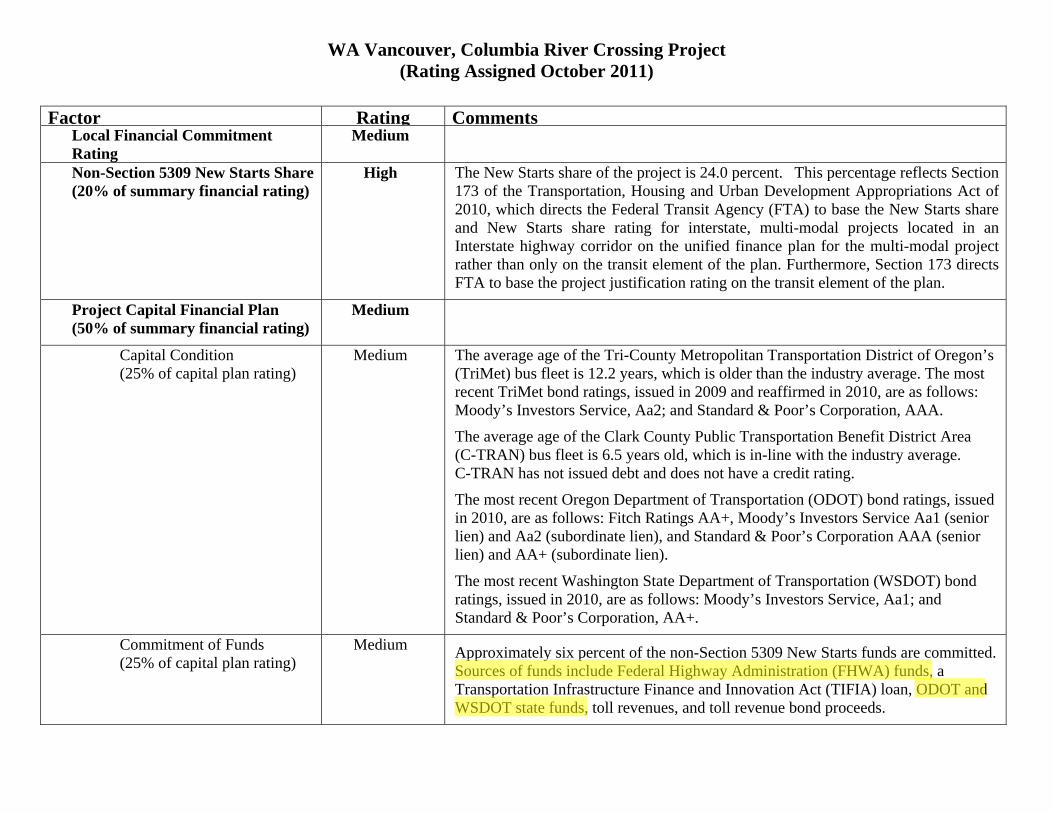
WA Vancouver, Columbia River Crossing Project (Rating Assigned October 2011)
Factor Rating CommentsLocal Financial Commitment Rating
Medium
Non-Section 5309 New Starts Share (20% of summary financial rating)
High The New Starts share of the project is 24.0 percent. This percentage reflects Section 173 of the Transportation, Housing and Urban Development Appropriations Act of 2010, which directs the Federal Transit Agency (FTA) to base the New Starts share and New Starts share rating for interstate, multi-modal projects located in an Interstate highway corridor on the unified finance plan for the multi-modal project rather than only on the transit element of the plan. Furthermore, Section 173 directs FTA to base the project justification rating on the transit element of the plan.
Project Capital Financial Plan (50% of summary financial rating)
Medium
Capital Condition (25% of capital plan rating)
Medium The average age of the Tri-County Metropolitan Transportation District of Oregon’s (TriMet) bus fleet is 12.2 years, which is older than the industry average. The most recent TriMet bond ratings, issued in 2009 and reaffirmed in 2010, are as follows: Moody’s Investors Service, Aa2; and Standard & Poor’s Corporation, AAA.
The average age of the Clark County Public Transportation Benefit District Area (C-TRAN) bus fleet is 6.5 years old, which is in-line with the industry average. C-TRAN has not issued debt and does not have a credit rating.
The most recent Oregon Department of Transportation (ODOT) bond ratings, issued in 2010, are as follows: Fitch Ratings AA+, Moody’s Investors Service Aa1 (senior lien) and Aa2 (subordinate lien), and Standard & Poor’s Corporation AAA (senior lien) and AA+ (subordinate lien).
The most recent Washington State Department of Transportation (WSDOT) bond ratings, issued in 2010, are as follows: Moody’s Investors Service, Aa1; and Standard & Poor’s Corporation, AA+.
Commitment of Funds (25% of capital plan rating)
Medium Approximately six percent of the non-Section 5309 New Starts funds are committed. Sources of funds include Federal Highway Administration (FHWA) funds, a Transportation Infrastructure Finance and Innovation Act (TIFIA) loan, ODOT and WSDOT state funds, toll revenues, and toll revenue bond proceeds.

Capital Cost Estimates, Assumptions and Financial Capacity (50% of capital plan rating)
Medium-Low TriMet revenue assumptions are consistent with historical data. C-TRAN revenue assumptions are consistent with historical data.
The capital cost estimate is considered reasonable.
WSDOT has the financial capacity to cover cost increases or funding shortfalls equal to less than 10 percent of estimated project costs.
Project Operating Financial Plan (30% of summary financial rating)
Medium-High
Operating Condition (25% of operating plan rating)
Medium-High TriMet’s current ratio of assets to liabilities as reported in its most recent audited financial statement is 1.44. There have been only minor service cutbacks and no cashflow shortfalls in recent years.
C-TRAN’s current ratio of assets to liabilities as reported in its most recent audited financial statement is 9.7. There have been only minor service cutbacks and no cashflow shortfalls in recent years.
Commitment of Funds (25% of operating plan rating)
Medium-High All of TriMet’s operating funding is committed. The main revenue sources are passenger revenue, local payroll and self-employment taxes, state funds from in-lieu-of payroll tax receipts, advertising revenues, cigarette tax revenues, FHWA’s Congestion Mitigation and Air Quality funds, Section 5307 Urbanized Area Formula Program, Section 5309 Fixed Guideway Modernization funds, Section 5317 Job Access and Reverse Commute funds, and Section 5317 New Freedom funds.
None of C-TRAN’s operating funding is committed. The main revenue sources are passenger revenue and existing local sales and use taxes.
O&M Cost Estimates, Assumptions, and Financial Capacity (50% of operating plan rating)
Medium Assumed growth in TriMet operating expenses, farebox collections and sales tax revenues is consistent with historical experience.
Projected TriMet cash balances and reserve accounts equal 13 percent of annual system-wide operating expenses.
Assumed growth in C-TRAN operating expenses is consistent with historical experience. Assumed C-TRAN farebox collections and sales tax revenues are optimistic compared to historical experience.
Projected C-TRAN cash balances and reserve accounts equal 28 percent of annual system-wide operating expenses.

78TH
119TH
MARINE
I-205
DN27
DN28
DIVISION
I-5
GLISAN
78TH
DN221
BURNSIDE
LOMBARD
HT841
SR-5
01
ST HELENS
DN261
STARK
DN251
POWELL
28TH
18TH
HT92
SUNSET
SR-14
HALSEY
ST JOHNS
DN201
MILL PLAIN BLVD
TS
NOT
GNI
HS
AW
TS
YAW
DAO
RB
E 5TH ST
HT211
COLUMBIA
N COLUMBIA BLVD
SANDY
39TH
HT461
EVERGREEN
I205
MA
IN S
T
NE
SE
RD
NA
99TH
12TH
11TH
33RD
HT05
FREMONT
FOURTH PLAIN
YEON
159TH
9TH
36TH
BELMONT
41S
T
DN24
94TH
THOMPSON
HT701
LOWER RIVER
HAZ
EL D
ELL
7TH
68TH
AIRPORT
HT631
TS12
KILLINGSWORTH
GR
EE
LEY
1ST
149TH
83RD
WILLAMETTE
8TH ST
88TH
PATTON
HT731
NAITO
VIST
A
DN29
SR
-503
DN241
CULL
Y
49TH
BURTON
UN
ION
44TH
20TH
HT52
HAWTHORNE
MINNEHAHA
HT79
HT06
HT67
HT66
MCGILLIVRAY
WARD
HT031
DR32
CAPLES
MCLOUGHLIN BLVD
MCLOUGHLIN BLVD
40TH
156TH
139TH
HT831
LAKESHORE
PRESCOTT
PORTLAND
WEIDLER
54TH
HT51
58TH
MACARTHUR
10TH
NLO
CNIL ST JAM
ES
GNI
KR
EHT
ULNIT
RA
M
LOVEJOY
4TH
DN25
DN26
HT75
FALK
BLISS
LIE
SE
R
NICOLAI
ROSS
TS121
HT65
HT061
HUMPHREY
TALTO
N
45TH
ENI
VE
D
GR
AN
D
13TH
GOING
HT61
6TH
LLOYD
MORRISON
FRONT
COVINGTON
HT46 154TH
TS13
DO
SCH
BR
AN
DT
BROADWAY
BARBU
R
HT77
17TH
BERNIE
COLUMBIA HOUSE BLVD
TS
ER
CK
RAP
MARTIN
LUTH
ER KIN
G JR
EVA
HT31
EN
SCHOLLS FERRY
305R
S
VAUGHN
HO
OD
KA
UFF
MA
N
E RE
SERV
E ST
ST JOHNS B
LVD
CASCADE PARK
HT401
MILW
AUKIE
NO
SP
MIS
HT551
THORBURN
103RD
BLAN
DFO
RD
ROSS ISLAND
48TH
I84 FWY-I205 FWY
HTR
OW
SLLE
VOL
AK
HC
ATSI
VALL
EB
GHER
POPLAR
109TH
ALDER
SEWARD
THURSTON
VANCOUVER MALL
DVL
BLLE
WOP-Y
WF502I
LAI
RO
ME
MR
EGI
ER
ONI
WR
E
SHAT
TUCK
RO
BR
AH
BRIAR W
OOD
FOSTER
34TH
SUNSET-SYLVAN
2ND
PHILADELPHIA
KELLY
47TH
MARQUAM
3RD
93RD
GREELEY
131S
T
108T
H
DO
OW
HTR
AE
H
33RD
305-R
S
PORTLAND
117TH
HT81
HT901
PORTLAND
21S
T
HT05
63RD
102N
D
DN28
139TH
39TH
20TH
MC
LOU
GH
LIN
15TH ST
17TH ST
DN27
13TH ST
HT631
DN29
78TH
21S
T
DN221
502I
LIN
CO
LN
11TH
HT211
HT05
HT49
HT45
FOURTH PLAIN BLVD
SE COLUMBIA WAY
UNION
PRESCOTT
159TH
SANDY
WEIDLER
EVERGREEN BLVD
I5
119TH
20TH
HT731
HT02
SR-5
01
ST HELENS
DN241
LAKESHORE
BROADWAY
HT06 I84
138TH
20TH
41ST
10TH
POWELL
9TH
18TH
HT11
5TH
88TH
SR-500
SKYLINE
63RD
49TH
HT93
99TH
159TH
I405
STARK
78TH
N MARINE DR
N MARINE DR
N JANTZEN AVE
N HAYDEN ISLANDDR
NTOMAHAWK ISLAND DR
Vancouver
WASHINGTONHAYDENISLAND
ClarkCollege
Portland
OREGON
Highway Improvements
Existing Highway and Bridge
Proposed Light Rail Alignment
Existing MAX Yellow Line
Proposed Park and Ride
Proposed Light Rail Stations
Mill Plain Interchange
SR 14/City Center Interchange
Hayden Island Interchange
Marine Drive/Bridgeton Interchange
Victory Boulevard Interchange
Fourth Plain Interchange
SR 500 Interchange
Project Area Map
Federal Transit Administration • Federal Highway AdministrationCity of Vancouver • City of Portland • SW Washington Regional Transportation Council • Metro • C-TRAN • TriMetPRojeCT PARTNeRS


