Download - DOCUMENT RESUME 95 TM 004 269 D.C. - ed

ED 103 439
AUTHORTITLEINSTITUTION
SPONS.AGENCT
PUB DATENOTE
DOCUMENT RESUME
95 TM 004 269
Rawitsch, Don; Hooker, SherrillSEA Staff Survey-1974: General Report.Minneapolis Public Schools, Minn. SoutheastAlternatives Program.National Inst. of Education (DREW), Washington,D.C.Apr 7443p.; For related documents, see TM 004 262, 276,301, and 323
EDRS PRICE MF $0.76 HC-$1.95 PLUS POSTAGEDESCRIPTORS *Alternative Schools; Community Involvement;
Community Support; Curriculur Evaluation;*Instructional Staff; Low Income Groups; MinorityGroups; Program Attitudes; *Program Evaluation;Teacher Role
IDENTIFIERS Minneapolis Public Schools; *SoutheastAlternatives
ABSTRACTThe instructional staff at the Southeast Alternatives
(SEA) program operated by the Minneapolis Public Schools weresurveyed to determine their reaction to the SEA program. The twomajor objectives of the survey were to obtain staff opinion on issuesconcerning the program as well as progress toward achieving SEA majorgoals. The major findings of the report were: (1) wore staff memberswere satisfied with the program at their school than with the totalSEA. program; (2) many staff members felt that the SEA program withintheir schools produced a better educational program than provided bynon-SEA schools in the following: cognitive skills, affectivelearning, producing an appropriate disciplinary atmosphere, servingthe needs of minority students and students from low income families.Other findings included the impact of funding source on staff moraleand the need for an intense training of staff members for each newalternative program. (DEP)

BEST COPY AVAILABLE
CY% Minneapolis Public SchoolsPr-4" Southeast Alternatives Internal Evaluation Team
Pr\ 10)42 18th Avenue SE
CD Minneapolis, Minnesota 55414
r--I 331-6257
LA.)
CD
OOgni
US DEPARTMENT OF NEALTNEDUCATOON& WELFARENATIONAL INSTITUTE OF
EDUCATIONTHIS DOCUMENT HAS PEEN REPRODUCED Exactly AS RECEIVED FROMTHE PERSON Om omoANIzAt tom ORIGINAT NG it POINTS OF ViEWOROPINIOP.SSTATED DO NOT NE tE S.41/til Y REPRESENT OF F iCIAL NATIONAL INSTITUTE OFEDuC At ION POsit ION OR POLICY
S E A S T A F F S U R V E Y - 1 9 7 4
General Report
April, 1974
(2nd printing: October, 1974)
Written by Don Rawitsch and Sherrill Hooker, Evaluators
Clerical: Liz Pilman and Barbara Renshaw
This is a SEA Level I formative evaluationreport, prepared as part of the project-
wide evaluation effort. Contact Susie Demet,
evaluator, for further information.
3

TABLE OF CONTENTS
Background Information on Southeast Alternatives s..
Background and Procedures for Implementation of the Survey.
Use of the Data. d 3
Tabulations of Survey Items for All Respondents 5
General Report
Conclusions 17
Data Analysis and Interpretations 19
Staff Opinion on General Issues. 21
Alternatives for the Decentralization of Personal
Decision-Making 29
Community Involvement. 31
Decentralization of Governance...... 35
Age-Level Articulation 39
The Results for Students of SEA'S Programs 41
Roster of People Surveyed 45

BACKGROUND AND PROCEDURES FOR IMPLEMENTATION OF THE SURVEY
Four times since the beginning of the Southeast Alternatives project
in September, 1971, parents of students in SEA schools have been given the
opportunity to express their opinions through written or interview surveys.
As SEA is currently in its third year, the Internal Evaluation Team suggested
to the SEA Management Team* that it seemed appropriate to also survey the
staff members in the project. With the Management Team's approval, the
evaluation team began drafting a survey instrument.
The instrument was designed to serve two purposes. It would provide
a way to solicit general staff opinion on a number of significant issues,
including staff reactions to the progress being made toward achieving SEA's
major goals. The instrument also included items concerning a number of specific
evaluation tasks to be carried out by the evaluation team. Many evaluation
activities call for assessing staff opinion and it was though,; more desirable
to get this all at once through a comprehensive survey, rather than continu-
ally hitting staff members with a number of smaller opinion questionnaires
and interviews.
Copies of the initial draft of the survey instrument were sent to
nearly 100 people, both within and outside the project. About 20 people made
suggestions to the evaluation team concerning changes and additions. As a
result of this process maw changes were made in the selection and wording
of items, though most of the content categories from the original draft
remained covered in the final draft of the instrument.
*A decision making group in Southeast Alternatives consisting of the SEA
director, principals of the SEA schools, and managers of major K-12 programs.

The questionnaires were delivered to SEA staff members who were to
return them, completed, to the Internal Evaluation Team in an attached
"school mail" envelope. The figures below show the percentage rate of
questionnaire return for each of the groups identified in the survey.
Number of Number ofQuestionnaires Questionnaires Rate of
Group* Sent Returned Return
SEA Management Team 12 11 92%
Instructional Staff 247 50 34%
Educational Support Staff 47 32 68%
All Respondents 206 93 45%
* Instructional Staff is basically made up of teachers. Educational SupportStaff includes counselors, social workers, curriculum specialists, evalu-ators, community resource coordinators, and other support positions.Rosters of each of these groups can be found aapp..37,38.
USE OF THE DATA
The comprehensive nature of the survey calls for different parts of the
data to be used in different ways. Thus, while the tabulations of survey
items for all respondents are shown on pages 5-13, analysis of items
and conclusions included in the general report will focus only on survey
items pertaining to SEA-wide issues. Analysis of, and conclusions from
survey items that pertain to specific programs or groups of people will be
included in a number of smaller special reports to be distributed to groups
in SEA and the Minneapolis Public Schools which can make the most direct use
of the information. The chart on the following pegs shows for each content
section of the questionnaire the plan for dissemination and some suggested
uses of the information.

(1)
Questionnaire Content Sections
Itims
Dissemination of the Information
bpsi
ble
Thi
esof the Information
Staff Profiles
Respondent
characteristic
items
data memo to Management Teem and
inblicatiods Board
determine if this kind of information
would be appropriate for parent
decision making
Staff Opinion on General Issues
7-13
, 31,
gene
ral r
epor
tge
nera
l eva
luat
ion
of SEA program; MPS
72, 73
self-evaluation
Alternatives for the Decentralization of
lh-17,
general report
3zidgerient on progress toward goal by
Personal Decision Making (SE& Goal)
50,
Man
agem
ent T
eem
, SE
Cou
ncil,
oth
ers
SE&
Dir
ecto
r1a-2
2da
ta m
a= to
des
igna
ted
SE C
ounc
ilsu
b-co
mai
ttee
SE C
ounc
il de
sign
ated
fun
ctio
n of
eval
uatin
g di
rect
or
Lev
el I
Tee
n23
-26
spec
ial r
epor
t to
Lev
el I
Tee
m a
ndM
anag
emen
t Tee
nM
anag
emen
t Tea
m e
valu
atio
n of
Lev
el I
serv
ices
; Lev
el I
Tea
m s
elf-
eval
ua'A
ca
Ifia
rage
man
t Tee
m27
-30
spec
ial r
epor
t to
Man
agem
ent T
eter
and
SE C
ounc
ilM
anag
emen
t Tea
m s
elf-
eval
uatio
n
Cos
mun
ity I
nvol
vem
ent (
SEA
Goa
l)31
-37
gene
ral r
epor
tge
men
t on
prog
ress
tow
ard
goal
by
14-4
8M
anag
emen
t Tee
n, S
E C
ounc
il, o
ther
s
Age
-Lev
el A
rtic
ulat
ion
(SR
I G
oal)
38-4
2ge
nera
l rep
ort
Judg
emen
t on
prog
ress
tow
ard
goal
by
Man
agem
ent T
een,
SE
Cou
ncil,
oth
ers
Decertialisation of Governance (SEA Goal)
43-14$
general report
judgement on progress toward goal by
36-37
Management Team, SE Council, others
Level II
Ter
.,: (
MT
)da
ta lf
teno
to K
RM
ET
sel
l- e
valu
atio
n
The
Res
ulta
for
Stu
dent
, of
SEA
ts P
rogr
am52
-ST
gene
ral r
epor
tge
nera
l eva
luat
ion
of S
SA p
rogr
am b
yM
anag
emen
t Tur
n, S
E C
ounc
il, o
ther
s
City
-vid
e T
estin
g58
-63
spec
ial r
epor
t to
Menagolvent Tam
and ZIPS Dix. of Guidance and
Assesament Services
Management Team evaluation of
desirability of
air-
wid
e te
stin
gpr
ogra
m in
SE
A; D
ept.
of Guidance and
and Assessment self-evaluation
Tues. Release Time/Rmaan Relations
6k-71
for use in Tavel I report an these
programs to be used by MPS for
Mn. State Dept. of M.
State Dept. of Pd. evaluation of
Theo. Release Tine; MPS evaluation
of T
ues.
Rel
ease
Tim
e an
d R
umen
Relations
4220
223
lett on the questionnaire to write open convents
the evaluator.
sal to designate
to eh= the comment:: should be directed.
These will be forwarded by

TABULATIONS OF SURVEY ITEMS FOR ALL RESPONDENTS
Key: SA=strongly agree Aagree Umuncertain DadisagreeSD=stroney disagree DA=doesn't apply to me
Age of Respondents (N=85)
2145 faiif
Experience of RespondentsPositions, Public or
Tie.:
12x
in Teaching or Other Non-Administrative SchoolPrivate (including 1973-74) (N=84)
.14 -it- -Irk-12 1 -16 1 -20 21-2 2 +
2 2 1
Residence of Respondents (N=93)
In Southeast Mpls. In Mpls., Non - Southeast
24% 36f
Family of Respondents (N=90)
Have School-age Children 12sLtnaqLAgiool-eChVtHildL....;..n.48% 52%

Item 7 (N-93)
Overall, I am satisfied with the way the program at pr school is developing.
SA A U D SD DA
18% 46% 15% 8% 4% 9%
Item 8' (N=92)
Overall, I am satisfied with the way the SEA program as a whole is developing.
SA A U D17g
SD IaEXT 21% -"W
Item 9 (N.91)
An adequate program of educational alternatives should provide options to the "right"
as well as to the "left" of center.
SA A U D SD ja.46% % 9% 1% 3% 1%
Item 10 (N=93)
The four major goals of the Southeast Alternatives project have been made clear to me.
SA A U D SD DA
51-gr 59 g 20% 16% 10% -
Item 11 (N93)
A conscious effort is being made in Southeast Alternatives to monitor progress
being made toward meeting the major SEA goals.
SA A U D SD DA
r5r 387 19 1:5x -sr %-r--
Item 12 (lifr93)The addition of the federal money has been good for Southeast school programs.
SA A U D SD DAsrzr ox Tr tir -Tr 7.-r
Item 13 (N=93)The addition of the federal money has been detrimental to Southeast staff
relationships.
SA A U D SD DA
1r 13 Irg 35X 37".
Item 14 (N-92)I was given th3chance to make real choice.; about my assignment in the SEA school
where I am located.
A U D SD DA
791f 13T "Mr"

Item 15 (N-91)If you felt you did not have an adequate background to handle all facets of the
position you were assigned to when you first became part of SEA, did SEA provide
you either formally or informally, with the additional treining you needed.
fa4 my bacligrPMPd25 was adequate
4.3f
Item 16 (N=91)My undergraduate and/or graduate background from college was an inadequate preparation
for the position I was assigned to in SEA.
SA U D SD 4.-Tr maAr w 3 Zir
Item 17 (N=90)When SEA began in.fall, 1971, did you want to transfer to a school other than the
one you were in but stayed where you were due to lack of desirable position
openings elsewhere?
Yes No I wasn't in a Southeast school when
..7.7 SEA bean.47%
The findings from Items 18-22, which pertain to
agreement been given to the Southeast Community
functions include evaluating the SEA director.
findings with the SEA director, Dr. James Kent,
these findings should be made public.
Tr MX
the SEA Director, have by priorEducational Council whose constitutional
The Council will discuss theseand will than decide on whether or not
Item 23 (N=93)The Internal Evaluation Team (Level I) has provided enough useful information to
justify its existence.
3 TIT
Item 24 (N=92)The project-wide information produced by the Level I Team, such as reports on student
mobility and parent opinion surveys, has been useful to myself or the staff at my
school.
SA A U D SD DAarif
Item 25 (N=91)The school specific information produced by Level I Team members, such as the work of
the evaluators housed at Marcy, Five School, and MUMS, and work done with CAM at
Tuttle and Pratt/Motley, has been useful to myself or the staff at my school.
SA A U D SD DA
1 r 3 ff Zuf 6"mr

item 26 (N..03)
Indicate below how much voice you think the listed groups currently have AND
should have in determining the use of Level I evaluation resources:
vea lot;
of voice
,:o:sevolcv
Utile orno voice
administrators 0% 40% 2%
teachers 14% 72% 14%
parents 13% 55% 32%
student:................,NPrxm5% 30% 65%
u have........-----",...---.a- lot
Ati-14919-2-r2.0-941-----1°
53%
some
46%
little orvoice
1%,
59% 43$---
l.%
llr..
58% 1%
23% 72% 1 5%
Item 27 (N.92)The Management Team deals widi important issues in SEA.
SA A U D SD DA-6r laItem 28 (N=93)I feel adequately represented by the present membership of the Management Team.
SA A U D SD DA
rir T3T 171 1rItem 29 29 (N=91)
The Management Team fails to keep staff members adequately informed about its
considerations and decisions.
SA A U D SD DAm yo 2 6% 6% -
Item 30 (N.91)The Management Team has given staff the leadership needed to make the project run
smoothly.
SA A U D SD
33f 3117DA
Frotb
Item 31 (N=93)The Minneapolis Public Schools central administration gives adequate support to SEA.
SA A U D SD DA
"Tr 3.6j n't -3r -
Item 32 (N.91)The Southeast Council has been effective in advising the SEA Director.
SA A U D SD DA
TM- /131 rrt -ir.Item 33 (N=.90)The Southeast Council does not give enough consideration to the important issues in SEA.
SA A U D SD DA
r7r 1.91 zx =12
-8-

Item 34 (N=89)The representation on the Council is fair enough for the job the Council has to do.
SA A U D SD DA333. 22% 7% 3% 1%
Item 35 (N=90)SEA has been more effective than a traditional program in getting communitymembers to participate in school programs.
SA A U D SD DA
43% 41% 8% 6% 2%
Item 36 (N =90)SEA has not been as effective as a traditional program in getting community membersinvolved in decision-making concerning school programs.
SA A U D SD DA-Tr 75% "V% -3114-g 77'
Item 37 (N=90)To what degree should the community be involved in decision-making?
Participation on Participation on Informal personal There is no real need
decision-making groups that advise input to decision for community involve.-
bodies decision makers makers merit in decision-makiTA
55% 41% 2% 2%
Item 38 (N =90)
SEA's educational programs lack the proper coordination to insure smooth student
transition from one age/grade level to the next.
SA A U D SD DA13% Wf wig Erf
Item 39 (N=89)How many of the SEA schools besides your own have you visited?
1r- mr 2 At Ar1 2
-5
Item 40 (N.91)I have a good feel for what the SEA elementry programs (other than the one Imay work in) are doing.
SA A U D SD DATsr 7 ra '.3w'. -7gr-
Item 41 (N.91)I have a good feel for what the SEA secondary programs (other than the one I may work
in) are doing.
11%SA A U D SD DA
ToT TR sox §r 3%
Item 42 (N.90)There is a need for more joint planning between staff members in elementary programs
and staff members in secondary programs.
SA A U D SD DA
46$ 36% 4% 9% 2% 3%13

Item 43 (N =90)
More staff members now share in the power to make decisions about programs in my
school than before SEA began.
SA A U D SD DA
T2 .11U Ig "lir itrfau
Item 44 (N=90)More staff members now share in the power to make decisions about staffing in my
school than before SEA began.
SA A U D SD DA
27:r 3:1-3X 75X 37-27 alfr TIT
Item 45 (N=90)More staff members now share in the power to make decisions about budget allocations
in my school than before SEA began.
TiAS A U D SD Dr
2V nuf "Tr TiA
Item 46 46 (N.90)
The parent-staff advisory/governing group that serves my. school has a significant
effect on decisions made about the program at the school.
SA U D SD DA
73- YE% 157.3 177 3
Item 47 (N=90)The parent-staff advisory/governing group that serves my school has a significant
effect on decisions made about staffing at the school.
SA A U D SD DA
10% 26% 31% 17%
Item 48 (N=90)
The parent-staff advisory/governing group that serves my school has a significant effect
on decisions made about budget allocations at the school.
SA A U D SD DA
Tra- 17 011 Tff 77r
Item 49 (N=90)MET evaluation personnel (Level II) have been generally cooperative with SEA
school staff.
SA A U D SD DA
zr MT 37T 3r -31"Item 50 (N=91)Students in SEA have a choice between educational programs that are dist/amity different
from each other.
SA A U D SD DA
73ar rta TOT Tr

Item 51 (N=89)
Parents and students do not have enough access to the right kinds of information
to make a wise choice of educational program.
SA A UD SD DA7.3. E-63.
Item 52 52 (N=90)
The SEA. program at ny school has produced, program: that do a better job of
teaching kids cognitive skills than are available at most other (non SEA) schools.
SA A U D SD DA13r 3 "ox Tax
Item 53 (N=90)The SEA program at my school has produced programs that do a better job of fostering
affective learning than are available at most other (non-SEA) schools.
SA A U D SD DA
23% 35% 23% 8% 3% 8%
Item 54 (N=90)The SEA program at my- school has had a positive effect on producing the kind of
disciplinary atmosphere I feel is appropriate for the school.
SA A U D SD DA
rfr 1-67 1-rf
Item 55 (N=90)The SEA program at my school has produced programs which better serve the needs
of students from low income families than are available at most other schools.
SA A U D SD DA3 313.
Item 56 (N=90)The SEA program at my school has produced programs which better serve the needs of
minority students than are available at most other schools.
SA A U D SD DA
/ar 38% 3I 11% 8% 8%
Item 57 (N*90)The SEA program at my school has produced programs which better serve the purpose
of helping all students learn to work with and respect each other than are available
at most other schools.
SA A U D SD DA
11% 44% 19% 12% 6% 8%
Item 58 (N=90)The present city-wide standardized testing program should be continued in SEA. schools.
SA A U D SD DA
9% 28% 17% 19% 27% --

Item 59 (N439)I would be in favor of a city-wide standardized testing program that was expanded
to cover areas other than reading and mathematics.
SA A U D SD DA
4"-ir 1.17
Item 60 (N=90)To what extent is the available standardized test data useful to you in noting
the growth over a period of time of individual students in reading vocabulary
and comprehension skills and mathematical concepts?
Very Somewhat Useful Only In Of No
Useful Useful Very Limited Wigs Use DA
19% l ISM
Item 61 (14.90) -
To what extent is the available standardized test data useful to you in noting
which students are significantly low in reading and math skills so that other
methods can then be used to identify areas that need remediation?
Very Somewhat Useful Only In Of No
Useful Useful very Limited ways Use ILL
36% 'Ma 21%
Item 62 (N=89)To what degree are the recordkeeping procedures at your school useful to you in working
with students?
Very Somewhat Useful Only In Of No
Useful Useful Very Limited Wgys Use DA
21% 3% 16%
Item 63 (N-91)In your contact with parents, how many of them are interested in knowing how their child
is doing in relation to other students (the kind of information standardized tests
could produce)?
Most Some Only a Few No
Parents Parents Parents Parents DA
..."-Tra 36% 11t
Item 64 (P-91)
My school puts Tuesday Release Time to good use.
SA A U D SD DA
-3 37"f 9% 75% 'Fr 137"
Item 65 (N-91)How much positive effect do Tuesday Release Time activities have on your classroom
teaching?
A VerySignificant Some A Little No
Effect Effect Effect Effect
lb% Mr' AN.
-12- 16

Item 66 (N=91)How much positive effect do Tuesday Release Time activities have on your growth
as an educator?
A VerySignificant Some A Little No
Effect Effect Effect Effect DA13% 3-67.
Item 67 (N=88)I don't have enough opportunity to participate in the planning of Tuesday Release
Time activities at my school.
SA A U D SD DA
18% 14T 40% 15% 11%
Item 68 (N=91)More Tuesday Release Time sessions should be set aside for the kind of staffdevelopment activities which currently are only possible through Teacher Center
funding of staff overtime.
23A
A U D SD DA337 337 3-7
Item 69 (N=91)The Human Relations activities in qy school are worthwhile.
SA A U D SD DA3.4% rfg 7% gr
Item 70 (N=91)How much positive effect do Human Relations activities have on your abilityto work with students?
A VerySignificant Some A Little No
Effect Effect Effect Effect DA15% 40% 21 10 11%
Item 71 (N=91)How much positive effect do Human Relations activities have on your ability to workwith staff members and parents?
A VerySignificant Some A Little No
Effect Effect Effect DA23% TOT- 24% 10 -Irf--
Item 72 (N90)SEA is a unique enough program to justify keeping Southeast a separate administrativearea, at least until the federal funds expire.
SA A U D SD DA
53% 18% 13% 5% 11% --
Item 73 (N=89)The Minneapolis Public Schools administration and School Board are making effective
use of what SEA staff members have learned from designing and running SEA
experimental programs.
SA U D SD DA-12r. 7.5x -fa
-13-

GENERAL REPORT
18

CONCLUSIONS
Some of the information in this General Report is useful for drawing conclusions
about the effect which the Southeast Alternativer, program has had on staff members.
Other information is useZ for suggesting areas in which improvement could be
made during the future years of the project. Following are conclusions based on
einfoatiormthiseneralreort accompanied by references to supporting
data. No conclusions have been based on differences found between the responses
from staff at the various schools because it is felt many such differences are
natural given the unique character of each SEA school program.
Conclusions from the past experience of Southeast Alternatives:
1) The SEA staff is committed to a wide range of educational alternatives.
(See discussion of Item 9, p. 23)
2) More staff members are satisfied with the program at their own school
than are satisfied with the SEA program as a whole. In addition,
staff feelings about the total SEA program are somewhat dependent
upon their feelings toward their individual school.(See discussion of Items 7 & 8, pp. 17, 18)
3) About half of the staff members feel that the SEA program at their
school has produced educational programs that do a better job than
the programs available in most non -SEA, schools in the following areas:
teaching cognitive skills, fostering affective learning, producing
an appropriate disciplinary atmosphere, serving the needs of students
from low income families, serving the needs of minority students,
and helping all students learn to work with and respect each other.
The area in which the most staff members feel SEA programs are superior
is in fostering affective learning.(See discussion of Items 52-57, pp. 34, 35)
4) While staff members overwhelmingly felt that the addition of federal
funds has been good for Southeast Alternatives programs, there is
evidence that the addition of outside funds to schools for support
of new programs carries the risk of undermining staff morale.
(See discussion of Items 120 13, p. 20)
5) A significant training effort should accompany the initiation of a
program of educational alternatives since the training and experience
of many staff members does not cover these alternatives.
(See discussion of Items 15 & 16, pp. 24, 25)
6) The SEA program has increased staff involvement in decision-making.
In addition, there is a relationship between the way staff members
feel about their power in program decision-making and the way they
feel about the program at their school.(See discussion of Items 43'445, pp. 29, 30
7) SEA staff members are very supportive of increased community involve-
ment in school governance. In addition, feelings about communityparticipation in governance are related to a staff member's age and
area of residence.(See discussion of Item 37, pp. 27, 28)

Conclusions sugeosting areas for future improvement in Southeast Alternatives:
1) A significant number of staff members are dissatisfied or uncertainabout the development of the SEA program as a whole. Two possiblereasons for this are illuminated in the survey findings. Many staffmembers are still unclear as to the major thrgsts of Southeast Alter-natives. Also, many staff members feel dissatisfied or uncertainabout the support given to SEA by the Minneapolis Public Schoolsadministration and with the school district's assurance that the workof SEA staff is proving useful.(See discussion of Items 8, 10, 31, 8:73: pp, 17-19, 22: 23)
2) A strong need is felt by staff members for more cooperative planningand communication between elementary and secondary staff members.(See discussion of Items 38, 141, & l2, pp. 32, 33)
3) Some staff members feel dissatisfied or uncertain that parents andstudents have easy access to the right kind of information for makingdecisions about choosing between the alternative educational programsoffered in Southeast Alternatives.(See discussion of Item 51, p. 25)
-18-

DATA ANALYSIS AND INTERPRETATION
Notes:
1) Findings for individual items referenced in this section can befound in their entirety in the section "Tabulations of Survey
Items For All Respondents".
2) The rate of questionnaire return from staff at the Free School and the
Teacher Center was very low. While the rate of return from staff atthe SEA Office was high, the total number of that group is very small.
Therefore, tables which show a breakdown of responses to an item by
program do not include these three sets of people.
3) Most of the tables have been abbreviated to some degree to make them
as meaningful and readable as possible. For example, responses of
"does not apply to me" have been eliminated. All percentages shown
are based only on the numbers actually appearing on the table.
Key to symbols used in the tables -
SA=strongly agree A=agree U=uncertain Diedisagree SD- strongly disagree
SE- Southeast Minneapolis Mpls=Minneepolis
CairMany of the tables in this section of the report contain databroken down by school program in order that individual schoolsmay know how the staff of the school responded to an item.One of the purposes underlying the development of a system ofalternatives is to pro-ride programs that vary in the amount ofstructure and/or flexibility allowed both students and staff,and this will necessarily result in staff opinion differencesfrom school to school on many dimensions. For this reason theevaluators have refrained, in most cases, from making school-to-school comparisons and do not encourage others to do so.

Staff Opinion on General Issues
One purpose of the staff survey was to measure staff reactions to several
very general aspects of the SEA program. Items 7 and 8 show that more staff
members feel positively about the program at their own school (64%) than feel
positively about the development of SEA as a whole (56%). Further analysis
shows that a respondent's satisfaction with the program at his/her school and
with SEA as a whole is related to the school at which the respondent works, as
shown by Tables 1 and 2.
TABLE 1 (Nom TABLE 2 (NR78)
Item 8 (overall, I ant satisfied with the wmythe SEA program as a whole is developing.)
ar School ProgramItem 7 (Overall, I am satisfied with the way
the program at mr school is developing)*
BY School Program
SAGA U
Marcy
Pratt/Motley
Tuttle
TransitionalProgram
Sr. HighProgram
D.SD Total
lo.
(l00%)
0-
0-
10
(100)
24 4 0. 2.8
(78%) (22%) - MO)11 0 0 13.
8 0 1 9
_(8s%), - (11 %)(100%)4
14 8 7 29(188 %) (28%) (218%) (100%)
(Rift poroontacas ors shown)
Marcy
Pratt/Motley
Tuttle
TransitionalProgram
Sr. HighProgr
SA +A D.SD Total
6(55%)
4
(36%)
1
(9%)
11
(100)
15 3 1 19
(79%) (16%) (5%) (100%)
9 1 0 10
(90) (10) - .X19141
4 2 3 9
(44%1 (22%) (33%) (2.00
8 7 14 29
(28%) (24%) (48%) (100%)
(Pow percentages are nhown)
Table 3 shows that people who showed satisfaction about their individual
school (Item 7) tended to show more satisfaction toward SEA as a whole (Item 8)
than did those who showed dissatisfaction with their school. In addition,
people who showed satisfaction toward SEA. as a whole tended to show more
satisfaction about their individual school than did those who showed dissatis-
faction toward SEA. This suggests that a person's feelings about his school
and SEA as a whole are related.
TAUB 3 (VW
Item 7 (Overall, I are aaticried with the warthe program at rot school is developing.)
BY Item 8_(Overall, am satisfied with the waythoSSA progrma as a whole is developing. r
Item 7
SAGA
t
8 10+D
Total
.38(83%)
(65%):
1(15%)
(50%)
.1
(2%)(9%)
46
(leO%)(55%)
12 Is 2 18(67%) (22%) (US) (100%)(20%) (29) (18%) (21%)
9 3 8 20(145%) (15%) (140%) (100%)(15%) (21%) (73%) (214)
59 14 11 84
(70%) (17%) (3.3%) (100%)(100%) (100%) (100%) (3.00%)
(In each cell, rev percentages are shownabove column percentages)
GRAPH 3.
ManagementTeam
llIl
InstructionalStaff
59% 6
SupportStaff
Item 3.0 (Agree that is major goals ofSEA have been made clear. )
- Item 11 (Agree that conscious effortbeing male to monitor pro -gross toward goals. )
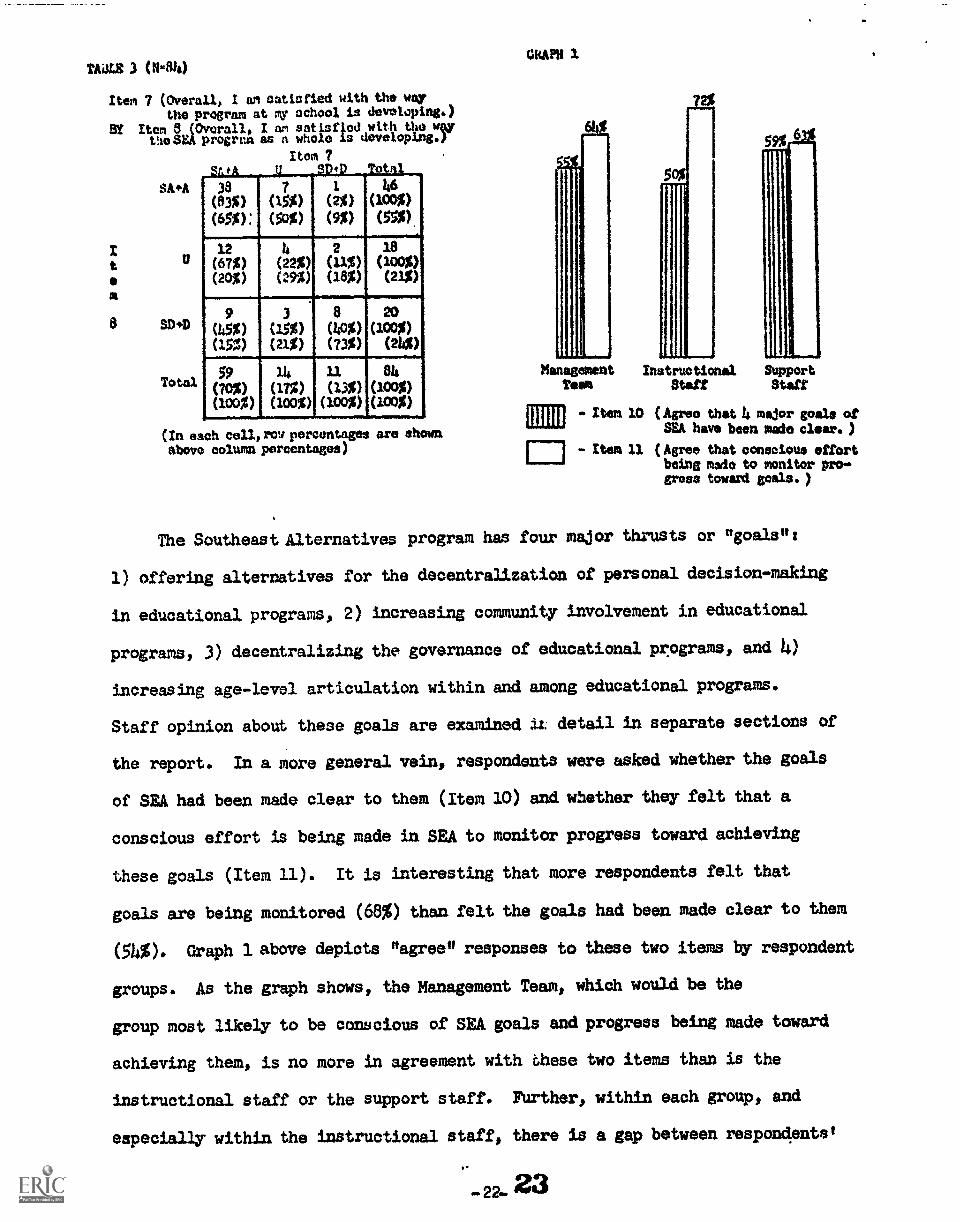
The Southeast Alternatives program has four major thrusts or "goals":
1) offering alternatives for the decentralization of personal decision-making
in educational programs, 2) increasing community involvement in educational
programs, 3) decentralizing the governance of educational programs, and h)
increasing age-level articulation within and among educational programs.
Staff opinion about these goals are examined IL detail in separate sections of
the report. In a more general vein, respondents were asked whether the goals
of SEA had been made clear to them (Item 10) and whether they felt that a
conscious effort is being made in SEA to monitor progress toward achieving
these goals (Item 11). It is interesting that more respondents felt that
goals are being monitored (68%) than felt the goals had been made clear to them
(54%). Graph 1 above depicts "agree" responses to these two items by respondent
groups. As the graph shows, the Management Team, which would be the
group most likely to be conscious of SEA goals and progress being made toward
achieving them, is no more in agreement with these two items than is the
instructional staff or the support staff. Further, within each group, and
especially within the instructional staff, there is a gap between respondents'
.
_22_23

own awareness of goals and feeling goals are being monitored. This suggests
that those respondents who do feel the goals are being monitored, especially
from the instructional staff, feel that "someone else" is doing the monitoring.
Table 4 shows the relationship between
feeling SEA goals have been made clear to
them (Item 10) and feeling satisfied with
the development of SEA as a whole (Item 8).
Of those people who feel, goals have been
made clear, 70% are satisfied with SEA as a
whole, while 14% are not'satisfied. Of
those who feel the goals have not been made
clear, 30% are satisfied with SEA, 30% are
uncertain, and 39% are dissatisfied with SEA. Thus, staff members who believe
that the goals have been clearly communicated to them tend to view the
development of SEA more positively than those who do not feel the goals were
made clear to them.
A general comment about staff knowledge is in order here. Items
pertaining to a number of groups which have been formed since the beginning
of Southeast Alternatives received a high percentage of "uncertain" responses,
as shown below:
TAUS 4 (N-92)
Item 10 (The four major goals of the SoutheastAlternative* project :Ave been made
clear to me.)
VT ItLm 8 (Overall, I am satisfied with the
way the SEA program as a whole
la developing.)run 8
SA.A II SOO) Total
tae
10 5D+D
35
00%)2(16%)
7(14%),
$0(10o%)
lo 4 5 19
(53:" (21%) (26%) (100%)
7 7 9 23
(30%) (30%) (39%) (100%)
(Row percentages are shown)
Range of percentages of
..qmai Items "uncertain" responses
Management Team 27-30 33% - 57%
Southeast Council 32-34 22% - 29%
school advisory/governance groups 46-48 30 - 43%
Level I Evaluation Team 23-25 21% - 32%
This would seem to indicate a need for more communication to staff members
about the roles and accomplishments of these groups. As Table 4 suggests,

there is very possibly a relationship between wets knowledge of SEA and his/her
satisfaction with the overall program.
Since SEA is part of the national Experimental Schools Program, SEA has
received considerable federal funding support for its various programs. Items
12 and 13 were designed to measure staff opinion on the impact of federal
money within SEA. Staff members overwhelmingly felt (Item 12) federal funds
have been good (87%) rather than not good (6%) for Southeast school programs.
Reactions to the effect of federal finding on staff relations were slightly
more mixed, however, with 15% of the staff feeling that the addition of
federal money had been detrimental to staff relations, and 68% feeling that the
money had not been detrimental.
Table 5 shows that the educational
support staff felt most strongly (84%)
that the money had not had negative effects,
chile 62% of the instructional staff and
only about half (55%) of the Management.
Team felt this way.
Table 6 shows the relationship between
responses to Item 13 and the school
program in which the respondent works.
-24-2,45
TABLE 5 (N-92)
Item 13 (The addition of the federal money hasbeen detrimental to Southeast staffrelationships)
BY Croup
Management
Team
InstructionalStaft
Si. Support
Staff
SA+A SH+D Total
136%)
1(51)
6(55%
11100%
8 11 31 50(16%) (22%) (62%) (100)
2 3 26 31
(6%) (10%) (84%) (100)
(Row percentages are ahem)
TAUS 6 (x .79)
Item 13 (The addition of the federal money has
been detrimental to Southeast staffrelationships.)
BY School Program
Marcy
Pratt/Motley
Tuttle
Transitional
Program
Sr. HighProgram
Total
1.
(9%)
3
(27%)
7
(614%)
11
(100%)
o 0 19 19
- - (106%) (100%)
1 9 1.1.
(9%) (9%) (82%) (100S)
3 1 % 9(33%) 0.1%) (56%) Iwo%)
7 7 15 29(24) (24) (52%) (103%)
(Row perecntscos aro shown)

SEA, as a sub-unit within the Minneapolis Public Schools, has a direct
relationship with the MPS administration and School Board. Three items examined
staff feelings about different aspects
istration and Board. The findings
from Item 72 show that 71% of the
respondents feel SEA should be kept
as a separate administrative area.
Staff members who are residents of
Southeast feel this more strongly.
(81%) than non-Southeast residents
(67%) as shown by the data in Table 7,
though the difference was not found
to be significant.
of this relationship with the MPS admin.
Taal (11-50)
/toe 72 (SSA is a unique enough program to justify
keeping Southeast a separate ROAM..trative area, at least until the fed*
era). funds empire.)
Al Residence of Respondents
The data in Table 8 shows that greater
percentages of the instructional staff
and support staff felt that SEA should be
kept separate administratively (72% and
78% respectively) than diu the Management
Team (45%), but again, the difference is
statistically non-significant. It should
be noted that shorte1y after the completion
of the survey in kid-March, the superintendent
non-Mpla.
Vie, Non-SS
ass.
SA + A V SD +D Total
25
(67%)
4
(11%)
0
(229'
37
(100%)
21 7 3 31
(67%) (23%) (10% )_ (100%)
10 1 3 22
(04) (5%) (1h%) (100%)
(Row percentages are shown)
TAMS 8 (11-90)
Item 72 (SSA is a unique enougr program tojustify keeping Southeast a sepwate
. administrative area, at least until
the federal funds expire.)
AY Group
ManagementTeam
InstructionalStaff
Bd. SupportStaff
SA+A SIPTI Total
5(40)
1(9%)
___-__-.--5(14%)
11(100%)
34 7 6 47
(72%) (15% (13%) (103%)
25 4 3 32
(78%) 1 1
(Row percentages are shout)
of Minneapolis Public Schools verbally indicated that the SEA area would be
incorporated into one of the three larger MPS areas, but not until fall, 1975,
a year later than was originally intended for this incorporation to take place.
This ext'nsion was primarily the result of a position paper submitted to the
superintendent by the Southeast Council, an advisory group to the SEA director
which includes a number of staff members.

Presumably, due to its experience of having designed and put into effect
experimental alternative educational programs, the SEA staff has had experiences
and gained information which could be useful to the MPS administration and
School Board in designing other alternative educational programs in the city.
Findings from Item 73 show that 29% of the staff members agree, 143% are
uncertain, and 28% disagree that Minneapolis Public Schools is making effective
use of what the SEA staff has learned.
When responses to this item are
analyzed by group as shown in Table 9,
responses are similarly mixed with the
Management Team slightly more certain
(48%) than either the instructional
staff (24%) or the support staff (31%)
that effective use is being made of
what SEA has learned. Responses to this
item were not found to depend upon the
TABLE %(N.89)
Item 73 (The Minneapolis Public Schoolsadministration and School Board aremaking effective use of what SEA staffmeinburs have learned from designingand running SEA experimental progress.)
BY Group
ManagementTeam
InstructionalStaff
Ed. SupportStaff
$A+A U 8040 Total
S
(146 %)
3
(27%)
3
(21%)
11
(100%)
11 22 13 46
(48%) (28%) (100%)_(24%)
10 13 9 32
(31%) (a%) (28%) (100%)
(Row percentages are shown)
school at which the respondent work.
A final item examining the SEA-MPS relationship asked whether the MPS
central administration gives adequate support to SEA (Item 31). Again,
reactions to this item were mixed, with 44% feeling MPS gives adequate support,
32% uncertain, and 24% disagreeing that adequate support is given. Group
responses to this item in Table 10 show that the Management Team is somewhat
more positive (84%) than either the instructional staff (1s2%) or the support
staff (38%) that MPS gives adequate support to SEA. As responses to both
Items 73 and 31 show, the Management Team, in general, feels slightly more
certain that the MPS administration and School Board are involved in positive
ways with SEA than do either the instructional staff or support staff. In
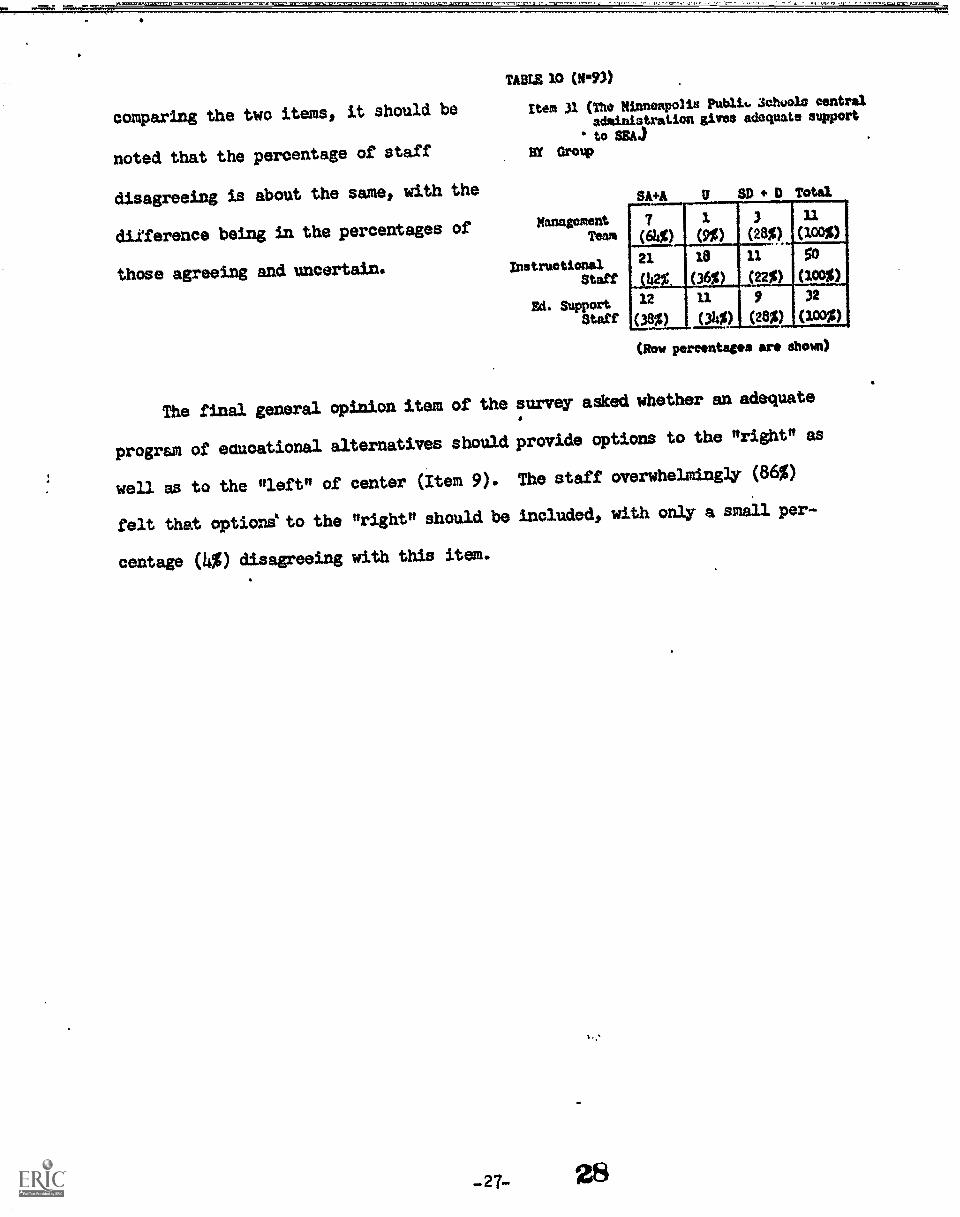
comparing the two items, it should be
noted that the percentage of staff
disagreeing is about the same, with the
di.LTerence being in the percentages of
those agreeing and uncertain.
TABLE 10 (M s93)
Item 31 (The Minneapolis FOIL. 3ehools central
administration gives adequate support
to SEAJ
BY Group
ManagementTess
InstructionalStaff
Ed. SupportStaff
S + U SD + D Total_,......._....7 3.
--,3 xi
(100%)
23. le 11 50
so (36%) (22%) (200%k
12 11 9 32
(38%) (314%) (28%) (100%)
(Row percentages are shown)
The final general opinion item of the survey asked whether an adequate
program of educational alternatives should provide options to the "right" as
well as to the "left" of center (Item 9). The staff overwhelmingly (86%)
felt that options` to the "right" should be included, with only a small per-
centage (4%) disagreeing with this item.

Alternatives For The Decentralization Of Personal Decision-Making
As the name implies, Southeast Alternatives is primarily dedicated to
offering all people (staff, parents, and students) choices as to how they will
fit into the SEA educational program. The findings from Item 14 show that of
the 73 respondents who work in school buildings, 63% agree that they were
given real choices about their assignment within the school, while about 30%
disagree.
Table 11 shows that feelings about having
this choice were more positive at some
schools than others. It should be stressed
a
that the word "alternativesff implies
differences. The differences on the table
should be interpreted as a reflection of
the variety among SEA programs as opposed to
a basis for judgment on the quality of
individual programs, as the higher degree
of flexibility built into some programs
TABLB 11 (H4457)
Item 14 (I was given the chance to make real
choices about air assignment in the SEA
school whore I am looatedJ
BY School Program
&my
Pratt/Haler
Tuttle
TransitionalProgram
Sr. HighProgram
SAM SD#E, Total
10
(91%)
0-
1.
(9%)
114001
(88%) (6%) (6%) (100%)
4 1 5 10
(40%) (10%) 50%) (100
2 .0 5 7
(29%) - (71%) (100%)
11 3 8 22
(50%) (1A%) (34) (100%)
(now pttretntocon ar" uhoun)
lends them more accomodating to staff choice of assignment.
An important factor in having choice is having the appropriate training
to be able to handle any one of a number of choices that might be available.
Findings from Item 16 show that one quarter of the staff members feel their
college preparation was not adequate for their SEA assignment.

Table 12 shows that feelings about this
differed from school to school, with Open
School staff being the most negative about
the adequacy of their college training.
TABLI 12 (m-710
Item 16 (kr undergraduate and/ r graduatebackground from college was an InadS.
quato preparation for the position
was assigned to in SSA.)
ST School Program
Ham
Pratt/Motley
Tuttle
TransitionalProgram
Sr. HighProgram
sA,A SH.D Total6 ,
(55%)
2
(18%)
4
(27%)
11
(100)
6 1 12 1,
(32/ (5%) (63%) (100%)
3 0 7 10
(30%) - (70%) (100%)
1 1 6 8
(13%) (13%) MO (100)
3 3 20 26
(12%) , (12%) (76%) MOO
(Row percentlicea arc shown)
It could be assumed that the uniqueness of SEA's school programs would
find some staff members less than adequately prepared for their assignment,
and the findings from Item 15 show that slightly over half of the staff members
(57%) feel they did not have an adequate background, and that only slightly
over half of those claim to have received additional training from SEA. Find-
ings from Item 17 show that of the 48 staff (53% of the total) responding who
were in a Southeast school when SEA began in fall, 1971, only two 04) had a
desire to leave but stayed because of a lack of desirable position opening
elsewhere.
Staff opinion on the opportunities for personal decision-making for others
indicates that most staff members (83%) feel students in SEA have a choice
between educational programs that.are distinctly different from each other
(Item 50). An important factor in community choice is having the appropriate
information about which alternatives are available. About 60% of the staff
members feel parents and students have access to the right kinds of information
(Item 51), with about 20% feeling the right kind of information is unavailable
and 20% remaining uncertain.

Commit; Involvement
SEA's goal of facilitating increased community participation in the schools
has two dimensions. Effort has been made to bring community people into the
schools to help in running school activities through the community volunteer
program. Findings from Item 35 show that 84% of the staff agree that SEA has
been more effective than a traditional educational program in getting
community members to participate in school programs, with half of those
expressing strong agreement.
The other area of community involvement is in making decisions about
school programs. Findings from Item 36 show that 75% felt positive about SEA's
effectiveness in bringing about this type of involvement.
No significant differences were found in
this item between schools, but Table 13
shows that staff members who are
Southeast residents were more positive
about SEA in this regard than were staff
who lived outside Southeast.
TABLE 13 (N .9D)
Item 36 (SEA has not been as effective as atranditional program in getting co*..munity members involved in deoision-making concerning school programs.)
BY Residence of Respondents
SE
ma.tEA
Non-Mpls.
SA+A U SD+D Total
1
(5%)
1
(5%)
19(90%)
23.
(100%)
4 2 26 32
(13%) (6%) (81%) (1 m%)
8 6 23 37(22%) (16%) (62%) (100%)
(Row percentages are swum)
Formal community involvement in decision-making is channeled through staff-
parent "advisory" or "governing" councils which serve each of the SEA schools
and a "Southeast Community Educational Council" which advises the SEA director.
Findings from Items 32-34 show that only 50% to 60% of the staff members are
pokitive about the Southeast Council in terms of the fairness of its represen-
tation, its ability to consider important issues, and its overall effectiveness,
with another quarter of the staff feeling uncertain. On the question of
overall effeCtiveness (Item 32) no significant differences were found between
YL

the three groups of respondents (Management Team, instructional staff, educational
support staff).
Findings from Items 4648 show that staff members are somewhat mixed in
their agreement on the effect that the advisory/governing group that serves
their school has on decision-making in the school, with about 3016-40% being
uncertain on each item. These items are analyzed in more detail in the section
on Decentralization of Governance (pp. 29.31).
Nearly all staff members (96%) felt that the community should be involved
in decision-making at least on the level of participating on advisory groups
(Item 37), with a little over half of those feeling that community members
should participate on actual decision-making bodies.
Table 14 shows that staff members at Marcy,
Pratt/Motley, and in the MUHS Transitional
Program are more in favor of the latter kind
of participation than are staff at Tuttle and
in the MUHS Senior High program.
TABLE 14 (M.73)Item 3? (To what degree should the com-
muniby.be involved in decision-making?)
BY Sohool Program
Mary
Pratt,'
Motley
Tuttle
Tran4tional
Program
Sr. NighProgram
Participationon recision-Makin Bodies
Participationon croupsThat AdviseDecision -
Makers
7(?8%)
2(22%)
9amp1.5 4 19
(7---2Vic)v:6
(6....._.
_.oi91_..L0046 1 7
(86%) (114 %) (100%)
6 22 28
(21%) (79%) (100%)
(Row percentages are shown)
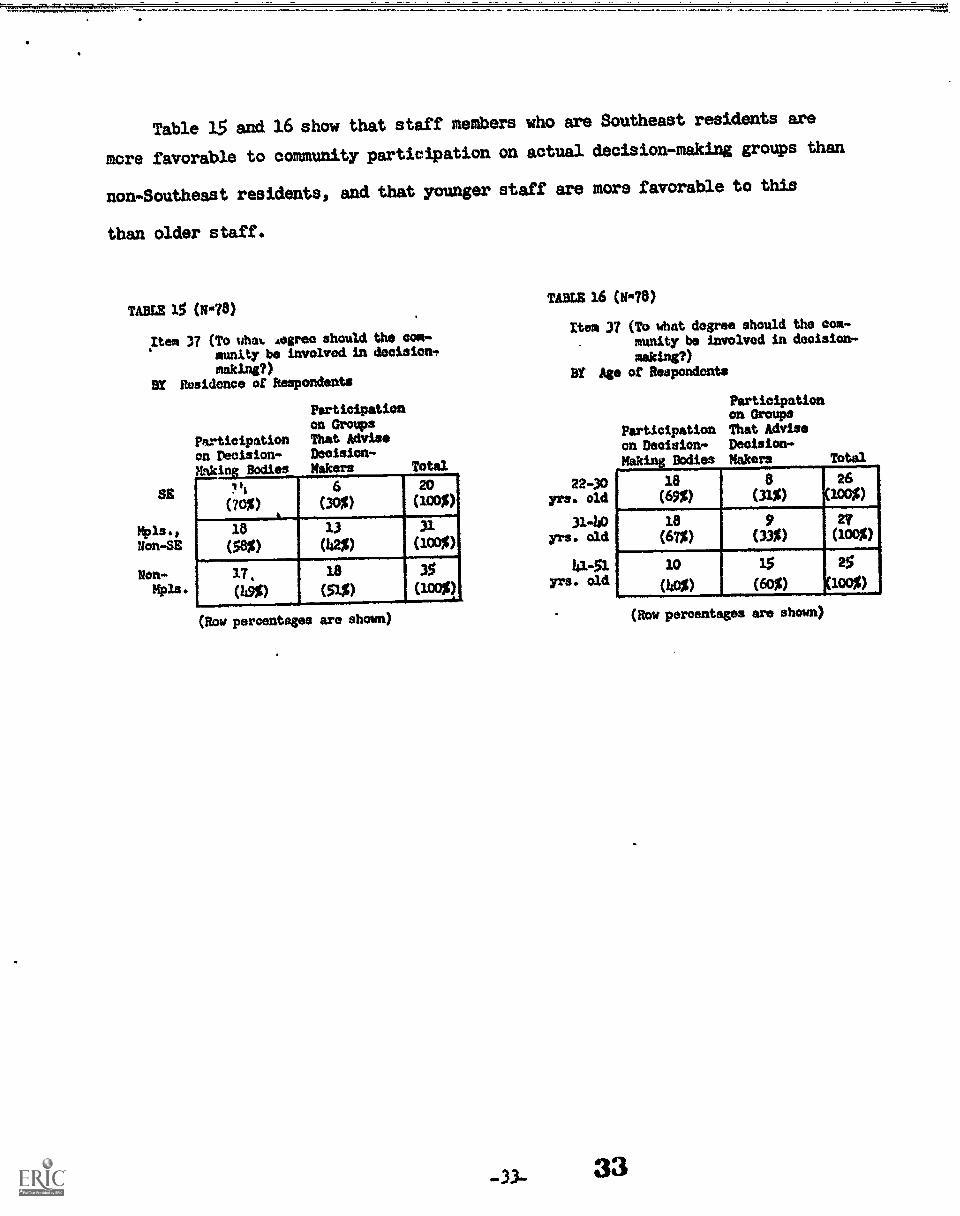
Table 15 and 16 show that staff members who are Southeast residents are
more favorable to community participation on actual decision-making groups than
non-Southeast residents, and that younger staff are more favorable to this
than older staff.
TABLE 15 (M "78)
pen 37 (To ehte, Agree should the cm-mity be involved in decision.making?)
BY Residence of Respondents
SE
Mpls.tion-SE
Non -
Mpla.
Participationon Deoision-Making Bodies
Participation(=GroupsThat AdviseDecision-Makers Total
? ti
(70%)
6
(30%)
20(100%)
16 13 31
(58%) (42%) (100%)
17, 18 35(19%) (51%) (mo)
(Bow percentages are shown)
TABLE 16 (N*78)
Item 37 (To what degree should the com-munity be involved in decision.
making?)BY Age of Respondents
22-30yrs. old
31-40yrs. old
41-51yrs. old
Participationon Decision -
Making Bodies
Participationon GroupsThat AdviseDecision.Makers Total
18(69%)
0(31%)
1 26(10o%)
18 9 27
(67%) (33%) (100%)
10 15 25
(40%) 00%) 1(loos)
(Row percentages are shown)

Decentralization of Governance
Governance is the process of .making decisions that will directly affect
the lives of others. Southeast Alternatives has attempted to include more
people in this process so that decision-making power is shared more widely.
The findings from Items 43-45 show that in three major domains of decision-
making in the schools (programs, staffing and budget), about 10% to 50% of
the respondents agreed that more staff members now share in the power to make
decisions in their schools than before SEA began, with 10% to 20% being uncertain,
abor 20% disagreeing and about 20% responding that the items did not apply to
them. Staff members were more positive about their power in the area of
program decisions than staffing or budget areas.
The data in Tables 17, 18 and 19 show that
the staff in certain Schools were more
positive about their power than staff in
other schools in the three decision-
making areas.
TA1IZIS 17 (N-68)
Item 43 (More start members now ehere in the
power to make decisions about programs
in my school than before SEA began.)
BY School Program
Marcy
Pratt/Motley
Tuttle
TransitionalProgram
Sr. HighProgram
SAilt SD+D Total9
(100%)
a
-
o
-
9
(100)
11 4 Q 15
(73%% (27%) - (100%)
3 5 / 9(33%) (56%) 41%) (100%4
7 3. 3. 9(78%) (31%) (31%) (100%)
12 6 8 26
.146 23 1% (514%)
(Row percostays arc shown)

TABLE 18 (N -67) TABLE 19 (R*69)
Item 44 (More staff members now share in thepower to make decisions about staffingin my school than before SEA began.)
BY School Program
Marcy
Pratt/Metier
Tuttle
TransitionalProgram
Sr. HighProgram
SA+A V SD+10 Total--
(100%) -0,
9
(1.00%)
11 3 0 14
(79%) (21%) - (100S)
2 4 3 9
(22%) (40) (334) (100%)
3 3 3 9
(33%) (34%) (33%) (100%)
6 9 11 26
(23%) (35%) (42%) (100%)
(Ruw perrontscus are ahown)
The data in Table 20 indicates that
staff who are positive about their power in
program decision-making (Item )43) tend
to be more positive about their school as
a whole than do those who are not positive
about their power. Similar findings held
true for Items 1414 and 45.
rum 45 (More staff members now share in thepower to make decisions about budgetallocations in my school than before .
SEA began.)BY School Program
Maroy
Pratt/Motley
Tuttle
TransitionalProgram
Sr. HighProgram
SA+A SD40 Total
a(89%)
1
(11%)
0-
9100%)
8 6 2 16
(50) (37%) (13%) 100%)
3 h 3 10
(30%) (40%) 100%)
14 3
,(30%)
2 9
(40) (33%) (22%) 100%)
10 7 8 25
(140%) (28%) (32%) 100%)
(Row percentages are ehown)
TABLE 20 (N.70)
Item 7 (Overall, I am satisfied with the warthe program at my school is developing.)
BY Item 43 (More staff members now share in thepower to make decisions about pro-grams in my school than before SEAbegan.)
t
a
143
SA+A
SD *)
SA+A
Item ?
SD +D Total
3?(86%)
lo(59%)
4 Ell(9%)
1911111111I
MIN
la(10os)
101.,
hho
(Row percentages are shown)
Staff opinion about the effect of the advisory/governing groups on decision-
making in the different schools was mired (Items 46-48), with the most positive
feelings being in the area of program decisions (Item 46).

Tables 21, 22 and 23 show that staff in
certain schools were more positive about
the effect of their advisory/governing group
than staff in other schools. Responses
from Marshall-II High staff are omitted due
to the fact that the NHS Advisory Council
was formed only about one month prior to the
survey.
TABLE 22 (N=76)
Item 47 (The parentstaff advisory/governinggroup that serves my school has asignificant effect on decisions eadeabout staffing at the school.)
Fir School Program
Marcy
Pratt/Motley
Tuttle
A, D D Total
3.0 10
(i00% - - (100 %)
12 5 2 19
(63%) (26%) (11%) (100%)
2
_ -_____---------..
2 7 11
(18;) (18 %) (61 %) (100%)
(Row percentages are shown)
TABLE 21 (11-75)
Item 46 (The parent-staff advisory/governinggroup that serves ny school hns asignificant effect on decisions madeabout the program at the sthool.)
BY School ProgramSAA V 80+D Total
Morey
Pratt/Motley
Tuttle
TABLE 23 (N.76)
8. 1 0 9
(89%) (11%) (100%)
9 6 4 19
(47r. (32%)_ (21$) (100$)
9 0 2 11
a a (18 %) (100%) )
(Row percentages are shorn)
Item he (The parent-staff advisory/governing groupthat serves my school has a significanteffect on decisions made about budget.allocations at the school.)
BY School Program
SA'A U 8D40 Total
Marcy
Pratt/Motley
Tuttle
8
(80%)
2
(20%)
0
-
10
(100%)
2 10 7. 19
(11%) ;52%) (37%) (100%)
5 2 4 11 1
(46%) '18%) (36%) (1001
(Row percentages are shown)
As was discussed in the section on Community Involvement (pp. 26-28),
findings from Items 36 and 37 show that a large majority of staff members
feel SEA has been effective in getting community members involved in decision-
making, though there is split feeling overall as to what degree of this
involvement is most appropriate.
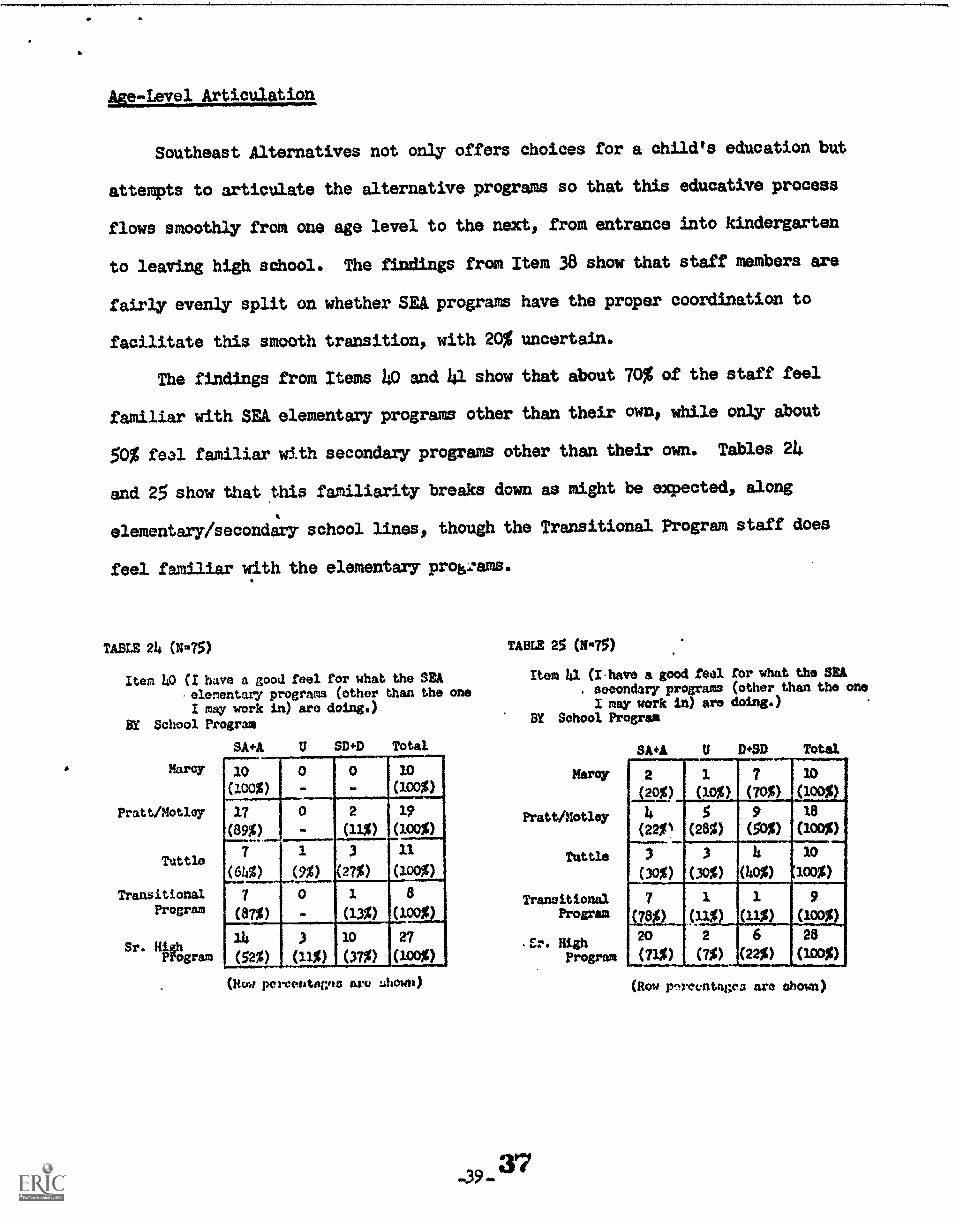
Age-Level Articulation
Southeast Alternatives not only offers choices for a child's education but
attempts to articulate the alternative programs so that this educative process
flows smoothly from one age level to the next, from entrance into kindergarten
to leaving high school. The findings from Item 38 show that staff members are
fairly evenly split on whether SEA programs have the proper coordination to
facilitate this smooth transition, with 20% uncertain.
The findings from Items 40 and 41 show that about 70% of the staff feel
familiar with SEA elementary programs other than their own, while only about
S0% feal familiar with secondary programs other than their own. Tables 24
and 25 show that this familiarity breaks down as might be expected, along
elementary/secondary school lines, though the Transitional Program staff does
feel familiar with the elementary prolszams.
TABLE 24 (N=7$) TABU! 25 ()t n15)
Item LO (I have a good feel for what the SEAe/ementary programs (other than the oneI may work in) aro doing.)
BY School Program
SA+A
Ham
Pratt/Hotloy
Tuttle
TransitionalProgram
Sr. HigProhgram
iJ SD+D Total
10 0-
0.
10
(100%)
17 0 2 19
(89%) - (11%) (100%)
7 1 3 11
(at%) (9%) (27%) (100%)
7 0 1 8
(87%) - (13%) (100%)
14 3 10 27
(52%) (11%) (37%) (100%)
(Itcret perceriti is 11E0 :4110W11)
Item 41 (Ihave a good feel for what the SIA.. secondary programs (other than the oneI may work in) are doing.)
BY School Program
Marcy
Pratt/Motley
Tuttle
TransitionalProgram
.Cr. ughProgram
Sk+A D+SD Total
2
p%)
1
(lc%)
7
(70%)
ID
(100)
4 5 9 18
(22%' (28%) (50%) (100%)
3 3 4 lc 1(30%) (30%) (40%) 100%)
7 1 1 9
17812._ (11% (11%) (100%)
20 2 6 28
(71%) (7%) (22%) (100%)
(Row pnreontages are ehown)

Over 70% of the staff members have visited three or more(other than their
own) of SEA's six school building (Item 39).
Table 26 data shows that people who
were negative towards SEA overall (Item 8)
tended to have visited fewer schools than
those who were positive towards SEA
overall.
The findings from Item'!t2 indicate that
over 80% of the staff members felt
more joint planning between elementary
and secondary staff was needed, with
Table 27 showing the school breakdown
on this factor.
TABLE 2§ (N488)
Item 39 (Hew maw of the SEA schools besidesyour own have you visited?)
4Y Item 8 (Overall. I as satisfied with the lig?the SSA program as a whole isdeveloping.)
Item 39 1-2 3 or morelschools schoolsVisited visited Total
SAM 12 39 S1
(24S) (76%) (10)t
(22%)
8 D.SD 9(47%)
24(70010
'53%)
18(100%)
1.9
100
(Row percentages are shore)
TABLE 27 (N474)
Item h2 (There is a need for more joint planningbetween staff members in elementary*programs and staff members in secondary
programs.)BY School Program'
5A+A
Marcy
Pratt/Motley
Tuttle
TransitionalProgram
Sr. HighProgram
U SDtD Total
9(100%
0-0 9(100%)
16 1 1 28
(88%) (6%) (6%) (100%)
8 0 2 10(80%) - (Mg) (100%)
8 0 1 9
(89%) - (14) (100%)
19 3 6 28
60) (11%) (21%) (100%)
(holy poreentaaes aro shown)
No relationship was found between feeling a need for more joint planning
(Item 42) and feeling that SEA. programs lacked the proper coordination (Item 38).

The Results for Students of SEA's Programs
Staff members were asked to rate five aspects of the programs in their
school compared to what they felt is available at non-SEA schools, and were
asked to make a non-comparative judgment on the disciplinary atActsphere in
their school. The findings from Items 52-57 shol that staff agreement on these
items varies between 40% and 64%, with the most agreement coming on the effect
of SEA on affective programs (Item 53) and helping students learn to work with
and respect each other (Item 57).
Tables 28 to 33 show the breakdown by school on each of these issues.
It should be stressed that most of these items call for a comparison of one's
program to other non-SEA programs, and thus disagreement could simply mean that
one felt his program to be on a par with other schools as opposed to less
effective.
TABLE 28 (N.75)
itom 52 (Thu SEA program at my school has producedproerans that do a batter job of teachingkids oognitivo skills than are availableat most Other (non-SEA)schools.)
BY School Program
Marcy
Pratt/Motley
Tuttle
TransitionalProgram
Jr. HighProgram
SAM U SD+D Total
5 4 o 9
(56%) (44%) - lop
11 3 5 19
(58%) (16%) (26%) (100%)
8 3 0 11
(73%) (27%) - (100%)
5 3 1 9
(56%) (33%) (11%) (100%)
14 6 7 27
(52%) (22%) (26%) (100%)
(Mu porcentsgos aro shown)
TABLE 29 (N%)
Item 53 (The SE program at my school hftm pro-duced programs that do a better Jobof fostering affective learning thanare available at most other (non-SSA)
schools.)BY School Program
Marcy
Pratt/Motley
Tuttle
TransitionalProgram
Sr. HighProgram
U SEOD Total
10
(100%)
0
-
0
-
10
(100)
13 3 3 19
(68%) (16%) (16%) (100%)
8
i73t)
3oil 0
-xl
(loop5 3 1 9
(56%) (33%) 11%) (100%)
12 9 6 27
(1J%) (33%) (22%) (100%)
(Row poroontagos are shown)

TABLE 30 (14016)
Item 54 (The SEA program at my school has hada positive effect on producing the kind
of disciplinary atmosphere I feel isappropriata for the school.)
Sr School Program
Mary
Pratt/Hotly
Tuttle
TransitionalProem*
Sr. HighProgram
SA11 V MD Total
0(1000 -
10
MOP10 4 5 19
(5211 (26%) (300)9 1 3. 11
(82%)...............--4-,--...4._.......(9%) (9%) (100%)
92 4 3
(22%) (45%) (331P (100)12 4 3.3. 27
(44%) (/.5%) (41%) (100%)
(now porcontagoa are shown)
TABLE 32 (P76)
Item 56 (The SEA program at my school has pro-duced programs which better servethe needs of minority students thanare available at most other schools.)
BY School Program
Marcy
Pratt/Motley
Tuttle
TransitionalProgram
Sr. High
Program
U D+D Total
5(50%)
5(50%) - 10C10%)
1(632%) (21%) (16%) (11900%)
3 6 2 13.
(27%) (55%) (18%) (103)
2 5 2 9(22%) 56%) 22%) 100%)
13 6 8 27
(48%) (22%) (30%) (100%)
(Row percontagua are obtain)
TAMS 31 (N -76)
Item 55 (The SEA program at gy school has pro..dulled program which bettor serve theneeds of students from low incomefamilies than are available at mostother schools.)
BX School Program
SA+A V
Hem
Pratt/Hotlmy
Tutu.
TransitionalProgram
Sr. HighProgr
SDiD Total
7.(70%)
3
(30%)
0-
10(100%)
11
(se%) (26%)
3(16%)
19
(100%)
4 5 2 11(36%) (18%) (100%)
4
.(46%)
4 1 --7--OW (WS) (12%) (100%)
8 9 10 27
pop (33%) ,S37%) (100%)
(Row percentages are chowm)
TABLE 33 (M -76)
Item 57 (The SEA, program at my school has pro-duced programs which better serve thepurpose of helping all students learnto work with'and respect each otherthan are available at most otherschools.)
BY School Program
Marcy
Pratt/Motley
Tuttle
TransitionalProgram
5ingrax
9
(90)1
(10%)
0-
10
(100%)
12 3 4. 19(63%) _13.M. 21%) (mo)
6 3 2 U(55%) (27%) (18%) (100%
3 3 .3 9(33%) (33%) (33%) (100%)
16 5 6 27(59%) (19%) (22%) (100%)
(Rog parcentagos are shown)

Table 34 shows that of the staff members agreeing that SEA programs do
a better job of teaching kids cognitive skills (Item 52), more are positive
about their school overall than are negative about their school (Item 7), but
that of those less positive about SEA's effect on cognitive skills, many are
still positive about their school overall. Similar findings held true for
Items 53-57, which makes it difficult to pin down any of the areas covered
as more significant than the others in determining a person's attitude about
the school he/she works in.
Table 34 (N*79)
Item 7 (Overall, I am satisfied with the waythe program at Ay school is developing.)
BY Item 52 (The SEA program At nr school hasproduced programs that do a better
te
52
SA +A
SD+D
job of teaching kids cognitiveskills than are available at mostother (non -SEA) schools.)
Item 7SA+A t1 SW/ Total
35
(83%)
2
(5%)
5(12%)
42
(10o%)
16 5 3 2J
(56%) (21%) (13%) (100%)
5 5 .3 13
(38%) (38%) (24%) (100%)
(Row percentages are shown)

. " .
ROSTER OF PEOPLE SURVEYED
SEA Mananement Team (N=12)
Glen EnosArt LakodukTony MorleyBill PhillipsBob SweeneyRon ClubbBetty Jo Zander
Jim KentFred MayenBecky LattimoreKen RuntadThai Kocher
green forme with labelo
Educational Support Staff (N=47) green forma
*K-12 Service Center* *Free School* *Teacher Center* *Tuttle*
Roy Almen Pat Korges Melissa Marks Evelyn Czaia
Don Rawitsch Bob DeBoor Charlotte Rogers Margaret Tuna
Gail Welsh Marion Mowry Phil Cagnetta Ken Jeddeloh
Rod French Jim Gambone Eleanor Felker Billie Jo Smith
Sally French Randy Johnson Roger Sandau
Diane Lassman Bruce Graff
Lois Erickson
*Marcy* *Motley* Margaret Shryer
Shirley Holdahl Bev Bachman David Manor
Jane Gawrarg.kiAlan Peabody
Judy FarmerJoan Williamson *Pratt*
Jan AndersonJoyce AndersonRuth Anne Aldrich
Nancy Walkup Cynthia RogersEleanor LarsonPhil LeBeauSuzy Gammell
*MUHS*Pat DavisRani KriebelJim SnaveleyIris KangasNadine BorchardtOtto WirgauRaabe_ SilmsaJeanetoe McInnesAndrew Pogoler

*Tuttle*Saundra HeppeIdonis McMullinKyrtle MurrayMary HydeLucy TeppenJanet BernstronYvonne BeselerJahn HendricksonBeth HagerCatherine ConnorsAdeline PleasantNancy MooersRobert ProsserKatherine Hendersen
George Canney
Felicia McCann
Katherine Henderson
Mike Sullivan
Bev CottmanWilliam L'HeraultMarcia CelustaRoss GreenBernard RobbinsSally BergenDagney WaldelandLeona HansonGeorge PattenHerbert GuertinLester TwedellJohn WaltherPatricia Jones
Thomas DoggettDeborah NelsonLester MickelsonPat ThayerNorman GlockDiane Dekas
Instructional Staff (164.47) yellow forms
*Marv*Marcia HudsonPeggy HunterBeth MackeyMartha GerritzMary Lou HartleyLaunaTrudie GustedCarol YoderMarilyn RisnesLynn WagenhalsStan BairdNancy McKinleyHarriet CapetzHazel Gregory
Greg Krueger
Susan Thomas
*Motley*Sandy Harris
Sharon HennemuthLaura MadsenShirley Jumellety-PicokensPat KnasiakRichard SilversteinViola SvenssonDavid HainesDorothy Anderson
*Marshall-University High School*
Robert WaggonerJoseph JockettyBob BakerArthur ChiodoLyle ChristensenSheridan JaecheMiriam KellyThomas KeljikSusan KairiesInez ToddJudy Devin.
Gordan WilcoxElla PeploeDean AkerEleanor Pass=Lucille DaleyJerome Bisek
Carole Russell
Wendy WestRodney WestRich OsterbergKathy EhgdahlDon BrundageMorrie Duenow
Barbara RodebergHoward Nordby
Mary Ann Rizzato
Andrew OstozeskiBill BanningMaryls HubbardPhyllis DalmanGary StromJohn WaldBart McDonoughMelvin HokeDennis CareyCarol HorswillGene LohmanJim SeedenArt FroehleJoan TeenerAnne DemuthDianne Chase
*Free School*
Carol SroufeEllen MeierSteve AberleBrenda GatesMark Nordell
*Pratt*Sylvia Hawk
Harriet Azemove
Audrey AllenBarb KyddJane BrawermanJoy DeHarporteGenvieve LeeGeorge NobelMyrna WenteJoan FehlanMarilyn Gigged-
quiet
Helen MoseCarol WogensenBarb OpalinskiRobert ManstonLou IacarellaCheck JacobsenArturo HerreraBarbara GundersonDon RybergRita DronePeter BastMarva WebsterEdward ProhafskyJean StancariJohn JurischBill GaslinRenee RavigJohn FreemanF. Wold
Ro-Anne Elliot
Jim Bpperly
Margaret Jones
Torn Odendahl
Rick WatsonAl Phelan
43


