Healthcare Predictive Analytics for Risk Profiling in Chronic Care: A Bayesian Multitask Learning Approach
Yu-Kai Lin (Flor ida State Universi ty)
Hsinchun Chen (Universi ty of Ar izona)
Randal l A. Brown (Southern Ar izona VA Health Care System)
Shu-Hsing Li (Nat ional Taiwan Universi ty)
Hung-Jen Yang (Stanford Universi ty)
5/27/2017 1Healthcare Predictive Analytics for Risk Profiling in Chronic Care

Background
Healthcare Predictive Analytics for Risk Profiling in Chronic Care: A Bayesian Mult itask Learning Approach
5/27/2017 Healthcare Predictive Analytics for Risk Profiling in Chronic Care 2

How to improve chronic care?
5/27/2017 Healthcare Predictive Analytics for Risk Profiling in Chronic Care 3
Chronic Care ModelBodenheimer et al. (2002)
Chronic Disease ControlBrownson and Bright (2004)
“Technovigilance”Dixon-Woods et al. (2013)
• Community Resources and Policies
• Health Care Organization
• Self-management Support
• Delivery System Design• Decision Support
• Clinical Information Systems
Data and science-driven
decision-making
If one consistent message has
emerged from the literature on
improving quality and safety in
health care, it is that high-quality
intelligence is indispensable.
Healthcare analytics for clinical intelligence
5/27/2017 Healthcare Predictive Analytics for Risk Profiling in Chronic Care 4
Healthcare Analytics ⇔ Business Analytics in Healthcare
• Marketers vs. Clinicians (Fichman et al. 2011)
− Marketers:
◦ Consumer profiling for targeted marketing
◦ How likely a particular consumer will click an ad link, download an app, respond to a coupon, …
− Clinicians:
◦ Patient profiling for personalized care
◦ How likely a particular patient will develop a complication, experience an adverse medical event, respond to a treatment, …
Health analytics using EHR data
5/27/2017 Healthcare Predictive Analytics for Risk Profiling in Chronic Care 5
• Healthcare predictive analytics using electronic health records (EHRs) is a promising IS research direction
• Fichman, Kohli & Krishnan (ISR 2011: Healthcare IS)
“Using digital technology to enable
new kinds of mathematical
healthcare modeling … and how
they should be integrated with
electronic health records warrants
future research attention.”
• Chen, Chiang & Storey(MISQ 2012: BI & Analytics)
“Over the past decade, electronic
health records have been widely
adopted in hospitals and clinics
worldwide. Significant clinical
knowledge and a deeper
understanding of patient disease
patterns can be gleaned from such
collections.”

Research motivation
5/27/2017 Healthcare Predictive Analytics for Risk Profiling in Chronic Care 6
• Chronic Diseases (CDs) in the US
− Half of all adults (117 million people) had one or more CDs
− 86% of the nation’s health care costs are for treating CDs
− Seven of the top 10 causes of death in 2010 were CDs
− Maps on the prevalence of diagnosed diabetes:
1994 2000
<4.5% 4.5%–5.9% 6.0%–7.4% 7.5%–8.9% >9.0%
2014
Data source: https://www.cdc.gov/chronicdisease/
Research motivation (cont.)
5/27/2017 Healthcare Predictive Analytics for Risk Profiling in Chronic Care 7
• Patients with chronic diseases are often at risk for multiple complications
− Diabetes � stroke, heart attack, kidney failure, eye problems, and so on
• Surprisingly, almost all the existing clinical risk models are designed to focus on only a single outcome.
− Diabetes � stroke
− Diabetes � heart attack
− Diabetes � kidney diseases

Single-Task Learning (STL)
5/27/2017 Healthcare Predictive Analytics for Risk Profiling in Chronic Care 8
• In the usual approach, each event is modeled independently:
Predict Event 1
Predict Event 2
Predict Event K
logit �� = � + �� ���
��
logit �� � = � � + ��� ���
��…
logit �� � = � � + ��� ���
��
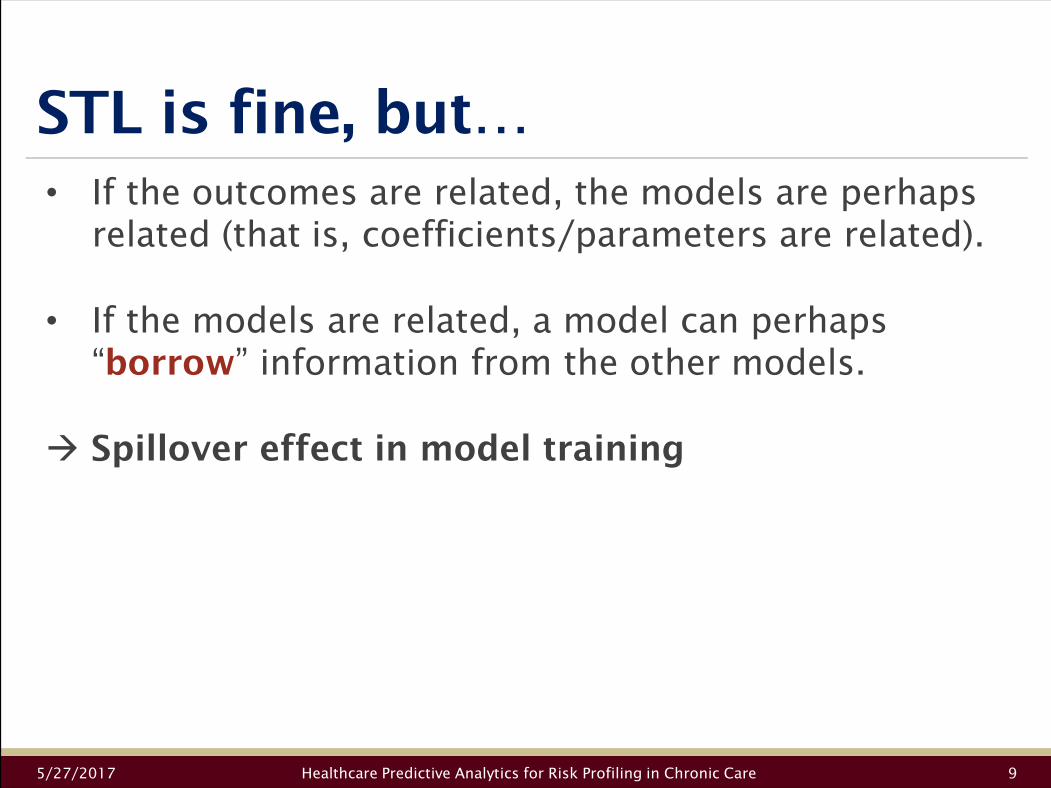
STL is fine, but…
5/27/2017 Healthcare Predictive Analytics for Risk Profiling in Chronic Care 9
• If the outcomes are related, the models are perhaps related (that is, coefficients/parameters are related).
• If the models are related, a model can perhaps “borrow” information from the other models.
� Spillover effect in model training
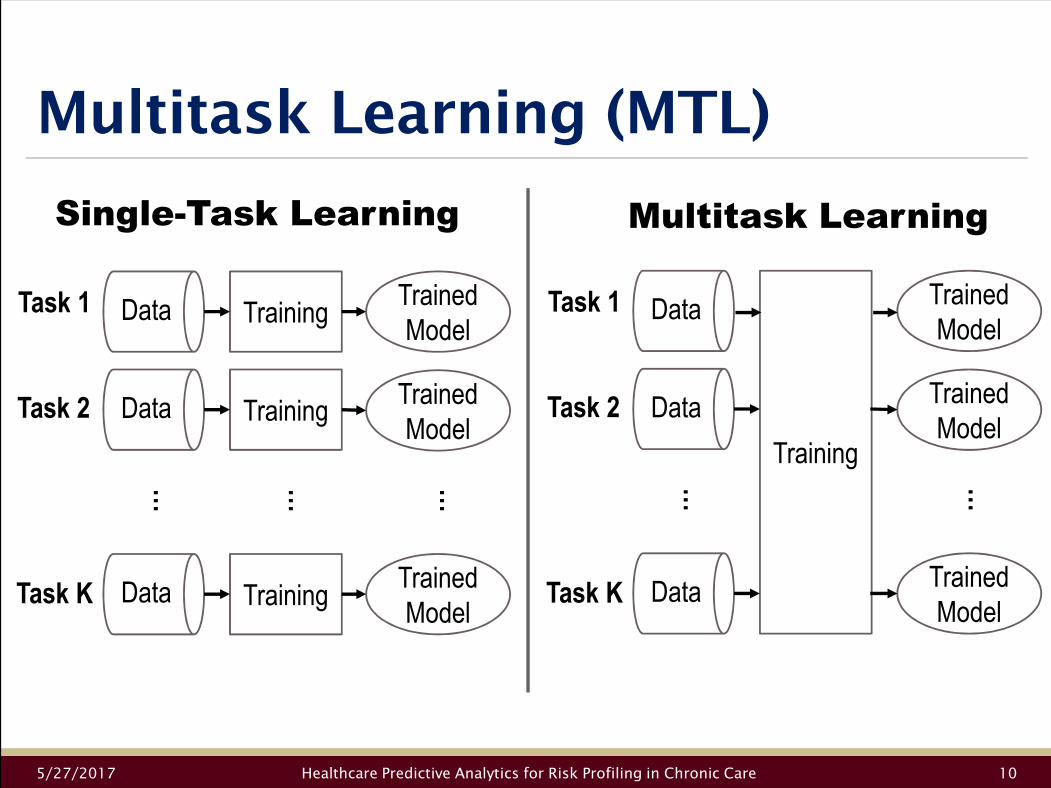
Multitask Learning (MTL)
5/27/2017 Healthcare Predictive Analytics for Risk Profiling in Chronic Care 10
Task 1
Task 2
Task K
Data
Data
Data
Training
Training
Training
Trained
Model
Trained
Model
Trained
Model
… … …
Task 1
Task 2
Task K
Data
Data
Data
Training
Trained
Model
Trained
Model
Trained
Model
… …
Single-Task Learning Multitask Learning

Research questions & relevance
5/27/2017 Healthcare Predictive Analytics for Risk Profiling in Chronic Care 11
• We are interested in studying:
− What are a patient’s risks to an array of events?
− How can we model multiple risks simultaneously?
− Does simultaneous learning of multiple event risks improve overall predictive performance of each event risk?
• Relevance to Information Systems (IS) research
− Healthcare IS (Fichman et al. 2011; Bardhan et al. 2014)
− Predictive analytics (Shmueli and Koppius 2011)
− Design science (Hevner et al. 2004; Gregor and Hevner 2013)
Model Development
Healthcare Predictive Analytics for Risk Profiling in Chronic Care: A Bayesian Mult itask Learning Approach
5/27/2017 Healthcare Predictive Analytics for Risk Profiling in Chronic Care 12
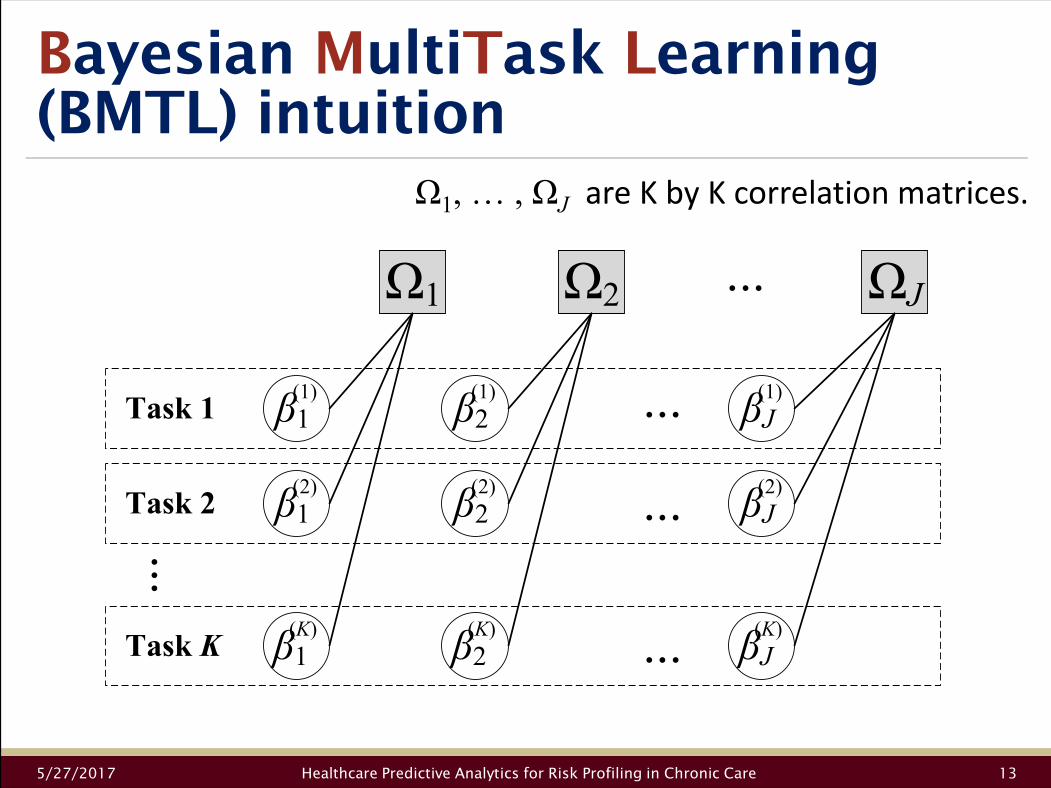
Bayesian MultiTask Learning (BMTL) intuition
5/27/2017 Healthcare Predictive Analytics for Risk Profiling in Chronic Care 13
Ω1, … , ΩJ are K by K correlation matrices.
Ω1
(1)
Ω2 ΩJ
(1) (1)
(2) (2) (2)
(K) (K) (K)
...Task 1
Task 2
Task K
β1
β1
β1
β2
β2
β2
βJ
βJ
βJ
...
...
...
...

Bayesian Analysis
5/27/2017 Healthcare Predictive Analytics for Risk Profiling in Chronic Care 14
� �|� = � �, �� � = � �|� � �
� �� �|� ∝ � �|� � �
• � is a random variable of interest; D is observed data
• We have a prior subjective belief about � � � �[as a part of model specification]
• We update our prior belief with the data to form posterior beliefs about � � � �|�[at a result of model fitting]
Bayes Rule:

Model Spec.
5/27/2017 Healthcare Predictive Analytics for Risk Profiling in Chronic Care 15
Para-
meter
Distribution/Function Form and
Supporting Reference
���� Cauchy distribution (Gelman et al. 2008):
����~Cauchy�0, 10� � Multivariate normal (MVN) distribution with
the horseshoe prior (Carvalho et al. 2010):
� = �� , ��� , … , ���"
�~MVN $, %���%� Horseshoe prior (Carvalho et al. 2010):
%� = '�('� , (~Half-Cauchy�0,1�
Σ� Covariance matrix (Barnard et al. 2000)
Σ� = diag +� ∗ Ω� ∗ diag +�+� = .� , .� � , … , .� �
"
.� � Half-Cauchy distribution (Gelman et al. 2008):
.� � ~ Half-Cauchy�0, 2.5�Ω� Lewandowski, Kurowicka and Joe (LKJ, 2009):
Ω�~LKJ 2, 1
Note for the table: The index j ranges from 1 to J
(the total number of predictors), and the index k
ranges from 1 to K (the total number of tasks).
JK
σ Ω
Σ
β
τ
rψ
K
θ
N
αK
Model fitting
5/27/2017 Healthcare Predictive Analytics for Risk Profiling in Chronic Care 16
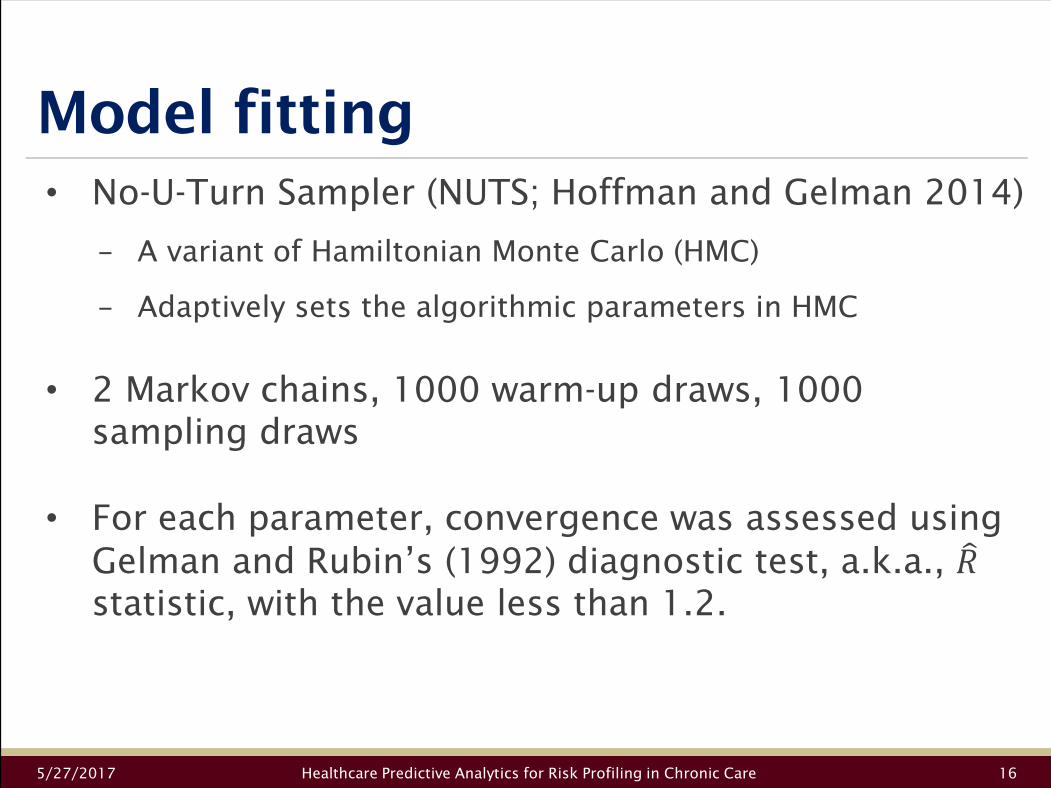
• No-U-Turn Sampler (NUTS; Hoffman and Gelman 2014)
− A variant of Hamiltonian Monte Carlo (HMC)
− Adaptively sets the algorithmic parameters in HMC
• 2 Markov chains, 1000 warm-up draws, 1000 sampling draws
• For each parameter, convergence was assessed using Gelman and Rubin’s (1992) diagnostic test, a.k.a., 34statistic, with the value less than 1.2.
Evaluations
Healthcare Predictive Analytics for Risk Profiling in Chronic Care: A Bayesian Mult itask Learning Approach
5/27/2017 Healthcare Predictive Analytics for Risk Profiling in Chronic Care 17
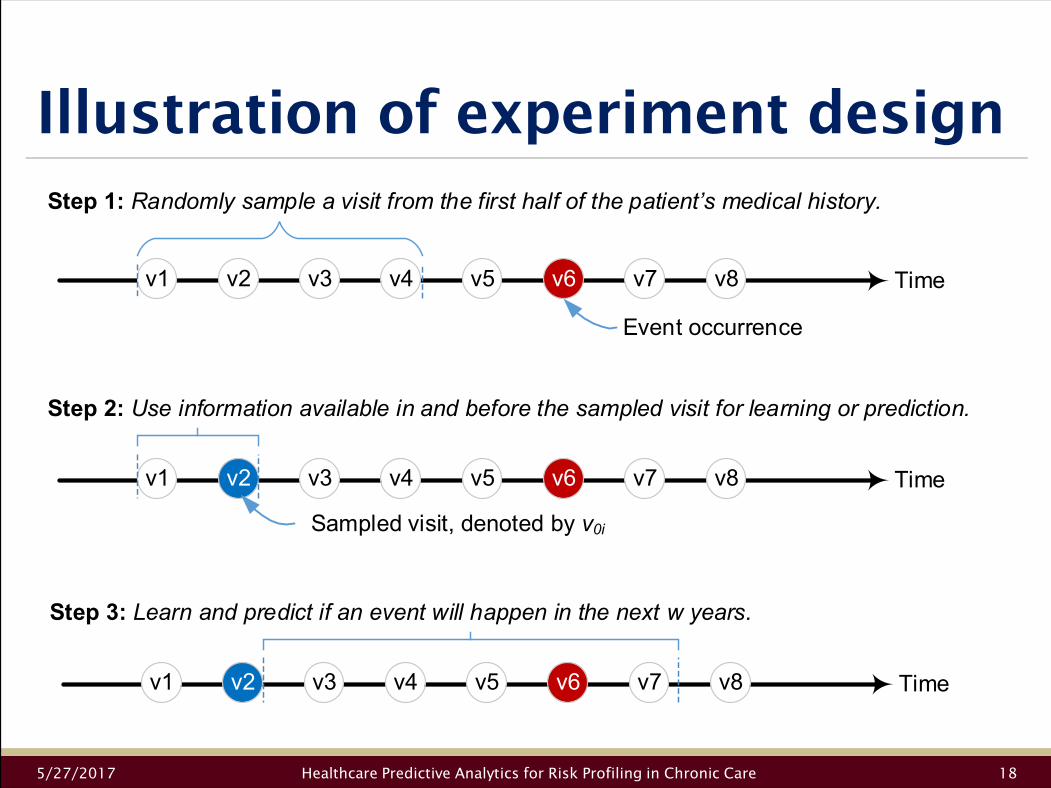
Illustration of experiment design
5/27/2017 Healthcare Predictive Analytics for Risk Profiling in Chronic Care 18
v1 v2 v3 v4 v5 v6 v7 v8 Time
Step 1: Randomly sample a visit from the first half of the patient’s medical history.
v1 v2 v3 v4 v5 v6 v7 v8 Time
Step 2: Use information available in and before the sampled visit for learning or prediction.
v1 v2 v3 v4 v5 v6 v7 v8 Time
Step 3: Learn and predict if an event will happen in the next w years.
Event occurrence
Sampled visit, denoted by v0i

Summary of data
5/27/2017 Healthcare Predictive Analytics for Risk Profiling in Chronic Care 19
• 14,752 adult patients with type 2 diabetes
• Events / Complications
− stroke (henceforth denoted by STK), acute myocardial infarction (AMI; aka, heart attack), and acute renal failure (ARF)
− Exclude patients with all three events occurred before v0i
Before v0i
During v0i and v0i + w yearsAfter v0i + 5
w = 1 w = 2 w = 3 w = 4 w = 5
STK 1507 354 560 685 793 828 47
AMI 485 75 146 178 210 225 20
ARF 410 217 399 488 536 571 37

Variables in our analysis
5/27/2017 Healthcare Predictive Analytics for Risk Profiling in Chronic Care 20
• 179 variables in total
− Missing values are imputed using the column mean
• Examples
Category Example Variables
Patient information Age, body weight, male, smoking
Diagnoses Three digit ICD-9 codes, e.g., 401 for essential
hypertension and 427 for cardiac dysrhythmias
Treatments Aspirin, clopidogrel, insulin, isoket, metformin
Labs and exams CT scan, low-density lipoprotein cholesterol, serum
creatinine, systolic blood pressure
Note: ICD-9=International Classification of Diseases, Ninth Revision

Three sets of evaluations
5/27/2017 Healthcare Predictive Analytics for Risk Profiling in Chronic Care 21
1. BMTL vs. single task learning approaches
2. BMTL vs. other multitask learning approaches
3. Counterfactual analysis of practical use
Evaluations 1 and 2
5/27/2017 Healthcare Predictive Analytics for Risk Profiling in Chronic Care 22
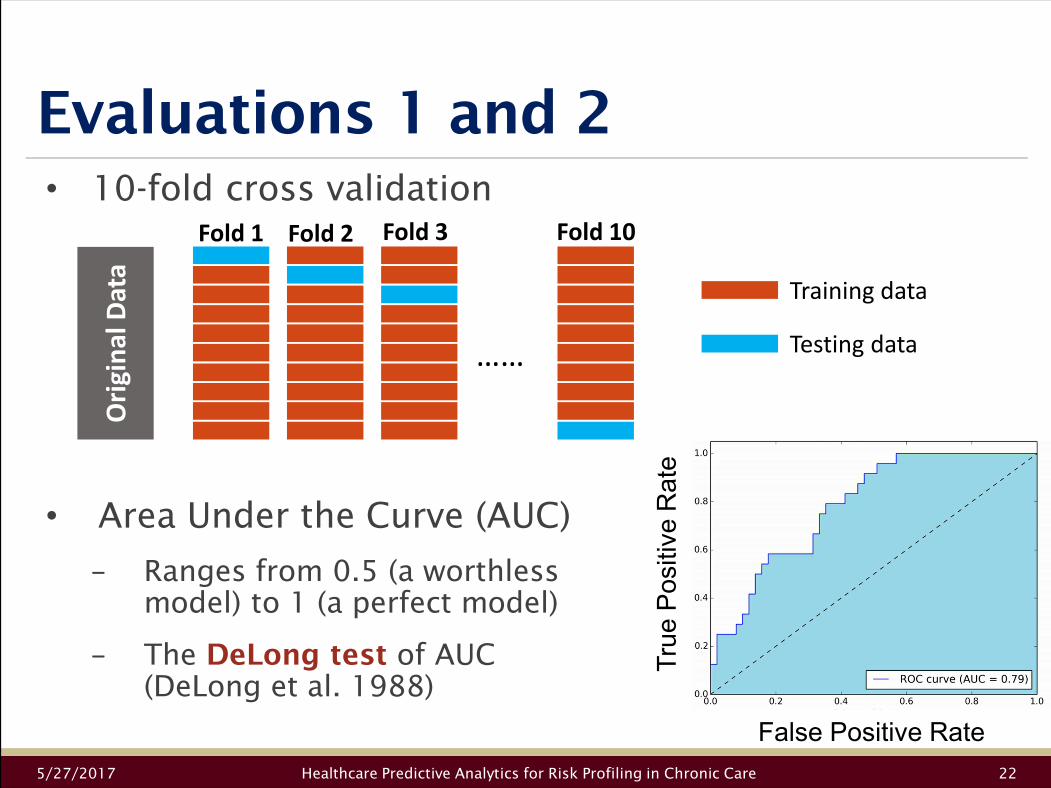
• 10-fold cross validation
• Area Under the Curve (AUC)
− Ranges from 0.5 (a worthless model) to 1 (a perfect model)
− The DeLong test of AUC (DeLong et al. 1988)
Testing data
Training data
Fold 1 Fold 2 Fold 3 Fold 10
……
Ori
gin
al
Da
ta
Tru
e P
ositiv
e R
ate
False Positive Rate

Evaluation 1 (AUC; 10-fold CV)BMTL vs. STL approaches
5/27/2017 Healthcare Predictive Analytics for Risk Profiling in Chronic Care 23
Window
(w)
Task
(k)
Models
BMTL-Logit B-Logit Logit Logit-lasso
1 STK 0.747 0.725*** 0.723*** 0.735***
1 AMI 0.778 0.744*** 0.729*** 0.758**
1 ARF 0.863 0.855* 0.847** 0.849***
3 STK 0.742 0.724*** 0.722*** 0.728***
3 AMI 0.736 0.703*** 0.699*** 0.704***
3 ARF 0.833 0.823*** 0.819*** 0.823***
5 STK 0.739 0.724*** 0.723*** 0.727***
5 AMI 0.727 0.699*** 0.698*** 0.704***
5 ARF 0.820 0.812*** 0.809*** 0.814***
Note. Bolded values highlight the best AUC result in a row.
*** The AUC result is statistically significantly different from BMTL-Logit at α = 0.01.
** The AUC result is statistically significantly different from BMTL-Logit at α = 0.05.
* The AUC result is statistically significantly different from BMTL-Logit at α = 0.1.
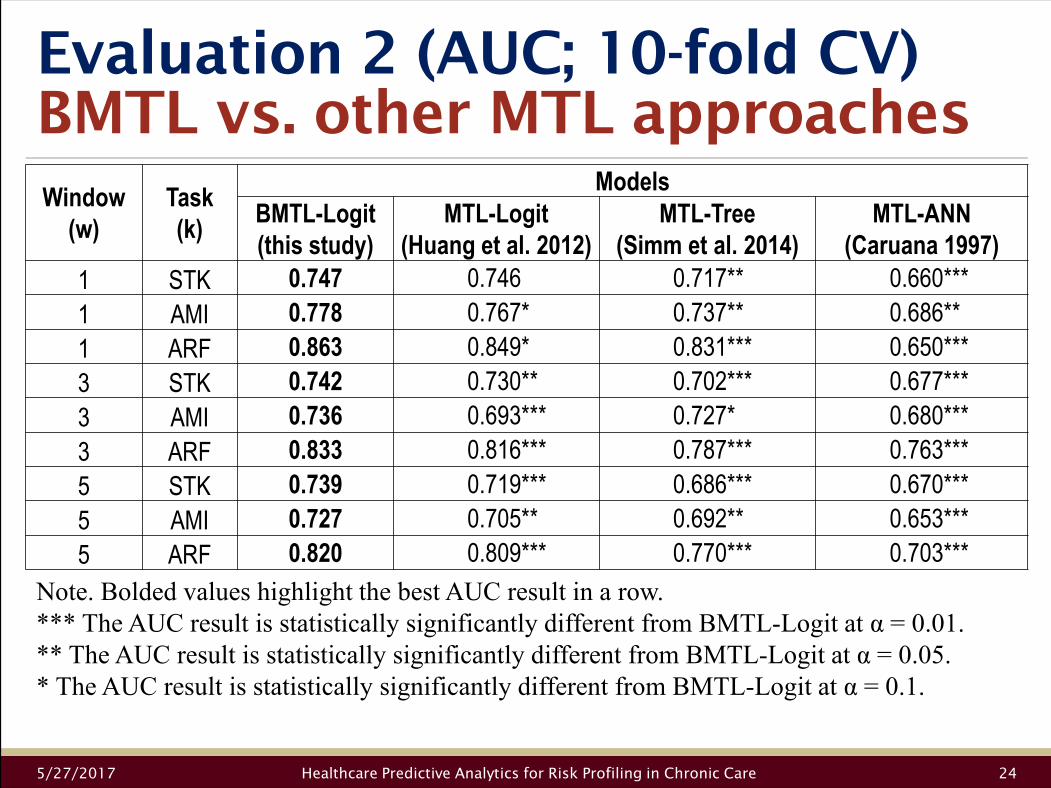
Evaluation 2 (AUC; 10-fold CV)BMTL vs. other MTL approaches
5/27/2017 Healthcare Predictive Analytics for Risk Profiling in Chronic Care 24
Window
(w)
Task
(k)
Models
BMTL-Logit
(this study)
MTL-Logit
(Huang et al. 2012)
MTL-Tree
(Simm et al. 2014)
MTL-ANN
(Caruana 1997)
1 STK 0.747 0.746 0.717** 0.660***
1 AMI 0.778 0.767* 0.737** 0.686**
1 ARF 0.863 0.849* 0.831*** 0.650***
3 STK 0.742 0.730** 0.702*** 0.677***
3 AMI 0.736 0.693*** 0.727* 0.680***
3 ARF 0.833 0.816*** 0.787*** 0.763***
5 STK 0.739 0.719*** 0.686*** 0.670***
5 AMI 0.727 0.705** 0.692** 0.653***
5 ARF 0.820 0.809*** 0.770*** 0.703***
Note. Bolded values highlight the best AUC result in a row.
*** The AUC result is statistically significantly different from BMTL-Logit at α = 0.01.
** The AUC result is statistically significantly different from BMTL-Logit at α = 0.05.
* The AUC result is statistically significantly different from BMTL-Logit at α = 0.1.

Evaluation 3Counterfactual analysis
5/27/2017 Healthcare Predictive Analytics for Risk Profiling in Chronic Care 25
• Prediction of risk is not enough—we need evidence that
prediction can lead to actions that reduce risk beyond what
would occur without the prediction rule. (Grady and Berkowitz 2011)
− How to assess the practical value of a predictive model without actual use?
− Assumption for our counterfactual analysis:
Physicians will always provide guideline-recommended
preventive interventions if they believe a patient has a high
risk of STK/AMI/ARF.
− Among the positive cases (patients with the STK/AMI/ARF events between v0i and v0i + 5 years), what happened to them and what could happen to them given a prediction rule.

Evaluation 3Counterfactual analysis
5/27/2017 Healthcare Predictive Analytics for Risk Profiling in Chronic Care 26
• Guideline-recommended preventive treatments
− Source: “Diabetes Comprehensive Care Plan Guidelines” from the American Association of Clinical Endocrinologists
Comorbidity Preventive Treatment
STK • Antihypertensive agents
• Antiplatelet therapy
AMI • Antihypertensive agents
• Antiplatelet therapy
• Lipid lowering therapy
ARF • Antihypertensive agents
• Angiotensin receptor blockers
• Angiotensin-converting-enzyme inhibitors
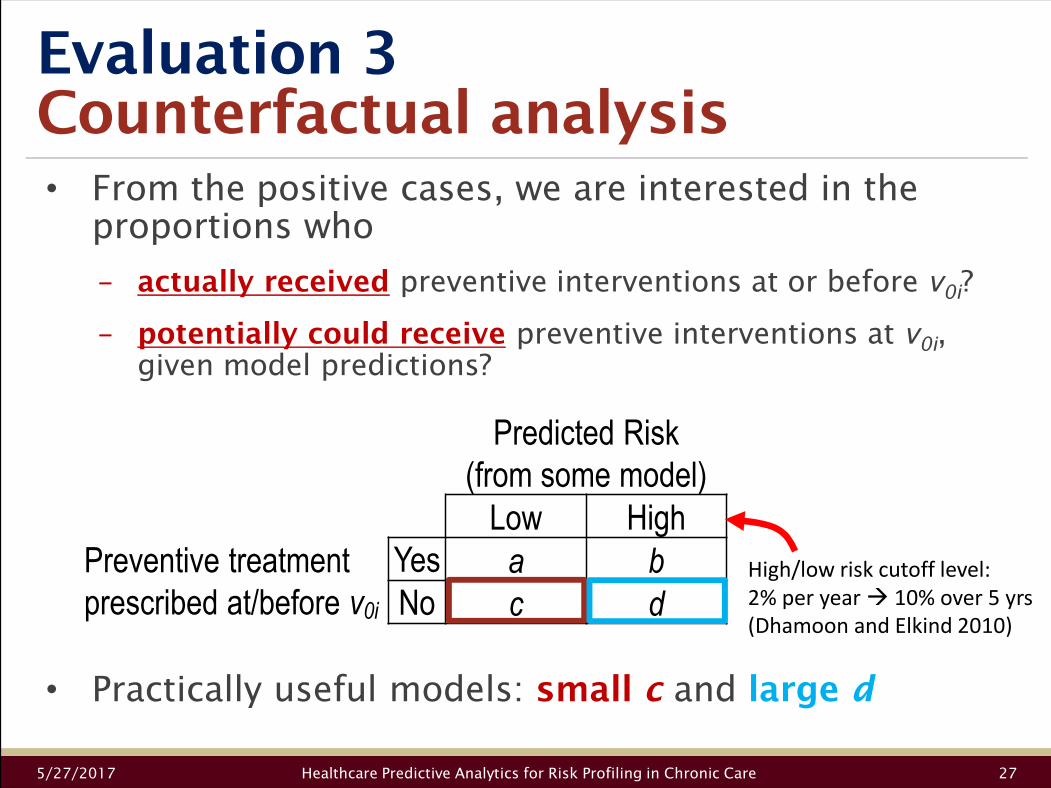
Evaluation 3Counterfactual analysis
5/27/2017 Healthcare Predictive Analytics for Risk Profiling in Chronic Care 27
• From the positive cases, we are interested in the proportions who
− actually received preventive interventions at or before v0i?
− potentially could receive preventive interventions at v0i, given model predictions?
• Practically useful models: small c and large d
Predicted Risk
(from some model)
Low High
Preventive treatment
prescribed at/before v0i
Yes a b
No c dHigh/low risk cutoff level:
2% per year � 10% over 5 yrs
(Dhamoon and Elkind 2010)

Evaluation 3Summary of results
5/27/2017 Healthcare Predictive Analytics for Risk Profiling in Chronic Care 28
A lower c (making fewer mistakes) is better
A higher d (supporting physicians) is better
Conclusions
Healthcare Predictive Analytics for Risk Profiling in Chronic Care: A Bayesian Mult itask Learning Approach
5/27/2017 Healthcare Predictive Analytics for Risk Profiling in Chronic Care 29

Conclusions
5/27/2017 Healthcare Predictive Analytics for Risk Profiling in Chronic Care 30
• The proposed BMTL approach outperforms the alternative models in risk profiling, and could support physicians to identify high risk patients.
• Multitask learning improves overall learning performance by sharing information across models
− Evidence for the spillover effect in model training
• Beyond healthcare
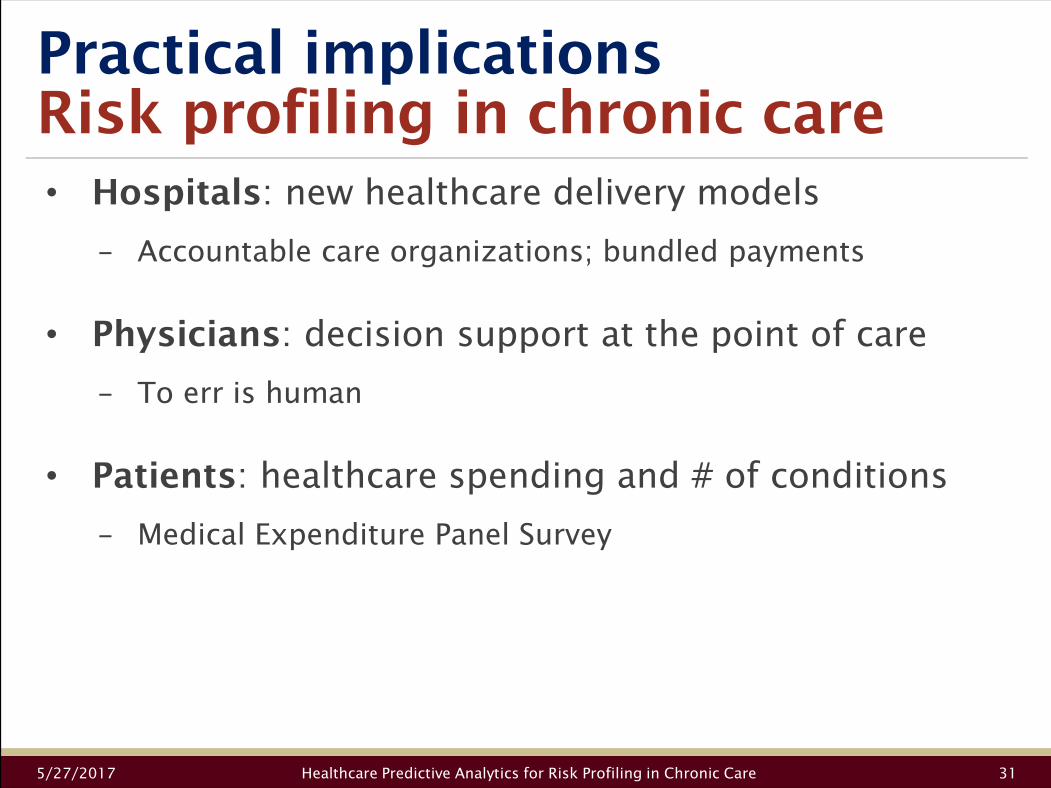
Practical implicationsRisk profiling in chronic care
5/27/2017 Healthcare Predictive Analytics for Risk Profiling in Chronic Care 31
• Hospitals: new healthcare delivery models
− Accountable care organizations; bundled payments
• Physicians: decision support at the point of care
− To err is human
• Patients: healthcare spending and # of conditions
− Medical Expenditure Panel Survey

To error is human
5/27/2017 Healthcare Predictive Analytics for Risk Profiling in Chronic Care 32
• Building a better health system with IT and analytics

Thank you
Please send comments to Yu-Kai Lin
5/27/2017 33Healthcare Predictive Analytics for Risk Profiling in Chronic Care


