HFT 2403
Chapter 5
The Income Statement
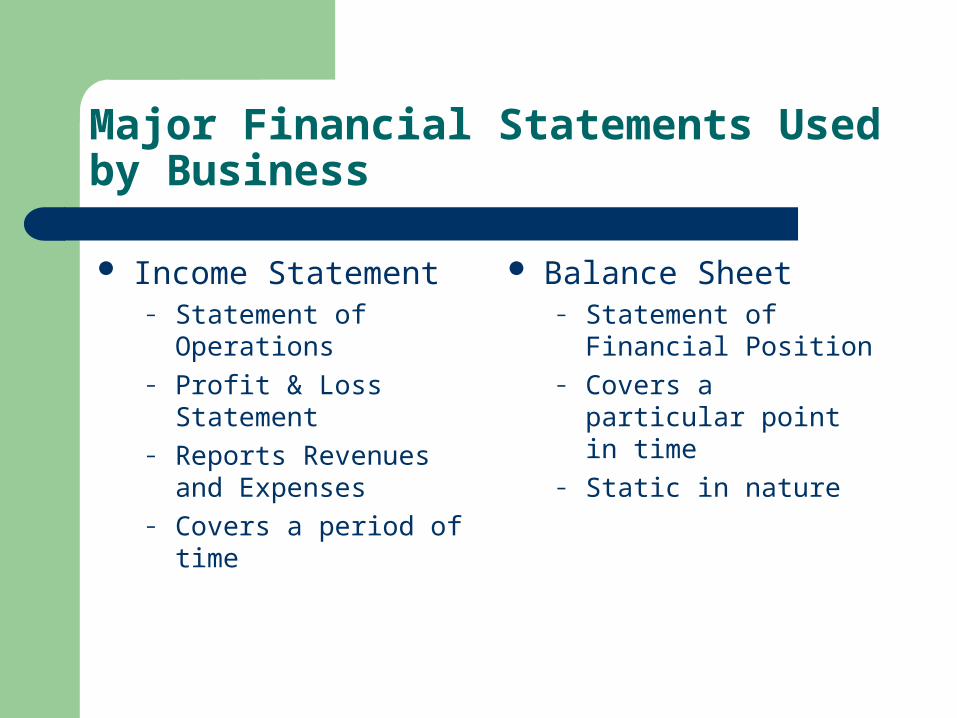
Major Financial Statements Used by Business
Income Statement– Statement of Operations– Profit & Loss Statement– Reports Revenues and
Expenses– Covers a period of time
Balance Sheet– Statement of Financial
Position– Covers a particular point
in time– Static in nature
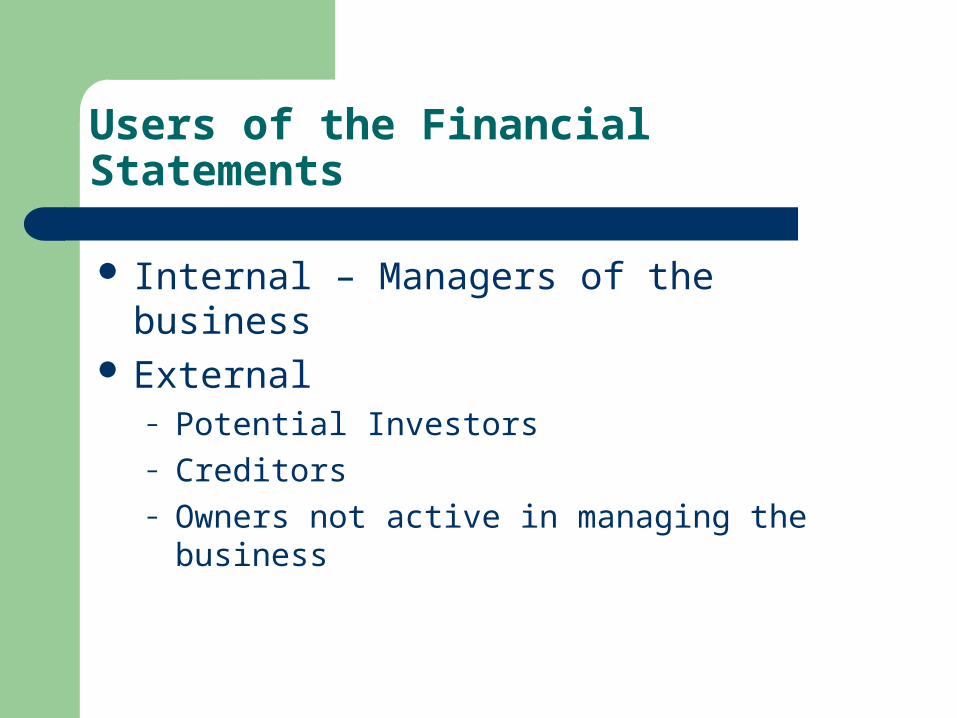
Users of the Financial Statements
Internal – Managers of the business External
– Potential Investors– Creditors– Owners not active in managing the business
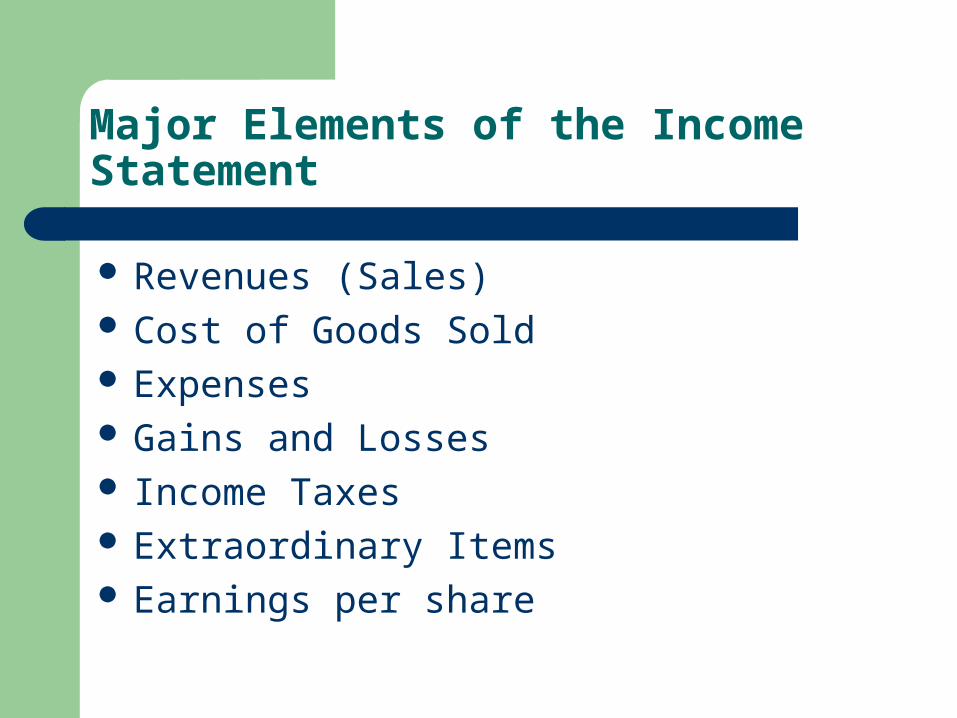
Major Elements of the Income Statement
Revenues (Sales) Cost of Goods Sold Expenses Gains and Losses Income Taxes Extraordinary Items Earnings per share
Revenues
Revenues for services are recorded when the event occurs– Legal title passes from the seller to the buyer– Selling price has been established– Seller’s obligation is complete– The service has been exchanged for another
asset (cash or accounts receivable)
Cost of Goods Sold
Goods that are purchased for resale are initially recorded as inventory
When they are sold, they are transferred to the Cost of Goods Sold expense account
Cost of Goods Sold Calculation
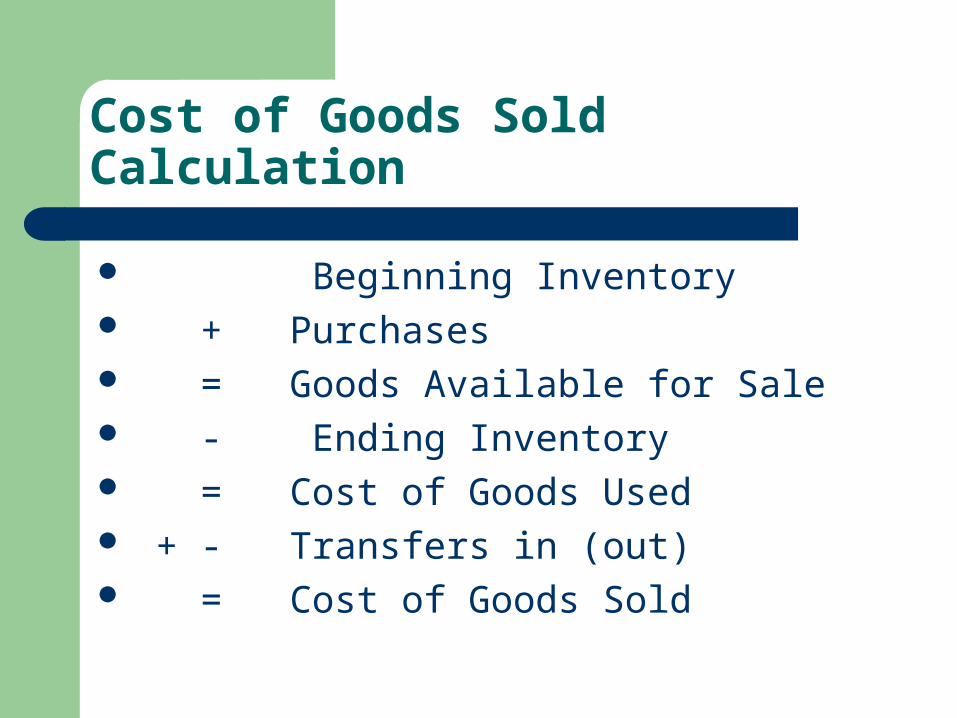
Beginning Inventory + Purchases = Goods Available for Sale - Ending Inventory = Cost of Goods Used + - Transfers in (out) = Cost of Goods Sold
Expenses
Day to Day Operational Expenses Payroll Expenses Specific Departmental Expenses Repair & Maintenance Expense Sales Expenses Administrative Expenses Other Undistributed Expenses
Gains & Losses
Gains – Increases in assets, reductions in liabilities or a combination of both resulting from incidental transactions
ie: Sale of used equipment Losses – Decreases in assets, increases in
liabilities or a combination of both resulting from incidental transactions
ie: Storm Damage Deductibles
Income Taxes
Based on the relevant revenues and expenses
Usually a variance in taxes booked and taxes paid – due to various accruals
Recorded as deferred income taxes (liability)
Extraordinary Items
Must meet two criteria– Must be of a high degree of abnormality and be
clearly unrelated to the ordinary and typical activities of the business
– Infrequent occurrence – must not be reasonably expected to occur again
Earnings per Share
Total net earnings of the business for each common share outstanding
EPS = Net Income Common Shares Outstanding
Only used for business organized as corporations or LLC
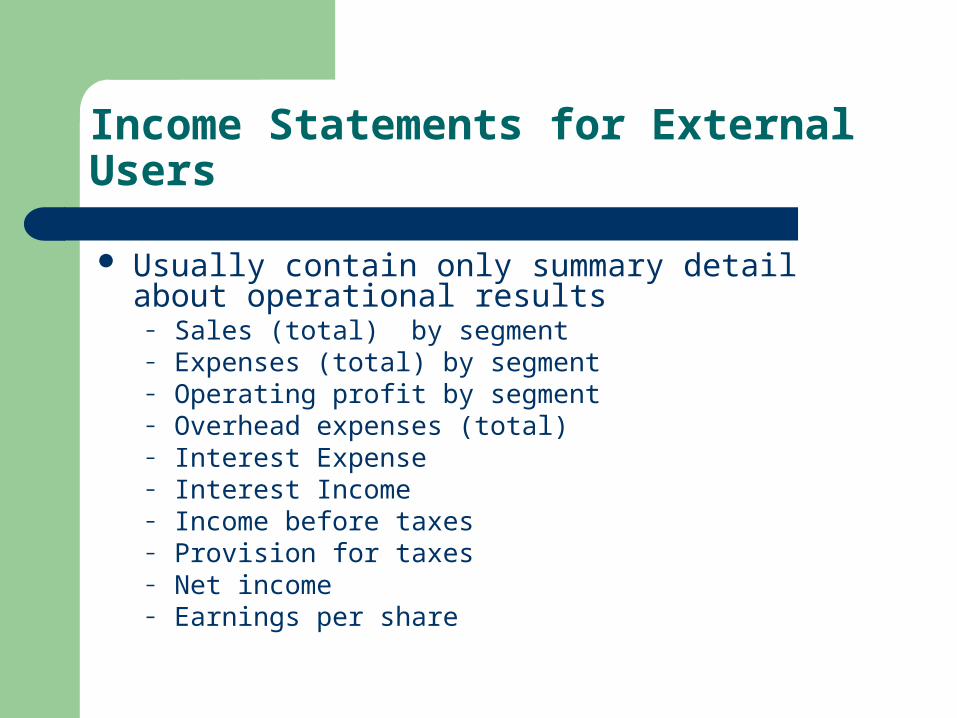
Income Statements for External Users
Usually contain only summary detail about operational results
– Sales (total) by segment– Expenses (total) by segment– Operating profit by segment– Overhead expenses (total)– Interest Expense– Interest Income– Income before taxes– Provision for taxes– Net income– Earnings per share
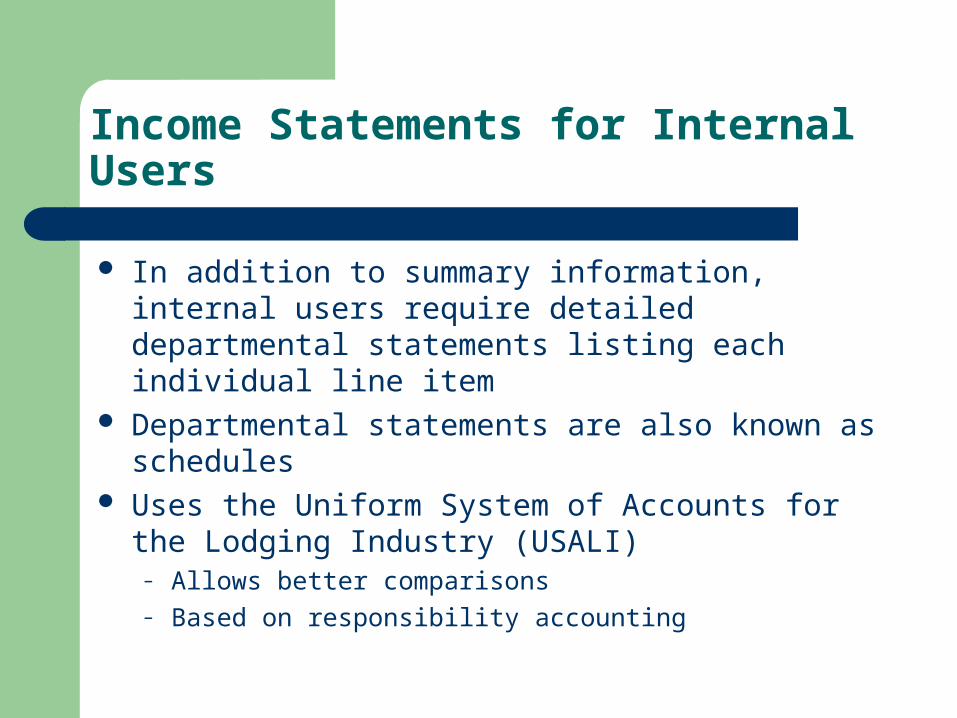
Income Statements for Internal Users
In addition to summary information, internal users require detailed departmental statements listing each individual line item
Departmental statements are also known as schedules
Uses the Uniform System of Accounts for the Lodging Industry (USALI)
– Allows better comparisons– Based on responsibility accounting
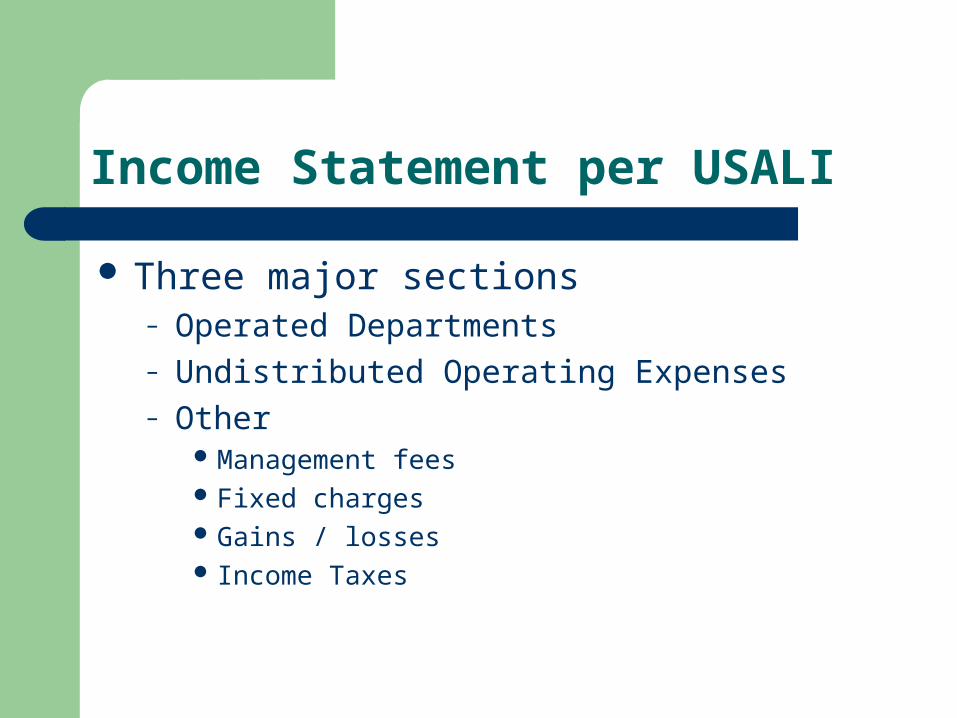
Income Statement per USALI
Three major sections– Operated Departments– Undistributed Operating Expenses– Other
Management fees Fixed charges Gains / losses Income Taxes
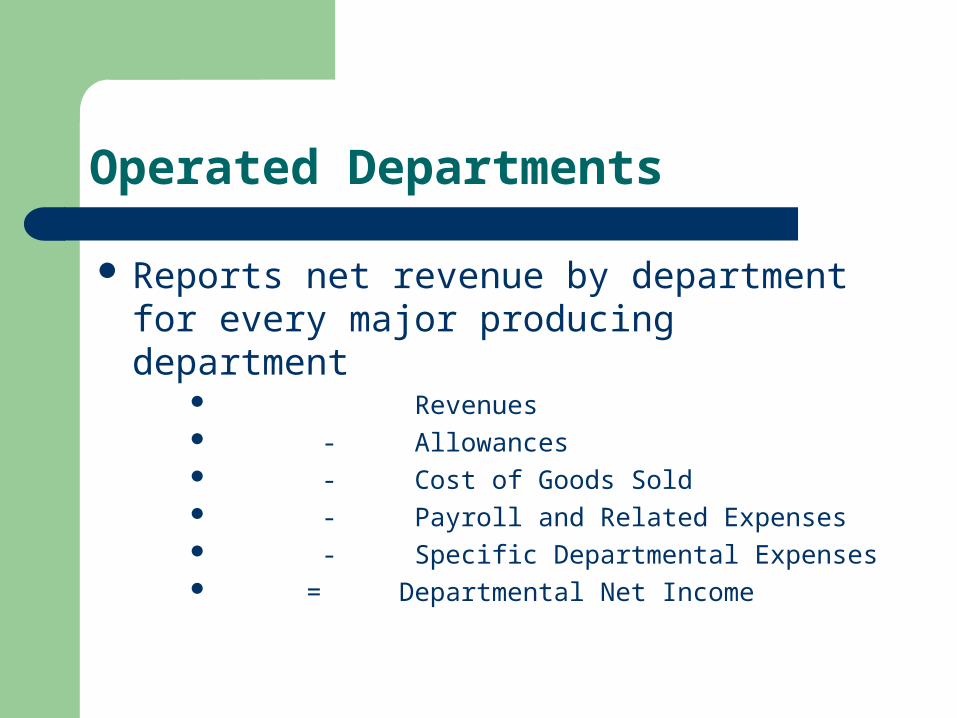
Operated Departments
Reports net revenue by department for every major producing department
Revenues - Allowances - Cost of Goods Sold - Payroll and Related Expenses - Specific Departmental Expenses = Departmental Net Income
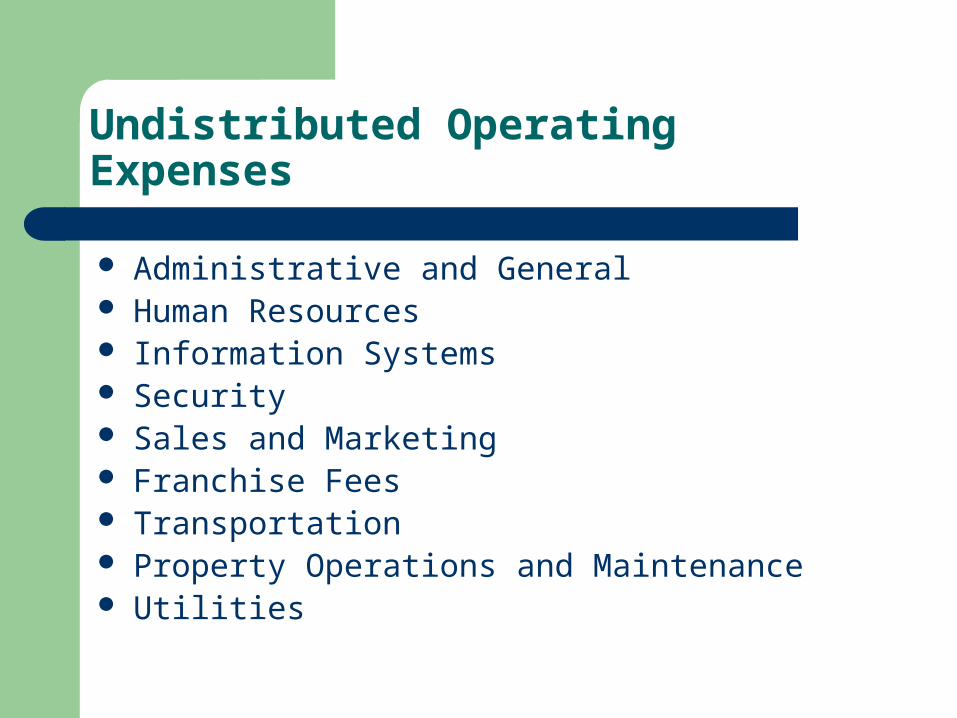
Undistributed Operating Expenses
Administrative and General Human Resources Information Systems Security Sales and Marketing Franchise Fees Transportation Property Operations and Maintenance Utilities
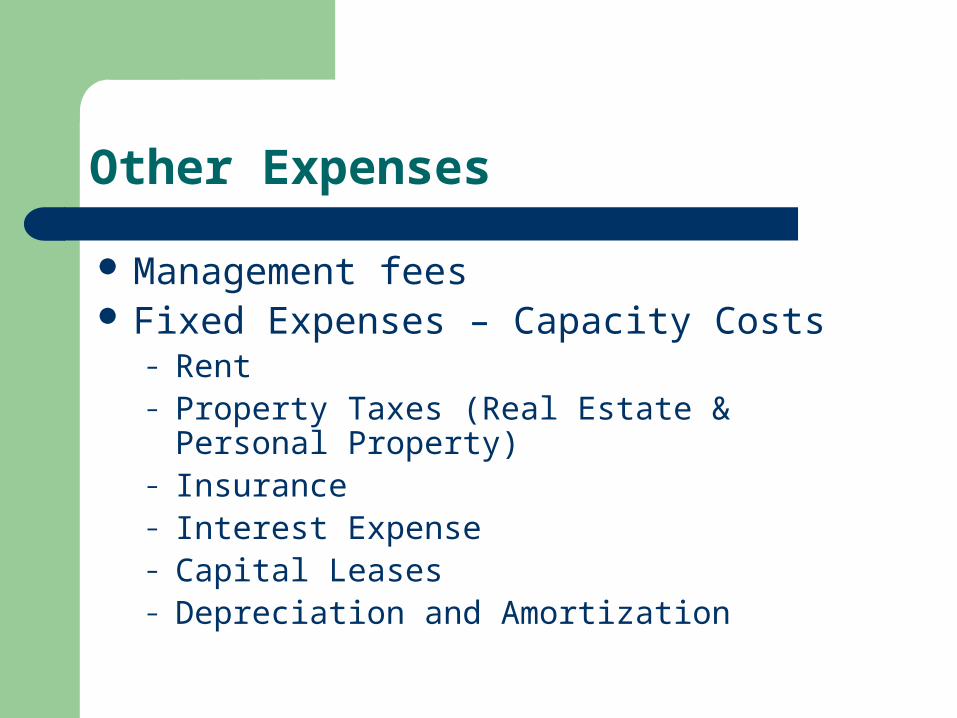
Other Expenses
Management fees Fixed Expenses – Capacity Costs
– Rent– Property Taxes (Real Estate & Personal Property)– Insurance– Interest Expense– Capital Leases– Depreciation and Amortization
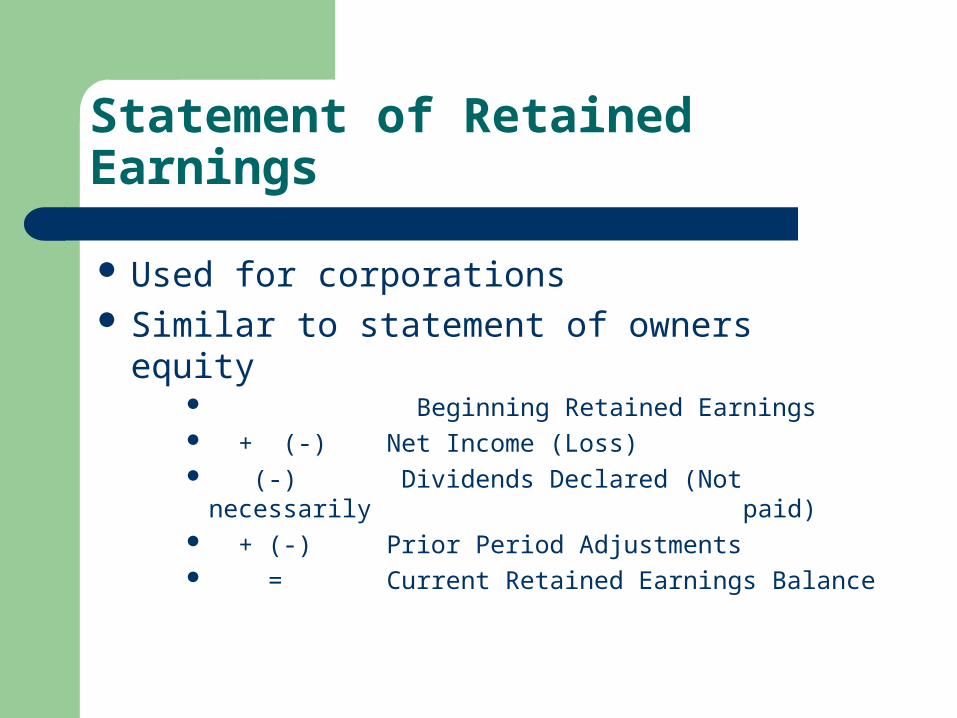
Statement of Retained Earnings
Used for corporations Similar to statement of owners equity
Beginning Retained Earnings + (-) Net Income (Loss) (-) Dividends Declared (Not necessarily
paid) + (-) Prior Period Adjustments = Current Retained Earnings Balance
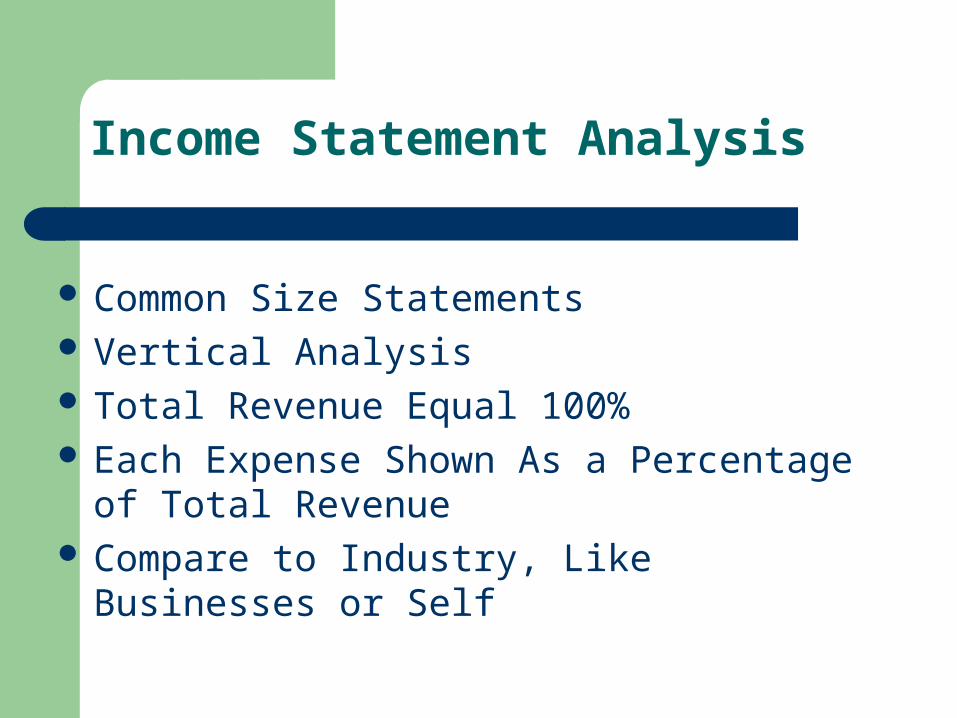
Income Statement Analysis
Common Size Statements Vertical Analysis Total Revenue Equal 100% Each Expense Shown As a Percentage of Total
Revenue Compare to Industry, Like Businesses or Self
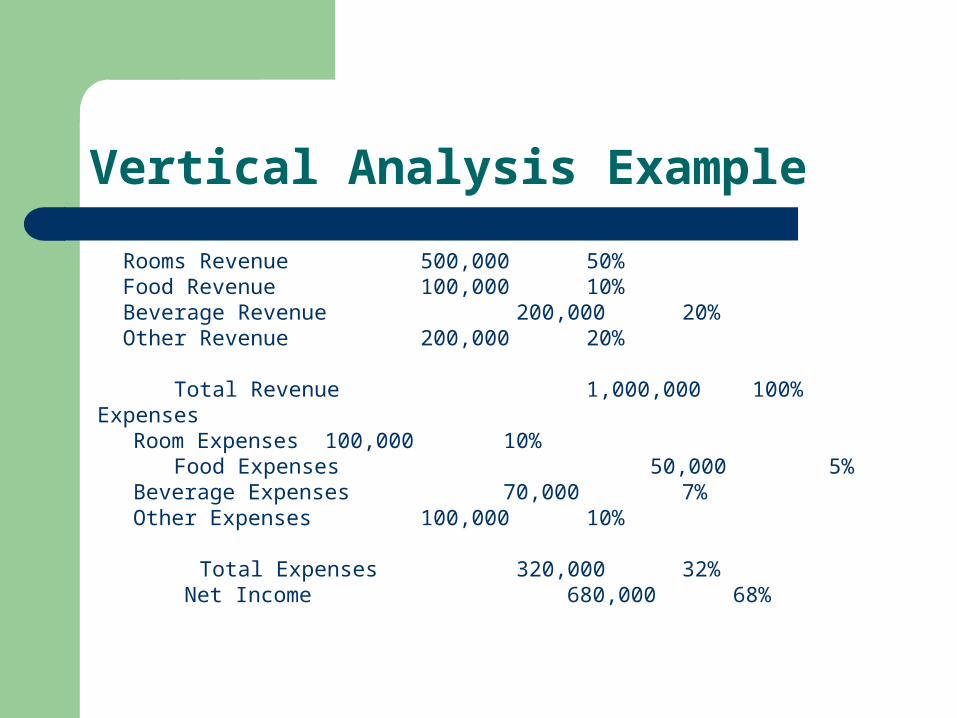
Vertical Analysis Example
Rooms Revenue 500,000 50% Food Revenue 100,000 10% Beverage Revenue 200,000 20% Other Revenue 200,000 20% Total Revenue 1,000,000 100%Expenses
Room Expenses 100,000 10% Food Expenses 50,000 5%
Beverage Expenses 70,000 7%Other Expenses 100,000 10%
Total Expenses 320,000 32% Net Income 680,000 68%
Homework Assignment
Problem 1 Problem 2 Problem 5 Problem 9 Problem 10 Problem 11


