
Housing Market and
Economic Update
December 2016
© 2016 CoreLogic, Inc. ■ Proprietary & Confidential
Housing overview
© 2016 CoreLogic, Inc. ■ Proprietary & Confidential2
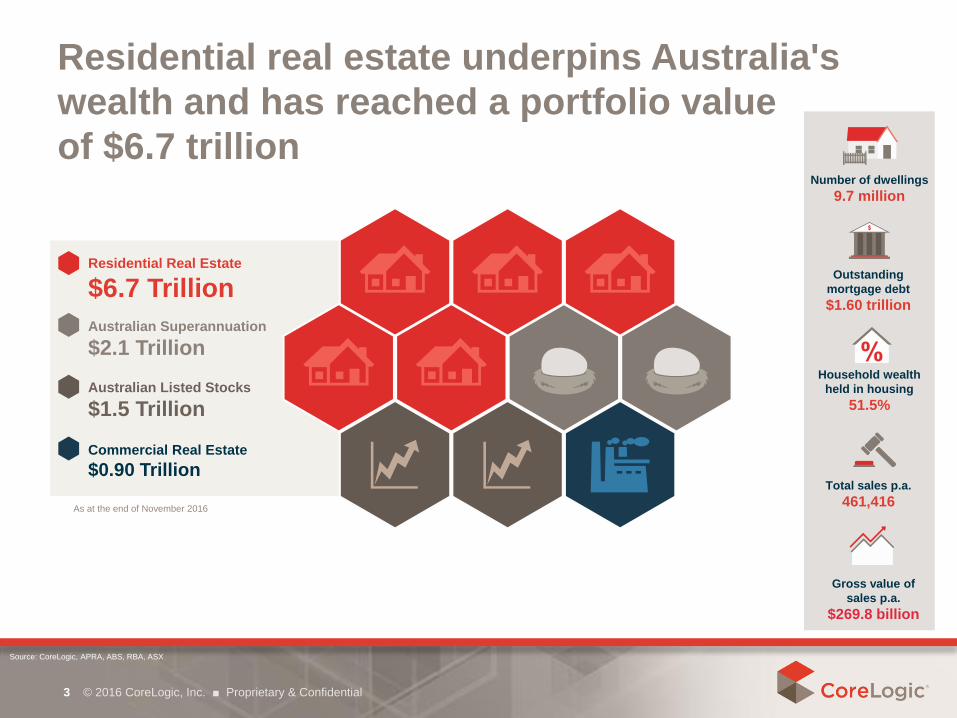
Residential real estate underpins Australia's
wealth and has reached a portfolio value
of $6.7 trillion
© 2016 CoreLogic, Inc. ■ Proprietary & Confidential3
As at the end of November 2016
Residential Real Estate
$6.7 Trillion
Australian Superannuation
$2.1 Trillion
Australian Listed Stocks
$1.5 Trillion
Commercial Real Estate
$0.90 Trillion
Source: CoreLogic, APRA, ABS, RBA, ASX
Number of dwellings
9.7 million
Outstanding
mortgage debt
$1.60 trillion
Household wealth
held in housing
51.5%
Total sales p.a.
461,416
Gross value of
sales p.a.
$269.8 billion
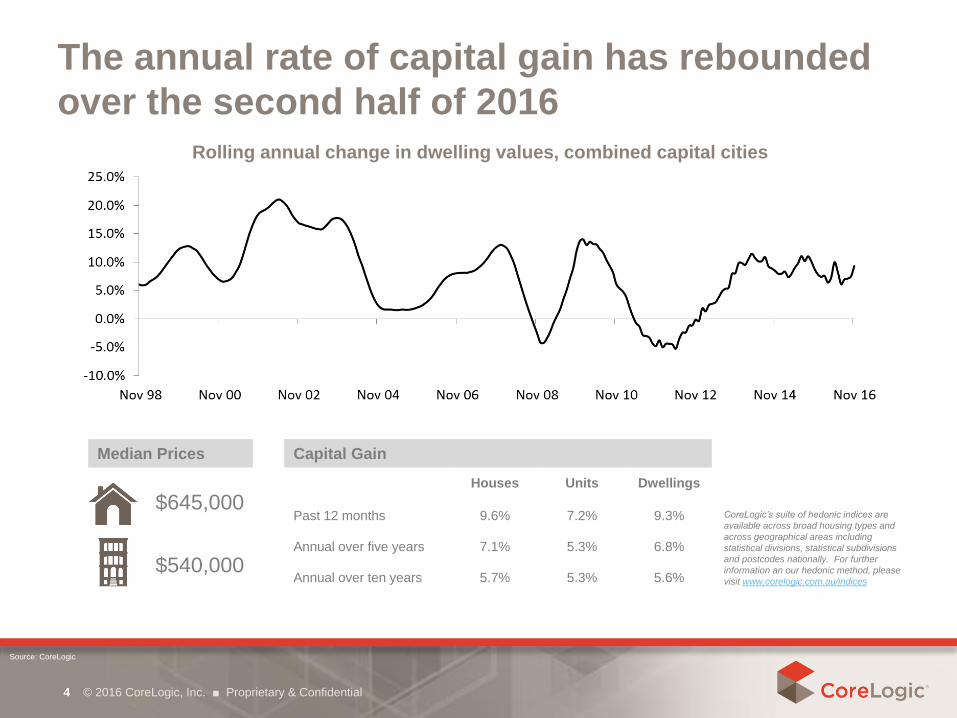
The annual rate of capital gain has rebounded
over the second half of 2016
© 2016 CoreLogic, Inc. ■ Proprietary & Confidential4
Rolling annual change in dwelling values, combined capital cities
Median Prices Capital Gain
$645,000Houses Units Dwellings
Past 12 months 9.6% 7.2% 9.3%
$540,000Annual over five years 7.1% 5.3% 6.8%
Annual over ten years 5.7% 5.3% 5.6%
CoreLogic’s suite of hedonic indices are
available across broad housing types and
across geographical areas including
statistical divisions, statistical subdivisions
and postcodes nationally. For further
information an our hedonic method, please
visit www.corelogic.com.au/indices
Source: CoreLogic
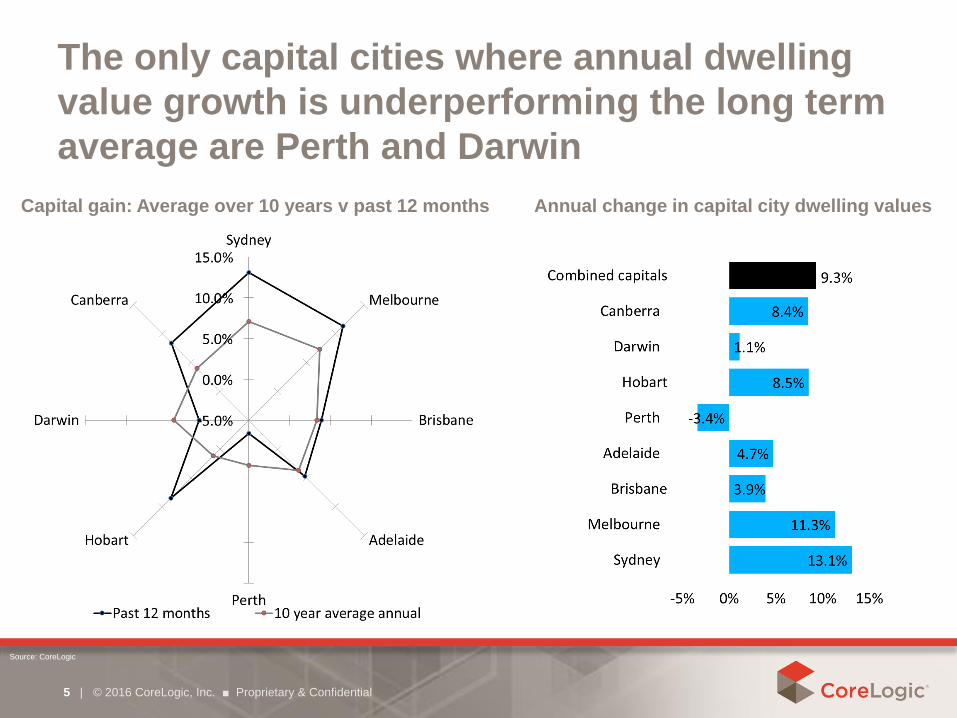
The only capital cities where annual dwelling
value growth is underperforming the long term
average are Perth and Darwin
| © 2016 CoreLogic, Inc. ■ Proprietary & Confidential5
Capital gain: Average over 10 years v past 12 months Annual change in capital city dwelling values
Source: CoreLogic
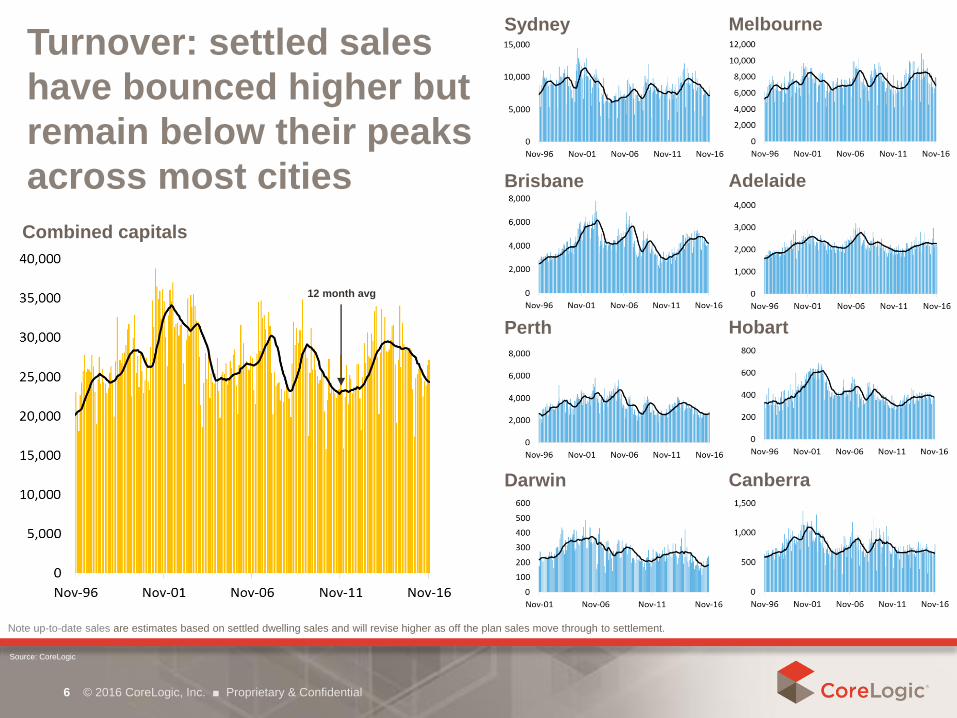
Turnover: settled sales
have bounced higher but
remain below their peaks
across most cities
© 2016 CoreLogic, Inc. ■ Proprietary & Confidential6
Note up-to-date sales are estimates based on settled dwelling sales and will revise higher as off the plan sales move through to settlement.
Source: CoreLogic
Combined capitals
Sydney
Brisbane
Perth
Darwin
Melbourne
Adelaide
Hobart
Canberra
12 month avg
© 2016 CoreLogic, Inc. ■ Proprietary & Confidential7
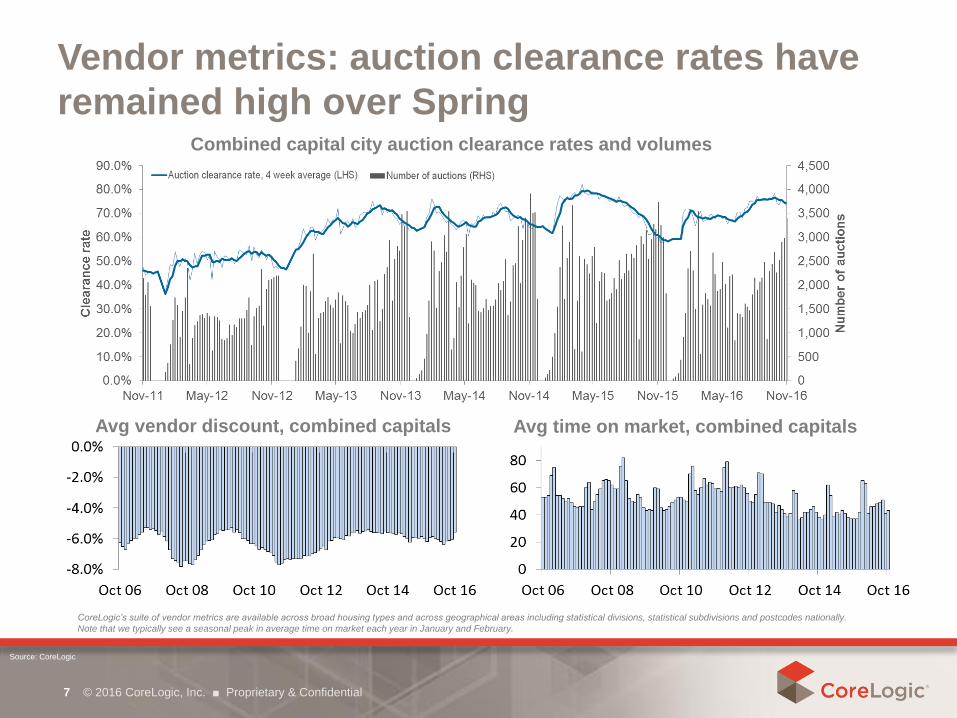
Vendor metrics: auction clearance rates have
remained high over SpringCombined capital city auction clearance rates and volumes
Avg vendor discount, combined capitals Avg time on market, combined capitals
CoreLogic’s suite of vendor metrics are available across broad housing types and across geographical areas including statistical divisions, statistical subdivisions and postcodes nationally.
Note that we typically see a seasonal peak in average time on market each year in January and February.
Source: CoreLogic
© 2016 CoreLogic, Inc. ■ Proprietary & Confidential8
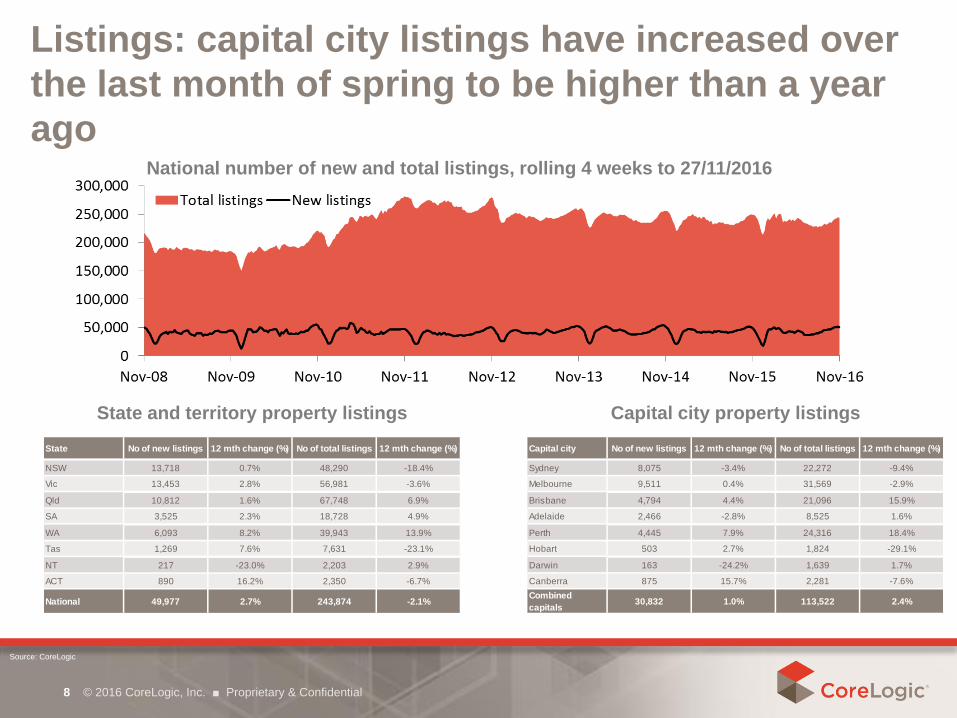
Listings: capital city listings have increased over
the last month of spring to be higher than a year
agoNational number of new and total listings, rolling 4 weeks to 27/11/2016
State and territory property listings Capital city property listings
Source: CoreLogic
State No of new listings 12 mth change (%) No of total listings 12 mth change (%)
NSW 13,718 0.7% 48,290 -18.4%
Vic 13,453 2.8% 56,981 -3.6%
Qld 10,812 1.6% 67,748 6.9%
SA 3,525 2.3% 18,728 4.9%
WA 6,093 8.2% 39,943 13.9%
Tas 1,269 7.6% 7,631 -23.1%
NT 217 -23.0% 2,203 2.9%
ACT 890 16.2% 2,350 -6.7%
National 49,977 2.7% 243,874 -2.1%
Capital city No of new listings 12 mth change (%) No of total listings 12 mth change (%)
Sydney 8,075 -3.4% 22,272 -9.4%
Melbourne 9,511 0.4% 31,569 -2.9%
Brisbane 4,794 4.4% 21,096 15.9%
Adelaide 2,466 -2.8% 8,525 1.6%
Perth 4,445 7.9% 24,316 18.4%
Hobart 503 2.7% 1,824 -29.1%
Darwin 163 -24.2% 1,639 1.7%
Canberra 875 15.7% 2,281 -7.6%
Combined
capitals30,832 1.0% 113,522 2.4%
© 2016 CoreLogic, Inc. ■ Proprietary & Confidential9
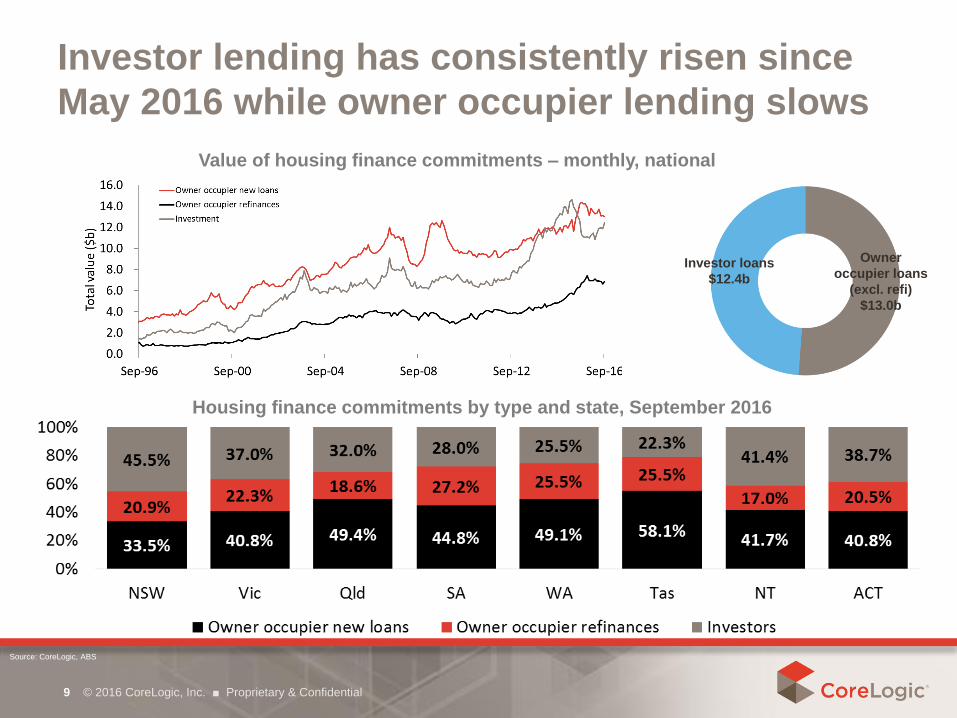
Investor lending has consistently risen since
May 2016 while owner occupier lending slows
Value of housing finance commitments – monthly, national
Owner
occupier loans
(excl. refi)
$13.0b
Investor loans
$12.4b
Housing finance commitments by type and state, September 2016
Source: CoreLogic, ABS
© 2016 CoreLogic, Inc. ■ Proprietary & Confidential10
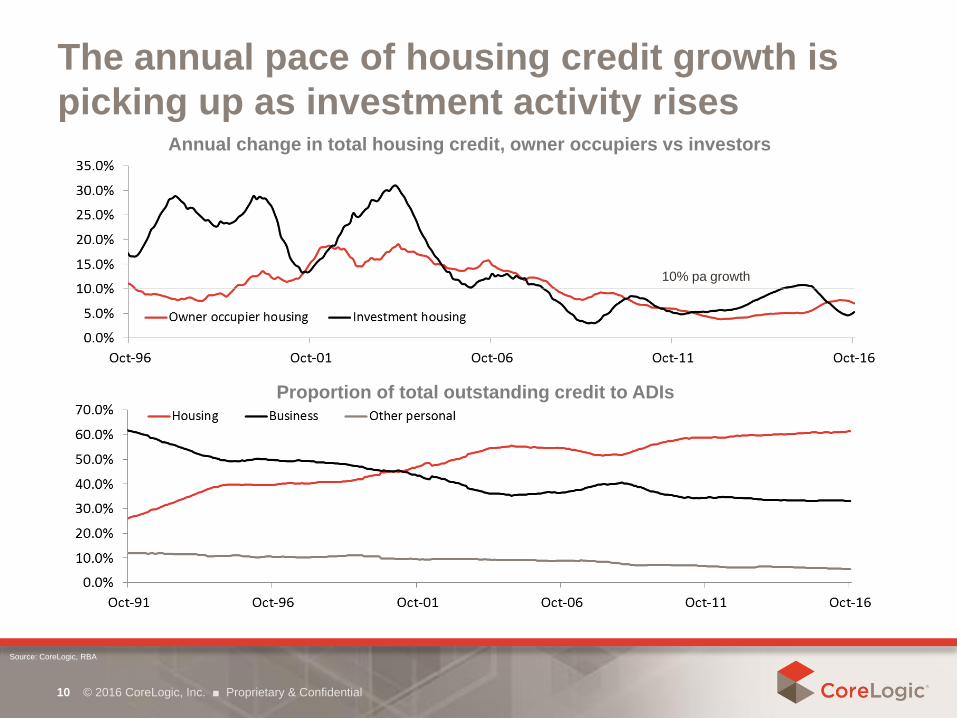
The annual pace of housing credit growth is
picking up as investment activity risesAnnual change in total housing credit, owner occupiers vs investors
Proportion of total outstanding credit to ADIs
10% pa growth
Source: CoreLogic, RBA

© 2016 CoreLogic, Inc. ■ Proprietary & Confidential11
CoreLogic’s Mortgage Index indicates a strong
rise in mortgage demand in November
CoreLogic’s Mortgage Index measures valuation activity across RP Data platforms, which more than 90% of ADI valuation requests nationally use, providing an almost real time indicator for how
much mortgage activity is taking place. For more information, contact RP Data via email: [email protected]
Source: CoreLogic
Capital city housing market indicators
© 2016 CoreLogic, Inc. ■ Proprietary & Confidential12
© 2016 CoreLogic, Inc. ■ Proprietary & Confidential13
CoreLogic’s suite of hedonic indices are available across broad housing types and across geographical areas including statistical divisions, statistical subdivisions and postcodes nationally. For
further information an our hedonic method, please visit www.corelogic.com.aui/indices
Source: CoreLogic
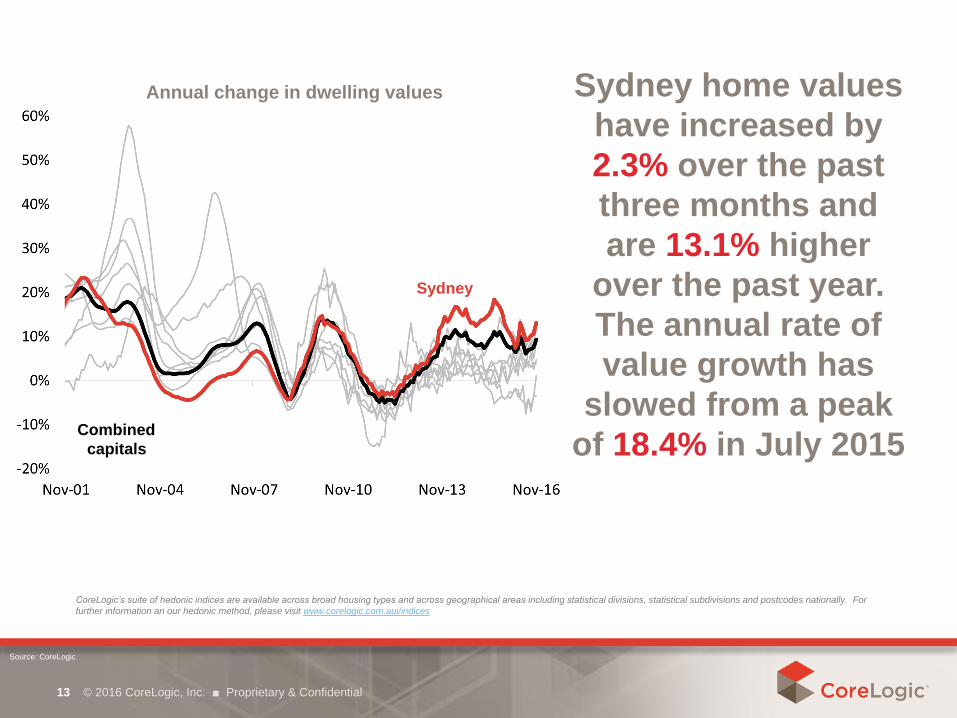
Annual change in dwelling values Sydney home values
have increased by
2.3% over the past
three months and
are 13.1% higher
over the past year.
The annual rate of
value growth has
slowed from a peak
of 18.4% in July 2015
Sydney
Combined
capitals
© 2016 CoreLogic, Inc. ■ Proprietary & Confidential14
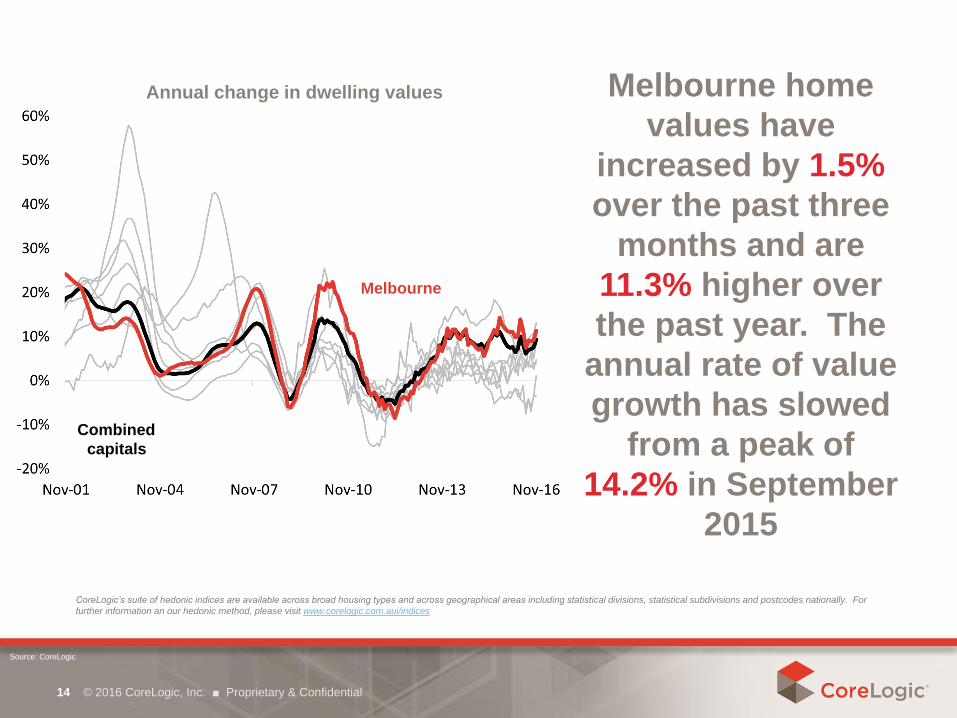
Annual change in dwelling values Melbourne home
values have
increased by 1.5%
over the past three
months and are
11.3% higher over
the past year. The
annual rate of value
growth has slowed
from a peak of
14.2% in September
2015
Melbourne
Combined
capitals
CoreLogic’s suite of hedonic indices are available across broad housing types and across geographical areas including statistical divisions, statistical subdivisions and postcodes nationally. For
further information an our hedonic method, please visit www.corelogic.com.aui/indices
Source: CoreLogic
© 2016 CoreLogic, Inc. ■ Proprietary & Confidential15
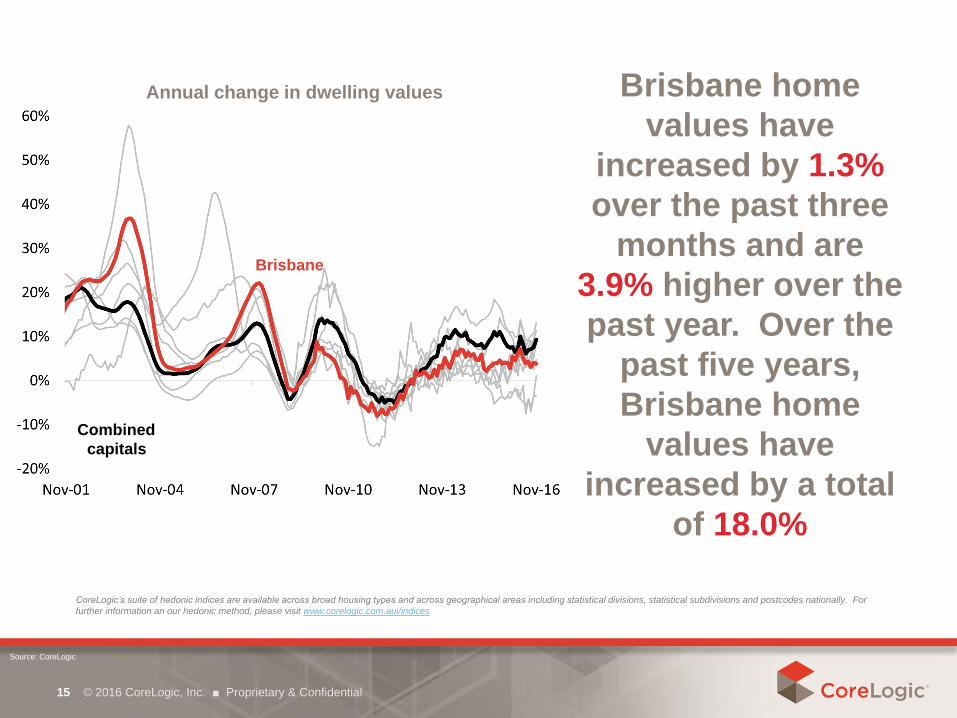
Annual change in dwelling values Brisbane home
values have
increased by 1.3%
over the past three
months and are
3.9% higher over the
past year. Over the
past five years,
Brisbane home
values have
increased by a total
of 18.0%
Brisbane
Combined
capitals
CoreLogic’s suite of hedonic indices are available across broad housing types and across geographical areas including statistical divisions, statistical subdivisions and postcodes nationally. For
further information an our hedonic method, please visit www.corelogic.com.aui/indices
Source: CoreLogic
© 2016 CoreLogic, Inc. ■ Proprietary & Confidential16
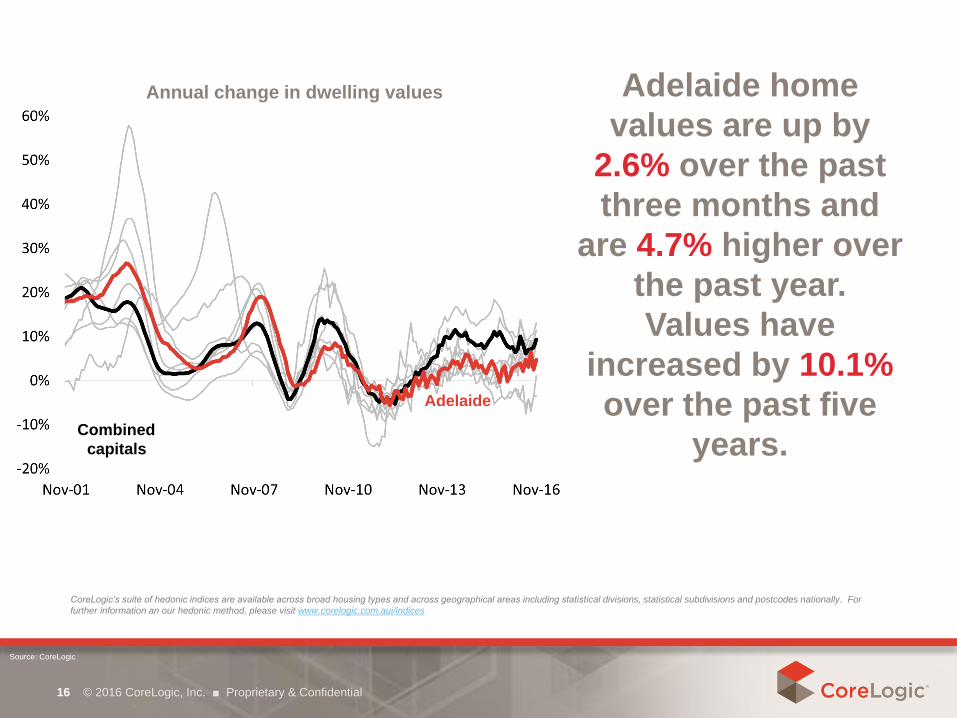
Annual change in dwelling values Adelaide home
values are up by
2.6% over the past
three months and
are 4.7% higher over
the past year.
Values have
increased by 10.1%
over the past five
years.
Adelaide
Combined
capitals
CoreLogic’s suite of hedonic indices are available across broad housing types and across geographical areas including statistical divisions, statistical subdivisions and postcodes nationally. For
further information an our hedonic method, please visit www.corelogic.com.aui/indices
Source: CoreLogic
© 2016 CoreLogic, Inc. ■ Proprietary & Confidential17
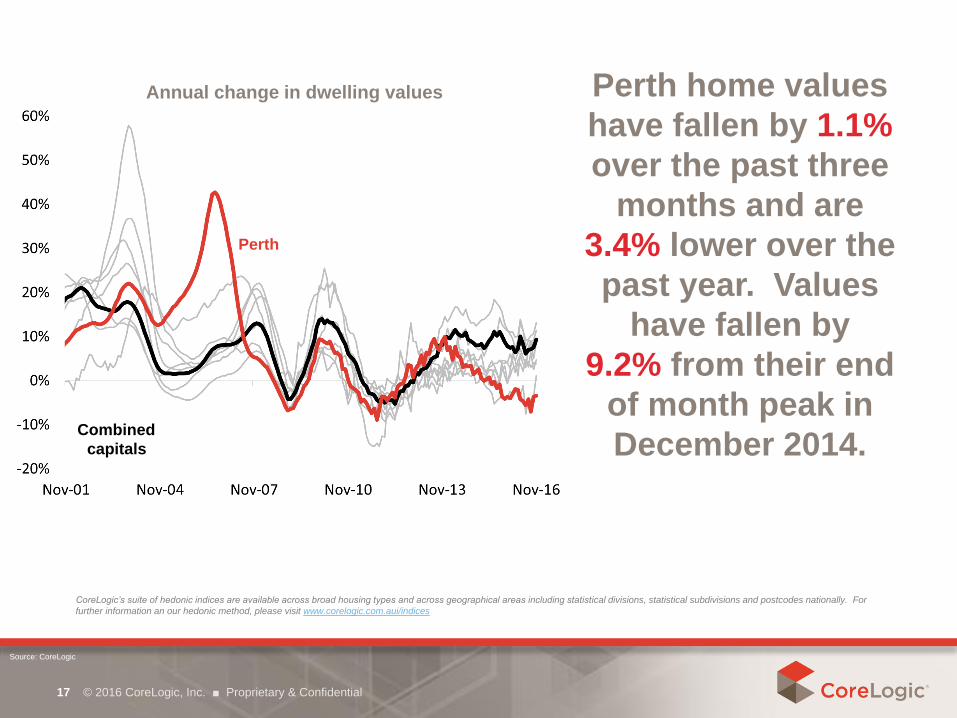
Annual change in dwelling values Perth home values
have fallen by 1.1%
over the past three
months and are
3.4% lower over the
past year. Values
have fallen by
9.2% from their end
of month peak in
December 2014.
Perth
Combined
capitals
CoreLogic’s suite of hedonic indices are available across broad housing types and across geographical areas including statistical divisions, statistical subdivisions and postcodes nationally. For
further information an our hedonic method, please visit www.corelogic.com.aui/indices
Source: CoreLogic
© 2016 CoreLogic, Inc. ■ Proprietary & Confidential18
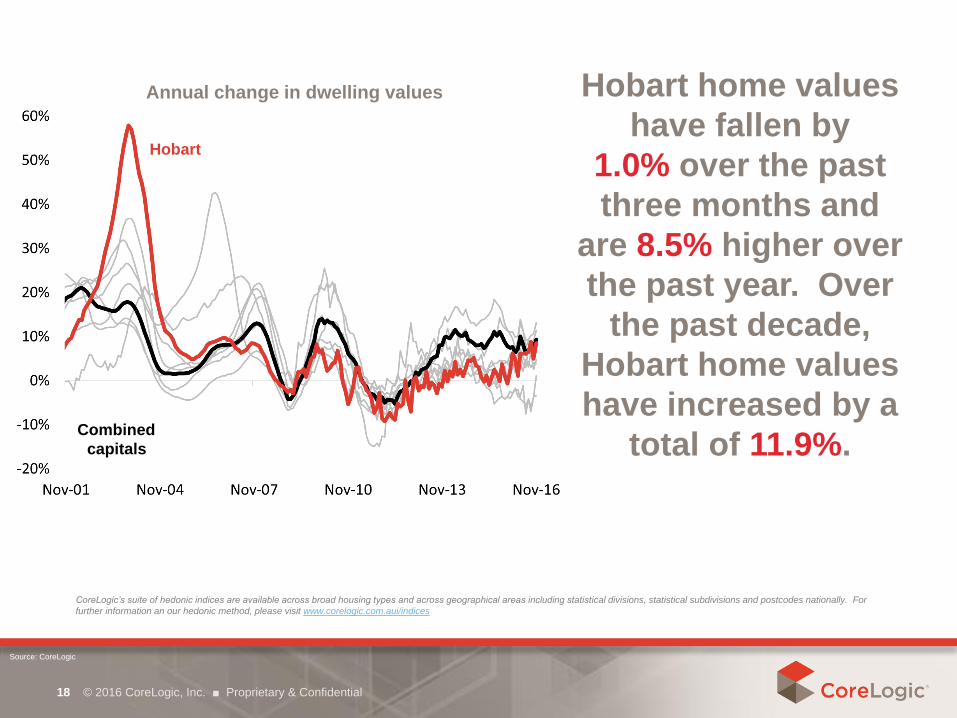
Annual change in dwelling values Hobart home values
have fallen by
1.0% over the past
three months and
are 8.5% higher over
the past year. Over
the past decade,
Hobart home values
have increased by a
total of 11.9%.
Hobart
Combined
capitals
CoreLogic’s suite of hedonic indices are available across broad housing types and across geographical areas including statistical divisions, statistical subdivisions and postcodes nationally. For
further information an our hedonic method, please visit www.corelogic.com.aui/indices
Source: CoreLogic
© 2016 CoreLogic, Inc. ■ Proprietary & Confidential19
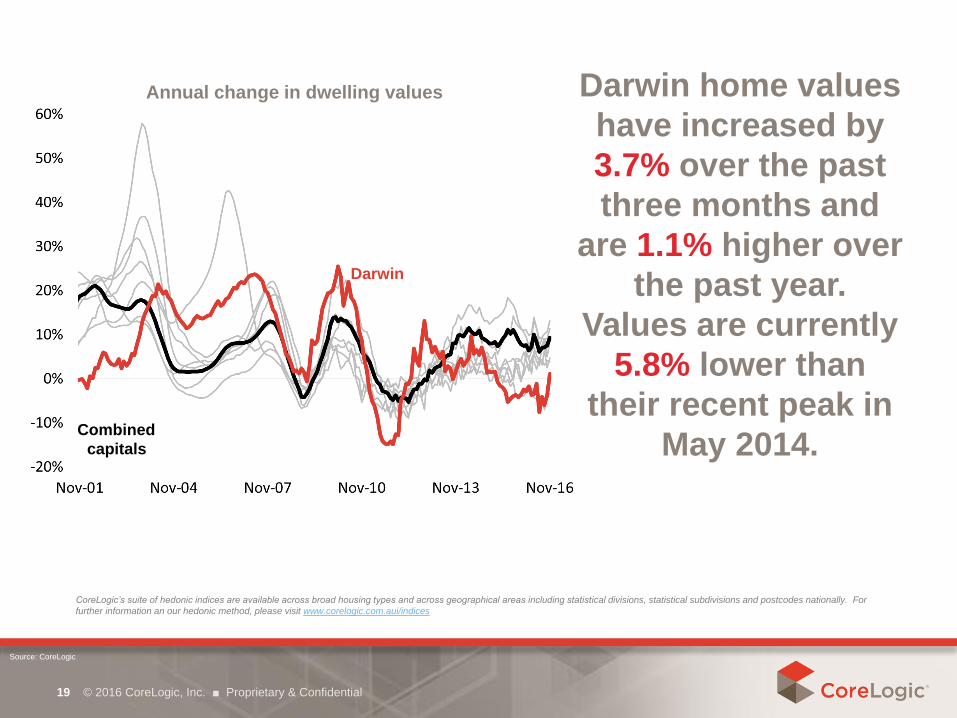
Annual change in dwelling values Darwin home values
have increased by
3.7% over the past
three months and
are 1.1% higher over
the past year.
Values are currently
5.8% lower than
their recent peak in
May 2014.
Darwin
Combined
capitals
CoreLogic’s suite of hedonic indices are available across broad housing types and across geographical areas including statistical divisions, statistical subdivisions and postcodes nationally. For
further information an our hedonic method, please visit www.corelogic.com.aui/indices
Source: CoreLogic
© 2016 CoreLogic, Inc. ■ Proprietary & Confidential20
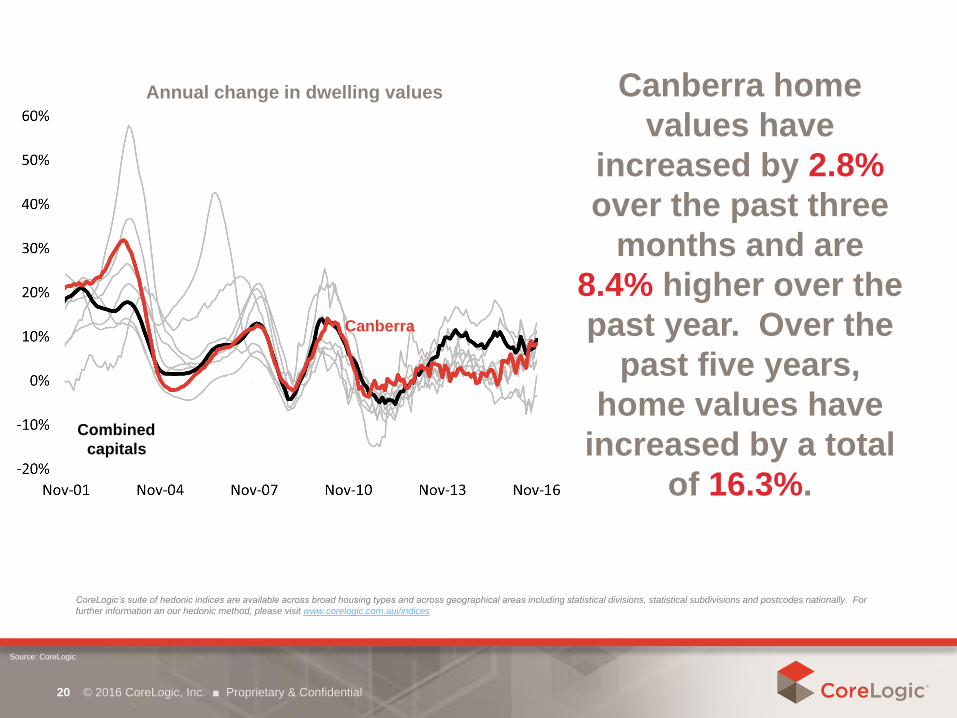
Annual change in dwelling values Canberra home
values have
increased by 2.8%
over the past three
months and are
8.4% higher over the
past year. Over the
past five years,
home values have
increased by a total
of 16.3%.
Canberra
Combined
capitals
CoreLogic’s suite of hedonic indices are available across broad housing types and across geographical areas including statistical divisions, statistical subdivisions and postcodes nationally. For
further information an our hedonic method, please visit www.corelogic.com.aui/indices
Source: CoreLogic
Macroeconomic and demographic indicators
© 2016 CoreLogic, Inc. ■ Proprietary & Confidential21
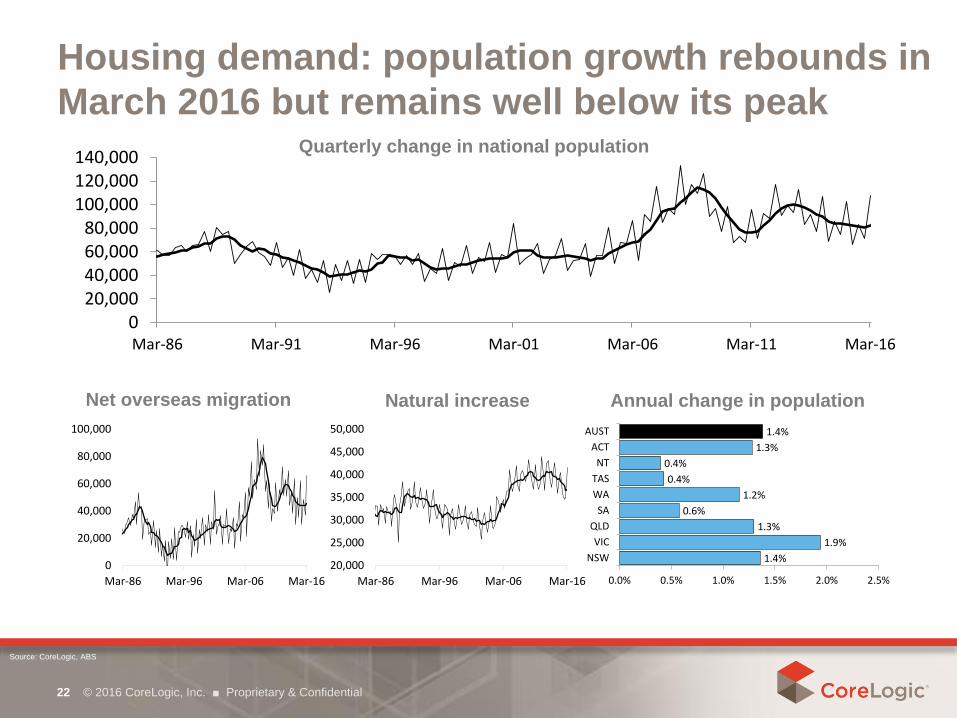
1.4%
1.9%
1.3%
0.6%
1.2%
0.4%
0.4%
1.3%
1.4%
0.0% 0.5% 1.0% 1.5% 2.0% 2.5%
NSW
VIC
QLD
SA
WA
TAS
NT
ACT
AUST
0
20,000
40,000
60,000
80,000
100,000
Mar-86 Mar-96 Mar-06 Mar-16
20,000
25,000
30,000
35,000
40,000
45,000
50,000
Mar-86 Mar-96 Mar-06 Mar-16
020,00040,00060,00080,000
100,000120,000140,000
Mar-86 Mar-91 Mar-96 Mar-01 Mar-06 Mar-11 Mar-16
© 2016 CoreLogic, Inc. ■ Proprietary & Confidential22
Housing demand: population growth rebounds in
March 2016 but remains well below its peakQuarterly change in national population
Net overseas migration Natural increase Annual change in population
Source: CoreLogic, ABS
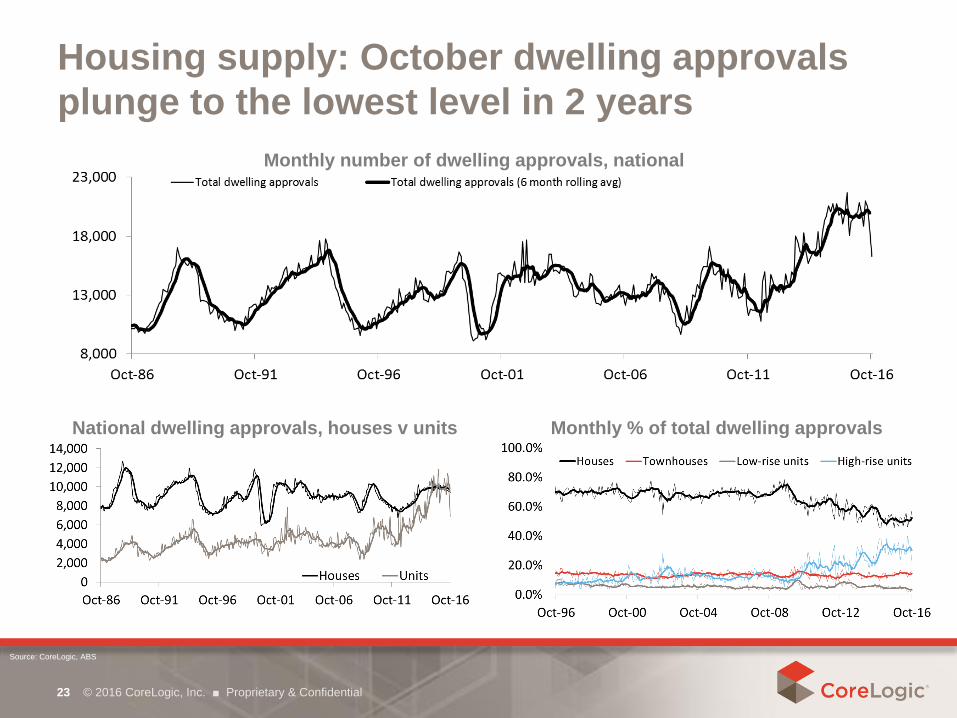
© 2016 CoreLogic, Inc. ■ Proprietary & Confidential23
Housing supply: October dwelling approvals
plunge to the lowest level in 2 years
Monthly number of dwelling approvals, national
National dwelling approvals, houses v units Monthly % of total dwelling approvals
Source: CoreLogic, ABS
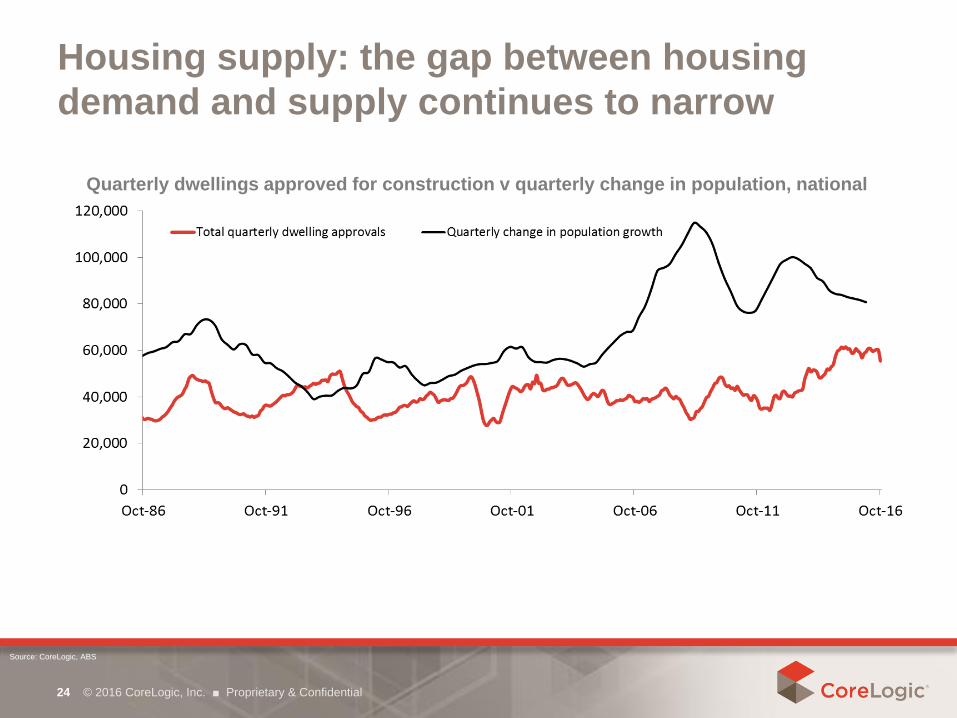
© 2016 CoreLogic, Inc. ■ Proprietary & Confidential24
Housing supply: the gap between housing
demand and supply continues to narrow
Quarterly dwellings approved for construction v quarterly change in population, national
Source: CoreLogic, ABS
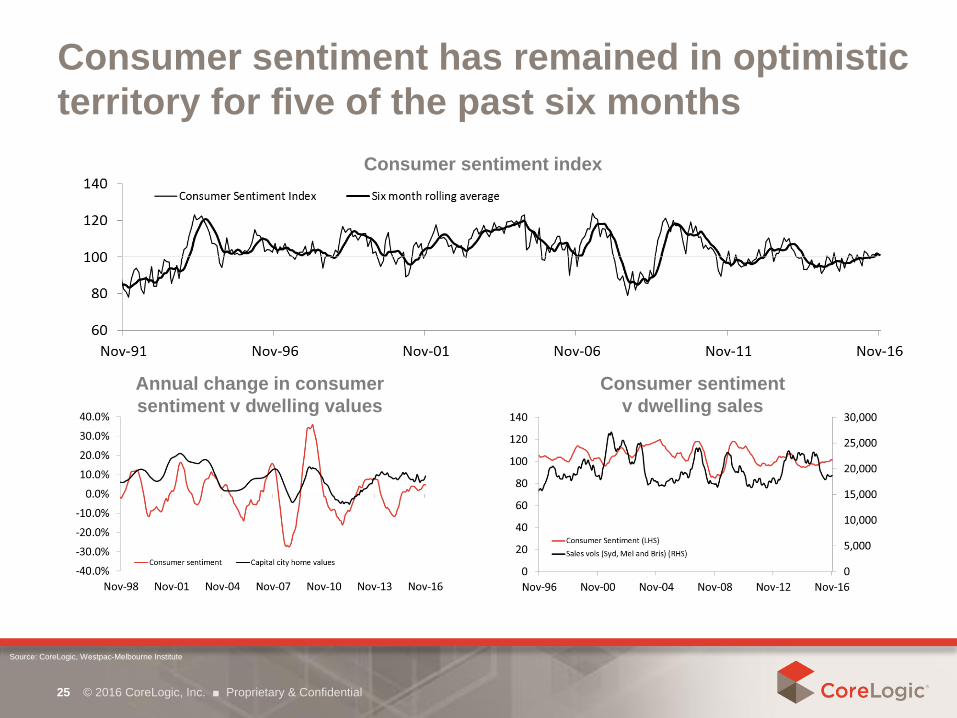
© 2016 CoreLogic, Inc. ■ Proprietary & Confidential25
Consumer sentiment has remained in optimistic
territory for five of the past six months
Consumer sentiment index
Annual change in consumer
sentiment v dwelling values
Consumer sentiment
v dwelling sales
Source: CoreLogic, Westpac-Melbourne Institute
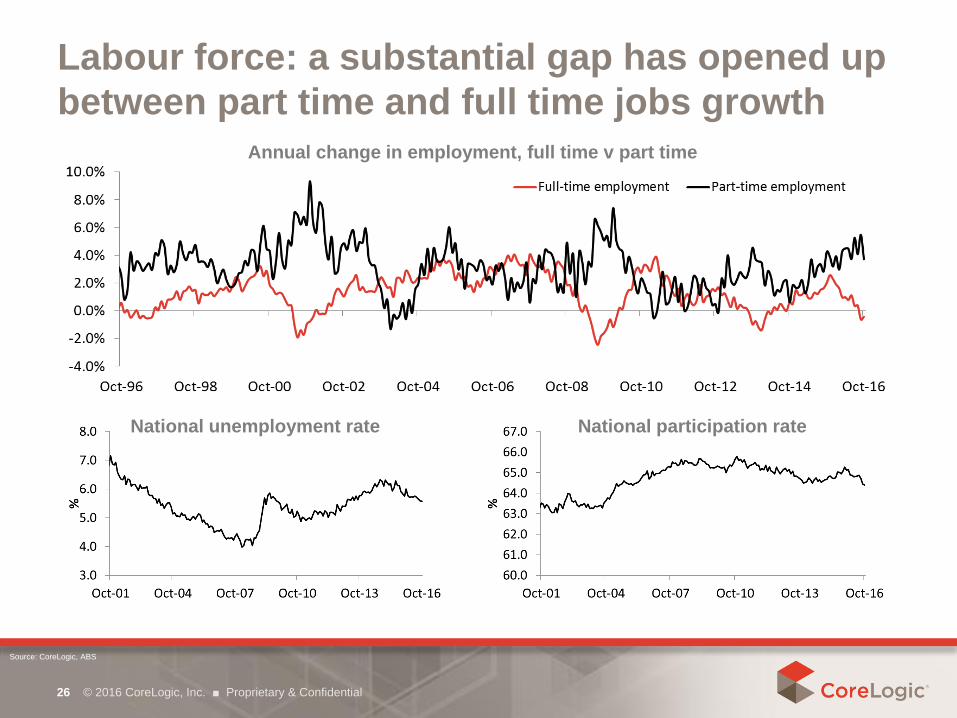
© 2016 CoreLogic, Inc. ■ Proprietary & Confidential26
Labour force: a substantial gap has opened up
between part time and full time jobs growth
Annual change in employment, full time v part time
National unemployment rate National participation rate
Source: CoreLogic, ABS
© 2016 CoreLogic, Inc. ■ Proprietary & Confidential27
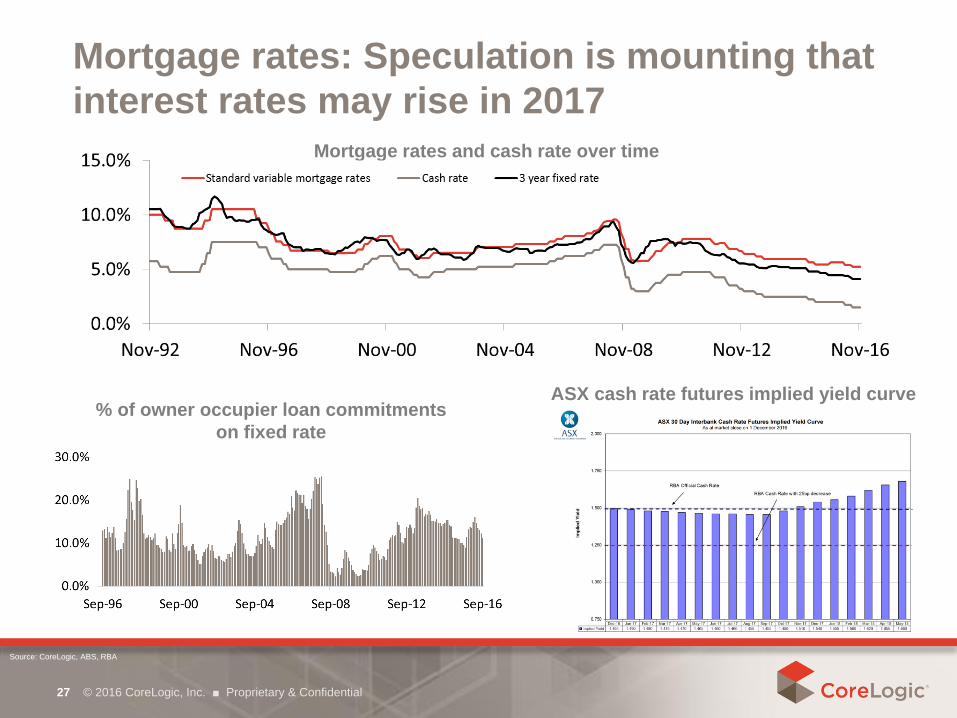
Mortgage rates: Speculation is mounting that
interest rates may rise in 2017
Mortgage rates and cash rate over time
% of owner occupier loan commitments
on fixed rate
ASX cash rate futures implied yield curve
Source: CoreLogic, ABS, RBA
© 2016 CoreLogic, Inc. ■ Proprietary & Confidential28
About Us
CoreLogic Australia is a wholly owned subsidiary of CoreLogic (NYSE: CLGX), which is the largest property data and analytics
company in the world. CoreLogic provides property information, analytics and services across Australia, New Zealand and Asia,
and recently expanded its service offering through the purchase of project activity and building cost information provider Cordell.
With Australia’s most comprehensive property databases, the company’s combined data offering is derived from public,
contributory and proprietary sources and includes over 500 million decision points spanning over three decades of collection,
providing detailed coverage of property and other encumbrances such as tenancy, location, hazard risk and related performance
information.
With over 20,000 customers and 150,000 end users, CoreLogic is the leading provider of property data, analytics and related
services to consumers, investors, real estate, mortgage, finance, banking, building services, insurance, developers, wealth
management and government. CoreLogic delivers value to clients through unique data, analytics, workflow technology, advisory
and geo spatial services. Clients rely on CoreLogic to help identify and manage growth opportunities, improve performance and
mitigate risk. CoreLogic employs over 650 people across Australia and in New Zealand. For more information call 1300 734 318 or
visit www.corelogic.com.au
CoreLogic produces an advanced suite of housing market analytics that provides key insights for understanding housing market
conditions at a granular geographic level. Granular data is often used for portfolio analysis and benchmarking, risk assessments
and understanding development feasibility and market sizing. It gives industry professionals valuable modules which provide
essential analytics and insights for decision making and strategy formation within the residential property asset class. We can tailor
reports to suit your business requirements.
Call us on 1300 734 318 or email us at [email protected] or visit us at www.corelogic.com.au

© 2016 CoreLogic, Inc. ■ Proprietary & Confidential29
Granular Data and Analytics
Market Scorecard: Monitor and measure market share and performance of real estate agents at an individual office or a Franchise
brand level across Australia. Identify the competing brands and independents at a suburb, postcode, user defined territory and
State level. Easily locate growth opportunities and market hotspots, and view the performance of the established offices in these
new areas of interest.
Market Trends: Detailed housing market indicators down to the suburb level, with data in time series or snapshot and segmented
across houses, units and land. The Market Trends data includes key housing market metrics such as median prices, median
values, transaction volumes, rental statistics, vendor metrics such as average selling time and vendor discounting rates.
CoreLogic RP Data Indices: The suite of CoreLogic RP Data Indices range from simple market measurements such as
median prices through to repeat sales indices and our flagship hedonic home value indices. The CoreLogic RP Data Hedonic index
has been specifically designed to track the value of a portfolio of properties over time and is relied upon by Australian regulators
and industry as the most up to date and accurate measurement of housing market performance.
Economist Pack: A suite of indices and indicators designed specifically for Australian economic commentators who require the
most up to date and detailed view of housing market conditions. The economist pack includes the CoreLogic RP Data Hedonic
indices for capital cities and ‘rest of state’ indices, the stratified hedonic index, hedonic total return index, auction clearance rates
and median prices.
Investor Concentration Report: Understanding ownership concentrations is an important part of assessing risk. Areas with high
investor concentrations are typically allocated higher risk ratings due to the over-representation of a particular segment of the
market. Through a series of rules and logic, CoreLogic RP Data has flagged the likely ownership type of every residential property
nationally as either owner occupied, investor owned or government owned.
Mortgage Market Trend Report: CoreLogic RP Data is in a unique position to monitor mortgage related housing market
activity. Transaction volumes, dwelling values and mortgage related valuation events all comprise our Mortgage market
trend report which provides an invaluable tool for mortgage industry benchmarking and strategy.
© 2016 CoreLogic, Inc. ■ Proprietary & Confidential30
Disclaimer
In compiling this publication, RP Data Pty Ltd trading as CoreLogic has relied upon information supplied by a number of external sources. CoreLogic does not warrant its
accuracy or completeness and to the full extent allowed by law excludes liability in contract, tort or otherwise, for any loss or damage sustained by subscribers, or by any
other person or body corporate arising from or in connection with the supply or use of the whole or any part of the information in this publication through any cause
whatsoever and limits any liability it may have to the amount paid to CoreLogic for the supply of such information.
Queensland Data
Based on or contains data provided by the State of Queensland (Department of Natural Resources and Mines) 2016. In consideration of the State permitting use of this
data you acknowledge and agree that the State gives no warranty in relation to the data (including accuracy, reliability, completeness, currency or suitability) and accepts
no liability (including without limitation, liability in negligence) for any loss, damage or costs (including consequential damage) relating to any use of the data. Data must not
be used for direct marketing or be used in breach of the privacy laws.
South Australian Data
This information is based on data supplied by the South Australian Government and is published by permission. The South Australian Government does not accept any
responsibility for the accuracy or completeness of the published information or suitability for any purpose of the published information or the underlying data.
New South Wales Data
Contains property sales information provided under licence from the Land and Property Information (“LPI”). CoreLogic is authorised as a Property Sales Information
provider by the LPI.
Victorian Data
The State of Victoria owns the copyright in the Property Sales Data which constitutes the basis of this report and reproduction of that data in any way without the consent of
the State of Victoria will constitute a breach of the Copyright Act 1968 (Cth). The State of Victoria does not warrant the accuracy or completeness of the information
contained in this report and any person using or relying upon such information does so on the basis that the State of Victoria accepts no responsibility or liability whatsoever
for any errors, faults, defects or omissions in the information supplied.
Western Australian Data
Based on information provided by and with the permission of the Western Australian Land Information Authority (2015) trading as Landgate.
Australian Capital Territory Data
The Territory Data is the property of the Australian Capital Territory. No part of it may in any form or by any means (electronic, mechanical, microcopying, photocopying,
recording or otherwise) be reproduced, stored in a retrieval system or transmitted without prior written permission. Enquiries should be directed to: Director, Customer
Services ACT Planning and Land Authority GPO Box 1908 Canberra ACT 2601.
Tasmanian Data
This product incorporates data that is copyright owned by the Crown in Right of Tasmania. The data has been used in the product with the permission of the Crown in Right
of Tasmania. The Crown in Right of Tasmania and its employees and agents:
a) give no warranty regarding the data's accuracy, completeness, currency or suitability for any particular purpose; and
b) do not accept liability howsoever arising, including but not limited to negligence for any loss resulting from the use of or reliance upon the data.
Base data from the LIST © State of Tasmania http://www.thelist.tas.gov.au

© 2016 CoreLogic, Inc. ■ Proprietary & Confidential31
Better data
+ Better analytics
= Better decisions


