IMPACT OF RENEWABLE ENERGY SOURCES
ON INDIAN ELECTRICITY GRID
7th SEPT, 2017

POTENTIAL OF RENEWABLES IN INDIA
India has significant potential of electricity generation from renewable energy sources.
MNRE estimates Solar potential in India 745 GW Wind potential in India 103 GW
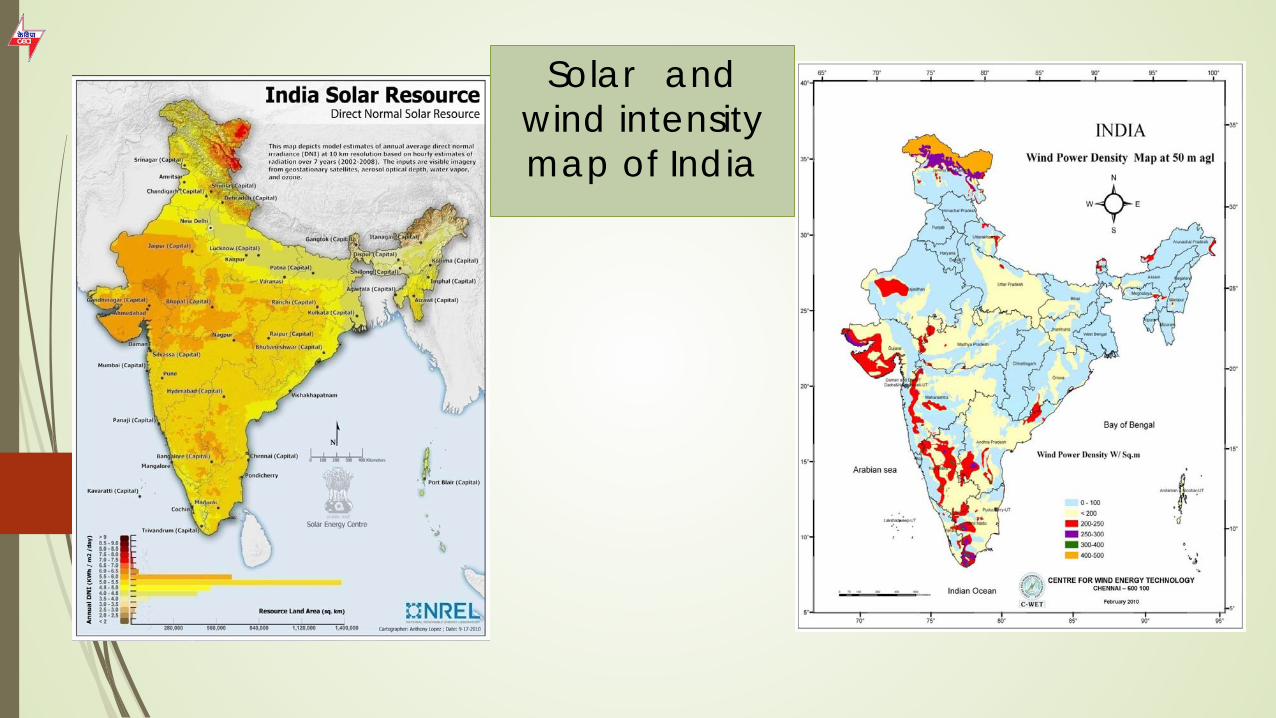
Solar and wind intensity map of India
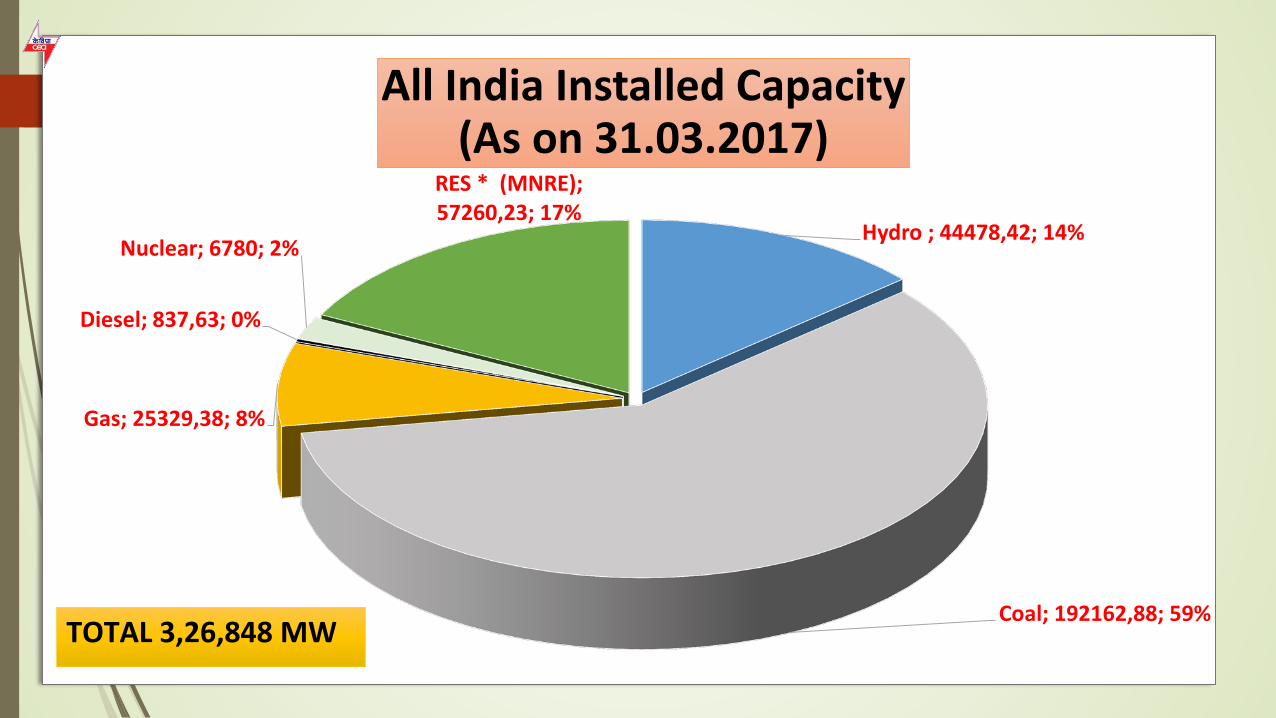
Hydro ; 44478,42; 14%
Coal; 192162,88; 59%
Gas; 25329,38; 8%
Diesel; 837,63; 0%
Nuclear; 6780; 2%
RES * (MNRE); 57260,23; 17%
All India Installed Capacity (As on 31.03.2017)
TOTAL 3,26,848 MW

0
5000
10000
15000
20000
25000
30000
35000
40000
31ST MARCH,2008 31ST MARCH,2012 31ST MARCH,2017
2,12 941,3
12288,83
7666,84
16896,6
32279,77
2045,07
3410,5
4379,855
1411,38 3255
8311,78
MW
Development of RE in India
Solar Wind Small hydro(SHP) Bio-Power
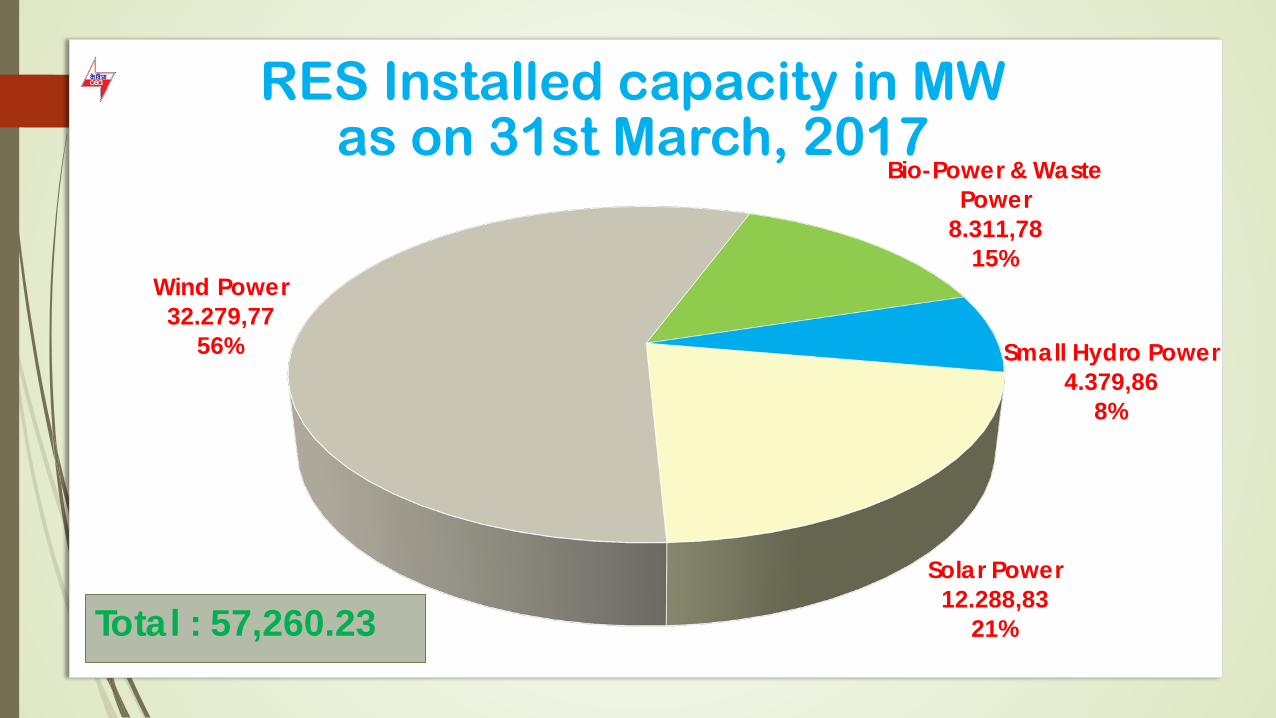
Solar Power 12.288,83
21%
Wind Power 32.279,77
56%
Bio-Power & Waste Power
8.311,78 15%
Small Hydro Power 4.379,86
8%
RES Installed capacity in MW as on 31st March, 2017
Total : 57,260.23
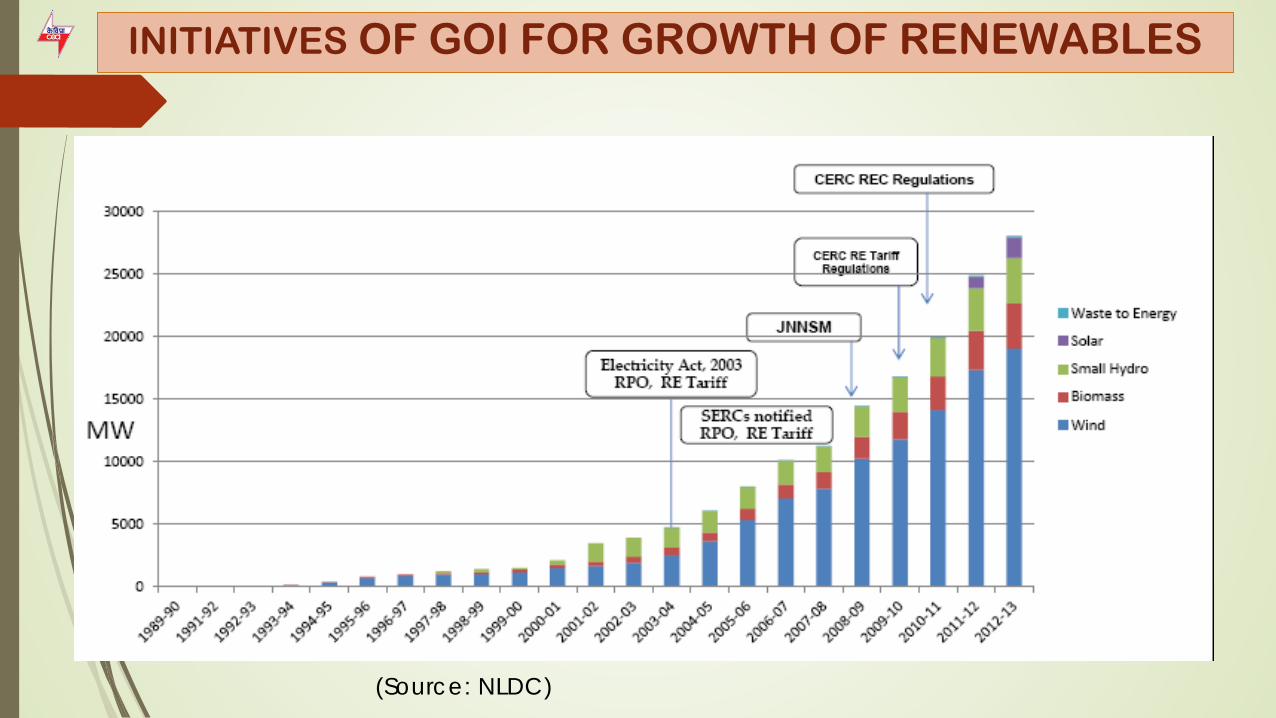
(Source: NLDC)
INITIATIVES OF GOI FOR GROWTH OF RENEWABLES
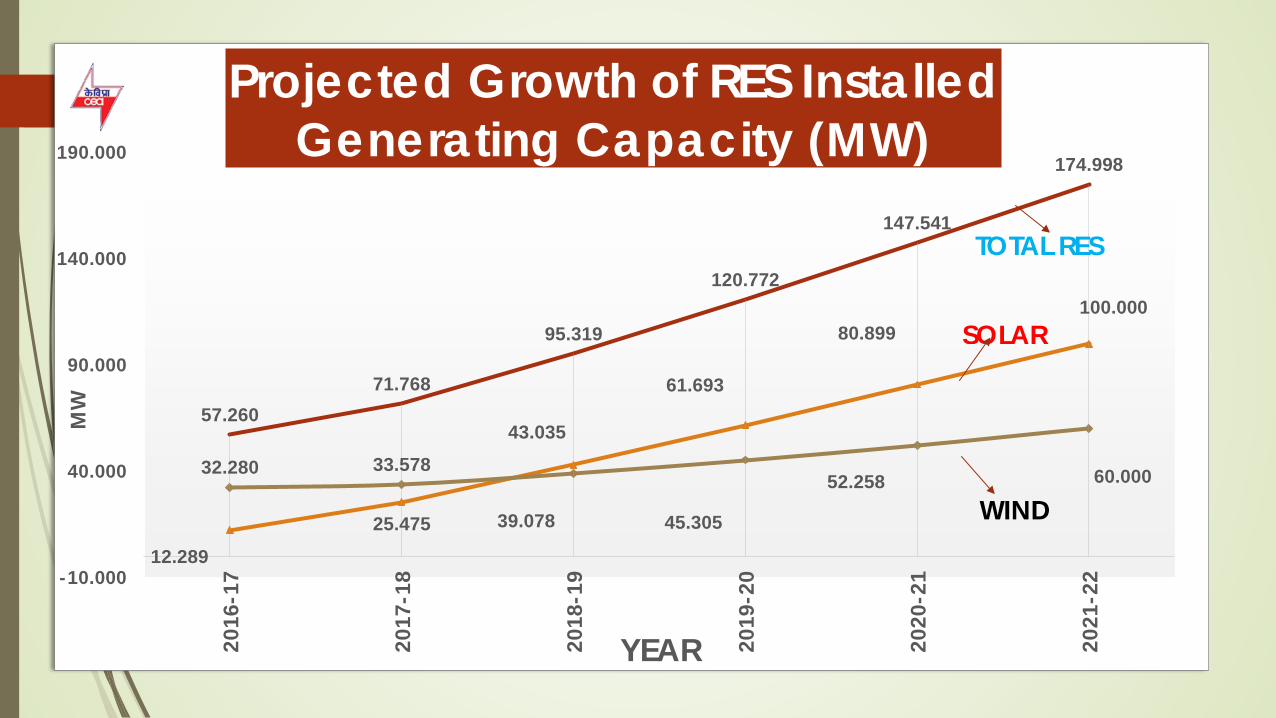
57.260 71.768
95.319
120.772
147.541
174.998
12.289 25.475
43.035
61.693
80.899 100.000
32.280 33.578
39.078 45.305
52.258 60.000
-10.000
40.000
90.000
140.000
190.000
2016
-17
2017
-18
2018
-19
2019
-20
2020
-21
2021
-22
MW
YEAR
Projected Growth of RES Installed Generating Capacity (MW)
WIND
SOLAR
TOTAL RES
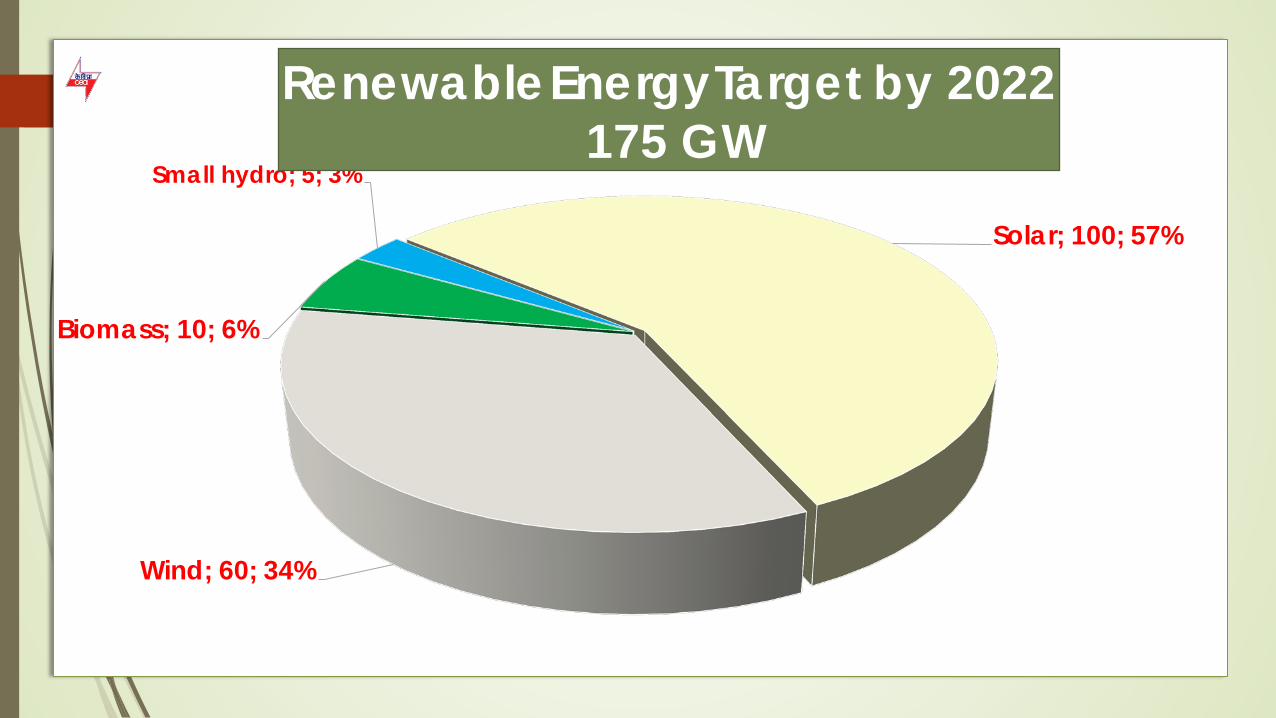
Solar; 100; 57%
Wind; 60; 34%
Biomass; 10; 6%
Small hydro; 5; 3%
Renewable Energy Target by 2022 175 GW

Maharashtra 22045 13%
Tamil Nadu 21508 12% Andhra Pradesh
18477 11%
Gujarat 17133 10%
Karnataka 14817
8%
Rajasthan 14362
8%
Uttar Pradesh 14221
8%
Madhya Pradesh 12018
7% [CATEGORY NAME]* [PERCENTAGE]
Projected RES Installed Capacity in RE Rich States by 2021-22
GENERATION PROFILE OF RES
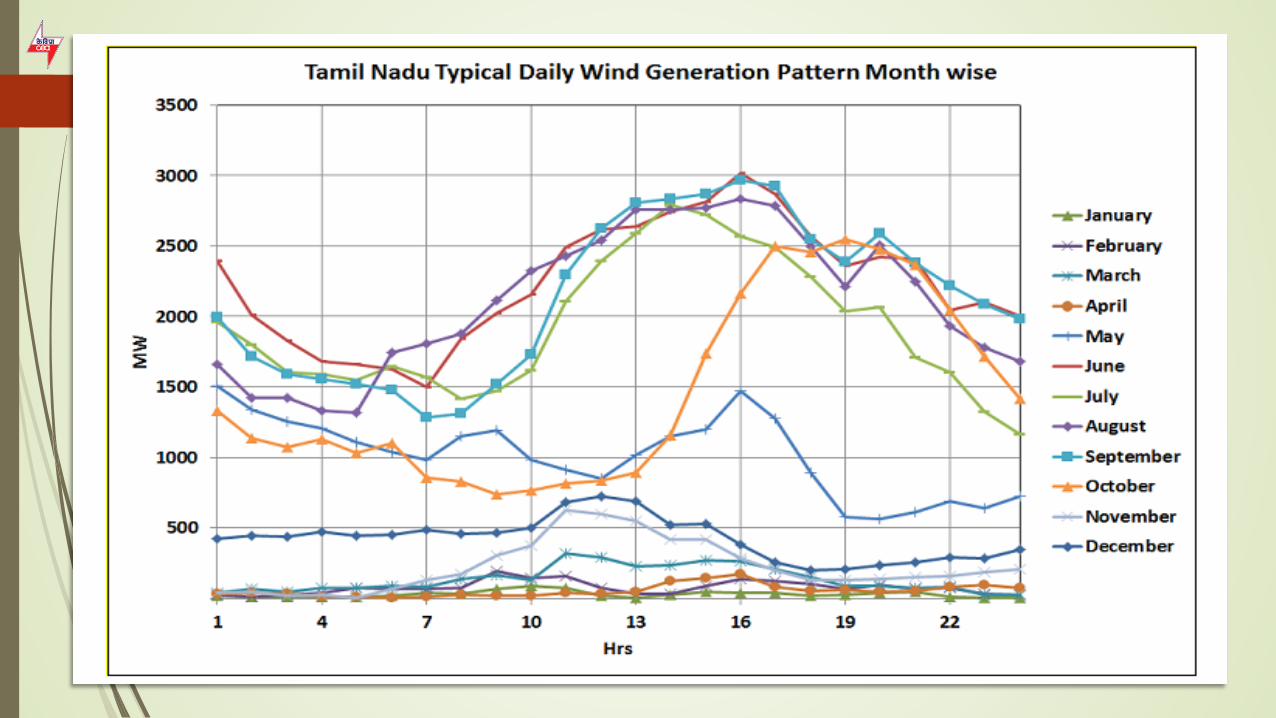
RES derive energy from natural sources, their availability may be highly variable and so these generation sources are called Variable Renewable Energy Sources(VRE).
Generation from the VRE cannot be scheduled with the same accuracy as that from conventional sources. The variability occurring is both diurnal and seasonal, as is the case of generation from solar plants.
The other reason for variation is attributed to the uncertainty associated with natural phenomenon like sudden movement of clouds etc.

Solar
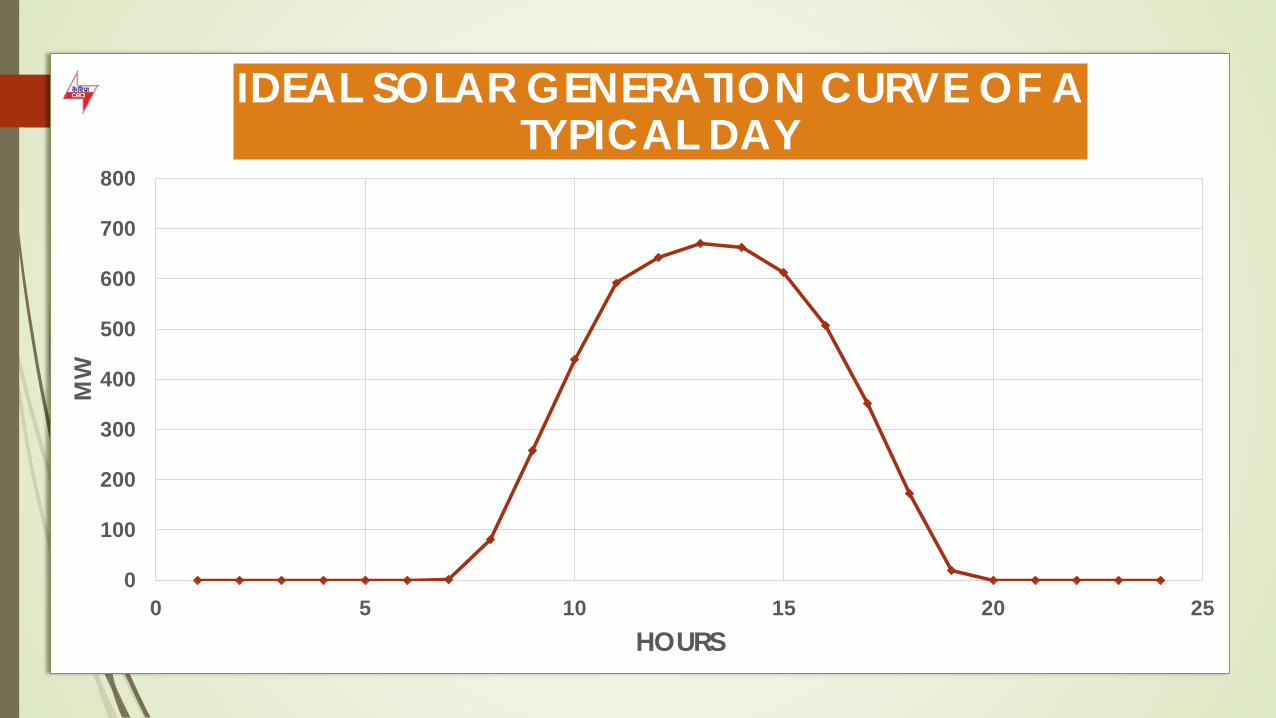
Solar energy generation involves the use of the sun’s energy to provide electricity via solar photovoltaic (PV) and concentrated solar power (CSP) systems.
The amount of energy produced directly depends on the sunshine intensity. Thus, the output varies both seasonally and daily.
Also there are short term variations due to weather conditions like clouds or rainfall.
Normally generation from a solar plant gradually increases after dawn and reaches a maximum around noon and then gradually decreases and becomes “Zero” with the advent of evening.
0
100
200
300
400
500
600
700
800
0 5 10 15 20 25
MW
HOURS
IDEAL SOLAR GENERATION CURVE OF A TYPICAL DAY


Solar
The uncertainty associated with the output of a single PV system can be smoothened out in two ways-
Aggregating a large no. of PV systems and Aggregating the output of different PV systems
scattered at dispersed geographic locations. As the number of PV plants increases, their normalized, aggregate output becomes smoother

Wind
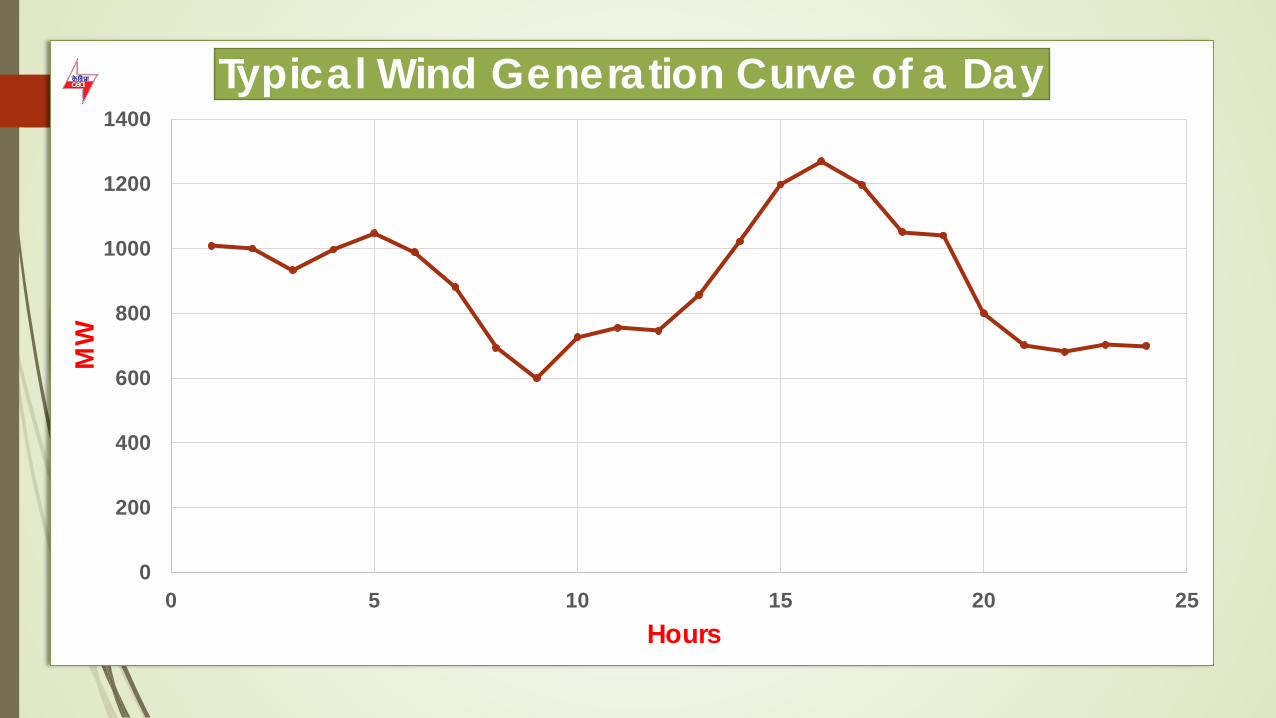
Wind turbine output is directly proportional to cube of the wind speed, wind power becomes unavailable at both very low and very high speed.
This is different from the solar generation where
changes occur rapidly and variation may be from second to second due to cloud cover.
0
200
400
600
800
1000
1200
1400
0 5 10 15 20 25
MW
Hours
Typical Wind Generation Curve of a Day

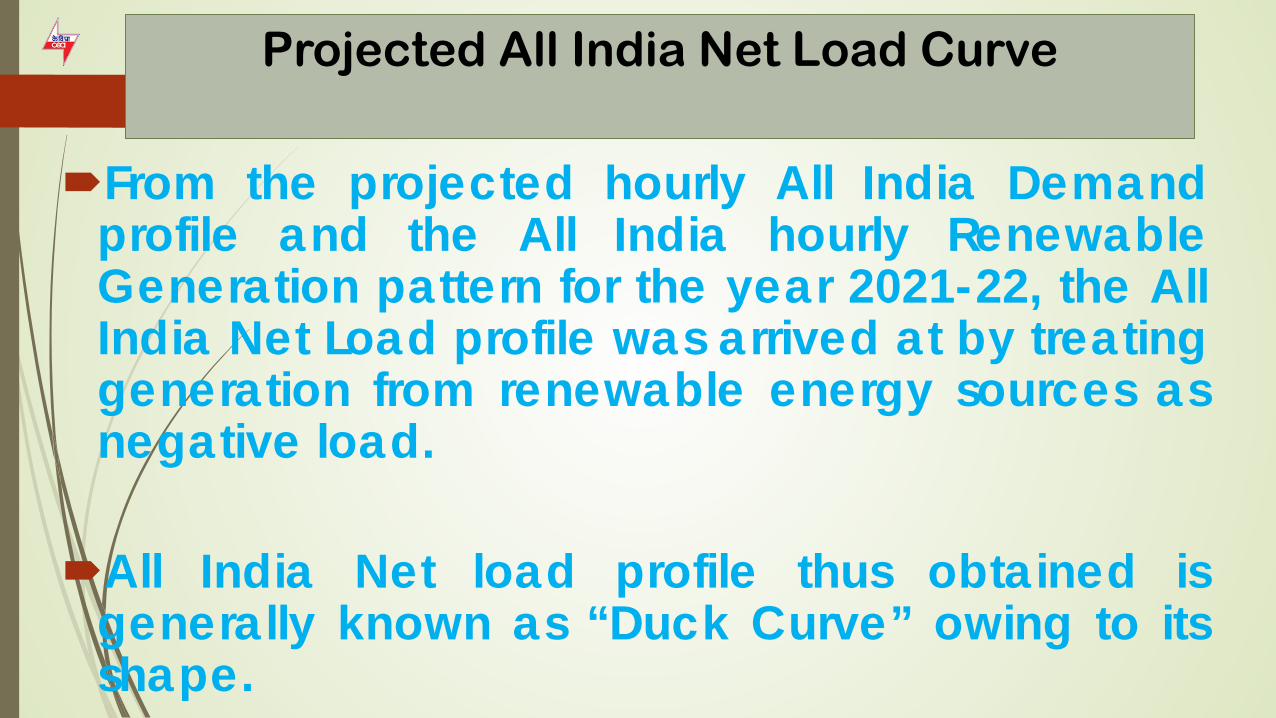
Projected All India Net Load Curve
From the projected hourly All India Demand profile and the All India hourly Renewable Generation pattern for the year 2021-22, the All India Net Load profile was arrived at by treating generation from renewable energy sources as negative load.
All India Net load profile thus obtained is
generally known as “Duck Curve” owing to its shape.

205598
225751
194161
215431
111.000
131.000
151.000
171.000
191.000
211.000
231.000
251.000
1 2 3 4 5 6 7 8 9 10 11 12 13 14 15 16 17 18 19 20 21 22 23 24
MW
HOURS
PROJECTED ALL INDIA LOAD OF A DAY
TOTAL LOAD NET LOAD
MAJOR CHALLENGES
Advanced Forecasting
Increased Ramping Requirements
Balancing requirement
Transmission System Strengthening
Market Design
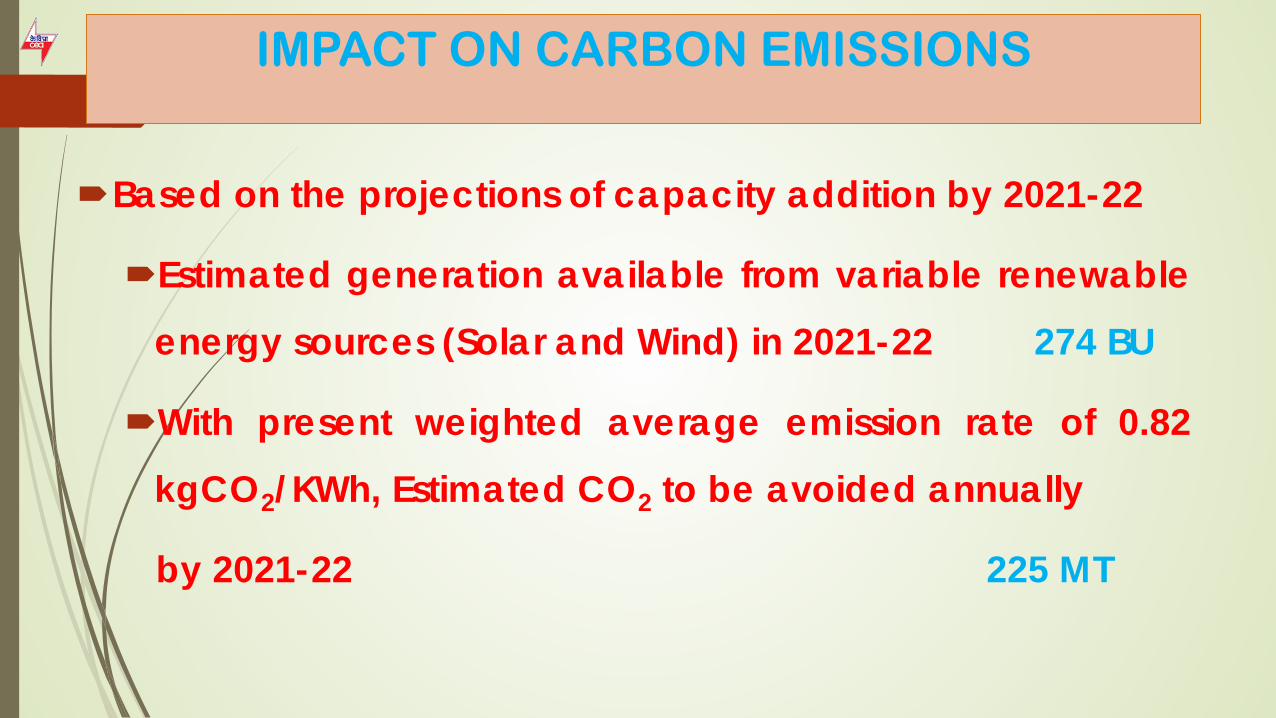
IMPACT ON CARBON EMISSIONS
Based on the projections of capacity addition by 2021-22
Estimated generation available from variable renewable
energy sources (Solar and Wind) in 2021-22 274 BU
With present weighted average emission rate of 0.82
kgCO2/KWh, Estimated CO2 to be avoided annually
by 2021-22 225 MT
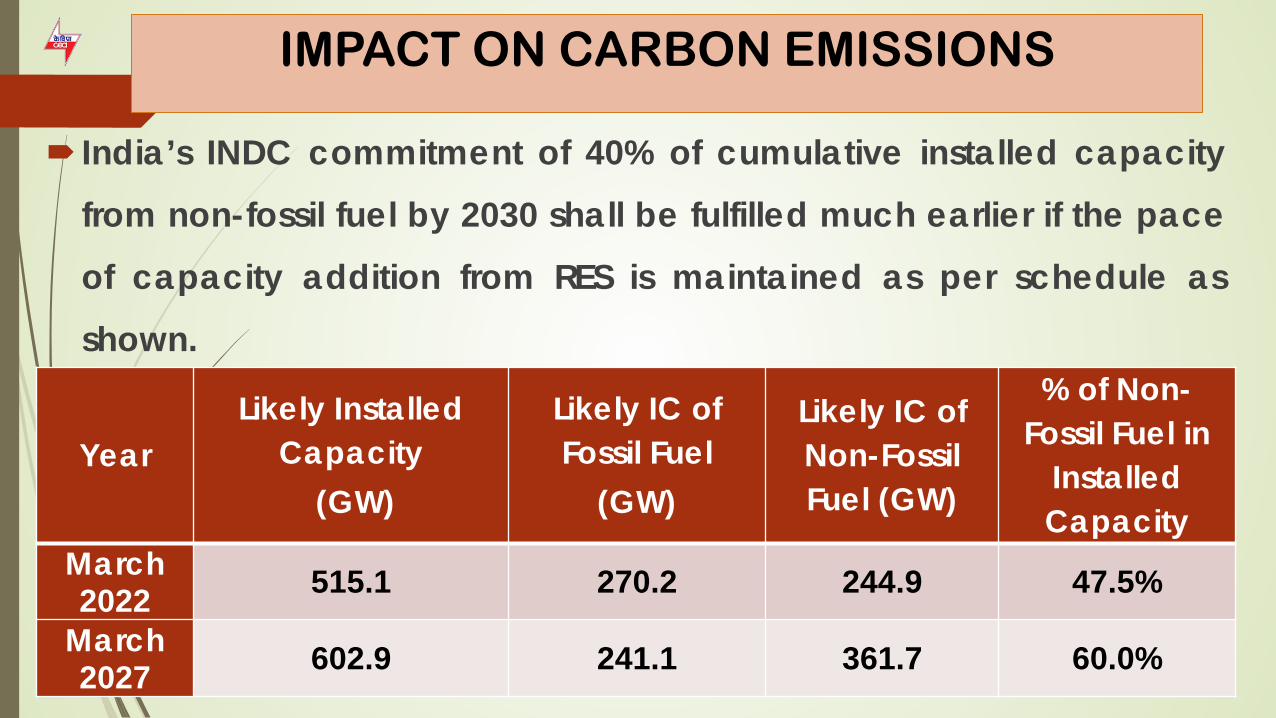
IMPACT ON CARBON EMISSIONS
India’s INDC commitment of 40% of cumulative installed capacity
from non-fossil fuel by 2030 shall be fulfilled much earlier if the pace
of capacity addition from RES is maintained as per schedule as
shown.
Year Likely Installed
Capacity (GW)
Likely IC of Fossil Fuel
(GW)
Likely IC of Non-Fossil Fuel (GW)
% of Non-Fossil Fuel in
Installed Capacity
March 2022
515.1 270.2 244.9 47.5%
March 2027
602.9 241.1 361.7 60.0%
IMPACT ON PLF OF THE COAL BASED PLANTS
Indian power sector is dominated by Coal
based generation, the impact would be largely
felt by these plants. In fact, the study results
indicate that the generation from VRE and Coal
based plants are almost perfectly negatively
co-related.
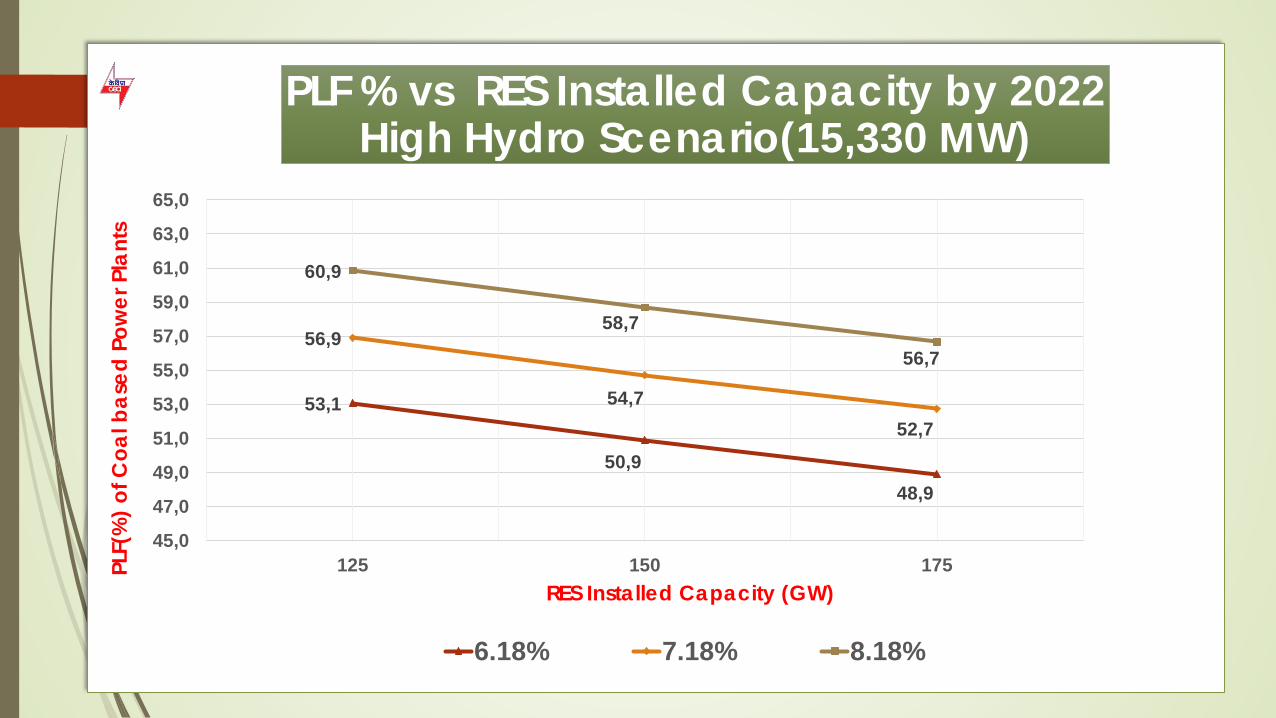
53,1
50,9 48,9
56,9
54,7 52,7
60,9
58,7
56,7
45,0
47,0
49,0
51,0
53,0
55,0
57,0
59,0
61,0
63,0
65,0
125 150 175PLF(
%) o
f Coa
l bas
ed P
ower
Pla
nts
RES Installed Capacity (GW)
PLF % vs RES Installed Capacity by 2022 High Hydro Scenario(15,330 MW)
6.18% 7.18% 8.18%
CONCLUSIONS
1. The share of energy generation from Renewable energy sources is going to increase from 7 % at present to around 20% of the total energy requirement by the year 2022.
2. However, this increase in generation from RE sources will lead to conventional generating plants to be more flexible to cater to the increased ramping requirements due to variability associated with RE generating sources.
3. Advanced forecasting techniques need to be adopted to accurately predict the output generation from Renewable Energy sources.
4. The Transmission system needs to be strengthened to evacuate renewable energy from rich RE states to other parts of the country.