Download - Kailua_Kaneohe May's RE Statistics

8/9/2019 Kailua_Kaneohe May's RE Statistics
http://slidepdf.com/reader/full/kailuakaneohe-mays-re-statistics 1/3

8/9/2019 Kailua_Kaneohe May's RE Statistics
http://slidepdf.com/reader/full/kailuakaneohe-mays-re-statistics 2/3
Single-Family DetachedTownhouse-Condo
Local Market UpdatesA research tool from the Honolulu Board of REALTORS®
2009 2010 Change 2009 2010 Change
New Listings 22 40 + 81.8% 182 183 + 0.5%Closed Sales 13 26 + 100.0% 60 98 + 63.3%Median Sales Price* $677,000 $699,000 + 3.2% $701,000 $746,000 + 6.4%Average Sales Price* $678,923 $854,916 + 25.9% $769,034 $966,661 + 25.7%Percent of Original List Price Received at Sale* 93.9% 96.2% + 2.5% 89.4% 95.2% + 6.6%Median Days on Market Until Sale 40 37 - 8.8% 70 35 - 49.6%Inventory of Homes for Sale at Month End 157 109 - 30.6% -- -- --
*Does not account for list prices from any previous listing contracts or seller concessions
2009 2010 Change 2009 2010 Change
New Listings 13 15 + 15.4% 49 59 + 20.4%Closed Sales 6 6 - 0.0% 20 30 + 50.0%Median Sales Price* $397,500 $297,500 - 25.2% $375,000 $367,500 - 2.0%Average Sales Price* $383,500 $386,167 + 0.7% $397,425 $419,167 + 5.5%Percent of Original List Price Received at Sale* 94.7% 94.6% - 0.1% 92.0% 96.5% + 4.9%Median Days on Market Until Sale 47 34 - 26.9% 56 25 - 55.9%Inventory of Homes for Sale at Month End 35 24 - 31.4% -- -- --
*Does not account for list prices from any previous listing contracts or seller concessions
Kailua - Waimanalo (1-4-1 to 1-4-3)
May Year to DateCondo
May Year to DateSingle Family
YTD New Listings YTD Closed Sales
Single-Family Condo
182
49
183
59
YTD New Listings
2009
2010
Some of the figures referenced in this report are for only one month worth of activity. As such, they can sometimes look extreme due to the small sample size involved.
+ 0.5% + 20.4%
Single-Family Condo
60
20
98
30
YTD Closed Sales
2009
2010
+ 63.3% + 50.0%
Single-Family Condo
$769,034
$397,425
$966,661
$419,167
YTD Median Sales Price
2009
2010
+ 25.7% + 5.5%
Single-Family Condo
89.4% 92.0%95.2% 96.5%
YTD Percent of Orig. List Price Received
2009
2010
+ 6.6% + 4.9%
Single-Family Condo
70
56
3525
YTD Days on Market Until Sale
2009
2010
- 49.6% - 55.9%
Single-Family Condo
157
35
109
24
Inventory of Homes for Sale at Month End
5-2009 5-2010
- 30.6% - 31.4%
All data from the HiCentral MLS, Ltd. Powered by 10K Research Marketing.
8/9/2019 Kailua_Kaneohe May's RE Statistics
http://slidepdf.com/reader/full/kailuakaneohe-mays-re-statistics 3/3
Single-Family DetachedTownhouse-Condo
Local Market UpdatesA research tool from the Honolulu Board of REALTORS®
2009 2010 Change 2009 2010 Change
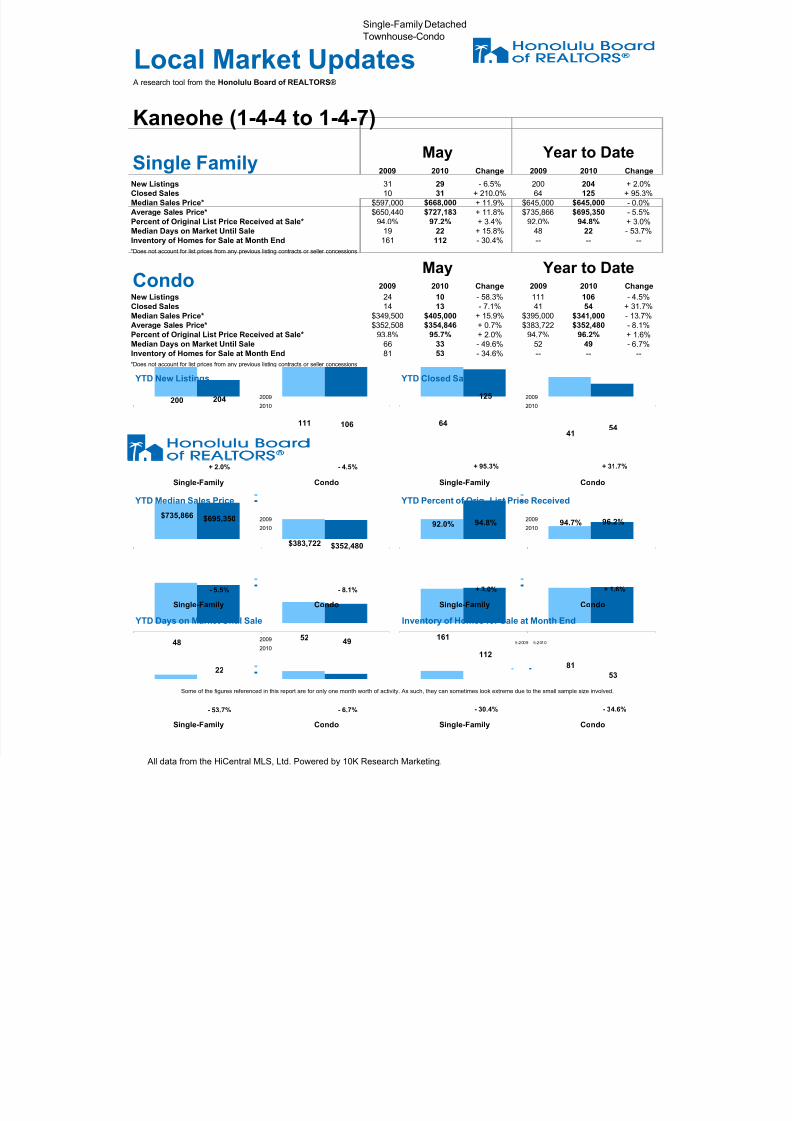
New Listings 31 29 - 6.5% 200 204 + 2.0%Closed Sales 10 31 + 210.0% 64 125 + 95.3%Median Sales Price* $597,000 $668,000 + 11.9% $645,000 $645,000 - 0.0%Average Sales Price* $650,440 $727,183 + 11.8% $735,866 $695,350 - 5.5%Percent of Original List Price Received at Sale* 94.0% 97.2% + 3.4% 92.0% 94.8% + 3.0%Median Days on Market Until Sale 19 22 + 15.8% 48 22 - 53.7%Inventory of Homes for Sale at Month End 161 112 - 30.4% -- -- --
*Does not account for list prices from any previous listing contracts or seller concessions
2009 2010 Change 2009 2010 Change
New Listings 24 10 - 58.3% 111 106 - 4.5%Closed Sales 14 13 - 7.1% 41 54 + 31.7%Median Sales Price* $349,500 $405,000 + 15.9% $395,000 $341,000 - 13.7%Average Sales Price* $352,508 $354,846 + 0.7% $383,722 $352,480 - 8.1%Percent of Original List Price Received at Sale* 93.8% 95.7% + 2.0% 94.7% 96.2% + 1.6%Median Days on Market Until Sale 66 33 - 49.6% 52 49 - 6.7%Inventory of Homes for Sale at Month End 81 53 - 34.6% -- -- --
*Does not account for list prices from any previous listing contracts or seller concessions
Kaneohe (1-4-4 to 1-4-7)
May Year to DateCondo
May Year to DateSingle Family
YTD New Listings YTD Closed Sales
Single-Family Condo
200
111
204
106
YTD New Listings
2009
2010
Some of the figures referenced in this report are for only one month worth of activity. As such, they can sometimes look extreme due to the small sample size involved.
+ 2.0% - 4.5%
Single-Family Condo
64
41
125
54
YTD Closed Sales
2009
2010
+ 95.3% + 31.7%
Single-Family Condo
$735,866
$383,722
$695,350
$352,480
YTD Median Sales Price
2009
2010
- 5.5% - 8.1%
Single-Family Condo
92.0% 94.7%94.8% 96.2%
YTD Percent of Orig. List Price Received
2009
2010
+ 3.0% + 1.6%
Single-Family Condo
4852
22
49
YTD Days on Market Until Sale
2009
2010
- 53.7% - 6.7%
Single-Family Condo
161
81
112
53
Inventory of Homes for Sale at Month End
5-2009 5-2010
- 30.4% - 34.6%
All data from the HiCentral MLS, Ltd. Powered by 10K Research Marketing.


