Download - M14 Threat Analyzer

Threat Analyzer ©2012 McAfee, Inc. All Rights Reserved. 1

Threat Analyzer ©2012 McAfee, Inc. All Rights Reserved. 2
Upon successful completion of this module you will be able to: • Navigate the Threat Analyzer page • Explain the life cycle of an alert • Differentiate between Real-time versus Historical alerts • View summary and drill-down alert information • Create a Dashboard and a Monitor within the Threat Analyzer • Install and configure the Incident Generator

Threat Analyzer ©2012 McAfee, Inc. All Rights Reserved. 3

Threat Analyzer ©2012 McAfee, Inc. All Rights Reserved. 4
The Threat Analyzer is used for the analysis of the alerts detected by the Sensors (as well as those processed by an integrated Host Intrusion Prevention client). The Threat Analyzer works in conjunction with the policies applied to the Sensors. When a transmission violating an enforced security policies is detected by a Sensor, the Sensor compiles information about the offending transmission and sends this "attack" data to NSP Manager in the form of an alert. Alert details include transmission data such as source and destination IP addresses in the packet, as well as security analysis information (performed by the Sensor) such as attack type and severity. Alerts are backed up to the database and archived in order of occurrence.

Threat Analyzer ©2012 McAfee, Inc. All Rights Reserved. 5
An attack is a violation of set policy parameters. An alert is one or more attack instances. In many cases, an alert represents a single detected attack. A multi-attack alert is generated when multiple instances of identical attacks (same source IP, destination IP, and specific attack) are detected within a two minute period; data for all attacks is throttled into one alert instance, however, you can also choose to configure how many of each throttled attacks you want to see an individual alert.

Threat Analyzer ©2012 McAfee, Inc. All Rights Reserved. 6
Alerts exist in one of three states: • Unacknowledged • Acknowledged • Marked for deletion
Alerts exist in one of three states: unacknowledged/acknowledged, and marked for deletion. When an alert is raised, it appears in the Manager in an unacknowledged state. Unacknowledged means that you have not officially recognized its presence by marking it acknowledged. An alert remains in an unacknowledged state until you either acknowledge or delete it. Deleted alerts are removed from the database. Unacknowledged alerts are displayed in the various monitors available for the Manager Dashboard page and the Real-time view in the Threat Analyzer. Acknowledging alerts dismisses them from these views. Acknowledged alerts display only in the Historical view in the Threat Analyzer and in reports. Deleting an alert both acknowledges it and marks it for deletion. The alert is not actually deleted until a scheduled Disk Space Maintenance takes place. At that time, McAfee Network Security Platform deletes those alerts marked for deletion and those alerts meeting the deletion criteria specified in the scheduler-older than 30 days, for example, whether or not they have been manually marked for deletion.
Threat Analyzer ©2012 McAfee, Inc. All Rights Reserved. 7
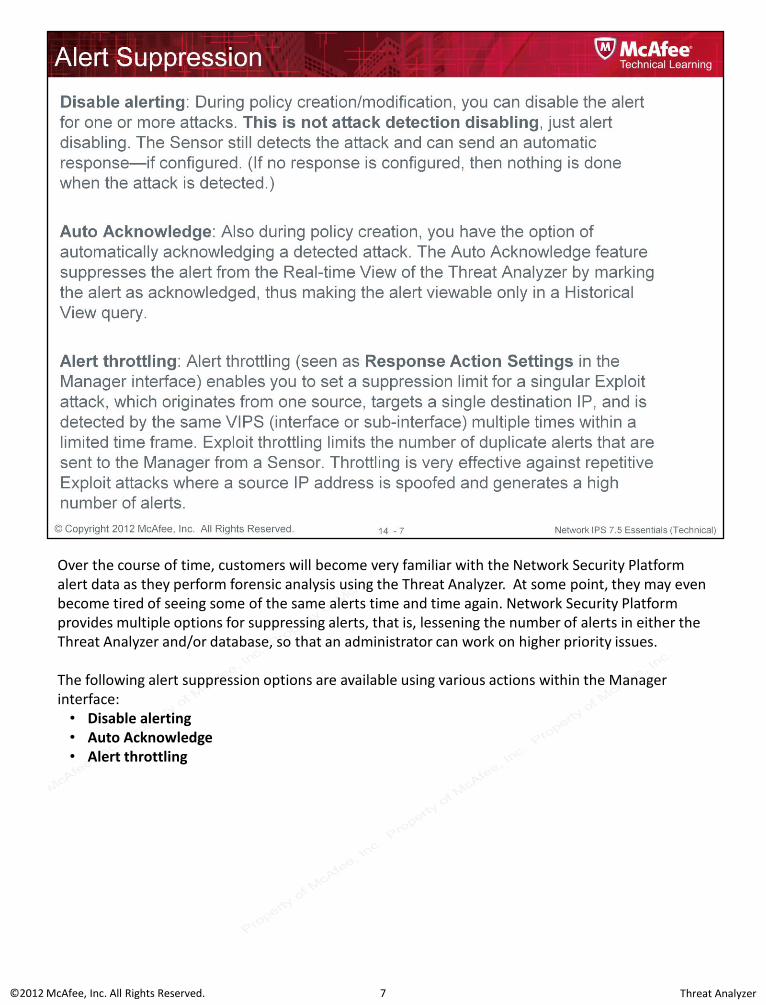
Over the course of time, customers will become very familiar with the Network Security Platform alert data as they perform forensic analysis using the Threat Analyzer. At some point, they may even become tired of seeing some of the same alerts time and time again. Network Security Platform provides multiple options for suppressing alerts, that is, lessening the number of alerts in either the Threat Analyzer and/or database, so that an administrator can work on higher priority issues. The following alert suppression options are available using various actions within the Manager interface: • Disable alerting • Auto Acknowledge • Alert throttling

Threat Analyzer ©2012 McAfee, Inc. All Rights Reserved. 8
Step a. All alerts are received by the Manager from the reporting Sensors. The alerts are sent to both the alert cache and the database.
Step b. Once the alert cache’s buffer begins to overflow, the oldest alerts are dropped from the cache. Since no modifications have been made, the database version is maintained and the cached version is deleted.
Step c. A Real-Time View query is started requesting x number of alerts. These alerts are pulled from the alert cache.
Step d. If during a Real-Time analysis an alert is Acknowledge[d] or Delete[d], the altered alert file is forwarded to the database and the database version is updated with the recent changes. The interaction between a Real-Time Threat Analyzer and the database is one way; that is, alert record changes can be pushed from the Real-Time Threat Analyzer, but a Real-Time Threat Analyzer does not receive any data from the database.
Step e. During a Real-Time analysis, new alerts are received from the alert cache as they are reported, refreshing every 5 seconds. Since the Real-Time Threat Analyzer has a maximum number of alerts that can be viewed at a time, the oldest alerts are dropped to accommodate new alerts. Since no modifications have been made, the database version is maintained and the cached version is deleted.
Step f. An Historical query pulls alerts only from the database; there is no interaction between the alert cache and a Historical query. There is no refresh of newer alerts because the Historical Threat Analyzer only requests alerts from a specific time frame. Any alert file alteration (acknowledgement, deletion, and so forth) is simultaneously saved to the database. Thus, the Historical Threat Analyzer can pull and push alert records directly from the database.

Threat Analyzer ©2012 McAfee, Inc. All Rights Reserved. 9
Threat Analyzer The Threat Analyzer is used for the analysis of the alerts detected by the Sensors. When a transmission violating a policy is detected by a Sensor, the Sensor compiles information about the offending transmission and sends this "attack" data to the Manager in the form of an alert. Alert details include transmission data such as source and destination IP addresses in the packet, as well as security analysis information (performed by the Sensor) such as attack type and severity.

Threat Analyzer ©2012 McAfee, Inc. All Rights Reserved. 10
The Real-Time Threat Analyzer displays unacknowledged alerts from the alert cache. Once opened, the Real-Time Threat Analyzer refreshes frequently to display the alerts that are being detected by your Sensors, so you can view the alerts as they happen in real time. NOTE: Alerts that are auto-acknowledged, will not be displayed in the Real-Time Threat Analyzer. The Historical Threat Analyzer sets the filter to retrieve information for both acknowledged and unacknowledged alerts archived in the database during a specified time frame. The Historical Threat Analyzer does not refresh with new alerts.

Threat Analyzer ©2012 McAfee, Inc. All Rights Reserved. 11
When the Threat Analyzer is launched, a check is made for role access. This controls what a user can actually see in the Threat Analyzer (Real-Time or Historical). To view or modify the various role names and assigned access you need to be a super user in the root domain.
Threat Analyzer ©2012 McAfee, Inc. All Rights Reserved. 12
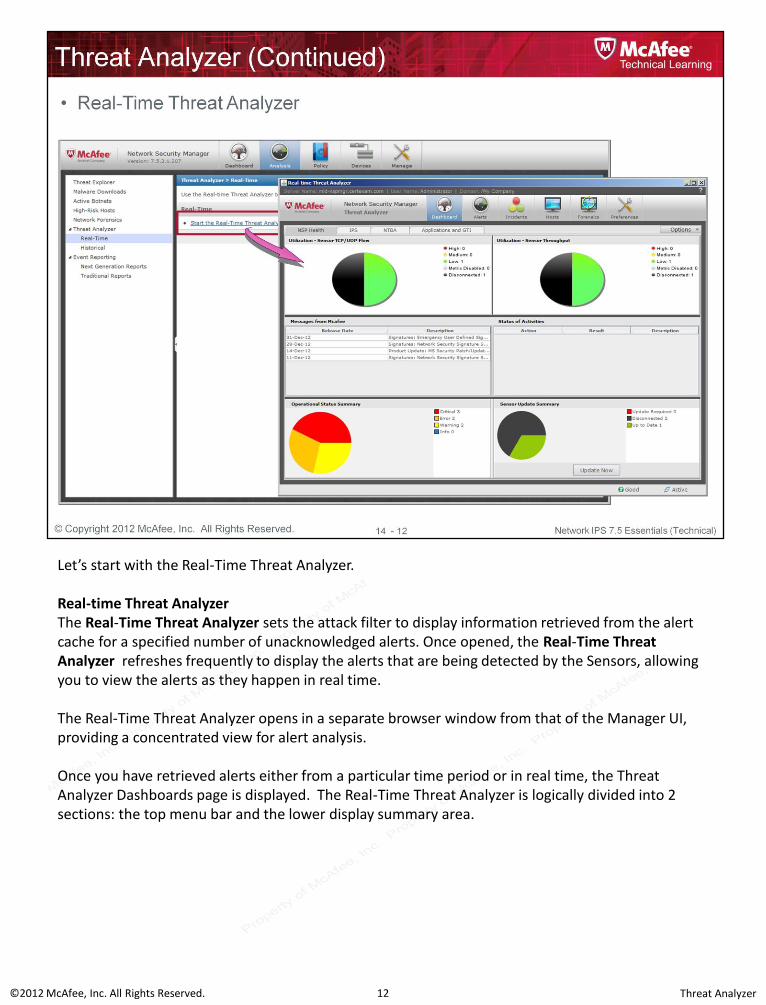
Let’s start with the Real-Time Threat Analyzer. Real-time Threat Analyzer The Real-Time Threat Analyzer sets the attack filter to display information retrieved from the alert cache for a specified number of unacknowledged alerts. Once opened, the Real-Time Threat Analyzer refreshes frequently to display the alerts that are being detected by the Sensors, allowing you to view the alerts as they happen in real time. The Real-Time Threat Analyzer opens in a separate browser window from that of the Manager UI, providing a concentrated view for alert analysis. Once you have retrieved alerts either from a particular time period or in real time, the Threat Analyzer Dashboards page is displayed. The Real-Time Threat Analyzer is logically divided into 2 sections: the top menu bar and the lower display summary area.

Threat Analyzer ©2012 McAfee, Inc. All Rights Reserved. 13
The menu bar of the Real-Time Threat Analyzer presents you with the following navigation options: • Dashboard: links to the Threat Analyzer NSP Health view page. The Dashboards page provides
two default dashboards namely, NSP Health and IPS. • Alerts: links to the Threat Analyzer Alerts view page. It lists all of the attacks for the selected time
span in order of occurrence. • Hosts: links to the Hosts page. You can view the list of IPS hosts. • Incident Viewer: links to the Incident Viewer page. You can create user-generated incidents to
track alerts by parameters. • Host Forensics: links to the Host Forensics page. You can view the ePO and Vulnerability Manager
scan information. • Preferences: links to the Preferences page. Enables you to personally set various options related
to Threat Analyzer functionality and presentation.

Threat Analyzer ©2012 McAfee, Inc. All Rights Reserved. 14
Historical Threat Analyzer The Historical Threat Analyzer sets the filter to retrieve information for both acknowledged and unacknowledged alerts that are archived in the database, during a specified time. The Historical Threat Analyzer does not refresh with new alerts, thus you can focus on analyzing all alerts within the time frame that you requested. When you click Historical Threat Analyzer from within the Manager, the Historical Constraints page is displayed. Here you can select the Start Time and End Time for viewing alert historical data from the database. You can also set additional constraints such as address type, source and destination IP addresses, attack names, so forth.

Threat Analyzer ©2012 McAfee, Inc. All Rights Reserved. 15
The Historical Threat Analyzer opens in a separate browser window from that of the Manager UI, providing a concentrated view for alert analysis. Like the Real-Time Threat Analyzer, the Historical Threat Analyzer is logically divided into 2 sections: the top menu bar and the lower display summary area.

Threat Analyzer ©2012 McAfee, Inc. All Rights Reserved. 16
The menu bar of the Historical Threat Analyzer presents you with the following navigation options: • Dashboard: links to the Threat Analyzer NSP Health view page. The Dashboards page provides
two default dashboards namely, NSP Health and IPS. • Alerts: links to the Threat Analyzer Alerts view page. It lists all of the attacks for the selected time
span in order of occurrence. • Incidents: links to the Incident Viewer page. You can create user-generated incidents to track
alerts by parameters. • Hosts: links to the Hosts page. You can view the list of IPS hosts. • Forensics: links to the Forensics page. You can view the ePO and Vulnerability Manager scan
information. • Preferences: links to the Preferences page. Enables you to personally set various options related
to Threat Analyzer functionality and presentation.
Threat Analyzer ©2012 McAfee, Inc. All Rights Reserved. 17
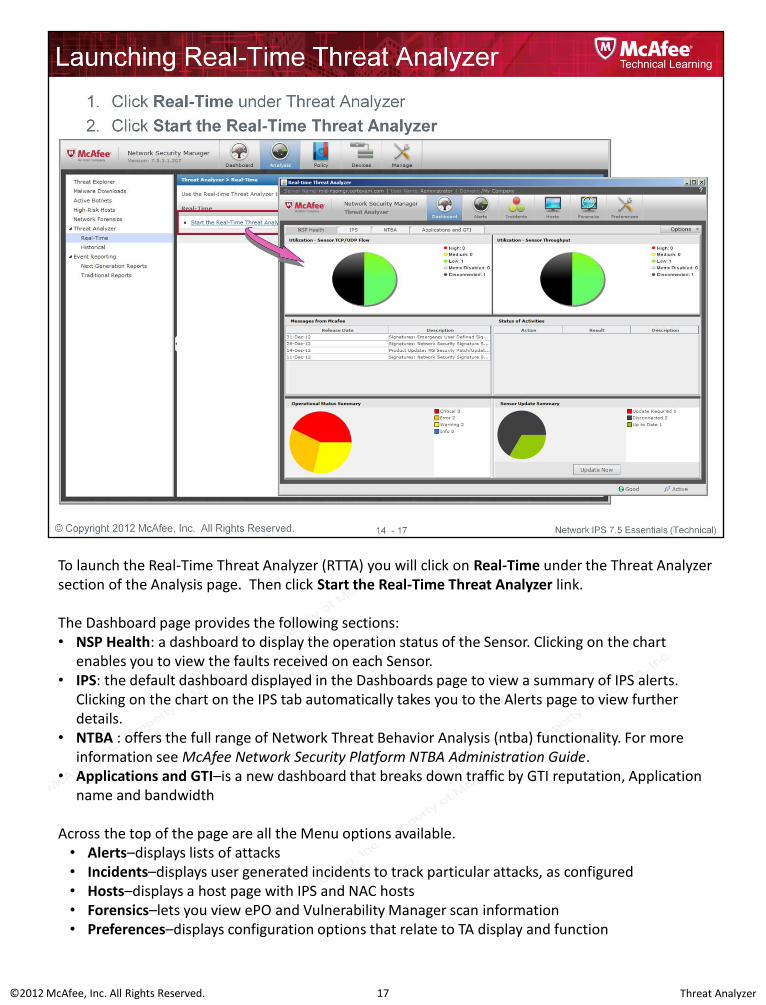
To launch the Real-Time Threat Analyzer (RTTA) you will click on Real-Time under the Threat Analyzer section of the Analysis page. Then click Start the Real-Time Threat Analyzer link. The Dashboard page provides the following sections: • NSP Health: a dashboard to display the operation status of the Sensor. Clicking on the chart
enables you to view the faults received on each Sensor. • IPS: the default dashboard displayed in the Dashboards page to view a summary of IPS alerts.
Clicking on the chart on the IPS tab automatically takes you to the Alerts page to view further details.
• NTBA : offers the full range of Network Threat Behavior Analysis (ntba) functionality. For more information see McAfee Network Security Platform NTBA Administration Guide.
• Applications and GTI–is a new dashboard that breaks down traffic by GTI reputation, Application name and bandwidth
Across the top of the page are all the Menu options available. • Alerts–displays lists of attacks • Incidents–displays user generated incidents to track particular attacks, as configured • Hosts–displays a host page with IPS and NAC hosts • Forensics–lets you view ePO and Vulnerability Manager scan information • Preferences–displays configuration options that relate to TA display and function

Threat Analyzer ©2012 McAfee, Inc. All Rights Reserved. 18
Threat Analyzer and displays the Dashboard page showing the NSP Health tab by default. The NSP Health tab enables you to view/perform the following: • Monitor Sensor TCP/UDP flow utilization: Sensor TCP/UDP flow utilization status for all the
devices configured in the Manager. • Monitor Sensor throughput utilization: Sensor throughput utilization status for all the devices
configured in the Manager. • View Messages from McAfee: displays the latest updates, the current version of signature set
applied to your Sensor. • View Status of Activities: displays the status of all the Sensors configured in the Manager. • View Operational Status Summary: displays the operational status from the Manager Home page.
This Operational Status view cannot be operated in the same manner as the Operational Status available from the Manager Home page that is, faults are not selectable. This view is available for a quick glance usage so that you do not have to leave the Threat Analyzer to get an update on possible system faults.
• View Sensor Update Summary: displays the current versions of the Sensor software and signature set of the logged-in domain. The Update Now button updates the Sensor configuration.

Threat Analyzer ©2012 McAfee, Inc. All Rights Reserved. 19
In the upper display pane on the NSP Health tab you are able to monitor the Sensor TCP/UDP flow utilization, and in the right-hand side of the pane is the Sensor Through-put. The pie charts display the consolidated status for all the Sensors configured in the Manager. The pie chart portions are color coded for High, Medium, Low, Metric Disabled and Disconnected categories. You can click on a colored portion of the pie chart to display a list of sensors and their utilization percentages relating to that portion. You are then able to select the sensor and click Chart to create time charts for the selected sensor. If you wish to view real time data, click Real-Time to start the real time polling of sensor. You will have to click Yes to confirm your choice of viewing the data in real-time. NOTE: Normal interval for utilization charts is one minute. When the real-time mode is chosen, data is polled and plotted every 10 seconds. Real time polling is done for a block of 10 minutes. User intervention is required to re-run real-time polling if need be after this block of time. This acts as a check for utilizing bandwidth in a deliberate manner.

Threat Analyzer ©2012 McAfee, Inc. All Rights Reserved. 20
In the center and bottom of the NSP Health tab display are the following reports: • Messages from McAfee–This report displays the latest updates, the current version of signature
set applied to your Sensor. It is discussed in more detail in the Update section of training. • Status of Activities–The Status of Activities section of the NSP Health tab displays the status of
currently In-Progress activities on the system that Network Security Platform identifies as long running processes. When a long running process is taking place on the Manager, the status is displayed as "In progress".
• Operational Status Summary–You can view the Operational Status summary from the General tab. This Operational Status view cannot be operated in the same manner as the Operational Status available from the Manager Home page: faults are not selectable. This view is available for quick glance usage so that you do not have to leave the Threat Analyzer to get an update on possible system faults.
• The Sensor Update Summary section–Enables you to update Sensor configurations and download SSL keys.

Threat Analyzer ©2012 McAfee, Inc. All Rights Reserved. 21
At the top of the IPS tab, the following types of Summary views are available in a pie chart format: • Attack Severity Summary–depicts alerts ratio based on severity level - High, Medium, Low,
Informational. • Attack Result Summary–depicts alerts ratio based on estimated result of detected attacks;
whether the attack was Successful, Unknown, Failed, Blocked, or the alert was raised for suspicious, but not necessarily malicious, traffic.
• RFSB Attack Summary–depicts the number of attacks recommended for blocking. • IPS Quarantine Summary–depicts the number of hosts that are quarantined by the sensor, and
the number of hosts that are not quarantined. Clicking on a sector of the various pie charts redirects you to either the Alerts or Hosts page to display details. The Attacks Over Time window, displays a bar graph with the number of attacks that have been detected in the specified time frame. Each bar contains information related to the number of attacks and a time frame in which the attacks were detected. The All Alerts consolidated view displays alerts split into five panes (or categories) for statistical review. Each pane is a bar graph, and each bar represents several alerts grouped by a specific parameter. An alert may appear in a bar in more than one pane if that alert has met the statistical parameters of multiple categories.

Threat Analyzer ©2012 McAfee, Inc. All Rights Reserved. 22
You can right-click on a bar graph to enable detailed forensic analysis of alerts. Doing so enables the following options:
• Detail View–Choosing this option redirects you to the Alerts page. Displays all details for alerts within the selected bar.
• Drilldown–Sorting alerts by categories gives multiple category-specific views for sorting and analyzing the alerts in an alert group.
• Acknowledge–This acknowledges all alerts in a bar. If working in a Real-Time Threat Analyzer, acknowledged alerts are removed from the current view, and can only be seen using a Historical Threat Analyzer. Acknowledging an alert means you recognize the alert has occurred and is familiar with the alert’s information; thus, you want to archive the alert for later referral. Acknowledgement removes the alert from the statistical values presented in the Network Attack Status field, and the alert is only retrieved from the database for subsequent Historical searches.
• Delete–This option deletes all alerts in a selected bar. If working in a Real-Time Threat Analyzer, deleted alerts are removed from the current view, and can only be seen using a Historical Threat Analyzer. Alerts marked for deletion are no longer available for viewing once disk space maintenance for alerts has occurred.
• Analyze–This option refreshes the consolidated view according to the time level. If a bar is selected from the consolidated pane and you click on analyze, then consolidated view is refreshed, and alerts are displayed.

Threat Analyzer ©2012 McAfee, Inc. All Rights Reserved. 23
For Result Status, both the consolidated view and the drilldown count view display the result categories along with the matching number of alerts per category. In the consolidated view, the Result Status displays the count for all alerts within the present Threat Analyzer session. For a drilldown, the resulting table displays alert count per result category for the alerts in a selected bar, rather than all alerts.
The Result Status categories for alerted attacks are as follows:
• Attack Successful–the attack was either successful or possibly successful.
• n/a – the alert was raised for suspicious, but not necessarily malicious, traffic. This result is common for Reconnaissance attacks due to the nature of port scanning and host sweeping.
• Inconclusive – the result of the attack is not known. This is most likely due to a generic policy, such as the Default or All-Inclusive policy where the policy rules are not environment specific. An attack against an irrelevant node, for example.
• Attack Blocked – the attack was blocked by a “Drop packets” Sensor response.
• Attack Failed–the attack had no impact.
• DoS Blocking Activated - applies to DoS traffic and indicates that the Sensor has identified traffic that is suspicious in nature that is exceeding its learned threshold or is not recognized based on its profile. The Sensor has started blocking unknown traffic, while attempting (on a packet-by-packet basis) to block only DoS traffic from a trusted source. The Sensor attempts to allow legitimate traffic to flow from the trusted source. Because of the nature of DoS attacks, one cannot be certain that 100% of bad traffic was blocked, nor that 100% of ‘good’ traffic was permitted.

Threat Analyzer ©2012 McAfee, Inc. All Rights Reserved. 24
Additional dashboards are automatically added when NTBA or NAC are added to the manager. Integration with NTBA is beyond the scope of this training module.

Threat Analyzer ©2012 McAfee, Inc. All Rights Reserved. 25
Applications and GTI
The Applications and GTI tab includes:
• Attack Source and Destination Reputation - This monitor lists the top Attack Destinations and sources organized by GTI category. You must have GTI enabled on the NSP manager and sensors to categorize sites.
• Top 10 Attack Destination and Source Countries – Lists in pie chart form the source and destination countries. You must have GTI enabled and the Geolocation database installed in the sensors to populate this data.
• Top Applications Summary – Applications listed by Bandwidth, Risk, Connection and # of attacks
• Bytes – Bandwidth distribution broken down by application type
NOTE: When the user double clicks a graph, he can drilldown to the respective page (either to Alerts or Hosts).

Threat Analyzer ©2012 McAfee, Inc. All Rights Reserved. 26
The Threat Analyzer allows you to add your own dashboard or monitors using Options on the top right corner of the Summary page. A monitor is a customized page to view alerts and threats. You can either use the default monitors or create your own. When you add a dashboard, it is initially made up of a single window where you can assign a monitor. Once you assign or create the first monitor, you can right-click on the name display area of the monitor (that you have just added) to split the window vertically or horizontally. In the split window, you can add another monitor to further build the dashboard of your choice. You can resize each monitor window size using the drag and drop method. You can create as many dashboards as you need. If the number of dashboards increases, the Threat Analyzer automatically provides scroll bars for ease of use. You can perform the following actions using dashboards: • Create customized dashboards and name/rename them accordingly • Create/edit/delete multiple dashboards • Switch between two summary pages in a default dashboard using toggle • Move to the next and back page of multiple dashboards using the scroll bar • Move custom dashboards using the Move left/move right buttons

Threat Analyzer ©2012 McAfee, Inc. All Rights Reserved. 27
This example dashboard will be used to view the port throughput of the Sensor(s).

Threat Analyzer ©2012 McAfee, Inc. All Rights Reserved. 28
The steps for adding an existing Monitor include selecting a category, type, and then choosing the monitor or monitors to add.

Threat Analyzer ©2012 McAfee, Inc. All Rights Reserved. 29
The next step is to choose the device ports to monitor. The newly created dashboard will be available as a new tab.

Threat Analyzer ©2012 McAfee, Inc. All Rights Reserved. 30
In this section we’ll review the Alerts page. Alerts The Alerts page lists attacks on a real-time basis in the Real-Time Threat Analyzer and for the selected time span in the Historical Threat Analyzer in order of occurrence, with most recent being listed first. Attack details are presented using multiple columns, known as attributes. The attributes represent packet fields such as source and destination IP address, as well as Sensor analysis fields such as attack severity and type.

Threat Analyzer ©2012 McAfee, Inc. All Rights Reserved. 31
Threat Analyzer is used often to mean the Alert view of the Threat Analyzer. This view is used for the analysis of the alerts detected by the Sensors. The Threat Analyzer works in conjunction with the policies applied to the Sensor(s). In Real Time mode, the alerts are retrieved from Alert Cache and by default 20000 alerts will be loaded. By examining and acknowledging the alerts, customers can use the information that the analysis provides to determine system weaknesses and be able to modify defenses. The total number of alerts the Threat Analyzer can display has a direct correlation to your system’s memory. McAfee recommends a minimum of 1 gigabyte of RAM, and typically this supports 1,000,000 alerts.

Threat Analyzer ©2012 McAfee, Inc. All Rights Reserved. 32
Right-click options are available from each alert. Here you have the ability to quickly create an exception for a specified alert.

Threat Analyzer ©2012 McAfee, Inc. All Rights Reserved. 33
With the release of Network Security Platform 7.5.3, exception objects, can be created and assigned to an alert in a single step in the Real-Time Threat Analyzer. This should help address a significant pain point for many existing customers. This option is also available on the Hosts page.

Threat Analyzer ©2012 McAfee, Inc. All Rights Reserved. 34
The All Alerts view displays all attacks present in the current query view. When the Group By option is selected, the display shows the Alert, Attack counts, and other parameters for the chosen group attribute. The Alert count displays the number of times each attack has been reported within the parameters. The All Alerts view also displays pertinent information for each attack, including severity, benign trigger probability, and so forth.
Threat Analyzer ©2012 McAfee, Inc. All Rights Reserved. 35
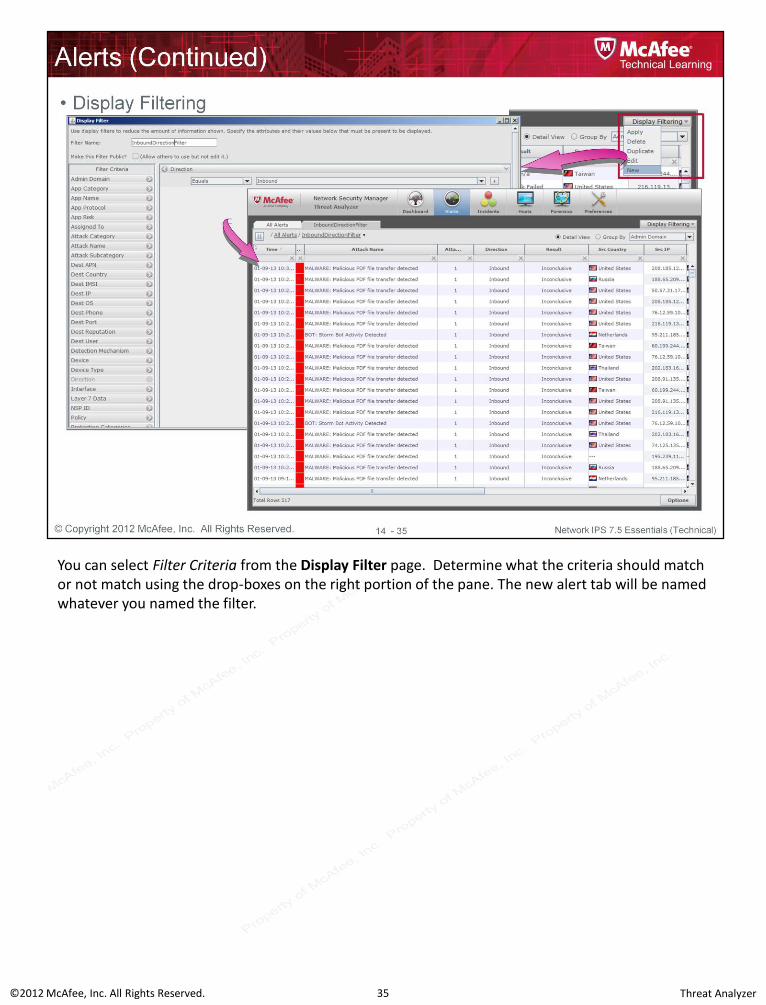
You can select Filter Criteria from the Display Filter page. Determine what the criteria should match or not match using the drop-boxes on the right portion of the pane. The new alert tab will be named whatever you named the filter.

Threat Analyzer ©2012 McAfee, Inc. All Rights Reserved. 36
In the Threat Analyzer, Administrators can choose alerts to define an incident. The Manager enables the creation of incidents as you perform forensic analysis in the Threat Analyzer. It provides the ability to select individual alerts from an Attack Details View for inclusion in a custom incident. No scenario settings need to be met; rather, you select each alert to include in the incident.

Threat Analyzer ©2012 McAfee, Inc. All Rights Reserved. 37
The Incident Viewer displays incidents in chronological order, with the most recent incident listed first. The table columns are as follows: • ID: database ID of the incident data. • Name: name of incident from configuration file an manually created user incident. • Status: current status of incident. Open indicates the incident is currently operational. Closed
indicates the incident is finished. Resolved indicates that the incident is analyzed by the admin. • Creation time: time of last alert in the incident. • Average Severity: average severity of all alerts in the incident. The average severity is displayed as:
[N.N](H,M,L). The N values represent severity as a number (for example, 5.5=an average severity of Medium). The H value represents the number of High severity attacks within the incident, the same with M for Medium and L for Low.
• Assigned to: person responsible for incident research.

Threat Analyzer ©2012 McAfee, Inc. All Rights Reserved. 38
When a host is detected on a Sensor port it sends the available details of the host to the Manager. These details are displayed in the Host page of the Threat Analyzer. As the Sensor gathers more information, this entry in the Host page is updated in real time. A similar entry is created for attacking hosts if you have enabled IPS Quarantine in the response action settings of Attack definition for the attack that occurred on that host. NOTE: To view the host details, you need to select the details that you want to view in the Preferences page. Then the Hosts page in the Real-time Threat Analyzer displays these details. You can right-click on an entry in the Hosts page for additional options. The following actions can be performed on a host using the right-click option: • Add to IPS Quarantine–add the host from which the alert originated into the quarantine zone
for–15 Minutes, 30 Minutes, 45 Minutes, or 1 Hour • Extend IPS Quarantine–extend the quarantine time for a host • Release from IPS Quarantine–remove a host from the quarantine zone • Start Vulnerability Manager Scan–request a Vulnerability Manager on-demand scan on
individual alerts • View ePO Information–view details of a host as obtained from the ePO server • View Details- view host details, including general and network data • GTI Details- GTI (Global Threat Intelligence) Information on the attack

Threat Analyzer ©2012 McAfee, Inc. All Rights Reserved. 39
The Options button provides the following options: • Quarantine Hosts – quarantine host(s) for the specified duration • Save Window Content As:
• Save as CSV – save any selected alert view or graph to a comma delimited CSV file appropriate for portability to a database
• Save as PDF – save any selected alert view or graph to a .pdf file that is readable by Adobe Acrobat reader
• Create Exception – in the future, ignore traffic that matches the exception criteria

Threat Analyzer ©2012 McAfee, Inc. All Rights Reserved. 40
You can also double-click on an entry in the Hosts page to see the details in a pop-up window. Various attributes are displayed about the host, including Session Start, IP address, MAC Address, and Current User.

Threat Analyzer ©2012 McAfee, Inc. All Rights Reserved. 41
The Display Filter in the Hosts page provides options to reduce the quantity of data displayed. Here you can specify the fields and their values that must match.

Threat Analyzer ©2012 McAfee, Inc. All Rights Reserved. 42
Using the Forensics page, you can specify the IP address of a host on the network to view its details. The ePO section of the Forensics page enables you to query the ePO database for the details of a host. This section also displays the last 10 Host IPS events for the host (if installed). The Vulnerability Manager section enables you to start a Vulnerability scan of a host and view the vulnerabilities for the host. Thus, using the Forensics page you can view the details of a host from ePO, Host Intrusion Prevention, and Vulnerability Manager. Customers can use these details to tune the security-related applications on a host for maximum protection.

Threat Analyzer ©2012 McAfee, Inc. All Rights Reserved. 43
For a managed or unmanaged host, you can double-click a row of information in the ePO Host Information section to view the additional details. When you double-click on a row of information, then the details are displayed in a tabbed region named after the host's IP address. If double-click does not display the additional details then it could be that the host is unrecognized or you had earlier queried for the same managed/unmanaged host and the tabbed region for the host is still available. You can also choose to launch the ePO Console from this display, in the upper right corner. When launched, the ePO server opens with the host details displayed. You can update the dat file and policies from the opened page. You are also able to gain information about McAfee Vulnerability Manager scan from this interface. When a user executes On Demand scan by right clicking on a Alert or by entering an IP in the Host Forensics | FS section, the scan completion or failure status will be shown in this page. By double-clicking on any of the completed scans, the Vulns present will be shown in the host that was scanned using Vulnerability Manager in a separate Tab. The Vulnerability Manager scan result shows vuln name, risk level, Action or Recommendation to fix the Vulnerability, CVE ID details etc.
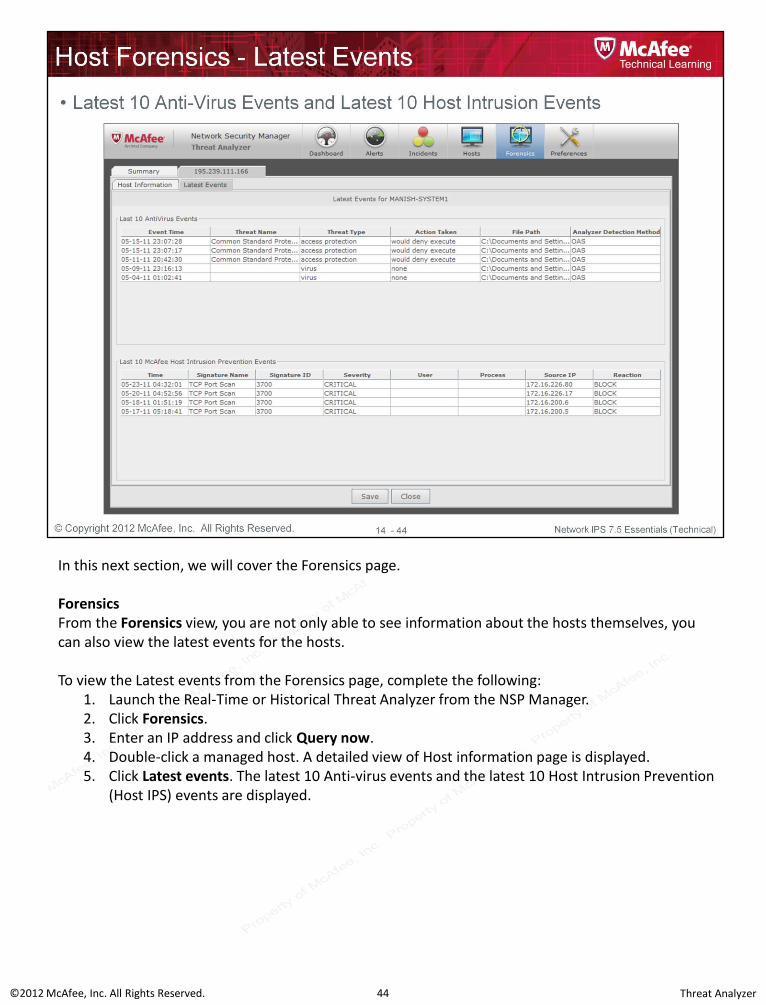
Threat Analyzer ©2012 McAfee, Inc. All Rights Reserved. 44
In this next section, we will cover the Forensics page. Forensics From the Forensics view, you are not only able to see information about the hosts themselves, you can also view the latest events for the hosts. To view the Latest events from the Forensics page, complete the following:
1. Launch the Real-Time or Historical Threat Analyzer from the NSP Manager. 2. Click Forensics. 3. Enter an IP address and click Query now. 4. Double-click a managed host. A detailed view of Host information page is displayed. 5. Click Latest events. The latest 10 Anti-virus events and the latest 10 Host Intrusion Prevention
(Host IPS) events are displayed.

Threat Analyzer ©2012 McAfee, Inc. All Rights Reserved. 45
This section will focus on the Preferences page. Preferences The Preferences section enables you to personally set various options related to Threat Analyzer functionality and presentation. The Reset to Defaults returns all current panel fields to default values. The tabbed sections, or views, of the Preferences menu are as follows: • General Panel–This tab displays the time format, location of Wireshark, NSLookup status, Who Is
Server URL, No.of alerts and Maximum No.of alerts. • Alerts View Panel–This tab allows you to customize Alerts view column layout and presentation. • Hosts View Panel–This tab allows you to customize hosts view column layout and presentation. • Watch List–With this tab you can create a coloring scheme for highlighting specific alert
information that is crucial to your monitoring environment. • Historical Constraints–(not shown) displays the information of the historical query selected
while launching the Historical Threat Analyzer.

Threat Analyzer ©2012 McAfee, Inc. All Rights Reserved. 46
General tab The General view sets preferences for basic program functions. The available options are: • Path to ‘wireshark.exe’ –the location of your Wireshark program for packet log viewing. The first
time you open the Threat Analyzer, set the location of the Wireshark program by browsing (...) through your system.
• Default Time Format–right-click to edit the time format to how you want your alerts to be time stamped. Default time format is MM-dd HH:mm:ss
• Who Is Server URL–the URL of the Who Is Server. • No. of Alerts at startup–the number of alerts that are displayed at startup. The default is 20,000
alerts. • Max. No. of Alerts–maximum amount of alerts that can be viewed in the Threat Analyzer. • IP Address Name Resolution–the IP address name is displayed if enabled. Default is enabled. • IP Address Name Resolution Maximum Timeout (milliseconds)–time taken to resolve IP address
name. Default is 1000 milliseconds • Warn about Impact of Real-Time Sensor Performance Polling–the Real-Time Sensor
Performance polling is displayed if enabled. Default is enabled. • Highlight New Threats–to enable preferences for highlighting new threats in the Threat Analyzer. • Threats New if First Seen–to view the First Seen Alerts in the Alerts page. • Proxy Server–proxy server is set or not set. Default is disabled.

Threat Analyzer ©2012 McAfee, Inc. All Rights Reserved. 47
Alerts View tab The Alerts View page enables you to customize your view of alerts as displayed in Alerts page. Alerts contain data that fall into various categories, or columns. You can customize the following information: • Visibility–a check means you want to see this category in a Detail View. A box left unchecked
means you do not want to see this category. Click the Visibility box to turn on/off viewing for a category.
• Column–the current name of the Detail View column. • Abbr–the current name of the Detail View column. Double-click an Abbr cell and type the
abbreviation you want to see. • Width–width of the cell for a particular category. Double-click a Width cell and type the number
of millimeters wide you want the cell to be. • Align–the alignment of the category name in the column. Click an Align cell and select your
alignment preference from the drop-down list. The choices are Left, Right, or Center. • Position–gives the column location in the Detail View window.
The up and down arrows (bottom right) enable you to select a row in the Detail Panel and move that row up or down in order. Subsequently, when working in a Detail View, the columns will reflect the established order.

Threat Analyzer ©2012 McAfee, Inc. All Rights Reserved. 48
Hosts View tab The Hosts View enables you to customize your view of hosts as displayed in the Hosts page. In this view, hosts contain data that fall into various categories, or columns (Column in the Hosts page). You can customize the following information: • Visibility–a check means you want to see this category in a Detail View. A box left unchecked
means you do not want to see this category. Click the Visibility box to turn on/off viewing for a category.
• Column–the current name of the Detail View column. • Abbr–the current name of the Detail View column. Double-click an Abbr cell and type the
abbreviation you want to see. • Width–width of the cell for a particular category. Double-click a Width cell and type the number
of millimeters wide you want the cell to be. • Align–the alignment of the category name in the column. Click an Align cell and select your
alignment preference from the drop-down list. The choices are Left, Right, or Center. • Position–gives the column location in the Detail View window.
The up and down arrows (bottom right) enable you to select a row in the Detail Panel and move that row up or down in order. Subsequently, when working in a Detail View, the columns will reflect the established order.

Threat Analyzer ©2012 McAfee, Inc. All Rights Reserved. 49
Watch List tab The Watch List tab enables you to set up highlighting of Detail View cells for specified alert data. Example 1: If you want to readily see if a certain destination IP address is being targeted, you would add that destination IP address to the watch list and select a color to highlight that address when detected. If identical entries already exist, those cells are highlighted with the specified color. Example 2: If you want to be aware of any attacks from Source IP 10.0.0.1, create a Watch List entry with the color green. Once saved, all cells where 10.0.0.1 appear (both in the past and incoming) as the Source IP, those cells are highlighted in green. Tip 1: You can add netmasks to IP addresses added to your Watch List. For example, you can specify destination IP address 192.168.1.16 with a netmask of 32 by typing 192.168.1.16/32. Tip 2: The Watch List enables you to change the coloring scheme of alert severities as displayed in the Detail View tables of the Threat Analyzer.
Threat Analyzer ©2012 McAfee, Inc. All Rights Reserved. 50
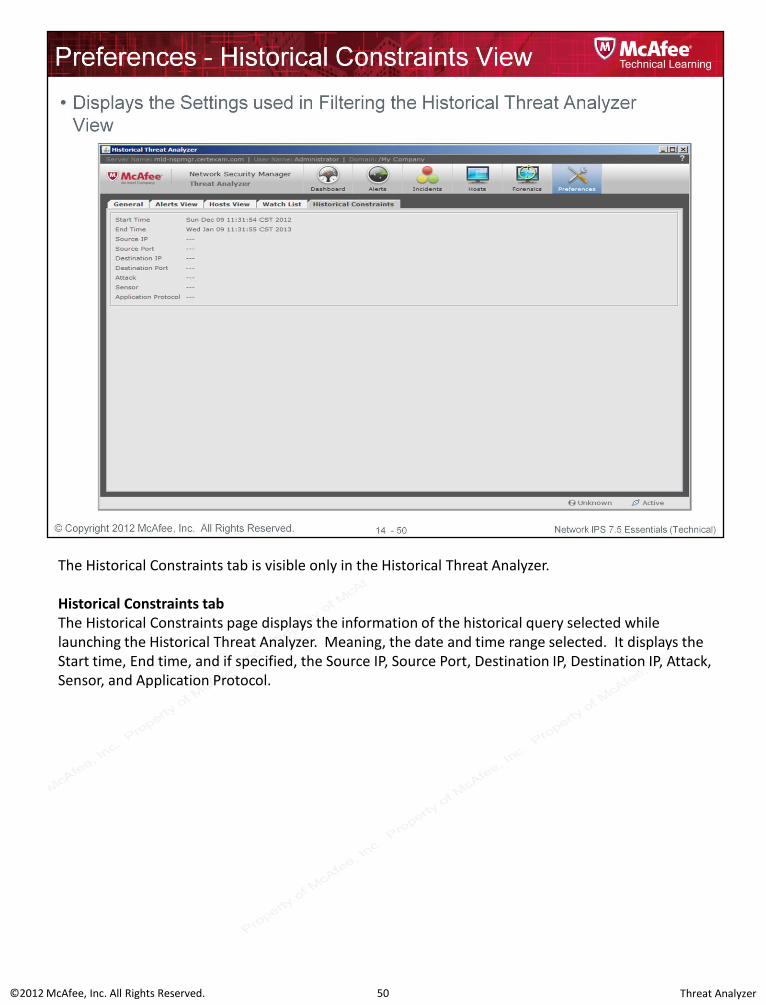
The Historical Constraints tab is visible only in the Historical Threat Analyzer. Historical Constraints tab The Historical Constraints page displays the information of the historical query selected while launching the Historical Threat Analyzer. Meaning, the date and time range selected. It displays the Start time, End time, and if specified, the Source IP, Source Port, Destination IP, Destination IP, Attack, Sensor, and Application Protocol.

Threat Analyzer ©2012 McAfee, Inc. All Rights Reserved. 51

Threat Analyzer ©2012 McAfee, Inc. All Rights Reserved. 52


