© P
eter
Wal
ton/
Pho
tolib
rary
/Get
ty Im
ages
� 1
Marine Water Quality Dashboard
Timely�access�to�water�quality�information�is�essential�to�maintain�a�vibrant�and�healthy�reef�ecosystem.�The�Marine�Water�Quality�Dashboard�provides�this�information�to�reef�stakeholders.
What is the Dashboard?The�Marine�Water�Quality�Dashboard�is�a�tool�to�access�and�visualise�a�range�of�water�quality�indicators�for�the�Great�Barrier�Reef.�
What does it include?The�Dashboard�enables�access�to�near�real-time�data�on�sea�surface�temperatures,�chlorophyll�levels,�sediments�and�light�for�the�entire�Great�Barrier�Reef�and�supplements�existing�data�measurements.�
Data�from�the�Dashboard�can�be�displayed�in�different�formats�or�downloaded�from�the�web�for�further�analysis�and�interpretation.
Who can use the Dashboard?Anyone�can�use�the�Marine�Water�Quality�Dashboard�–�government�agencies,�reef�managers,�policy�makers,�researchers,�industry�and�local�communities.
The�Dashboard�provides�access�to�over�ten�years�of�water�quality�information�to�identify�changes�over�time,�as�well�as�up-to-date�assessments�of�the�likelihood�of�coral�bleaching�events�or�the�impact�of�sediment�plumes�from�large�rainfall�events.
How does it work?The�Bureau�of�Meteorology�receives�daily�satellite�information�about�the�frequency�of�light�which�enables�the�water�colour�and�the�sea�surface�temperature�to�be�determined�for�the�Great�Barrier�Reef.��
By�comparing�the�colour�of�the�water�to�measurements�of�sediments,�chlorophyll�and�dissolved�organic�matter,�relationships�are�made�between�satellite�imagery�and�the�actual�water�in�the�reef.�
Why is this important?The�temperature�of�the�sea�surface�is�an�important�environmental�indicator.�It�can�be�used�to�assist�decision-making�where�water�temperature�is�a�major�factor�influencing�operations�on�or�near�the�ocean’s�surface,�or�where�it�can�be�used�to�infer�properties�of�the�ocean�environment�just�below�the�surface.
A�specific�example�is�in�helping�to�predict�and�respond�to�coral�bleaching�events.
Information�about�the�amount�of�light�in�the�water�and�the�concentrations�of�chlorophyll�and�sediments�are�important�for�managing�sea�grass�beds�and�the�production�of�large�algae�that�may�compete�with�coral�for�space�on�the�reef.
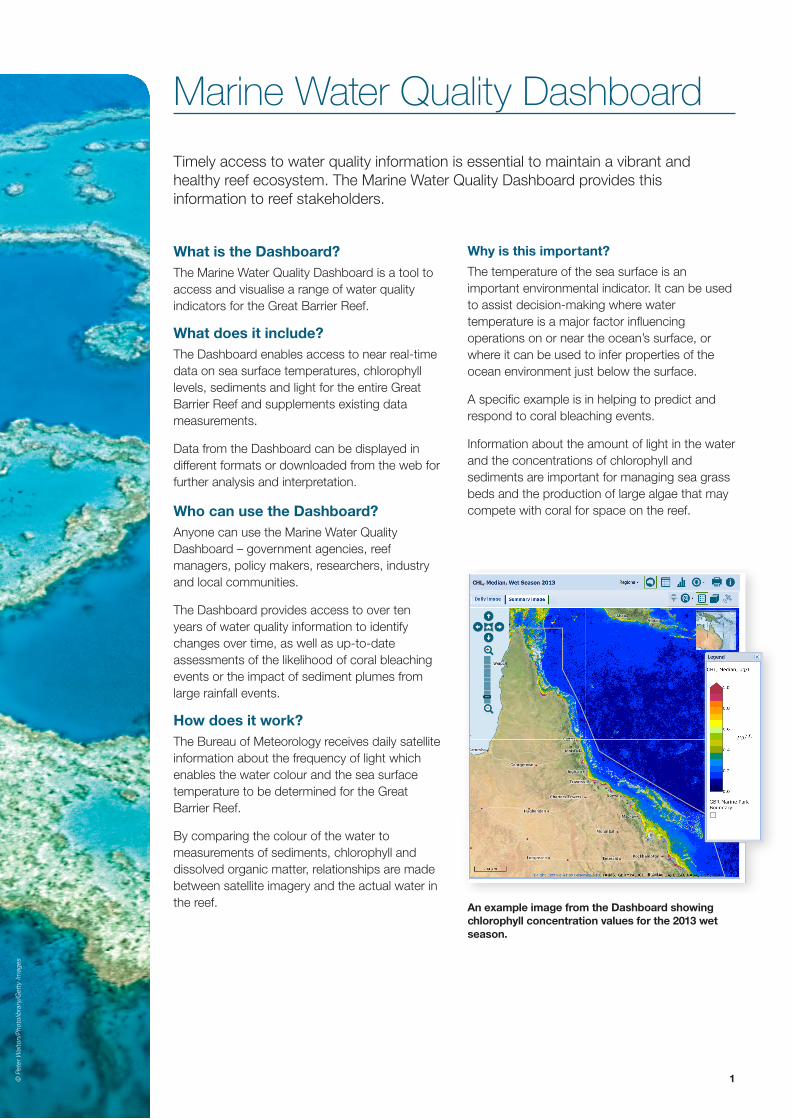
An example image from the Dashboard showing chlorophyll concentration values for the 2013 wet season.
©�Commonwealth�of�Australia,�October�2014� 2
A collaborative projectThe�Dashboard�has�been�developed�through�collaboration�between�the�Australian�Institute�of�Marine�Science,�Bureau�of�Meteorology,�CSIRO,�Great�Barrier�Reef�Foundation�and�the�Queensland�Government.�
The�Dashboard�is�delivered�as�part�of�eReefs,�a�project�that�is�contributing�to�the�sustainability�of�the�Great�Barrier�Reef.�eReefs�commenced�in�
January�2012�and�forms�a�significant�step�in�building�a�comprehensive�coastal�information�system�for�Australia.
For more informationFor�further�information�about�the�Marine�Water�Quality�Dashboard,�visit:www.bom.gov.au/marinewaterquality/�or�contact�[email protected]
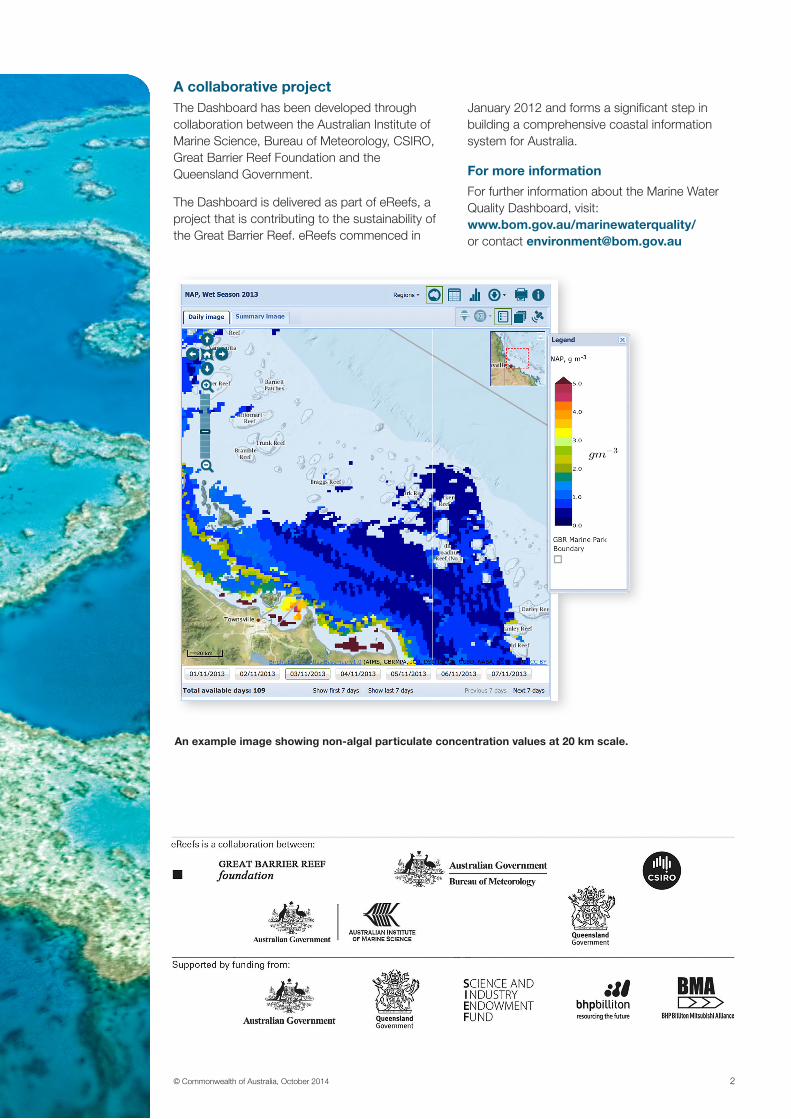
An example image showing non-algal particulate concentration values at 20 km scale.


