General rights Copyright and moral rights for the publications made accessible in the public portal are retained by the authors and/or other copyright owners and it is a condition of accessing publications that users recognise and abide by the legal requirements associated with these rights.
Users may download and print one copy of any publication from the public portal for the purpose of private study or research.
You may not further distribute the material or use it for any profit-making activity or commercial gain
You may freely distribute the URL identifying the publication in the public portal If you believe that this document breaches copyright please contact us providing details, and we will remove access to the work immediately and investigate your claim.
Downloaded from orbit.dtu.dk on: Aug 22, 2019
Moving beyond the MSY concept to reflect multidimensional fisheries managementobjectives
Rindorf, Anna; Mumford, John; Baranowski, Paul ; Worsøe Clausen, Lotte; Garcia, Dorleta; Hintzen, N.;Kempf, A.; Leach, Adrian; Levontin, Polina ; Mace, PamelaPublished in:Marine Policy
Link to article, DOI:10.1016/j.marpol.2017.08.012
Publication date:2017
Document VersionPeer reviewed version
Link back to DTU Orbit
Citation (APA):Rindorf, A., Mumford, J., Baranowski, P., Worsøe Clausen, L., Garcia, D., Hintzen, N., ... Reid, D. (2017).Moving beyond the MSY concept to reflect multidimensional fisheries management objectives. Marine Policy,85, 33-41. https://doi.org/10.1016/j.marpol.2017.08.012

1
Moving beyond the MSY concept to reflect multidimensional 1
fisheries management objectives 2 3
Anna Rindorf1*, John Mumford2, Paul Baranowski2, Lotte Worsøe Clausen3, Dorleta García4, 4
Niels T. Hintzen5, Alexander Kempf6, Adrian Leach2, Polina Levontin2, Pamela Mace7, Steven 5
Mackinson8, Christos Maravelias9, Raúl Prellezo4, Antoni Quetglas10, George Tserpes11, Rüdiger 6
Voss12 and David Reid13 7
8
1DTU Aqua National Institute of Aquatic Resources, Technical University of Denmark (DTU), 9
Kemitorvet 1, 2800 Lyngby, Denmark. 10
2Centre for Environmental Policy, Imperial College London, Silwood Park Campus, Ascot, 11
Berkshire, SL5 7PY, United Kingdom 12
3International Council for the Exploration of the Sea, H.C.Andersens Boulevard 44-46, 1553 13
Copenhagen V, Denmark 14
4Azti. Txatxarramendi Ugartea z/g, 48395 Sukarrieta, Spain 15
5Institute for Marine Resources and Ecosystem Studies (IMARES), Wageningen University & 16
Research Centre (WUR), P.O. Box 68, 1970 AB IJmuiden, The Netherlands 17
6Thünen Institute of Sea Fisheries, Palmaille 9, 22761 Hamburg, Germany 18
7Ministry for Primary Industries, PO Box 2526, Wellington, New Zealand 19
8Scottish Pelagic Fishermen’s Organisation, Heritage House, 135-139 Shore Street, 20
Fraserburgh, Aberdeenshire, AB43 9BP, UK 21
9Hellenic Centre for Marine Research (HCMR), 46.7 km Athens-Sounio, 19013 Anavyssos, 22
Attica, Greece. 23
2
10Instituto Español de Oceanografía, Centre Oceanogràfic de les Balears, Moll de Ponent, s/n, 24
07015 Palma de Mallorca, Spain 25
11Hellenic Centre for Marine Research, Institute of Marine Biological Resources and Inland 26
Waters, PO Box 2214, 71003 Heraklion, Crete, Greece 27
12Department of Economics, University of Kiel, Wilhelm-Seelig-Platz 1, 24118 Kiel, Germany 28
13Irish Marine Institute, Galway 29
*corresponding author, +4535883378, [email protected] 30
1
Abstract 1
Maximising the long term average catch of single stock fisheries as prescribed by the globally-2
legislated MSY objective is unlikely to ensure ecosystem, economic, social and governance 3
sustainability unless an effort is made to explicitly include these considerations. The study 4
investigated how objectives to be maximised can be combined with sustainability constraints 5
aiming specifically at one or more of these four sustainability pillars. It was conducted as a 6
three-year interactive process involving 290 participating science, industry, NGO and 7
management representatives from six different European regions. Economic considerations 8
and inclusive governance were generally preferred as the key objectives to be maximised in 9
complex fisheries, recognising that ecosystem, social and governance constraints are key 10
aspects of sustainability in all regions. Relative preferences differed between regions and cases 11
but were similar across a series of workshops, different levels of information provided and the 12
form of elicitation methods used as long as major shifts in context or stakeholder composition 13
did not occur. Maximising inclusiveness in governance, particularly the inclusiveness of 14
affected stakeholders, was highly preferred by participants across the project. This suggests 15
that advice incorporating flexibility in the interpretation of objectives to leave room for 16
meaningful inclusiveness in decision-making processes is likely to be a prerequisite for 17
stakeholder buy-in to management decisions. 18
19
Key words: Sustainability pillars, Inclusive governance, MSY, MEY, MSOY, management 20
objectives, 21

1
1. Introduction 1
The definition and use of long term targets and limits for fisheries management is at the heart 2
of fisheries science. Defining these is in essence a policy decision and some, such as the 3
Maximum Sustainable Yield (MSY) (UNCLOS 1982), have attained global support. MSY refers to 4
the maximisation of the long-term average landed weight, generally using a specific fishing rate 5
or effort management rule. The concept was originally developed on a single stock basis, and 6
does not explicitly encompass sustainability in wider ecosystem, economic, social and 7
governance contexts (Anderson et al., 2015; Hilborn et al., 2015; Prellezo and Curtin, 2015; 8
Rindorf et al., 2017a). In such multidimensional settings, there are trade-offs between objectives 9
such as catches of predators and their prey (Legovic et al., 2010; Blanchard et al., 2014), catches 10
of individual species caught in mixed fisheries (Dichmont et al., 2008; Hilborn et al., 2012; Ulrich 11
et al., 2017), long term average yield and stability of yield (Smith et al., 2011), and economic 12
yield and social factors such as employment (Kempf et al., 2016). Deciding on these trade-offs is 13
an integral part of defining broader strategic objectives for ecosystem based fisheries 14
management (Garcia et al., 2003). 15
In jurisdictions where advice has moved beyond the objective of obtaining single species MSY, 16
this has been implemented by, for example, defining limits to fishing on all species to ensure 17
MSY of the least productive species (in the US, Hilborn et al., 2015) or by estimating the 18
maximum economic yield, MEY, across all species (Australia, Dichmont et al., 2010). Other 19
objectives, such as maximising the added value to consumers while ensuring acceptable 20
employment levels, have also been suggested (Methot et al., 2014). Often, potential objectives 21
are defined in scoping exercises involving scientists, managers and other stakeholders, followed 22
by model analyses of the likely consequences of different management measures for 23
performance metrics related to the objectives (Mapstone et al., 2008; Punt et al., 2016; Punt, 24
2017). The complexity of this decision process can be greatly decreased if the number of trade-25
offs which need to decided on can be reduced. Further, complexity and duration of the process 26

2
is highly dependent on the preferences for different objectives expressed by the stakeholders 27
included in the process being both broadly representative of other stakeholders and reasonably 28
stable over time as the development of model scenarios and subsequent discussions take time 29
to complete. 30
The aim of this study was to investigate how ecological, economic, social, and governmental 31
fisheries management objectives can be consistently addressed in MSY advice. To this aim, the 32
manuscript describes a process through which the most appropriate trade-off can be 33
determined in any specific case and then investigates whether this process provides results 34
which are consistent over time and stakeholder groups. Part of the process is to limit the trade-35
off area to only those options considered most relevant by stakeholders, as reducing the number 36
of options that must be considered greatly reduces the complexity of the trade-offs to be 37
considered. Specifically, it was investigated i) whether objectives related to ecosystem, 38
economic, social and governance issues should preferably be addressed as objectives to be 39
maximised or as constraints to be avoided in sustainable management, ii) how the list of 40
objectives and constraints can be limited to reduce the complexity of subsequent discussions by 41
using preferences, iii) whether preferences varied between regions and stakeholder groups, and 42
iv) whether preferences derived using a different method, context and level of detail of the 43
information given were broadly similar to the original scoping exercise. The investigation was 44
based on a three-year study involving scientists, industry, NGOs and managers to investigate 45
preferences in different regions, in different stakeholder groups, in different contexts and based 46
on different levels of detail. The study concludes by discussing the implications of the results for 47
future science, advice and management. 48
2. Materials and methods 49
While the widely used MSY and MEY concepts suit single species management objectives, the 50
goal of maximsing rarely suits objectives related to multiple and diverse ecosystem, economic, 51
social and governance indicators. Principles such as those of sustainable development (WCED 52

3
1987) are often seen as higher ranking, leading to a situation where objectives maximising for 53
example, yield are not acceptable if they jeopardise sustainability (EU, 2013; Hart, 2013; Rindorf 54
et al., 2017b). Objectives were defined as being related to sustainability where specific 55
ecosystem aspects (such as maintaining forage species and minimising bycatch mortality of 56
potentially endangered or threatened species), economic aspects (such as profitability of 57
fisheries), social aspects (such as employment in the fishery) and governance aspects (such as 58
participation in the decision process) are managed to remain within acceptable limits. The 59
dimensions identifying the limits to this sustainable area were denoted constraints, and 60
objectives for maximisation were discussed only within the sustainable area. 61
2.1 Consultation 62
The process of consulting and discussing options with stakeholders occurred in three stages 63
aiming at the four scientific aims (i to iv in the introduction): 64
• A problem framing workshop defining preferred objectives and constraints among 65
categories by region to determine whether preferences differed across regional groups, 66
• Subsequent reflection workshops to derive perspectives from different stakeholder 67
groups and more detail on preferred objectives, and lastly 68
• Response workshops to determine whether the objectives originally identified were still 69
seen as relevant when presented to a broader stakeholder group using a different 70
method, context and level of detail of the information given. 71
In all workshops, stakeholders were identified as scientists, industry, NGOs, or managers 72
depending on their employer (Figure 1). 73
74
Figure 1 about here 75
76
4
2.2 Regional differences in preference 77
The 55 participants in the problem framing workshop conducted in April 2012 were invited 78
partners in the MYFISH project (www.myfishproject.eu) or members of organisations associated 79
with the project, including regional advisory councils from all regions, industry representatives, 80
NGOs and managers (Figure 1). Invitations were sent to each organisation and the organisation 81
then selected the most appropriate available attendees. The majority of the organisations were 82
European but participants from New Zealand, Canada and the US were also present. Workshop 83
topic groups focused on identifying a range of potentially relevant objectives and constraints 84
related to alternatives to MSY. The preference for each of these was subsequently ranked on a 85
regional basis in groups encompassing the Baltic Sea, Mediterranean, North Sea, Western 86
Waters and Widely Ranging Stocks, where the latter covers migratory as well as distant water 87
fisheries. Details of the process can be found in the supplementary information. A specially 88
designed graphical tool was used to facilitate option ranking and recording (Kempf et al., 2016, 89
supplementary material). The tool listed the suggested objectives to be considered for 90
maximisation (or minimisation in one case) and the sustainability constraints to that objective 91
derived from the topic groups. Participants were asked to provide ratings (R) for each option 92
and to document the degree of uncertainty or disagreement in the group (U) after group 93
deliberation. Ratings and uncertainty were evaluated following three criteria: i) availability of 94
necessary information, ii) responsiveness of the measure to management, and iii) preference as 95
an objective to maximise or as a sustainability constraint. Priority was given to rating objectives 96
considered for maximisation and, if time permitted, potential constraints to sustainability were 97
also ranked. All groups evaluated objectives at the meeting but constraints were evaluated by 98
only three groups. Remaining constraint evaluations were carried out using questionnaires 99
completed by participants at a later date. This led to a systematic scoring and ranking of options 100
based on the agreed assessment by all the workshop participants. Lastly, the options with the 101
highest preferences were identified for each regional group together with the degree of 102

5
agreement among regional groups, and the overall ranking. The probability for each category of 103
obtaining the observed number of top 5 rankings was estimated using a binomial probability. 104
2.3 Perspectives from different stakeholder groups 105
The results of the problem framing workshop were presented at two reflection workshops in 106
October 2012 and in February 2013, both with a higher representation of managers than the 107
initial workshop (Figure 1) and both focusing on the Baltic Sea, North Sea and Widely Ranging 108
Stocks. Participants were invited through ICES, regional Advisory Councils and among European 109
and national managers. The workshops were structured as plenary discussions on whether the 110
definitions and preferences indicated in the problem framing workshop seemed appropriate and 111
operational, and on how the objective to maximise inclusive governance (see section 3.1) could 112
be implemented in practice. Views of the participants were gathered in a workshop report by a 113
core group of scientists and the report was circulated to participants for comments. 114
2.4 Changes in preferences in response to context and the level of information 115
The effect of including a broader stakeholder group and using a different method, context and 116
level of detail of the information given was investigated in six regional response workshops 117
conducted in 2014 (Figure 1). The context of the response workshops differed from the original 118
workshop as a broader range of stakeholders were involved, new key issues to stakeholders had 119
emerged in the two years since the initial problem framing and reflection workshops, 120
quantitative information on the potential trade-offs resulting from the previously expressed 121
preferences was presented, and finally, the consultation method was changed to individual 122
questionnaires. Participants were invited through Advisory Councils and local stakeholder 123
organisations. 124
Detailed information on the consequences of choosing a specific target, or sets of targets, and 125
management constraints was produced for each of six regions using quantitative statistical 126
models where possible and qualitative models where quantitative models were not available 127
(Voss et al., 2014a; Kempf et al., 2016; Quetglas et al., 2016; Sampedro et al., 2017; García et 128
6
al., 2017). The resulting trade-offs between different ecosystem, economic and social 129
consequences were illustrated using decision support tables (DST) (Kempf et al., 2016). These 130
DSTs visualised model results using graphical tools, such as icon arrays, and were accompanied 131
by a brief description of the model used to derive the underlying data. They included examples 132
of different versions of objectives and constraints. 133
Preferences were indicated by participants using individual questionnaires, which were 134
completed at the meeting. This approach was used in response to comments at previous 135
workshops that group interactions might affect the results. The questionnaires asked 136
participants to indicate their preferences for each of the scenarios presented (rating, 5 point 137
scale) and how certain they were about their rating (uncertainty; 4 point scale). Finally, there 138
was opportunity for them to give the main reasons for their ratings in free text format on the 139
questionnaire. To enhance comparability with results from the problem framing workshop, the 140
questionnaires were analysed by taking the rating and uncertainty score of individual answers, 141
converting them to distributions approximating the discrete distributions used in the problem 142
framing workshop and then pooling these into a single distribution representing the group 143
similar to those derived in the problem framing workshop. Further details on the workshops can 144
be found in the supplementary material and details on the objectives and constraints rated are 145
given in Tables 1 and 2. 146
147
Tables 1 and 2 about here 148
149
3. Results 150
3.1 Regional differences in preference 151
The full list of possible objectives to maximise and sustainability constraints was used for all 152
regional workshops. Suggested objectives and constraints were categorised into the four pillars 153

7
of ecosystem, economic, social and governance sustainability (Tables 1 and 2). For both 154
objectives and constraints, the social component had the highest number of proposed options. 155
Average and variation of both rating and uncertainty varied between groups, indicating that a 156
ranking method was preferable to ANOVA or similar analyses. 157
Social yield was suggested to be difficult to quantify and therefore better addressed through 158
negotiations or constraints rather than maximisation of specific measures. Indicators of stability 159
and resilience were also seen as important constraints in conjunction with other indicators 160
rather than as objectives to be maximised. Some terms were context specific, such as the 161
meaning of ‘long term’. In ecosystem considerations, 100 years was considered appropriate, 162
whereas in an economic and social science context much shorter periods were considered long 163
term. Further, stakeholders generally expressed a need to discuss both `Where to go in the long 164
term?’ and `How to get there in the shorter term?’. 165
3.1.1 Objectives for maximisation 166
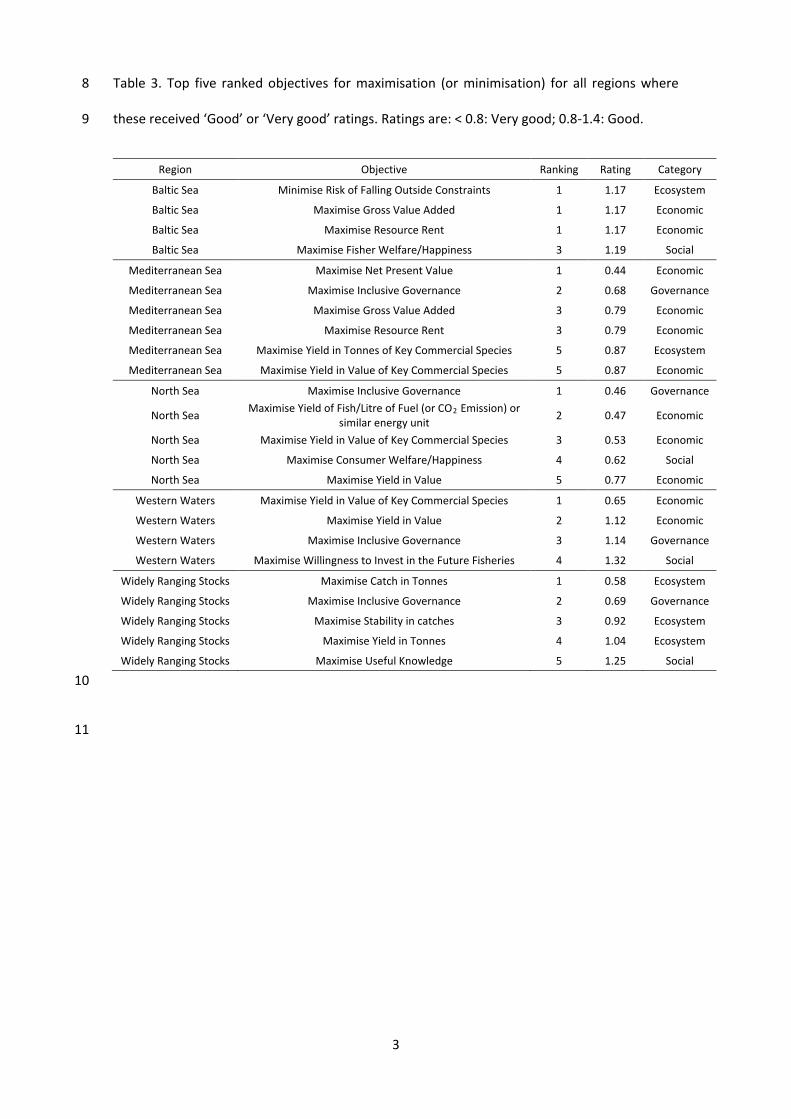
All but six of the indicators were ranked as good or very good by at least one group (Figure 2). 167
The six objectives which ranked as medium or poorer in all regional groups were: Maximise 168
Community Biomass, Maximise Resilience, Maximise Employment on Viable Fishing Units, 169
Maximise Fishing Community Viability, Maximise Social Yield and Maximise Present Yield for 170
Human Consumption. Among the ecosystem and economic objectives, all groups except Widely 171
Ranging Stocks preferred maximising yield in value (economic) to maximising yield in tonnes 172
(ecosystem). Maximise value landed came in the top five ranked of all regions (Table 3) except 173
the Baltic Sea and Widely Ranging Stocks where it was ranked sixth and eighth, respectively. 174
There was a high preference across all regions for economic and governance objectives for 175
maximisation while the social category received poorer ratings (Figure 3). Maximise Inclusive 176
Governance was always highly rated by the groups scoring this objective and economic 177
objectives were in the top 5 in four of the five regions (Table 3, Figure 2). With the exception of 178

8
the Mediterranean, at least one social objective was present in the top 5 in all regions, but the 179
specific objective differed between groups. 180
181
Figure 2 and 3 and table 3 about here 182
183
Maximise Inclusive Governance, Yield in Value of Key Commercial Species and Yield in Tonnes of 184
Key Commercial Species showed high agreement in scoring between groups with scores of Yield 185
in Value being consistently better than those of Yield in Tonnes in all groups except the Widely 186
Ranging Stocks group. The objectives Minimise Risk of Falling Outside Constraints, Maximise 187
Resource Rent, Maximise Willingness to Invest in Future Fisheries, Maximise Stability, Maximise 188
Employment on Viable Fishing Units, Maximise Catch in Tonnes, Maximise Consumer Welfare 189
and Happiness, and Maximise Fishery Welfare and Happiness showed large differences between 190
regions (Figure 2). Of these, Maximise Resource Rent and Maximise Catch in Tonnes showed the 191
largest difference, both being scored as the highest ranking by one group and lowest by another 192
group. 193
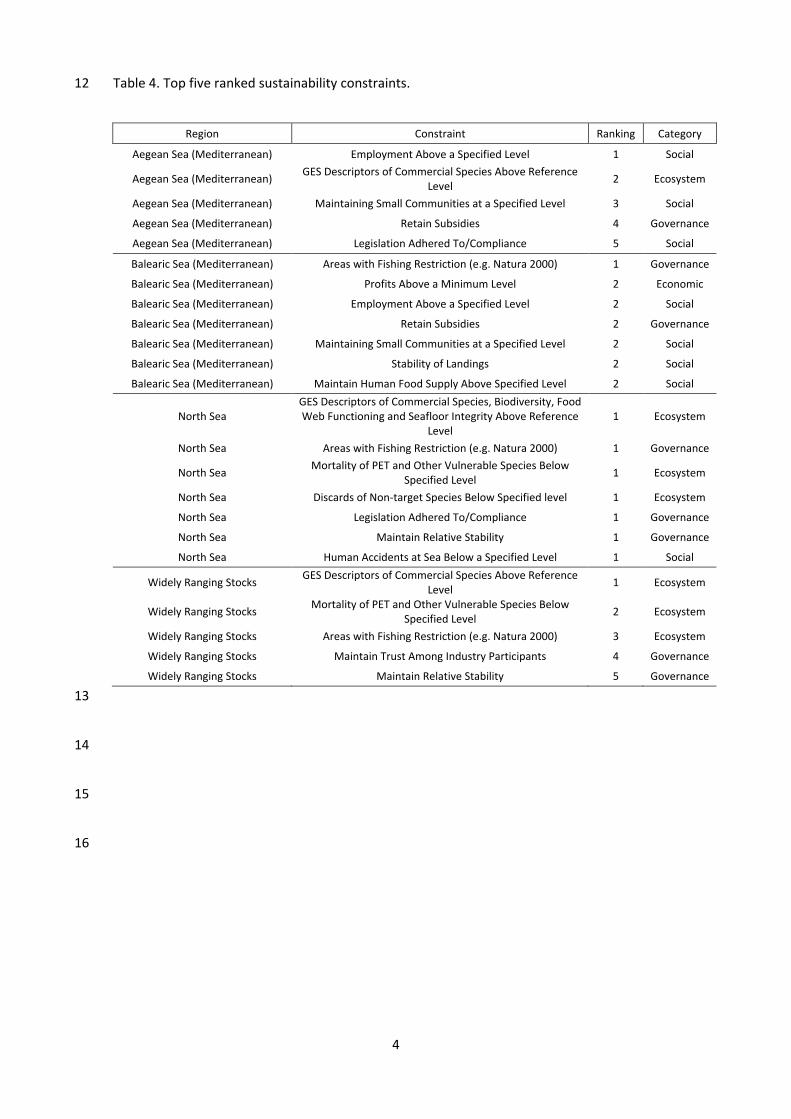
3.1.2 Constraints to sustainability 194
There were substantial differences between regions on which constraints were preferred (Table 195
4). In the North Sea and Widely Ranging Stocks the focus was on Good Environmental Status of 196
commercial species, biodiversity, food web functioning and seafloor integrity, and areas with 197
fishing restrictions. While indicators of ecosystem constraints also appeared in the 198
Mediterranean, they were much more dominant in the North Sea and Widely Ranging Stocks 199
where 7 of 12 possible top 5 constraints were related to ecosystems compared to just two of 11 200
for the Mediterranean. None of the social constraints listed in the Baltic Sea, North Sea and 201
Widely Ranging Stocks regions referred to issues such as small community viability, employment 202
or subsidies. However, such constraints were prioritised highly in the two Mediterranean cases. 203

9
Only one economic constraint was mentioned in the top five of any region (profits – 204
Mediterranean Sea). Overall, the economic constraints featured relatively less in the top 5 205
preferred list than in the list of potential constraints (Figure 4, table 5). Further, there was a 206
higher proportion of constraints related to governance in the preferred list compared to the full 207
list (Figure 4, Table 5). 208
209
Table 4 and 5 and figure 4 about here 210
211
3.2 Perspectives from different stakeholder groups 212
The first reflection workshop focused on the main priorities for scientific advice on objectives 213
and constraints. The workshop participants felt that scientific advice should recommend 214
ecosystem limits for sustainable exploitation (constraints) on a stock by stock basis. Additionally, 215
participants stated that it was necessary to illustrate the consequences of choices for a wider 216
set of management objectives and that more detailed information on trade-offs would also be 217
useful. Receiving single point advice for all stocks based on, for example, an economic objective 218
was not considered to provide sufficient room for negotiation. Instead, participants preferred 219
to be informed about those trade-offs that fell within the sustainable area. Some participants 220
expressed a preference for limiting the scope of the trade-off scenarios considered solely to 221
those that were sustainable in a single stock and ecosystem context, or would provide solutions 222
that were close to single stock based MSY reference values. Within this ‘sustainable and close 223
to objective’ range, there could be room for considering other issues, for example negotiations 224
or an inclusive process. Current legislation and governance was seen as an important constraint. 225
The full report is given in ICES (2012). 226
At the second reflection workshop, the participants concluded that advice should ensure single 227
stock sustainability. Broadly, their conclusions matched those of the previous workshop: 228

10
participants felt that the role of the scientists was to advise on trade-offs between different 229
objectives within the sustainable range and not to determine the exact management measures 230
to be implemented, stating the importance of governance aspects. It was not considered to be 231
the role of scientists to determine the exact trade-offs against, say, economic objectives, 232
although such information can be presented to inform the decision making process. The full 233
report is given in Rindorf et al. (2013). 234
235
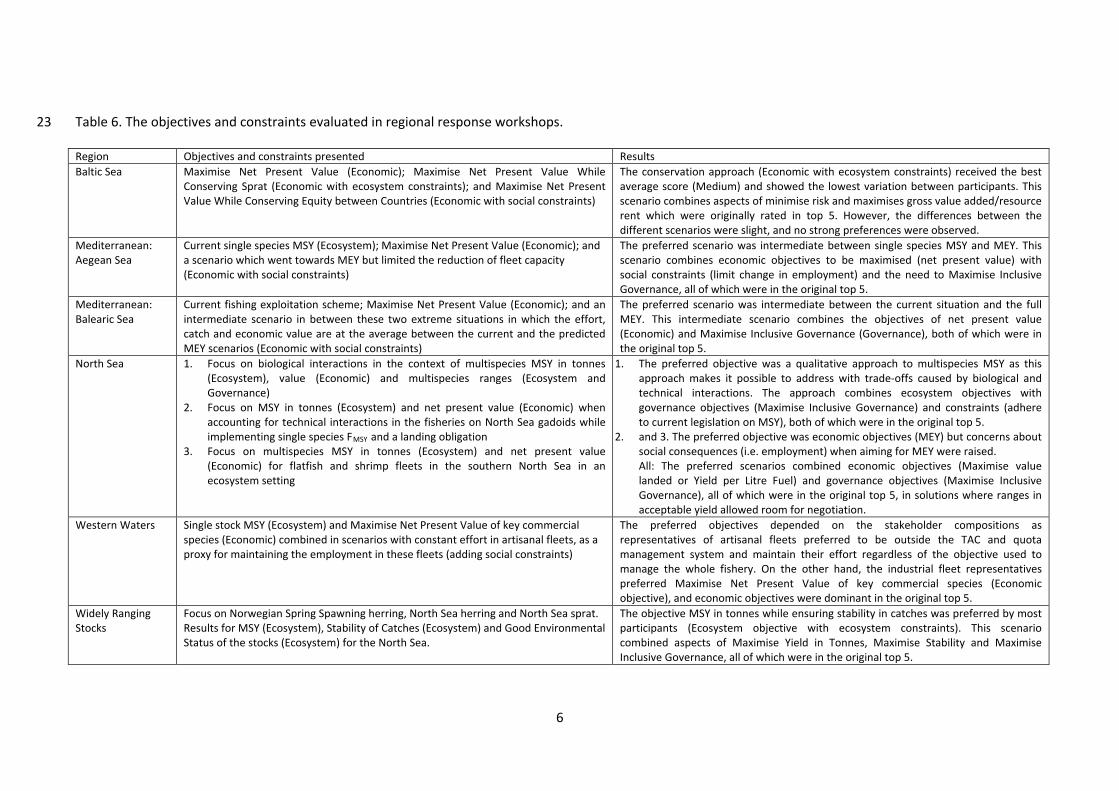
3.3 Consistency in preferences 236
There was a high correspondence between the initially preferred objectives and constraints 237
and the preferred options in a later context, where more detailed information was provided to 238
a broader group of stakeholders in a later context, in all but two cases (Baltic Sea and Western 239
Waters)(Table 6). While the Baltic Sea workshop showed the same trend as the initial analysis, 240
the response workshop showed only very minor differences in preference between different 241
options. This was presumably linked to the recent collapse of the stock assessment of Baltic 242
cod, which initiated in-depth discussions of the relevance of the quantitative information. In 243
the Western Waters, relative representation by different stakeholder groups was important as 244
representatives of artisanal fleets preferred to be outside the TAC and quota management 245
system and maintain their effort regardless of the objective used to manage the entire fishery. 246
They had no favoured objectives beyond the social constraint to retain status quo effort and 247
employment, while the industrial fleet representatives preferred MEY. As the artisanal fleet 248
representatives were absent in the problem framing workshop, this dichotomy was new to the 249
response meeting. For all objectives, the issues of how the path towards reaching objectives 250
should be designed and the time frame within which this should be achieved were general 251
concerns. At the problem framing workshop, three of the four preferred objectives in the 252
Western Waters group included aspects of fleet economics (Maximise Yield in Value of Key 253
Commercial Species, Maximise Yield in Value, and Maximise Willingness to Invest in Future 254
11
Fisheries), though Maximise Net Present Value was not among the highest rated indicating a 255
change between the two workshops. An additional comment made at several of the workshop 256
was that even when only the most preferred objectives and constraints were presented, the 257
information presented was highly complex and no single option seemed to satisfy all 258
preferences. 259
260
Table 6 about here 261

12
4. Discussion 262
Through the process implemented in the three workshops, the participants constructed 263
a list of potential ecosystem, economic, social and governance objectives and constraints, many 264
of which address the shortcomings of the current insular, single-species, single discipline 265
definitions of MSY, while retaining the concept of objectives that are to be maximised within 266
sustainability constraints. Economic objectives were preferred among objectives to be 267
maximised, but were selected less when determining sustainability constraints. Social objectives 268
were given less weight among objectives to maximise. However, the main observation was the 269
overwhelming importance of governance variables, including process attributes, in both 270
objectives and constraints. Preferences for objectives and constraints appeared stable as 271
context, composition of the group and information level changed, except in the case where the 272
stakeholders originally consulted excluded specific groups and in the case where the stock 273
assessment for a major species had suddenly changed dramatically. 274
Preference was higher for the maximisation of economic objectives compared to 275
maximisation of ecosystem objectives in four of the five regions and no social objective was 276
consistently preferred for maximisation. In contrast, economic constraints were substantially 277
less frequent among the preferred constraints than in the full list. Social constraints appeared in 278
the same proportion in the preferred and the full list while ecosystem constraints appeared in 279
substantially higher proportion in the preferred compared to the full list. Hence, both ecosystem 280
and social constraints were seen as key aspects of sustainability that need to be ensured by 281
setting limitations on the objective of maximising economic yield, and thus in effect receiving 282
precedence over objectives related to maximisation. The preference for economic maximisation 283
objectives over ecosystem maximisation objectives was greatest in areas where species interact 284
and/or different species and sizes are caught in the same fishery, such as the Baltic Sea, North 285
Sea and Western Waters. The value lost by maximising ecosystem objectives such as the total 286
catch in tonnes is particularly large in these regions. Two regions, the Baltic Sea and Widely 287

13
Ranging Stocks, have historically shown large fluctuations in the size of many stocks and an 288
objective to minimise risk or maximise stability was scored in the top five in both regions. Though 289
indicators of ecosystem constraints appeared in all regions, they dominated lists of northern 290
region groups, while social sustainability constraints were most important in the Mediterranean 291
in accordance with the results of Voss et al. (2014b). Maximising Inclusive Governance was 292
highly preferred in all regions where this was evaluated (see also Zeller and Pauly, 2004). Similar 293
emphasis was found in a study from South Africa (Hara, 2013). The lack of support for 294
maximisation of social aspects here and elsewhere (Dichmont et al., 2012) may be the result of 295
a lack of history with these indicators, or participants’ lack of experience with these concepts 296
(McShane et al., 2011; Stephenson et al., 2017), or different sectors having differing social 297
objectives. Another important issue is the role of science in the decision making process. Several 298
participants remarked that deciding on social and economic trade-offs should be left to political 299
negotiations and that the role of scientists should be relegated to making the consequences of 300
these decisions explicitly known (Rindorf et al., 2017a). 301
The ranking of different objectives was consistent between the initial problem framing 302
and subsequent response workshops as long as no major shift in stakeholder composition or 303
context occurred. This was unexpected, as it was suggested in the problem framing workshop 304
that social objectives may change quickly compared to biological objectives, particularly in an 305
economic downturn, where the focus is often more on short term economic and social priorities 306
than on long term ecosystem objectives (Mardle and Pascoe, 2002). Though absolute ratings 307
differed substantially between workshops, the relative preferences seemed less affected than 308
absolute level. 309
While the relative preference for different objectives may remain fairly constant, the 310
management measures required to attain ecosystem objectives will vary over time as fisheries 311
selectivity and stock productivities change (Blenckner et al., 2016). Economic objectives such as 312
Maximise Resource Rent reflect changes in both stock productivity and economic factors, such 313

14
as fuel price, whereas social objectives may reflect economic yield and operational management 314
as well as social aspects such as the distribution of welfare within society or public opinion. 315
Hence, the three types of objectives are likely to be highly interdependent as all depend on stock 316
productivity and current and projected stock status. 317
There was a clear dichotomy between the strong support for inclusive governance and 318
for addressing shortcomings of single species MSY seen in the problem framing and response 319
workshops, and the preference of managers for limiting the scope of any scenarios considered 320
to those that are sustainable and provide close to MSY in tonnes in a single stock context. This 321
difference of opinion seemed to be caused by the perception of the importance of maintaining 322
consistency with current legislation. For example, fishing above the fishing mortality leading to 323
MSY in a single species context for a species otherwise limiting the economic yield is in direct 324
conflict with legislative requirements in some parts of the world (US, 2007; Fisheries and 325
Aquaculture Law, 2013; EU, 2013; Shelton and Morgan, 2014). While the requirement to remain 326
consistent with current legislation limits the number of practically feasible objectives and 327
constraints, it does not eliminate the need to decide how to address all sustainability pillars in 328
management. In this decision, the need for explicit and clear scientific advice on the 329
consequences of different options remains as does the need for an inclusive process. 330
The need to remain within sustainable limits received far more support in discussions 331
than maximising any one specific objective. It was stressed in all workshops that objectives 332
should only be maximised when also considering sustainability within ecosystem, economic and 333
social contexts. Examples of the “sustainable area” as being the area where all dimensions of 334
sustainability were fulfilled were often mentioned, even though such an area may not always 335
exist (Rindorf et al., 2017a). To facilitate this, most stakeholders opted for the use of ranges 336
rather than point estimates in defining objectives. Providing advice on trade-offs within 337
sustainable ‘objective-ranges’ was seen as a scientific task and policy makers were tasked with 338
deciding on the exact trade-offs to be made within these ranges. The ranges would allow room 339

15
for discussing economic and social considerations in an inclusive process involving science, 340
industry, NGO and policymaker representatives in an institutionalised format. In Europe, there 341
has been a recent move towards trying to identify objectives as ranges of fishing mortalities 342
providing yields close to MSY (EU, 2014), thereby providing some flexibility in policy decisions 343
(Kempf et al., 2016; Rindorf et al., 2017b). 344
The workshop process implemented in this study demonstrated broad support among 345
stakeholders for consistently addressing ecological, economic, social, and governmental 346
fisheries management objectives in MSY advice by defining ecosystem and social constraints to 347
management within which yield, economic benefits and inclusive governance can be broadly 348
maximised. The importance of ecosystem and social constraints was widely supported by 349
multiple workshop participants and priority should be given to defining operational indicators 350
of ecosystem, social and governance sustainability to operationalise these aspects, a need which 351
is also percieved from a scientific perspective (Stephenson et al. 2017). Preferences for 352
economic objectives differed between complex interacting fisheries, such as those in the 353
Mediterranean and North Sea, and simpler cases, such as the Widely Ranging Stocks. 354
Preferences appeared to be relatively similar across workshop participants, context, level of 355
detail and elicitation methods used as long as no major shifts in context or participant 356
composition occurred. The ubiquity of inclusive governance as a key objective suggests that 357
there is an urgent need to operationalise this concept, so that it can work even in a complex and 358
slowly reacting management system like the European system (Eliasen et al., 2015). Involving 359
stakeholders in defining objectives and management choices is essential to achieve consensus, 360
buy-in and compliance (Pascoe et al., 2009; Wilson, 2009). Advice that incorporates MSY and 361
MEY concepts into more flexible decision-making frameworks so as to leave room for 362
inclusiveness is likely to be a prerequisite for effective management. 363
364
Acknowledgements 365
16
The authors thank ICES for providing invaluable assistance in the process, participants of all the 366
workshops for keeping an open mind, indulging us in our long work hours and helping to make 367
this study possible, and finally the scientists who provided the documentation of different trade-368
offs and embraced the inclusion of stakeholders in their research at an unprecedented level. We 369
also thank J. Holt and C. Potter for elicitation and analytical tools. The research leading to these 370
results has received funding from the European Community’s Seventh Framework Programme 371
(FP7/2007–2013) under grant agreement MYFISH number 289257. 372
373
5. References 374
Anderson, J. L., Anderson, C. M., Chu, J., Meredith, J., Asche, F., Sylvia, G., Smith, M. D., 375
Anggraeni, D., Arthur, R., Guttormsen, A., McCluney, J. K., Ward, T., Akpalu, W., Eggert, 376
H., Flores, J. , Freeman, M. A., Holland, D. S., Knapp, G., Kobayashi, M., Larkin, S., 377
MacLauchlin, K., Schnier, K., Soboil, M., Tveteras, S., Uchida, H. and Valderrama, D. 378
2015. The Fishery Performance Indicators: A Management Tool for Triple Bottom Line 379
Outcomes. PLoS ONE 10(5): e0122809. doi:10.1371/journal.pone.0122809ushing 380
Blanchard, J. L., Andersen, K. H., Scott, F., Hintzen, N.T., Piet, G. and Jennings, S. 2014. 381
Evaluating targets and trade-offs among fisheries and conservation objectives using a 382
multispecies size spectrum model. Journal of Applied Ecology, 51(3): 612-622. 383
Blenckner, T., Llope, M., Möllmann, C., Voss, R., Quaas, M.F., Casini, M., Lindegren, M., Folke, 384
C. and Stenseth, N.C. 2015. Climate and fishing steer ecosystem regeneration to 385
uncertain economic futures. Proceedings of the Royal Society of London B: Biological 386
Sciences, 282: 1803 387
Dichmont, C.M., Deng, A., Punt, A. E., Ellis, N., Venables, W. N., Kompas, T., Ye, Y., Zhou, S. and 388
Bishop, J. 2008. Beyond biological performance measures in management strategy 389
17
evaluation - Bringing in economics and the effects of trawling on the benthos. Fisheries 390
Research, 94: 238–250. 391
Dichmont, C. M., Pascoe, S., Kompas, T., Punt, A. E. and Deng, R., 2010. On implementing 392
maximum economic yield in commercial fisheries. PNAS 107(1): 16-21. 393
Dichmont, C. M., Pascoe, S. D., Jebreen, E. J., Pears, R. J., Brooks, K. J. and Perez, P. 2012. 394
Providing social science objectives and indicators to compare management options in 395
the Queensland trawl planning process. CSIRO. Brisbane. pp. 87. 396
Eliasen, S. Q., Hegland, T. J. and Raakjær, J. 2015. Decentralising: The implementation of 397
regionalisation and co-management under the post-2013 Common Fisheries Policy. 398
Marine Policy, 62: 224-232. 399
EU, 2013. Regulation (EU) No 1380/2013 of the European Parliament and of the Council of 11 400
December 2013 on the Common Fisheries Policy, Amending Council Regulations (EC) 401
No 1954/2003 and (EC) No 1224/2009 and Repealing Council Regulations (EC) No 402
2371/2002 and (EC) No 639/2004 and Council Decision 2004/585/EC Official Journal of 403
the European Union, Brussels. 404
EU. 2014. Task Force on multiannual plans. Final report April 2014. Retrieved from 405
http://www.europarl.europa.eu/meetdocs/2009_2014/documents/pech/dv/taskfor/t406
askforce.pdf on November 1st 2015 407
Fisheries and Aquaculture Law, 2013. Ley N° 20.657. Chile. Modifica en el ámbito de la 408
sustentabilidad de recursos hidrobiológicos, acceso a la actividad pesquera industrial y 409
artesanal y regulaciones para la investigación y fiscalización, la Ley General de Pesca y 410
Acuicultura contenida en Ley No 18.892 y sus modificaciones. 09-Feb-2013 411
García, D., Prellezo, R., Sampedro, P., Da-Rocha, J. M., Castro, J., Cerviño, S., García-Cutrín, J. 412
and Gutiérrez, M.-J. 2017. Bioeconomic multistock reference points as a tool for 413
18
overcoming the drawbacks of the landing obligation. ICES Journal of Marine Science: 414
Journal du Conseil: 74(2), 511-524. Doi: 10.1093/icesjms/fsw030 415
Garcia, S. M., Zerbi, A., Aliaume, C., Do Chi, T., Lasserre, G., 2003. The Ecosystem Approach to 416
Fisheries. Issues, Terminology, Principles, Institutional Foundations, Implementation 417
and Outlook. FAO, Rome, p. 71. Fisheries Technical Paper. 418
Hara, M. M. 2013. Efficacy of rights-based management of small pelagic fish within an 419
ecosystems approach to fisheries in South Africa. African Journal of Marine Science, 420
35(3): 315-322. 421
Hart, D. R. 2013. Quantifying the tradeoff between precaution and yield in fishery reference 422
points. – ICES Journal of Marine Science, 70: 591–603. 423
Hilborn, R., Stewart, I. J., Branch, T. A., and Jensen, O. P. 2012. Defining Trade-Offs among 424
Conservation, Profitability, and Food Security in the California Current Bottom-Trawl 425
Fishery. Conservation Biology, 26: 257-268. 426
Hilborn, R., Fulton, E. A., Green, B. S., Hartmann, K., Tracey, S. R. and Watson, R. A. 2015. When 427
is a fishery sustainable? Canadian Journal of Fisheries and Aquatic Sciences, 72: 1433-428
1441. 429
Hoefnagel, E., de Vos, B., and Buisman, E. 2015. Quota swapping, relative stability, and 430
transparency. Marine Policy 57: 111-9. 431
ICES 2012. Report of the Workshop on North Sea and Baltic Sea Multispecies Trade-offs (WKM-432
Trade). ICES CM 2012/ACOM:71. Available from 433
http://www.ices.dk/sites/pub/Publication%20Reports/Expert%20Group%20Report/ac434
om/2012/WKM-Trade/wkm_trade2012.pdf 435
Kempf, A., Mumford, J., Levontin, P., Leach, A., Hoff, A., Hamon, K. G., Bartelings, H., Vinther, 436
M., Staebler, M., Poos, J. J., Smout, S., Frost, H., Burg, S., Ulrich, C., and Rindorf, A. 437

19
2016. The MSY concept in a multi-objective fisheries environment – lessons learned 438
from the North Sea. Marine Policy, 69: 146-158. 439
Legovic, T., Klanjscek, J. and Gecek, S. 2010. Maximum sustainable yield and species extinction 440
in ecosystems. Ecological Modelling, 221(12): 1569–1574. 441
Mapstone, B.D., Little, L. R., Punt, A. E., Davies, C. R., Smith, A. D. M., Pantus, F., McDonald, 442
A.D., Williams, A. J., Jones, A. 2008. Management strategy evaluation for line fishing in 443
the Great Barrier Reef: Balancing conservation and multi-sector fishery objectives. 444
Fisheries Research, 94: 315–329. 445
Mardle, S. and Pascoe, S. 2002. Modelling the effects of trade-offs between long and short-446
term objectives in fisheries management. Journal of Environmental Management (65): 447
49-62. 448
McShane, T. O., Hirsch, P. D., Trung, T. C., Songorwa, A. N., Kinzig, A., Monteferri, B., 449
Mutekanga, D., Thang, H. V., Dammert, J. L., Pulgar-Vidal, M., Welch-Devine, M., 450
Brosius, J. P., Coppolillo, P. and O’Connor, S. 2011. Hard choises: Making trade-offs 451
between biodiversity conservation and human well-being. Biological Conservation, 452
144: 966-972. 453
Methot, R. D., Tromble, G. R., Lambert, D. M. and Greene, K. E. 2014. Implementing a science-454
based system for preventing overfishing and guiding sustainable fisheries in the United 455
States. ICES Journal of Marine Science, 71: 183–194. 456
Mohn, R. K., and Chouinard, G. A. 2007. Harvest control rules for stocks displaying dynamic 457
production regimes. ICES Journal of Marine Science., 64:693–697. 458
Pascoe, S., Proctor, W., Wilcox, C., Innes, J., Rochester, W. and Dowling, N. 2009. Stakeholder 459
objective preferences in Australian Commonwealth managed fisheries. Marine Policy, 460
33(5): 750-758. 461
20
Punt, A. E. 2017. Strategic management decision-making in a complex world: quantifying, 462
understanding, and using trade-offs. ICES Journal of Marine Science: Journal du 463
Conseil, 74: 499-510. Doi: 10.1093/icesjms/fsv193. 464
Punt, A. E., Butterworth, D. S., de Moor, C. L.,De Oliveira, J. A. and Haddon, M. 2016. 465
Management strategy evaluation: best practices. Fish and Fisheries, 17: 303–334. 466
Prellezo, R., and Curtin, R. 2015. Confronting the implementation of marine ecosystem-based 467
management within the Common Fisheries Policy reform. Ocean & Coastal 468
Management, 117: 43-51. 469
Quetglas, A., Merino, G., Ordines, F., Guijarro, B., Garau, A., Grau, A.M., Oliver, P. and Massutí, 470
E. 2016. Assessment and management of western Mediterranean small-scale fisheries. 471
Ocean & Coastal Management, 133: 95-104. 472
Rindorf, A, Schmidt, J., Bogstad, B., Reeves, S., and Walther, Y. 2013. Framework for 473
Multispecies Assessment and Management. An ICES/NCM Background Document. 474
Available from 475
http://www.ices.dk/publications/Documents/Miscellaneous%20pubs/A%20framework476
%20for%20multispecies%20assessment%20and%20management.pdf 477
Rindorf, A., Dichmont, C. M. , Levin, P. S., Mace, P., Pascoe, S., Prellezo, R., Punt, A. E., Reid, D. 478
G., Stephenson, R., Ulrich, C., Vinther, M. and Clausen, L. W. 2017a. Food for thought: 479
Pretty good multispecies yield. ICES Journal of Marine Science: Journal du Conseil, 74: 480
475-486. 481
Rindorf, A., Cardinale, M., Shephard,S. De Oliveira, J. A. A., Hjorleifsson, E., Kempf, A., 482
Luzenczyk,A., Millar, C., Miller, D. C. M., Needle, C. L., Simmonds, J., and Vinther, M. 483
2017b. Fishing for MSY: using “pretty good yield” ranges without impairing 484
recruitment. ICES Journal of Marine Science: Journal du Conseil, 74: 525-534. 485

21
Sampedro, P., Prellezo, R., García, D., Da-Rocha, J. M., Cerviño, S., Torralba, J., Touza, J., García-486
Cutrín, J., and Gutiérrez, M. J. 2017. To shape or to be shaped: engaging stakeholders 487
in fishery management advice. ICES Journal of Marine Science: Journal du Conseil, 488
74(2): 487–498. 489
Shelton, P. A., and Morgan, M. J. 2014. Impact of maximum sustainable yield-based fisheries 490
management frameworks on rebuilding North Atlantic cod stocks. Journal of 491
Northwest Atlantic Fishery Science, 46: 15–25. doi:10.2960/J.v46.m697 492
Smith, A.D., Brown, C.J., Bulman, C.M., Fulton, E.A., Johnson, P., Kaplan, I.C., Lozano-Montes, 493
H., Mackinson, S., Marzloff, M., Shannon, L.J. and Shin, Y.J., 2011. Impacts of fishing 494
low–trophic level species on marine ecosystems. Science, 333(6046), pp.1147-1150. 495
Stephenson, R. L., Benson, A. J., Brooks, K., Charles, A., Degnbol, P., Dichmont, C. M., Kraan, 496
M., Pascoe, S., Paul, S. D., Rindorf, A., and Wiber, M. (2017). Practical steps toward 497
integrating economic, social and institutional elements in fisheries policy and 498
management. ICES Journal of Marine Science, doi:10.1093/icesjms/fsx057. 499
US 2007. Magnuson-Stevens Fishery Conservation Management Reauthorization Act of 2006. 500
Public Law, 479. 501
Ulrich, C., Vermard, Y., Dolder, P. J., Brunel, T., Jardim, E., Holmes, S. J., Kempf, A., Mortensen, 502
L. O., Poos, J.J. , and Rindorf, A. (2017). Achieving maximum sustainable yield in mixed 503
fisheries: a management approach for the North Sea demersal fisheries. ICES Journal 504
of Marine Science, 74: 566-575. 505
Voss, R., Quaas, M. F., Schmidt, J. O., and Hoffmann, J.2014a. Regional trade-offs from multi-506
species maximum sustainable yield (MMSY) management options. Marine Ecology 507
Progress Series, 498: 1-12. 508
22
Voss, R., Quaas, M. F., Schmidt, J. O., Tahvonen, O., Lindegren, M. and Mollmann, C. 2014b. 509
Assessing Social – Ecological Trade-Offs to Advance Ecosystem-Based Fisheries 510
Management. PLoS ONE 9(9). 511
Wilson, D. C. 2009. The paradoxes of transparency: science and the ecosystem approach to 512
fisheries management in Europe (Vol. 5). Amsterdam University Press, Amsterdam. 513
304 pp. 514
WCED 1987. Our Common Future. Oxford: Oxford University Press. p. 27. ISBN 019282080X. 515
Zeller, D. and Pauly, D. 2004. The future of fisheries: From 'exlusive' resource policy to inclusive 516
public policy. Marine ecology progress series, 274: 295-298. 517
23
6. Supplementary material 518
Workshop process, initial problem framing workshop 519
In the first part of the problem framing workshop, participants were divided into four different 520
topic groups according to their stated individual preferences to identify possible objectives and 521
constraints. Each group focused on one of the following: ecosystem issues, stock interaction 522
issues, economic issues and social and governance issues. In the topic groups different 523
objectives for maximisation were discussed and a consensus was reached on those to be 524
evaluated further. The number of participants in the groups ranged from 11 to 18. Scientists 525
tended to join the group covering their area of expertise. NGOs were only represented in the 526
groups on ecosystem issues and stock interaction issues. Industry representatives were present 527
in all groups but mostly attended the economic and social and governance groups. The groups 528
were asked to focus on three questions: ‘What can/should we maximise?’, ‘What should we 529
sustain?’ and ‘How can we implement it?’. 530
The second part of the initial problem framing workshop determined which objectives and 531
constraints were considered relevant and desirable in different regions. This was conducted in 532
regional groups encompassing the Baltic Sea, Mediterranean, North Sea, Western Waters and 533
Widely Ranging Stocks, where the latter covers migratory as well as distant water fisheries. 534
A graphical tool recorded and displayed the distribution of ratings (see example in Figure S1). 535
Evaluations were based on a five point scale from “very good” to “very poor”, and uncertainty 536
or disagreement within the group was reflected in a distribution of scores. Group rapporteurs 537
included text comments in the spreadsheets explaining group decisions. The ratings were 538
integrated into a distribution of “utility” for each objective and constraint using a matrix 539
method. The matrix method operates on discrete distributions in a way that is mathematically 540
consistent with an intuitive interpretation of how distributions should be related. For example, 541
‘low’ feasibility and ‘low’ impact should lead to a distribution for the utility probability mass 542
concentrated around the ‘low’ end of the scale. The method is described fully in Holt et al. 543
24
(2014). The options were subsequently ranked primarily on expected utility values with 544
uncertainty as a secondary ranking criterion, if utility values were the same. 545
546
Figure S1 about here 547
548
Description of regional response workshops 549
Baltic Sea 550
Baltic Sea stakeholders were consulted through the Baltic Sea Advisory Council, at a workshop 551
in June 2014 (Figure 1). The effects on yield and ecological, economic and social sustainability of 552
three different objectives were demonstrated in a DST: Maximise Net Present Value (Economic), 553
Maximise Net Present Value While Conserving Sprat (Economic with ecosystem constraints) and 554
Maximise Net Present Value While Conserving Equity between Countries (Economic with social 555
constraints). 556
557
Eastern Mediterranean: Aegean Sea 558
Scenarios for the Aegean Sea were presented and discussed during the annual meeting of the 559
Pan-Hellenic Union of Middle-Range Ship Owners in June 2014 (Figure 1). The series of 560
objectives examined included the current single species MSY (Ecosystem), Maximise Net Present 561
Value (Economic) and a scenario which went towards MEY but limited the reduction of fleet 562
capacity (Economic with social constraints). 563
564
Western Mediterranean: Balearic Sea 565
A workshop was organized in January 2014 with the participation of fishermen and 566
representatives from fisheries managers (Figure 1). The set of objectives examined included the 567

25
current fishing exploitation scheme, Maximise Net Present Value (Economic) and an 568
intermediate scenario in between these two previous, extreme situations in which the effort, 569
catch and economic value are at the average between the current and the predicted MEY 570
scenarios (Economic with social constraints). 571
572
North Sea 573
The stakeholder workshop for the North Sea case study was held in July 2014 together with the 574
North Sea Advisory Council demersal fisheries group (Figure 1). Three different cases were 575
discussed. The first focused on biological interactions in the context of multispecies MSY in 576
tonnes (Ecosystem), value (Economic) and multispecies ranges (Ecosystem and Governance). 577
The second focused on MSY in tonnes (Ecosystem) and net present value (Economic) when 578
accounting for technical interactions in the fisheries on North Sea gadoids while implementing 579
single species FMSY and a landing obligation. The third focused on multispecies MSY in tonnes 580
(Ecosystem) and net present value (Economic) for flatfish and shrimp fleets in the southern 581
North Sea in an ecosystem setting. 582
583
Western Waters 584
The stakeholder workshop was held for the Iberian Sea case study in conjunction with a regular 585
meeting of the South Western Waters Advisory Council in June 2014 (Figure 1). Two objectives 586
were presented, single stock MSY (Ecosystem) and Maximise Net Present Value of key 587
commercial species (Economic). These two objectives were combined in scenarios with constant 588
effort in artisanal fleets, as a proxy for maintaining the employment in these fleets (adding social 589
constraints). 590
26
591
Widely Ranging 592
A stakeholder workshop was organized in February 2014 together with the Pelagic Advisory 593
Council (Figure 1). Two issues played a large role at the workshop: firstly, an important ad-hoc 594
meeting on Mackerel TAC distribution was scheduled just prior to the workshop resulting in a 595
lower attendance of industry members and secondly, the interpretation of MSY under a landing 596
obligation varied considerably among participants. Case-studies focused on Norwegian Spring 597
Spawning herring, North Sea herring and North Sea sprat and tuna in the Indian Ocean. Results 598
for MSY (Ecosystem), Stability of Catches (Ecosystem) and Good Environmental Status of the 599
stocks (Ecosystem) were presented for the North Sea stocks. Alternatives for Tuna in the Indian 600
Ocean were presented at an IOTC meeting in November 2014 where mixed-fisheries MSY was 601
the main point of discussion. 602
603

1
7. Figure captions 1
Figure 1. Total (number) and composition (bars) of participants in the workshops. 2
Figure 2. Graphic summary of overall average means and range of means for different 3
objectives by different regional groups. Objectives that were evaluated by fewer than three 4
regional groups are not included. 5
Figure 3. Average rating of objectives in the different categories by regional groups ordered 6
from no interaction (left) to high interaction (right) between yields of different fisheries. Bars 7
indicate rating average and vertical lines show the range of ratings observed in that category. 8
Figure 4. Distribution of objectives to be maximised and constraints to limit sustainability 9
across sustainability pillars on the full list (options) and the top five selected in regional groups. 10
Figure S1. Graphical tool to record ratings. Four evaluations are shown. The bottom right panel 11
represents medium desirability with high uncertainty or disagreement. For the other panels, 12
the evaluation ranges from “very good” (top left), “medium” (top right), to “very poor” 13
(bottom left), each with very little uncertainty or disagreement 14

Fig.1
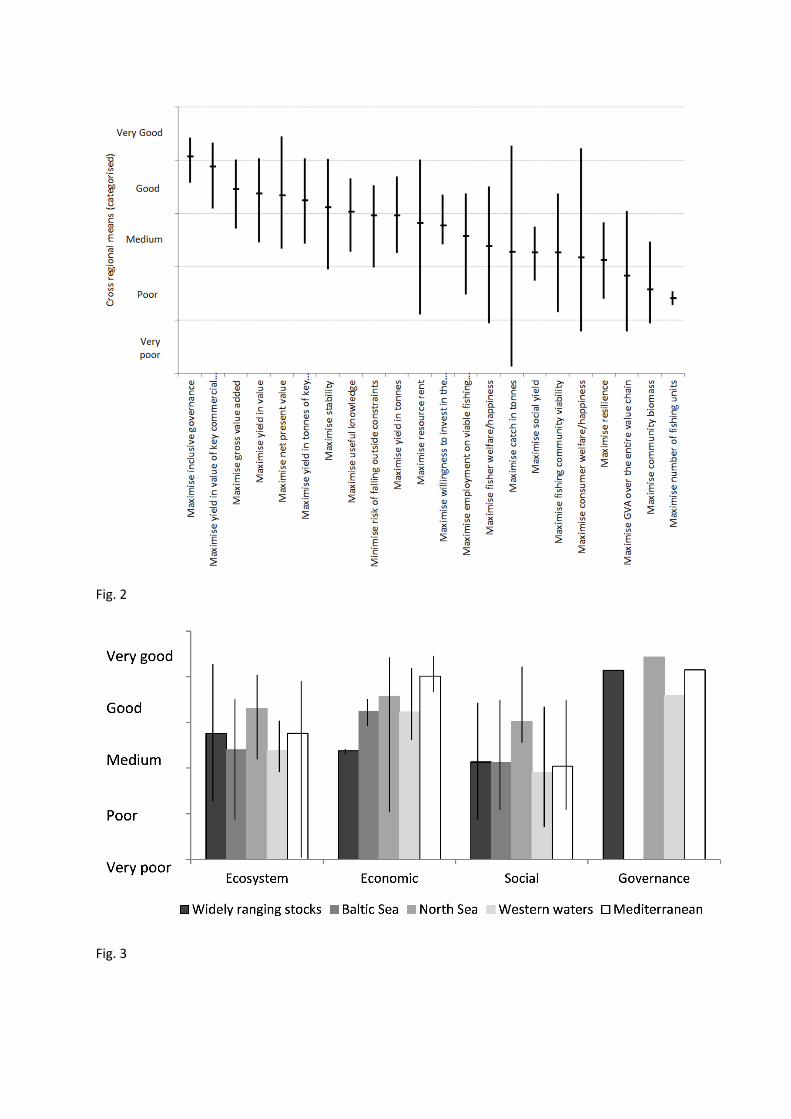
Fig. 2
Fig. 3

Fig. 4
Fig S1

1
Table 1. Potential objectives to maximise (or minimise) identified in the problem framing 1
workshop. 2
Option Category Explanation Maximise Yield in Tonnes Ecosystem Summed weight of landings of all
commercial species Maximise Yield in Tonnes of Key Commercial
Species Ecosystem Summed weight of landings of key
commercial species Maximise Catch in Tonnes Ecosystem Summed weight of catch (including discards)
of all commercial species Maximise Present Yield for Human
Consumption Ecosystem Summed landings used for human
consumption Maximise Stability Ecosystem Stability in landings or catches
Maximise Community Biomass Ecosystem Summed biomass in the ecosystem
Minimise Risk of Falling Outside Constraints Ecosystem Constraints are boundaries beyond which management is considered unsustainable
Maximise Resilience Ecosystem The ability of the ecosystem to absorb pressures without creating permanent distortion
Maximise Yield in Value of Key Commercial Species
Economic Summed value of landings of key commercial species
Maximise Yield in Value Economic Summed value of landings of all commercial species
Maximise Gross Value Added Economic Summed value of landings less all variable costs
Maximise Resource Rent Economic Summed surplus value less all costs and normal returns
Maximise Net Present Value Economic Summed value of landings less all costs discounted back to its present value
Maximise Yield/Litre of Fuel or CO2 Emission Economic This objective includes aspects of both MEY (maximise yield/variable cost) and MSOY as CO2 was also suggested as an example of a societal cost
Maximise Number of Fishing Units Social
Maximise Fisher Welfare/Happiness Social
Maximise Consumer Welfare/Happiness Social
Maximise Willingness to Invest in the Future Fisheries
Social
Maximise Social Yield Social Summed value from a societal perspective in 4x4 categories: Utility, Experimental, Future, Institutional value from a social, cultural, governance, ecological perspective
Maximise Employment on Viable Fishing Units
Social Requires a definition of ‘viable’
Maximise Gross Value Added over the Entire Value Chain
Social
Summed value of fish/invertebrate products less all variable costs in fishing and processing
Maximise Fishing Community Viability Social
Requires a definition of ‘viability’
Maximise Health Benefit/CO2 Social
Health benefit could be essential fatty acids and CO2 was given as an example of a societal cost
Maximise Useful Knowledge Social
Maximise Inclusive Governance Governance Engaging an appropriate range of stakeholders to influence the decision-making process. The range of stakeholders should include all categories of stakeholders and the process should be iterative.
3
2
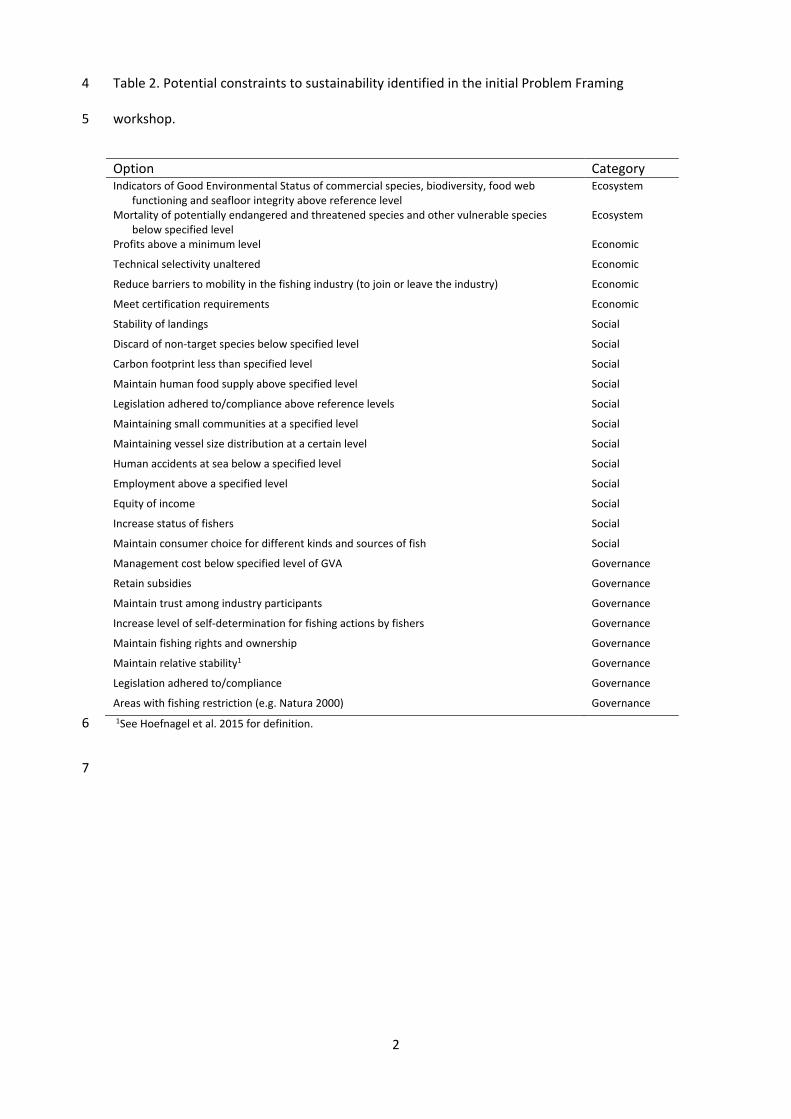
Table 2. Potential constraints to sustainability identified in the initial Problem Framing 4
workshop. 5
Option Category Indicators of Good Environmental Status of commercial species, biodiversity, food web
functioning and seafloor integrity above reference level Ecosystem
Mortality of potentially endangered and threatened species and other vulnerable species below specified level
Ecosystem
Profits above a minimum level Economic
Technical selectivity unaltered Economic
Reduce barriers to mobility in the fishing industry (to join or leave the industry) Economic
Meet certification requirements Economic
Stability of landings Social
Discard of non-target species below specified level Social
Carbon footprint less than specified level Social
Maintain human food supply above specified level Social
Legislation adhered to/compliance above reference levels Social
Maintaining small communities at a specified level Social
Maintaining vessel size distribution at a certain level Social
Human accidents at sea below a specified level Social
Employment above a specified level Social
Equity of income Social
Increase status of fishers Social
Maintain consumer choice for different kinds and sources of fish Social
Management cost below specified level of GVA Governance
Retain subsidies Governance
Maintain trust among industry participants Governance
Increase level of self-determination for fishing actions by fishers Governance
Maintain fishing rights and ownership Governance
Maintain relative stability1 Governance
Legislation adhered to/compliance Governance
Areas with fishing restriction (e.g. Natura 2000) Governance
1See Hoefnagel et al. 2015 for definition. 6
7
3
Table 3. Top five ranked objectives for maximisation (or minimisation) for all regions where 8
these received ‘Good’ or ‘Very good’ ratings. Ratings are: < 0.8: Very good; 0.8-1.4: Good. 9
Region Objective Ranking Rating Category
Baltic Sea Minimise Risk of Falling Outside Constraints 1 1.17 Ecosystem
Baltic Sea Maximise Gross Value Added 1 1.17 Economic
Baltic Sea Maximise Resource Rent 1 1.17 Economic
Baltic Sea Maximise Fisher Welfare/Happiness 3 1.19 Social
Mediterranean Sea Maximise Net Present Value 1 0.44 Economic
Mediterranean Sea Maximise Inclusive Governance 2 0.68 Governance
Mediterranean Sea Maximise Gross Value Added 3 0.79 Economic
Mediterranean Sea Maximise Resource Rent 3 0.79 Economic
Mediterranean Sea Maximise Yield in Tonnes of Key Commercial Species 5 0.87 Ecosystem
Mediterranean Sea Maximise Yield in Value of Key Commercial Species 5 0.87 Economic
North Sea Maximise Inclusive Governance 1 0.46 Governance
North Sea Maximise Yield of Fish/Litre of Fuel (or CO2 Emission) or similar energy unit 2 0.47 Economic
North Sea Maximise Yield in Value of Key Commercial Species 3 0.53 Economic
North Sea Maximise Consumer Welfare/Happiness 4 0.62 Social
North Sea Maximise Yield in Value 5 0.77 Economic
Western Waters Maximise Yield in Value of Key Commercial Species 1 0.65 Economic
Western Waters Maximise Yield in Value 2 1.12 Economic
Western Waters Maximise Inclusive Governance 3 1.14 Governance
Western Waters Maximise Willingness to Invest in the Future Fisheries 4 1.32 Social
Widely Ranging Stocks Maximise Catch in Tonnes 1 0.58 Ecosystem
Widely Ranging Stocks Maximise Inclusive Governance 2 0.69 Governance
Widely Ranging Stocks Maximise Stability in catches 3 0.92 Ecosystem
Widely Ranging Stocks Maximise Yield in Tonnes 4 1.04 Ecosystem
Widely Ranging Stocks Maximise Useful Knowledge 5 1.25 Social
10
11
4
Table 4. Top five ranked sustainability constraints. 12
Region Constraint Ranking Category
Aegean Sea (Mediterranean) Employment Above a Specified Level 1 Social
Aegean Sea (Mediterranean) GES Descriptors of Commercial Species Above Reference Level 2 Ecosystem
Aegean Sea (Mediterranean) Maintaining Small Communities at a Specified Level 3 Social
Aegean Sea (Mediterranean) Retain Subsidies 4 Governance
Aegean Sea (Mediterranean) Legislation Adhered To/Compliance 5 Social
Balearic Sea (Mediterranean) Areas with Fishing Restriction (e.g. Natura 2000) 1 Governance
Balearic Sea (Mediterranean) Profits Above a Minimum Level 2 Economic
Balearic Sea (Mediterranean) Employment Above a Specified Level 2 Social
Balearic Sea (Mediterranean) Retain Subsidies 2 Governance
Balearic Sea (Mediterranean) Maintaining Small Communities at a Specified Level 2 Social
Balearic Sea (Mediterranean) Stability of Landings 2 Social
Balearic Sea (Mediterranean) Maintain Human Food Supply Above Specified Level 2 Social
North Sea GES Descriptors of Commercial Species, Biodiversity, Food Web Functioning and Seafloor Integrity Above Reference
Level 1 Ecosystem
North Sea Areas with Fishing Restriction (e.g. Natura 2000) 1 Governance
North Sea Mortality of PET and Other Vulnerable Species Below Specified Level 1 Ecosystem
North Sea Discards of Non-target Species Below Specified level 1 Ecosystem
North Sea Legislation Adhered To/Compliance 1 Governance
North Sea Maintain Relative Stability 1 Governance
North Sea Human Accidents at Sea Below a Specified Level 1 Social
Widely Ranging Stocks GES Descriptors of Commercial Species Above Reference Level 1 Ecosystem
Widely Ranging Stocks Mortality of PET and Other Vulnerable Species Below Specified Level 2 Ecosystem
Widely Ranging Stocks Areas with Fishing Restriction (e.g. Natura 2000) 3 Ecosystem
Widely Ranging Stocks Maintain Trust Among Industry Participants 4 Governance
Widely Ranging Stocks Maintain Relative Stability 5 Governance
13
14
15
16

5
Table 5. Proportion of objectives in the preferred top five relative to the maximum possible, 17
and the proportionexpected if no selection took place. 18
Category Ecosystem Economic Social Governance Proportion of possible objectives 0.29 0.21 0.46 0.03
Proportion of rated objectives in top 5* 0.21 (P=0.1250)
0.46 (P=0.0041)
0.17 (P=0.0020)
1.00 (P<0.0001)
Proportion of possible objectives 0.17 0.17 0.38 0.28
Proportion of rated objectives in top 5* 0.25 (P=0.1052)
0.04 (P=0.0639)
0.29 (P=0.2535)
0.42 (P=0.0427)
*relative to the maximum possible, hence these values do not sum to one, as governance had 19
only one objective and this was only rated by four groups (maximum number of top five 20
entries=4). 21
22
6
Table 6. The objectives and constraints evaluated in regional response workshops. 23
Region Objectives and constraints presented Results Baltic Sea Maximise Net Present Value (Economic); Maximise Net Present Value While
Conserving Sprat (Economic with ecosystem constraints); and Maximise Net Present Value While Conserving Equity between Countries (Economic with social constraints)
The conservation approach (Economic with ecosystem constraints) received the best average score (Medium) and showed the lowest variation between participants. This scenario combines aspects of minimise risk and maximises gross value added/resource rent which were originally rated in top 5. However, the differences between the different scenarios were slight, and no strong preferences were observed.
Mediterranean: Aegean Sea
Current single species MSY (Ecosystem); Maximise Net Present Value (Economic); and a scenario which went towards MEY but limited the reduction of fleet capacity (Economic with social constraints)
The preferred scenario was intermediate between single species MSY and MEY. This scenario combines economic objectives to be maximised (net present value) with social constraints (limit change in employment) and the need to Maximise Inclusive Governance, all of which were in the original top 5.
Mediterranean: Balearic Sea
Current fishing exploitation scheme; Maximise Net Present Value (Economic); and an intermediate scenario in between these two extreme situations in which the effort, catch and economic value are at the average between the current and the predicted MEY scenarios (Economic with social constraints)
The preferred scenario was intermediate between the current situation and the full MEY. This intermediate scenario combines the objectives of net present value (Economic) and Maximise Inclusive Governance (Governance), both of which were in the original top 5.
North Sea 1. Focus on biological interactions in the context of multispecies MSY in tonnes (Ecosystem), value (Economic) and multispecies ranges (Ecosystem and Governance)
2. Focus on MSY in tonnes (Ecosystem) and net present value (Economic) when accounting for technical interactions in the fisheries on North Sea gadoids while implementing single species FMSY and a landing obligation
3. Focus on multispecies MSY in tonnes (Ecosystem) and net present value (Economic) for flatfish and shrimp fleets in the southern North Sea in an ecosystem setting
1. The preferred objective was a qualitative approach to multispecies MSY as this approach makes it possible to address with trade-offs caused by biological and technical interactions. The approach combines ecosystem objectives with governance objectives (Maximise Inclusive Governance) and constraints (adhere to current legislation on MSY), both of which were in the original top 5.
2. and 3. The preferred objective was economic objectives (MEY) but concerns about social consequences (i.e. employment) when aiming for MEY were raised. All: The preferred scenarios combined economic objectives (Maximise value landed or Yield per Litre Fuel) and governance objectives (Maximise Inclusive Governance), all of which were in the original top 5, in solutions where ranges in acceptable yield allowed room for negotiation.
Western Waters Single stock MSY (Ecosystem) and Maximise Net Present Value of key commercial species (Economic) combined in scenarios with constant effort in artisanal fleets, as a proxy for maintaining the employment in these fleets (adding social constraints)
The preferred objectives depended on the stakeholder compositions as representatives of artisanal fleets preferred to be outside the TAC and quota management system and maintain their effort regardless of the objective used to manage the whole fishery. On the other hand, the industrial fleet representatives preferred Maximise Net Present Value of key commercial species (Economic objective), and economic objectives were dominant in the original top 5.
Widely Ranging Stocks
Focus on Norwegian Spring Spawning herring, North Sea herring and North Sea sprat. Results for MSY (Ecosystem), Stability of Catches (Ecosystem) and Good Environmental Status of the stocks (Ecosystem) for the North Sea.
The objective MSY in tonnes while ensuring stability in catches was preferred by most participants (Ecosystem objective with ecosystem constraints). This scenario combined aspects of Maximise Yield in Tonnes, Maximise Stability and Maximise Inclusive Governance, all of which were in the original top 5.

7
24


