NASA Contractor Report 189633
///-,":, M,
EXPERIMENTAL EVALUATION OF CANDIDATE
GRAPHICAL MICROBURST ALERT DISPLAYS
Craig R. Wanke and R. John Hansman
MASSACHUSETTS INSTITUTE OF TECHNOLOGY
Cambridge, Massachusetts
Purchase Order L-91172C
June 1992
IW ANalional Aeronauhcs and
Space Adminislration
Langley Research Center
Hampton, Virginia 23665-5225
(NASA-CR-I 6q_ ] J) EXPFRT MFA, TAI
CANSInATE L,PAOHTC&L MICRL;_URST
UISPL_Y£ Interim AnnunJ Re#oft
EVALUAT IQi_ OF
ALFRT
(MIT) Z9 p
Ng2-2?e24
Uncl as
G3/06 0099199
https://ntrs.nasa.gov/search.jsp?R=19920018181 2018-06-11T01:32:55+00:00Z

Abstract
A piloted flight simulator experiment has been conducted to evaluate issues related to the
display of microburst alerts on electronic cockpit instrumentation. Issues addressed include
display clarity, usefulness of multi-level microburst intensity information, and whether information
from multiple sensors should be presented separately or "fused" into combined alerts. Nine active
airline pilots of"glass-cockpit" aircraft participated in the study. Microburst alerts presented on a
moving map display were found to be visually clear and useful to pilots. Also, multi-level
intensity information coded by colors or patterns was found to be important for decision-making
purposes. Pilot opinion was mixed on whether to "fuse" data from multiple sensors, and some
resulting design tradeoffs have been identified. The positional information included in the
graphical alert presentation was found useful by the pilots for planning lateral missed approach
maneuver, but may result in deviations which could interfere with normal airport operations. A
number of flight crew training issues were also identified.
This work is being performed under Air Force Contract No. F19628-90-C-0002 and
sponsored by the Flight Management Division of the NASA Langley Research Center.
Table of Contents
Abstract .................................................................................... i
Table of Contents ......................................................................... ii
List of Figures ............................................................................ iii
List of Tables ............................................................................. iii
1. Introduction ........................................................................... 1
2. Objectives of Experiment ........................................................... 2
3. Experimental Design ................................................................. 3
3.1 Overview ................................................................. 3
3.2 MIT Advanced Cockpit Simulator ..................................... 3
3.3 Microburst Display Formats ............................................ 5
3.4 Scenario Design .......................................................... 10
3.5 Experimental Procedure ................................................. 11
3.6 Subject Selection ......................................................... 12
4. Results and Discussion .............................................................. 12
4.1 Visual Clarity of Alerts on EHS1 ...................................... 12
4.2 Overall Display Ratings ................................................. 12
4.3 Specific Display Features ............................................... 13
4.4 Procedural Implications of Graphical Alerts .......................... 15
5. Conclusions .......................................................................... 18
5.1 Display Format Issues .................................................. 18
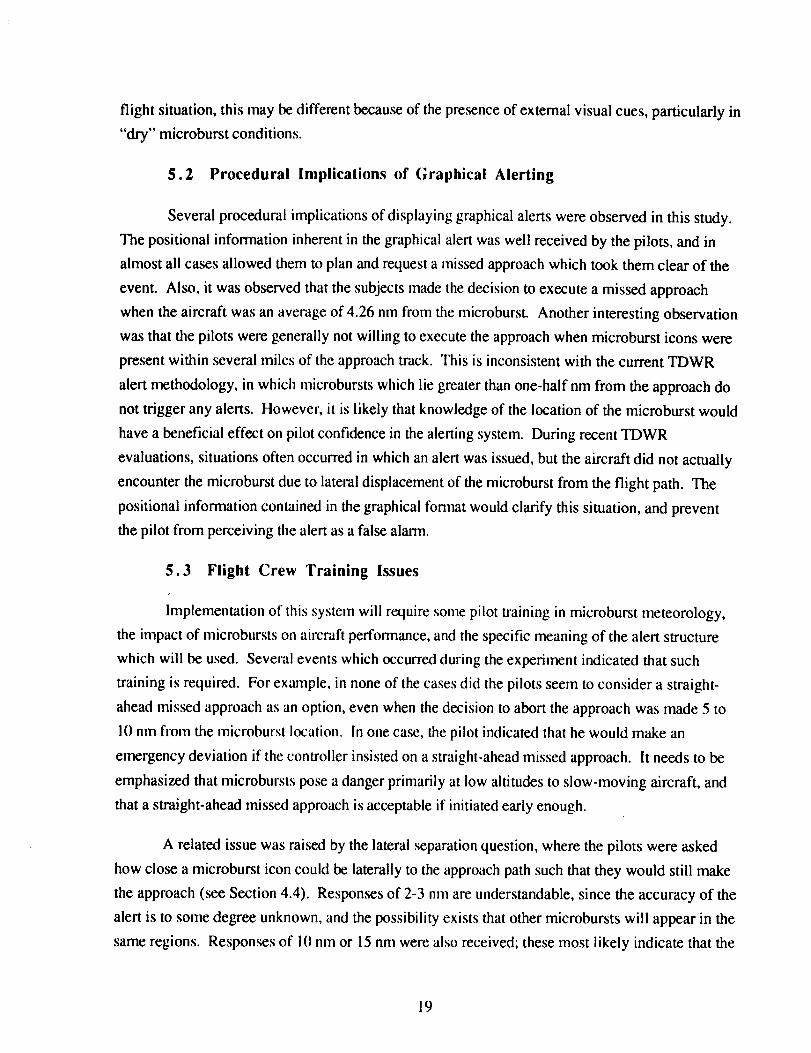
5.2 Procedural Implications of Graphical Alerting ....................... 19
5.3 Flight Crew Training Issues ............................................ 19
Acknowledgements ...................................................................... 20
References ................................................................................. 21
Appendix A: Exit Questionnaire ....................................................... 22
List of Figures
Figure 1.
Figure 2.
Figure 3.
Figure 4.
Figure 5.
Figure 6.
MIT Advanced Cockpit Simulator ........................................ 4
Example of Display A on the
Example of Display B on the
Example of Display C on the
EHSI ....................................... 7
EHS ! ....................................... 8
EHSI ....................................... 9
Average pilot usefulness rankings for the three displays ............... 13
Definition of decision distance ............................................ 15
List of Tables
Table 1.
Table 2.
Table 3.
Table 4.
Microburst intensity levels for Display B ................................ 6
Scenario characteristics ..................................................... 11
Pilot preference rankings for the three display types ................... 12
Subject rating of particular display features by need .................... 14
°°°
Ul

I. Introduction
This report summarizes results of a piloted simulator study performed under the Cockpit
Weather Information (CWI) program at MIT. This program is funded through the NASA Langley
Research Center by the joint FAA/NASA Integrated Wind Shear program. The overall purpose of
the NASA program is to reduce the wind shear hazard to transport-category aircraft through hazard
characterization, development of airborne sensor technologies, and flight deck integration. The
emphasis of current work at the MIT Department of Aeronautics and Astronautics is on integration
of ground-based and airborne wind shear information to provide a crew-centered microburst
hazard warning. This effort includes evaluation of candidate crew alerting procedures and
investigation of methods for fusion of ground-based and airborne wind shear data.
In the past few years, systems for the detection of low altitude wind shear hazards,
particularly microbursts, have been under steady development. These include ground-based
systems such as Terminal Doppler Weather Radar (TDWR) and an enhanced version of the
anemometer-based Low Level Windshear Alert System (LLWAS), as well as airborne forward-
looking systems such as infrared radiometers, doppler radar, and doppler iidar. In order to
incorporate these new sensors into an effective alerting system, the problem of dissemination to
flight crews must also be addressed. The variety of systems under development for both wind
shear detection and ground-to-air datalink, combined with the advent of electronic cockpit
instrumentation, allow many options for alert generation and dissemination.
A critical part of the dissemination task is the presentation of alerts to the flight crew in an
easily understood and timely manner. A previous flight simulator study at MIT on this topic
focussed on comparing verbal, alphanumeric, and graphical modes of presentation in the context of
both ATC amendments and microburst alerts. This experimenU .2 demonstrated that graphical
alerting is beneficial in terms of faster comprehension time, reduced crew workload, and increased
crew situational awareness. Based on these results, a second simulator experiment was designed
to evaluate specific format and implementation issues associated with graphical microburst alert
displays, and to recommend an effective format base, d on the results.
2. Objectives of Experiment
The experiment concentrated on displaying microburst alerts, assumed to be generated by
ground-based and/or airborne remote detection systems, on an Electronic Horizontal Situation
Indicator (EHSI). The EHS! is a navigational moving map display which lends itself to displaying
positional threats such as microbursts. The issues addressed by the experiment ranged from
display clarity to the procedural consequences of graphical alerts. They are summarized below:
I) is it possible to add microburst alerts to the EHSI display during normal flight operation
in a visually clear and understandable fashion, without creating visual "clutter"? The
EHSI is used as a primary navigational instrument, and therefore already displays a large
amount of information.
2) Should multiple levels of microburst intensity be displayed? The simplest display would
show only "hazardous" microbursts, which have been selected through application of a
suitable hazard criterion. Is this acceptable, or is it important to show multiple intensity
levels, and if so, how many levels should be used?
3) In some situations, information will be available from multiple sources. For example,
TDWR information could be uplinked to an aircraft which is equipped with a forward-
looking detection system of its own. Should measurements from all of the available
sensors be combined to form a single "fused" alert, or should alerts from different
sources be independently displayed?
4) Does lack of con'elation between weather radar reflectivity and microburst alerts affect
pilot confidence in the alerts? Microbursts can occur under conditions of heavy
precipitation ("wet" microbursts) or very light precipitation ("dry" microbursts), and in
either case, may or may not be correlated with the regions of highest weather radar
reflectivity. This will be apparent with a graphical display, especially when weather radar
returns are present on the same display.
5) What are the procedural implications of displaying graphical alerts? Graphical alerts
contain detailed positional information, which is generally not true of verbal or
alphanumeric alerts. Will a pilot who has not had experience with airborne wind shear
sensors significantly alter his avoidance strategy when presented with graphical alerts?
2
In this report, the term "alert" is used in general to indicate any microburst information
which is presented to the flight crew for decision-making purposes. During the experiment, no
pre-defined procedure for handling the information was prescribed to the pilots. This was done in
order (1) to observe the pilots' perception of the situation severity as presented, and (2) to obtain
the pilots' reactions and comments as an aid to design of proper procedures for graphical
microburst alerting. It is recognized that in an operational system that there would be a distinction
between microburst "alerting" information which would require mandatory flight crew action, and
information which is "advisory" in nature. The criterion for distinguishing alerts from advisory
information will be a function of microburst intensity, position, and possibly aircraft characteristics
or configuration, and is a topic of current research.
3. Experimental Design
3.1 Overview
The experiment involved active airline pilots flying a series of realistic descent and final
approach scenarios, under weather conditions conducive to wind shear, in a part-task "glass-
cockpit" transport-category aircraft simulator. The pilots flew similar situations with several
different display formats, in order to evaluate the issues listed above. After the flight segment of
the experiment, the pilots were asked to complete an exit questionnaire in order to obtain their
opinions of the different display options. Additional data was obtained from observations and
measurements made during the flight scenarios as well as from short debriefing sessions which
took place between the scenarios.
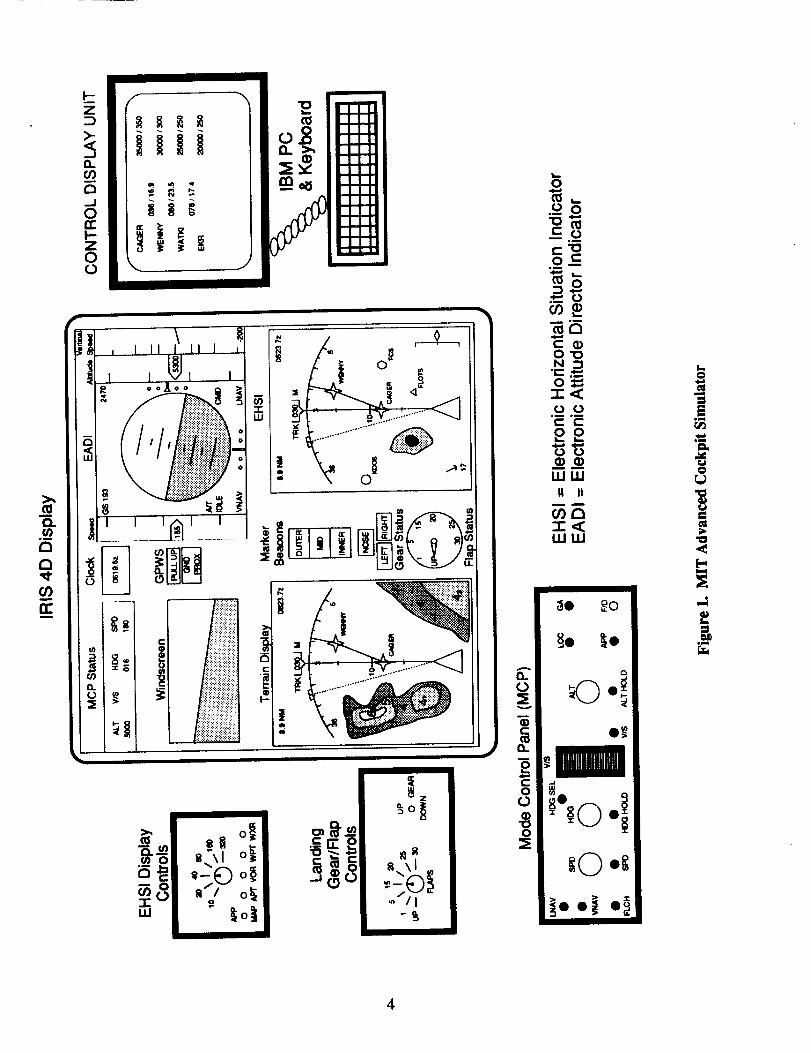
3.2 MIT Advanced Cockpit Simulator
To perform this experiment, a part-task simulation of a modern transport aircraft equipped
with an Electronic Flight Instrumentation System (EFIS) and a Flight Management Computer
(FMC) was developed (Figure 1). It is an improved version of the simulation used in the
presentation mode comparison experiment mentioned previously._.2 The primary instrumentation
is displayed on an IRIS 4D/25 color graphics workstation. The simulator includes a good fidelity
representation of the EFIS displays, including the EHS! and the Electronic Attitude Director
Indicator (EADI). Airspeed and altitude are displayed as moving tapes, and a vertical speed
indicator is also included. The EHSI display is controlled through an external control panel which
allows the pilot to change EHSI modes (MAP or ILS) and the display range, and to suppress
unwanted information.
3
m
m
r"rm
I,'-,-
_J0rrI-Z0
],,_ j I II I II I ,
'1' I I I I
"1
° /
°_
,_ 0
0--i._o
_q
c- •O_DN.r-
,i _V ' ._----_........._ ° °
__ ............_ 2.0.,,m (I,)_o _ _m
II II !
,_ o_
.....--(n _ IT OlI •_-_ _ .--. _;I ,_ _ i
__oo_ o_.
4
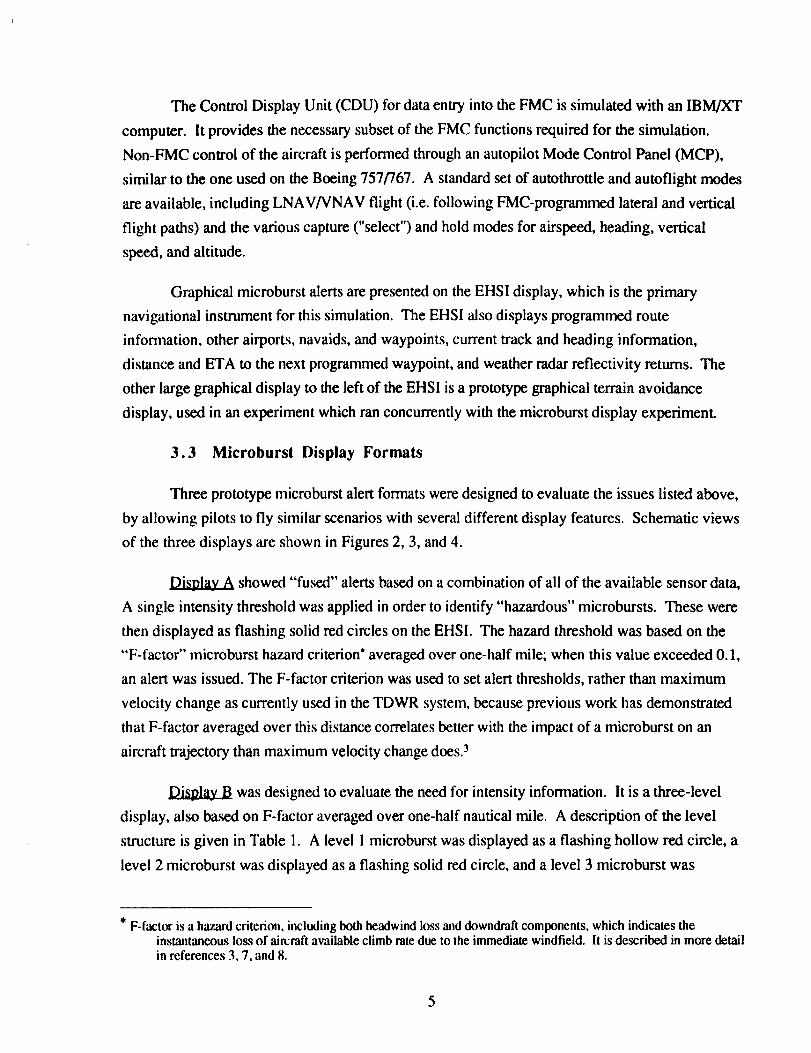
The Control Display Unit (CDU) for data entry into the FMC is simulated with an IBM/XT
computer. It provides the necessary subset of the FMC functions required for the simulation.
Non-FMC control of the aircraft is performed through an autopiiot Mode Control Panel (MCP),
similar to the one used on the Boeing 757/767. A standard set of autothrottle and autoflight modes
are available, including LNAV/VNAV flight (i.e. following FMC-programmed lateral and vertical
flight paths) and the various capture ("select") and hold modes for airspeed, heading, vertical
speed, and altitude.
Graphical microburst alerts are presented on the EHSI display, which is the primary
navigational instrument for this simulation. The EHSI 'also displays programmed route
information, other airports, navaids, and waypoints, current track and heading information,
distance and ETA to the next programmed waypoint, and weather radar reflectivity returns. The
other large graphical display to the left of the EHSI is a prototype graphical terrain avoidance
display, used in an experiment which ran concurrently with the microburst display experiment.
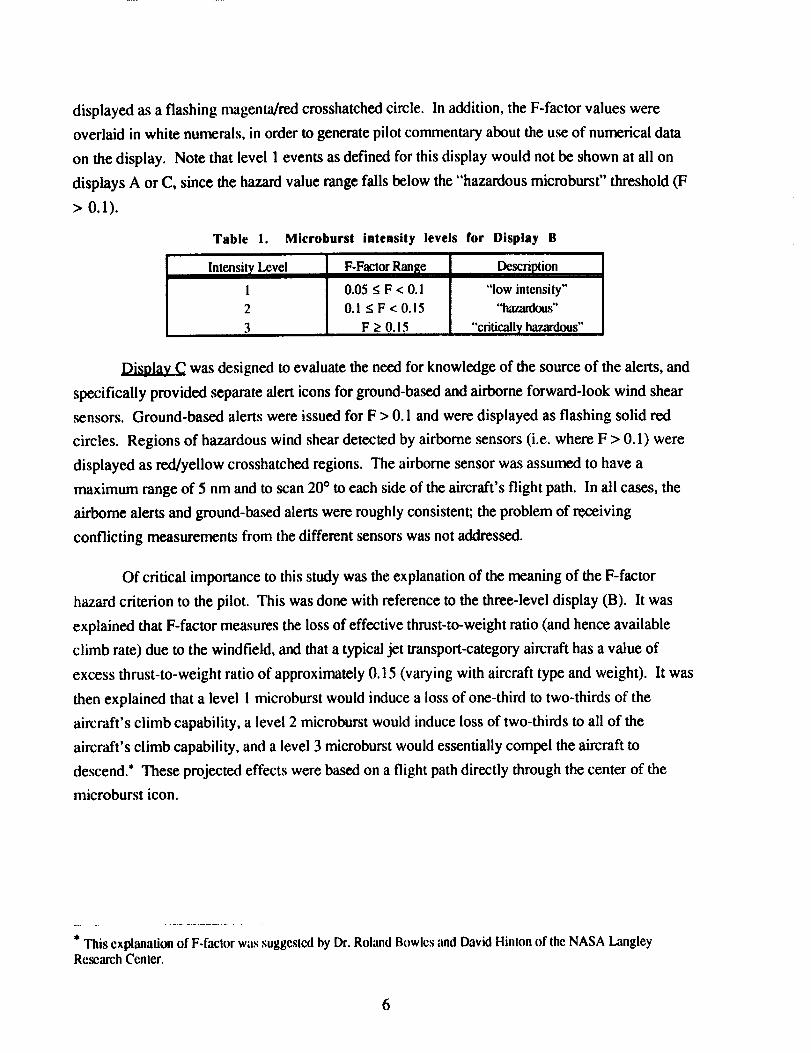
3.3 Microburst Display Formats
Three prototype microburst alert formats were designed to evaluate the issues listed above,
by allowing pilots to fly similar scenarios with several different display features. Schematic views
of the three displays are shown in Figures 2, 3, and 4.
Display A showed "fused" alerts based on a combination of all of the available sensor data,
A single intensity threshold was applied in order to identify "hazardous" microbursts. These were
then displayed as flashing solid red circles on the EHSI. The hazard threshold was based on the
"F-factor" microburst hazard criterion* averaged over one-half mile; when this value exceeded 0.1,
an alert was issued. The F-factor criterion was used to set alert thresholds, rather than maximum
velocity change as currently used in the TDWR system, because previous work has demonstrated
that F-factor averaged over this distance correlates better with the impact of a microburst on an
aircraft trajectory than maximum velocity change does)
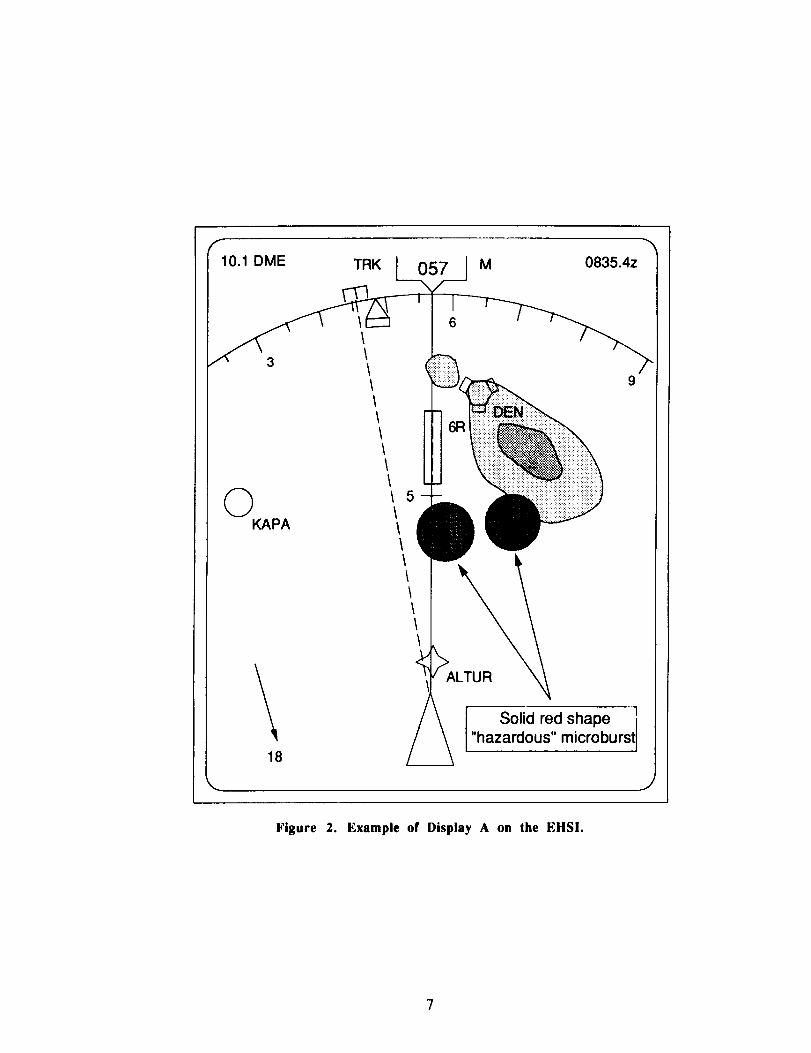
was designed to evaluate the need for intensity information. It is a three-level
display, also based on F-factor averaged over one-half nautical mile. A description of the level
structure is given in Table 1. A level 1 microburst was displayed as a flashing hollow red circle, a
level 2 microburst was displayed as a flashing solid red circle, and a level 3 microburst was
* F-factor is a hazard criterion, including both headwind loss and downdraft components, which indicates theinstantaneous loss of aircraft available climb rate due to the immediate windfield. It is described in more detailin references 3, 7, and 8.
5
displayed as a flashing magenta/red crosshatched circle. In addition, the F-factor values were
overlaid in white numerals, in order to generate pilot commentary about the use of numerical data
on the display. Note that level 1 events as defined for this display would not be shown at all on
displays A or C, since the ha_ value range falls below the "hazardous microburst" threshold (F
> 0.1).
Table 1. Mieroburst intensity levels for Display B
Intensity Level F-Factor Range
1 0.05 < F < 0.1
2 0.1 < F < 0.15
3 F> 0.15
Description
"low intensity"
"hazardous"
"critically haz,_dous"
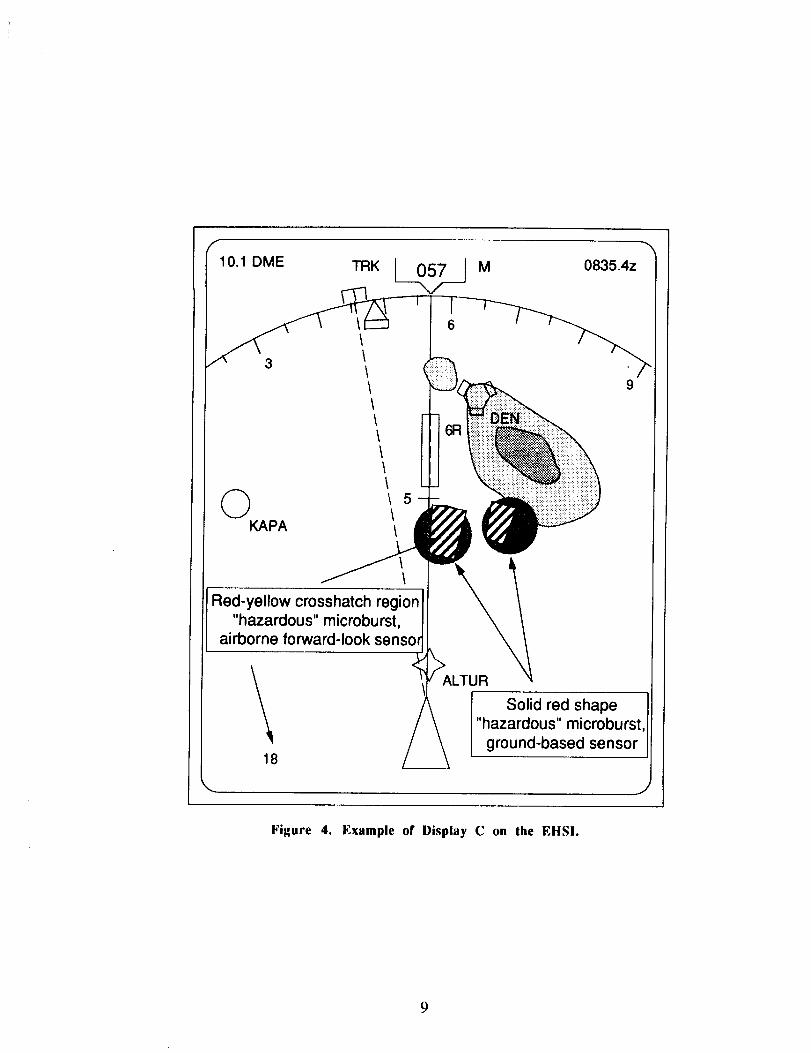
was designed to evaluate the need for knowledge of the source of the alerts, and
specifically provided separate alert icons for ground-based and airborne forward-look wind shear
sensors. Ground-based alerts were issued for F > 0.1 and were displayed as flashing solid red
circles. Regions of hazardous wind shear detected by airborne sensors (i.e. where F > 0.1) were
displayed as red/yellow crosshatched regions. The airborne sensor was assumed to have a
maximum range of 5 nm and to scan 20 ° to each side of the aircraft's flight path. In all cases, the
airborne alerts and ground-based alerts were roughly consistent; the problem of receiving
conflicting measurements from the different sensors was not addressed.
Of critical importance to this study was the explanation of the meaning of the F-factor
hazard criterion to the pilot. This was done with reference to the three-level display (B). It was
explained that F-factor measures the loss of effective thrust-to-weight ratio (and hence available
climb rate) due to the windfieid, and that a typical jet transport-category aircraft has a value of
excess thrust-to-weight ratio of approximately 0.15 (varying with aircraft type and weight). It was
then explained that a level 1 microburst would induce a loss of one-third to two-thirds of the
aircraft's climb capability, a level 2 microburst would induce loss of two-thirds to all of the
aircraft's climb capability, and a level 3 microburst would essentially compel the aircraft to
descend.* These projected effects were based on a flight path directly through the center of the
microburst icon.
* This explanaticm of F-factor was suggested by Dr. Roland Bowles and David Hinton of the NASA LangleyResearch Center.
6
©KAPA
18
\_5
\
\
' _>ALTUR 1_1 Solid red shape II "hazardous" microburst]
J
Figure 2. Example of Display A on the EHSI.
IO.1DME TRK I 057 I M 0835.4z"
_ 9
Hollow red shapeLevel 1 microburst
"low intensity"
18
\
Solid red shape [Level 2 microburst
"hazardous"
Red-magenta crosshatchLevel 3 microburst
"very hazardous"
ALTUR
J
Figure 3. Example of Display B on the EHSI.
10.1DME TRK _,,_ i M 0835.4z
\
9
Red-yellow crosshatch region
"hazardous" microburst,airborne forward-look sensor
18
<_ _>ALTU R
Solid red shape
"hazardous" microburst.
ground-based sensor
J
Figure 4. Example of Display C on the EHSI.
9
3.4 Scenario Design
A total of 12 approach scenarios were run with each pilot subject. These were chosen to
evaluate the reaction of the pilot under differing conditions to the three displays, both quantitatively
and qualitatively, and to stimulate commentary for the exit questionnaire. There were three
independent variables in the experimental matrix:
1. Microburst display format (A, B, or C)
2. Presence/Absence of heavy precipitation ("wet" or "dry" microburst conditions)
. Threatening situation (hazaa'dous microburst present on approach path) or non-threatening
situation (No hazardous microbursts within 1.5 nm of approach).
The precipitation (radar reflectivity) patterns for the "wet" and "dry" cases were chosen to
be loosely representative of "typical" microburst events as described in the literature. 4.5 In wet
cases, thunderstorms were present in close proximity to the airport, with microbursts occurring
either in the center or on the edge of high-reflectivity regions; in dry cases, only light precipitation
was present in the vicinity of the airport.
The "threatening" and "non-threatening" cases were chosen to stimulate commentary on the
operational use of the alerts. In the "threatening" case, hazardous microburst alerts (level 2 or 3)
appeared directly on the flight path, and in the "non-threatening" case hazardous microburst alerts
occurred at a lateral distance of 1.5 to 2 nm from the flight path. "Non-threatening" in this case
does not presuppose that the pilot should make the approach if a microburst is present 1.5 nm
laterally displaced from the flight path; it only indicates that, under the current TDWR alert
methodology, no alert would be issued. 6 In both cases, microburst icons began to appear when
the aircraft approached to within 12-15 nm of the airport, and grew from level 1 to level 2 or 3
events before the aircraft reached the outer marker.
The nominal test matrix is shown in Table 2. Note that the effect of high vs. low
precipitation was only tested using display A. Also, microbursts were present in only 8 of the 12
runs. In order to prevent anticipation, the microburst alert experiment was run in conjunction with
a graphical terrain avoidance display experiment, in the cases where no microburst was present,
terrain threats were present. The scenarios were carefully designed to prevent interference between
the two experiments, and appeared to be effective in reducing pilot anticipation of both terrain and
weather threats. The 12 scenarios were classified into three groups by display type, and the order
of presentation of the blocks was alternated between subjects to attenuate learning effects. In each
10
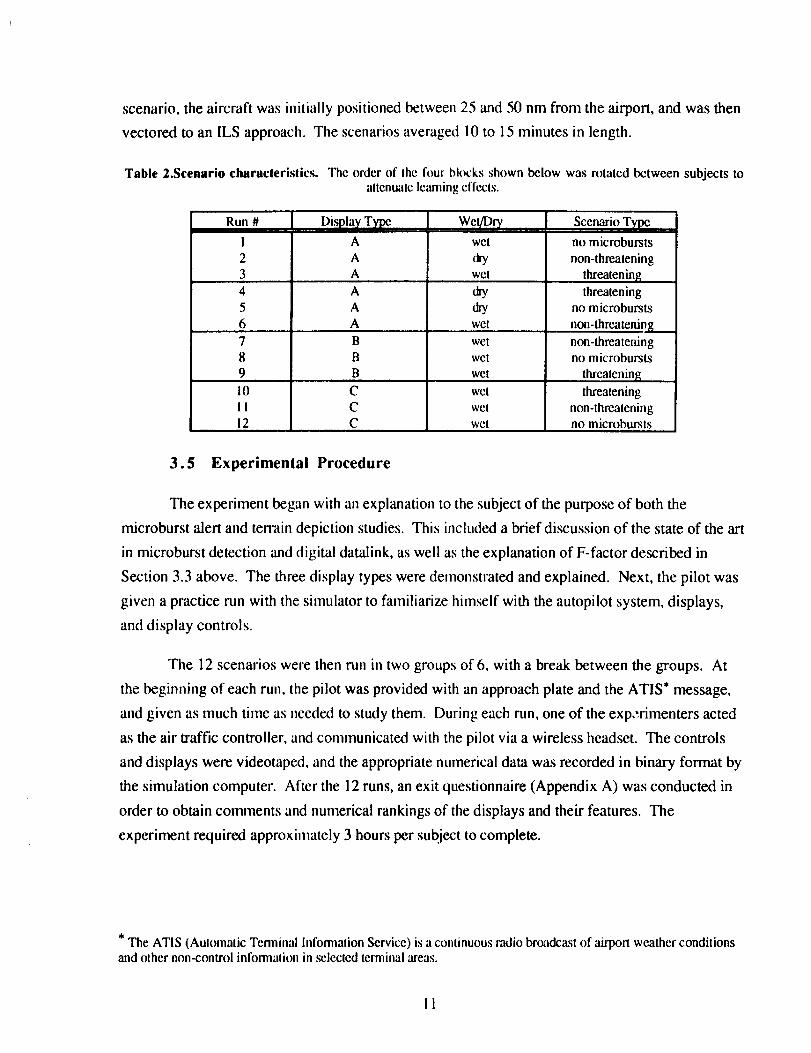
scenario, the aircraft was initially positioned between 25 and 50 nm from the airport, and was then
vectored to an ILS approach. The scenarios averaged 10 to 15 minutes in length.
Table 2.Scenario characteristics. The order of the four blocks shown below was rotated between subjects to
altenualc learning effects.
Run
1234
56
10Ii
12
Display Type
AAA
A
AA
C
CC
wet
drywet
wet
wetwet
wet
wet
wet
wet
Scenario T_e,no microbursts
non-threatening
threateningthreatening
no microbursts
non-threatening
non-threateningno microbursts
threatening
threatening
non-threateningno microbursts
3.5 Experimental Procedure
The experiment began with an explanation to the subject of the purpose of both the
microburst alert and terrain depiction studies. This included a brief discussion of the state of the art
in microburst detection and digital datalink, as well as the explanation of F-factor described in
Section 3.3 above. The three display types were demonstrated and explained. Next, the pilot was
given a practice run with the simulator to familiarize himself with the autopilot system, displays,
and display controls.
The 12 scenarios were then run in two groups of 6, with a break between the groups. At
the beginning of each run, the pilot was provided with an approach plate and the ATIS* message,
and given as much time as needed to study them. During each run, one of the exp,;rimenters acted
as the air traffic controller, and communicated with the pilot via a wireless headset. The controls
and displays were videotaped, and the appropriate numerical data was recorded in binary format by
the simulation computer. After the 12 runs, an exit questionnaire (Appendix A) was conducted in
order to obtain comments and numerical rankings of the displays and their features. The
experiment required approximately 3 hours per subject to complete.
* The ATIS (Aulomalic Termin',d hfformation Service) is a conlinuous r',ediobroadcast of airport weather conditionsand other non-control informalion in .selected terminal areas.
!1
3.6 Subject Selection
All of the subjects for this experiment were active line pilots currently flying "glass-
cockpit" aircraft (Boeing 757-767, MD-88). Nine subjects participated, and all were males
between the ages of 36 and 51. Three of the pilots were captains, and six were first officers.
subjects averaged 5890 hours of total flight experience, and averaged 1130 hours of flight
experience on EFIS/FMC-equipped aircraft.
4. Results and Discussion
The
4.1 Visual Clarity of Alerts on EHS!
The easiest issue to address was the visual clarity of the alerts when displayed on the
EHSI. In the exit questionnaire, the pilots were asked to rate the three displays individually for
visual clarity on a scale from 1 ("very difficult to read") to 4 ("very easy to read"). The results
were almost identical for all three displays; all were rated easy or very easy to read, with average
ratings between 3.5 and 4. In the final approach situation, the pilots almost always set the EHSI to
the minimum range (5 nm) with airports, navaids, and off-route waypoints suppressed, so the
microburst alerts were by far the most prominent features on the display.
4.2 Overall Display Ratings
The numerical preference rankings from the survey give the best idea of the general
acceptability of the three display formats. In this question, the subjects were asked to rank the
three displays (A, B, and C) by order of preference from 1 (most preferable) to 3 (least preferable).
The three level display (B) was ranked highest on average, followed by the discrete display (C)
second, and display A last (Table 3). Although several of the pilots remarked on the need for
simple and easy to comprehend displays, display A was never ranked the best. This may indicate
that it does not contain enough information. Several pilots contended that they would like to see a
display with both multiple intensity levels and information separated by source, although no
suggestions about how this would be implemented were offered.
Table 3. Pilot preference rankings for the three display types. A ranking of 1 indicated mostpreferable, 3 indicated least preferable.
Display
A
B
C
Number of Times IIRanked First
0
5
4
Average
Ranking
2.67
1.56
1.78
12
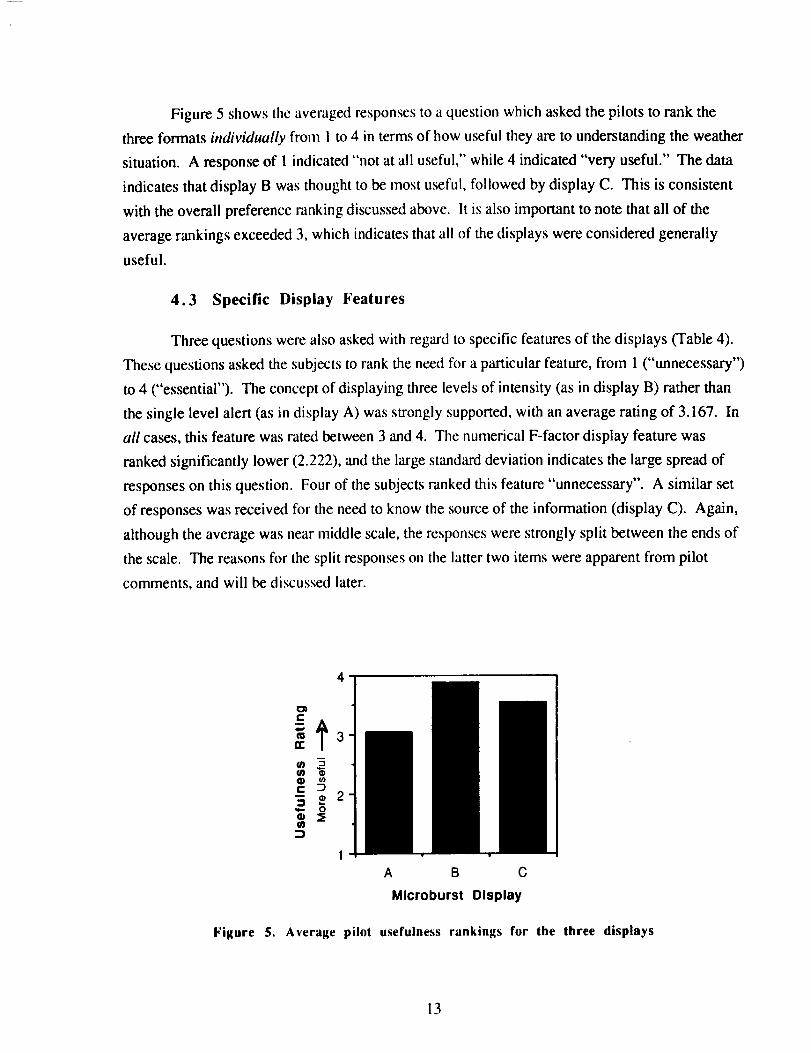
Figure5 showstheaveragedresponsesto aquestionwhichaskedthepilotsto rank thethreeformatsindividually from 1 to 4 in terms of how useful they are to understanding the weather
situation. A response of 1 indicated "not at all useful," while 4 indicated "very useful." The data
indicates that display B was thought to be most useful, followed by display C. This is consistent
with the overall preference ranking discussed above. It is also important to note that all of the
average rankings exceeded 3, which indicates that all of the displays were considered generally
useful.
4.3 Specific Display Features
Three questions were also asked with regard to specific features of the displays (Table 4).
These questions asked the subjects to rank the need for a particular feature, from 1 ("unnecessary")
to 4 ("essential"). The concept of displaying three levels of intensity (as in display B) rather than
the single level alert (as in display A) was strongly supported, with an average rating of 3.167. In
all cases, this feature was rated between 3 and 4. The numerical F-factor display feature was
ranked significantly lower (2.222), and the large standard deviation indicates the large spread of
responses on this question. Four of the subjects ranked this feature "unnecessary". A similar set
of responses was received for the need to know the source of the information (display C). Again,
although the average was near middle scale, the responses were strongly split between the ends of
the scale. The reasons for the split responses on the latter two items were apparent from pilot
comments, and will be discussed later.
Figure 5.
rr
e-
to
Average pilot
A B C
Microburst Display
usefulness rankings for the three displays
13

Table 4. Subject rating of particular display features by need. The response scale used ran from 1(unnecessary) to 4 (essential).
Displa}, feature
3-level intensity information (Display B)
Numerical F-factor information (Display B)
Different sensors displayed separately (Display C)
Mean need mlin_
3.167
2.222
2.444
Standard deviation
0.353
1.202
1.210
All of the 'aforementioned data seem to indicate a preference for multiple levels of intensity.
Pilot comments yielded some reasons for this. Several pilots remarked that having multiple
intensity levels was important to their decision-making, since it implicitly provided some intensity
trend information. With respect to this point, it should be noted that all of the scenarios did have
microbursts which increased in intensity as the approach was made; that, however, is not an
unrealistic situation. Another interesting observation was that the strength of the microbursts
influenced how closely the pilot would approach the microburst. For example, a level 3
microburst located a given distance to one side of the approach track appears to be considered an
equivalent threat (for decision-making purposes) to a level 2 microburst located closer to the
approach track. The reasons for this were not clear from pilot comments; such a perception might
be due to either lack of confidence in the position accuracy of the sensing system, or to the
possibility that a microburst may move closer to the flight path. One of the subjects also stated that
having multiple intensity levels made the alerts more compelling, and induced closer study of the
situation (as compared to a single-level format).
There was no consensus on the use of numerical F-factor values, however. One pilot
indicated that the numbers would be distracting, and that he didn't want to take the time to decipher
that information; color-coded information is much easier to interpret. Another said that more levels
might be desirable, but that the F-factor numbers required too much thought; perhaps a scale from
1 to 10 might be better. As stated above, a total of 4 subjects rated the F-factor numbers as
unnecessary. However, several did rate them highly in terms of need, and one pilot actually
preferred the numbers to the three-level intensity arrangement (due to the finer intensity resolution
available). In general, the performance implication of the F-factor numbers was understood, and
was found to be a good justification for the thresholds used in the alerting schemes, but no
consensus was reached as to their usefulness in real-time situations.
The responses with regard to the "discrete" alert format used in Display C were also
polarized. Several pilots reacted positively to the separated alerts due to the "reinforcing" aspect;
they found it useful to know when the airborne sensor confirmed the ground-based report. In at
least one ca_, the pilot stated that he would not need verbal confirmation of the alert from the
14

tower if he saw that the airborne and ground-based sensors were reporting approximately the same
information. This was borne out by his actions when flying the simulator. However, in the
scenarios the ground-based and airborne sensor alerts were always reinforcing; in reality, this
would not always be the case, and the effect of receiving contradictory alerts needs to be examined.
Some of the other pilots indicated that dual information was not necessary, since if any sensor
reported a microburst on or near the flight path, there would be no question of complying with the
alezt. Given this fact, they found knowledge of the alert source to be irrelevant. One pilot stated
"if I saw one or the other alone, I would still have to assume that it was one hundred percent
accurate."
4.4 Procedural Implications of Graphical Alerts
In the cases where a hazardous microburst was present directly on the approach track, it is
interesting to examine the point in time where the pilot stopped monitoring the developing
microburst situation and initiated a missed approach. The remaining distance between the aircraft
and the nearest microburst icon on the approach track (Figure 6) was defined as the "decision
distance". This distance was tabulated for all applicable cases (36 total runs), and had a mean
value of 4.26 nm with a relatively low standard deviation of 1.15 nm. This result is potentially
5
i1__ Runway Threshold
Hazardous Microburst Icons
Aircraft Symbol
Figure 6. Definition of decision distance. The distance marked "d" (from the aircraft symbol to thenearest microburst icon on the approach track) at the time of go-around is referred to as "decision distance".
15
usefulfor helpingdefinecrewresponseproceduresfor thesealerts. It alsoemphasizesthe
importance of having a reliable ground-based detection and uplink capability, since most of the
pilots made their decision at roughly the design limit range of some of the airborne sensors
currently under development. 7 It should be noted that, in this experiment, microbursts which
occurred directly on the approach track were always located between 1 and 3 nautical miles from
the runway threshold.
Several other implications of using graphical alerts were identified from experimental
observations. One of these was the fact that the pilots typically asked for a turn when requesting a
missed approach. In some cases, the pilot informed the tower well in advance (sometimes before
the aircraft had reached the outer marker) which direction he would like to turn in the case of a
missed approach. Several subjects indicated that positional information (which allowed this kind
of missed approach planning) was the best feature of a graphical presentation.
The other side of this issue was that in none of the cases did the pilots seem to consider a
straight-ahead missed approach as an option. In one case, a pilot requested a turn to avoid a
microburst which took the aircraft directly through a high reflectivity thunderstorm core indicated
by the weather radar. A straight ahead missed approach, since the aircraft was still several miles
from the microburst, would have resulted in passage through the microburst region (where there
was little precipitation indicated) at approximately 20(10 feet AGL with a positive climb rate well
established, The hazard involved in the straight ahead missed approach in this case was low, and
probably less than that involved in making the turn into the storm. Another pilot commented that,
if the controller insisted on a straight 'ahead missed approach which took the aircraft through the
microburst alert, he (the pilot) would exercise his authority to make an emergency deviation.
Behavior of this type could significantly impact airport operations. These events underline the
need for training and for definition of a recommended set of procedures, since studies show that
turns to avoid microbursts are not required given early initiation of a go-around. 8
A connected issue relates to display of low intensity or less hazardous microburst alerts.
Although none of the scenarios were explicitly designed to test this issue, it was apparent from
several of the pilots' comments and actions that having a graphical alert of any magnitude on or
very near the approach was grounds for a go-around. Some comments suggested that this was due
to two possible reasons: 1) microbursts were observed to change in intensity fairly quickly, and 2)
if anythbzg is reported on the flight path, and the aircraft experiences any turbulence or wind shear
or whatever, then the pilot may appear negligent for proceeding with the approach with an alert
present. In view of this latter possibility, it is possible that any graphical alert no matter how low
in intensity which is located on the approach or departure track will induce the pilot to abort, if not
16
for safetythanfor legalreasons.In anycase,it isapparentthatthe lowestalertthresholdmustbe
verycarefullysetin orderto balancesafetyvs.operationalefficiency,andthatthereis aneedforestablishedguidelinesfor reactionto forward-lookairborneor uplinkedground-basedwind shearalerts. It must"also be considered that such behavior may have been an artifact of the simulation
environment. This high level of caution is in sharp contrast to the verbal alerts issued during recent
TDWR operational evaluations; low intensity "wind-shear-with-loss" alerts do not require that a
missed approach be made, and pilots have been observed to continue approaches during
microburst alerts of fairly high intensity. 9._°
Since some of the scenarios forced the pilots to make a decision about microbursts which
occurred 1.5 to 2 nm from the approach, it was possible to ask the question "how close can a
hazardous microburst icon come to the approach path before you will decide not to make the
approach?" The answers varied widely; six of the subjects were able to give a quantitative distance
(based on a "'hazardous" microburst alert as shown in display A). These ranged from 2 nm up to
15 nm, with a mean of about 5 nm; four of the six who answered this question gave distances of 2
and 3 nm. In contrast, the current TDWR alerting methodology only gives an alert if some part of
the microburst shape comes within one-half nm of the approach, and even with this criterion
"nuisance alerts" occur, t._ This seems to imply that the positional information contained in the
graphical alert could have a strong positive effect on pilot confidence in the alerting system. If the
pilot makes an approach when a microburst alert is given 1 or 2 nm from the approach path, and
experiences no wind shear, the graphical alert allows him to see that he has not actually penetrated
the center of the microburst region. Under the current verbal alerting system, the pilot treats such a
situation as a false alarm and may lose confidence in the alerting system; he or she has no way of
knowing that the microburst does exist, but is displaced to one side of the approach.
One of the issues explicitly tested was the sensitivity of pilot decision-making to varying
precipitation levels. No significant differences in pilot response were observed between "wet" and
"dry" microburst situations. In one case, when microbursts appeared under very light rain
conditions, a pilot commented that "that shouldn't be there," but in no cases did a pilot simply
ignore an alert because of light precipitation. In reality, when "dry" microbursts are present, other
visual clues (virga, dust rings, etc.) would likely be present which could not be simulated with the
existing simulator facility. Several pilots did remark that they were more aware of and concerned
about the wind shear threat under thunderstorm conditions.
17
5. Conclusions
5.1 Display Format Issues
Several useful results were obtained with respect to the display format issues listed in
Section 2. Overwhelmingly, the pilots found presentation of microburst alerts on the EHSI to be
clear and effective. Also, use of multiple intensity levels was strongly supported, and several
different reasons were given in pilot comments. These were: (1) a multiple-level presentation is
more visually compelling than a single-level one, (2) simple intensity trend information is present
in the multi-level presentation, and (3) "more caution" can be taken (i.e. maintain a larger distance
from the event) when very intense microbursts are detected. It was apparent from experimental
observations that the individual pilots had different ways of making decisions about the wind shear
threats presented to them, and that the multi-level display seemed to allow them to more easily and
confidently make those decisions. Based on these results, it is recommended that alerts should
contain multiple intensity levels coded by icon colors or patterns rather than numbers.
Use of F-factor as an ',den level threshold seems to work well. It relates closely to aircraft
performance, and is thus a good indicator of the aviation hazard posed by a microburst; it was also
easy to explain to the pilots in terms of loss in available climb performance. Determination of the
actual values to be used for the alert thresholds requires further study.
The issue of whether to present "fused" or "di_rete" microburst information was not
completely resolved. Some pilots felt that there was absolutely no need to know where the alert
comes from, because it would not change their actions to know how the microburst was detected.
Others found it useful to know when the airborne sensor confirmed the ground-based report, and
in one case the pilot indicated that he would not need verbal confirmation of the alert from the
tower if both sensors were reporting the same information. In no cases did it .seem critical to the
pilot's decision making process to know where the alert was coming from, since it was assumed
that all of the alerts issued were accurate. This would likely be assumed in practice as well, since
microbursts can pose a strong threat. Thus, the improved accuracy available through data fusion
must be weighed against the 'added confidence gained by the pilot when he is aware of reinforcing
data from different sensors. This issue requires further consideration.
The effect of precipitation (radar reflectivity) on the believability of the microburst alerts
was found in this experiment to be negligible. The pilots in all cases gave the microburst alerts
100% credence regardless of the intensity or proximity of the precipitation present. In an actual
18
flight situation,thismaybedifferentbecauseof thepresenceof extemalvisualcues,particularlyin"dry" microburstconditions.
5.2 Procedural Implications of Graphical Alerting
Several procedural implications of displaying graphical alerts were
The positional information inherent in the graphical alert was well received
almost all cases 'allowed them to plan and request a missed approach which
observed in this study.
by the pilots, and in
took them clear of the
event. Also, it was observed that the subjects made the decision to execute a missed approach
when the aircraft was an average of 4.26 nm from the microburst. Another interesting observation
was that the pilots were generally not willing to execute the approach when microburst icons were
present within several miles of the approach track. This is inconsistent with the current TDWR
alert methodology, in which microbursts which lie greater than one-half nm from the approach do
not trigger any alerts. However, it is likely that knowledge of the location of the microburst would
have a beneficial effect on pilot confidence in the alerting system. During recent TDWR
evaluations, situations often occurred in which an alert was issued, but the aircraft did not actually
encounter the microburst due to lateral displacement of the microburst from the flight path. The
positional information contained in the graphical format would clarify this situation, and prevent
the pilot from perceiving the alert as a false alarm.
5.3 Flight Crew Training Issues
Implementation of this system will require some pilot training in microburst meteorology,
the impact of microbursts on aircraft performance, and the specific meaning of the alert structure
which will be used. Several events which occurred during the experiment indicated that such
training is required. For example, in none of the cases did the pilots seem to consider a straight-
ahead missed approach as an option, even when the decision to abort the approach was made 5 to
10 nm from the microburst location. In one case, the pilot indicated that he would make an
emergency deviation if the controller insisted on a straight-ahead missed approach. It needs to be
emphasized that microbursts pose a danger primarily at low "altitudes to slow-moving aircraft, and
that a straight-ahead missed approach is acceptable if initiated early enough.
A related issue was raised by the lateral separation question, where the pilots were asked
how close a microburst icon could be laterally to the approach path such that they would still make
the approach (see Section 4.4). Responses of 2-3 nm are understandable, since the accuracy of the
alert is to some degree unknown, and the possibility exists that other microbursts will appear in the
same regions. Responses of 10 nm or 15 nm were also received; these most likely indicate that the
19
pilot is unaware of the localized nature of microbursts. It should be again noted that the current
TDWR alert methodology does not alert unless the microburst icon is within one-half nm of the
approach path, and that the TDWR procedure has been criticized for alerting too often. For
graphical alerts to be useful, lateral separation guidelines need to be established and included in
flight crew training.
Acknowledgements
This work would not have been possible without the aid of many others. We would
especially like to thank Gary Donovan of Delta Airlines and the Air Line Pilots' Association
(ALPA), all of the helpful people at the Delta Master Executive Council of ALPA, and the pilots
who volunteered their time to participate in these experiments. We would also like to thank Steven
Campbell of MIT Lincoln Laboratory and David Hinton of the National Aeronautics and Space
Administration (NASA), Langley Research Center, for their input, advice, and support. This
work was supported by the MIT Lincoln Laboratory and the Flight Management Division of the
NASA Langley Research Center under Air Force Contract No. F19628-90-C-0002.
20
References
. Wanke, C., and Hansman, R. J., "Hazard Evaluation and Operational Cockpit Display ofHazardous Windshear Information," AIAA Paper 90-0566, 28th Aerospace SciencesMeeting, Reno, NV, USA, January 8-11, 1990.
. Wanke, C., Chandra, D., Hansman, R. J., and Bussolari, S. R., "A Comparison of Voiceand Dat',dink for ATC Amendments and Hazardous Wind Shear Alerts," 4th InternationalSymposium on Aviation and Space Safety, Toulouse, France, 20-22 November 1990.
, Wanke, C., and Hansman, R. J., "Alert Generation and Cockpit Presentation for anIntegrated Microburst Alerting System," AIAA Paper 91-0260, 29th Aerospace SciencesMeeting, Reno, NV, USA, January 7-10, 1991.
. Wolfson, M. M., "Characteristics of Microbursts in the Continental United States," The
Lincoln Laboratory Journal, Vol. 1, No. 1, pp 49-74, 1988.
. Fujita, T. T., The Downburst: Microburst and Macroburst, The University of Chicago,1985.
° National Center for Atmospheric Research, "Terminal Doppler Weather Radar (TDWR): ABriefing Paper," July 1, 1988.
, Bowles, R. L., "Reducing Windshear Risk Through Airborne Systems Technology," 17thCongress of the International Council of the Aeronautical Sciences, Stockholm, Sweden,September 9-14, 199(].
. Hinton, D. A., "Forward-Look Wind-Shear Detection for Microburst Recovery," Journal ofAircraft, Vol. 29, No. 1, Jan.-Feb. 1992.
. Stevenson, Lloyd, Summary and Findings f'rom the PIREP-Based Analyses ConductedDuring the 1988 to 1990 Evaluations of TDWR-Based attd TDWR/LLWAS-Based AlertSela,ices Provided to Lamling/Departing Pilots, DOT/FAA Fin',d Report DOT-VNTSC-FAA-91-15, December 1991.
10. McCarthy, John, and Sand, Wayne, "Controller and Pilot Decision Making in Transmittingand Receiving Microburst Wind Shear Alerts from an Advanced Terminal Wind Shear
Detection System," Preprints, ICAO Human Factors Seminar, Leningrad, U.S.S.R., April3-7, 1990.
21
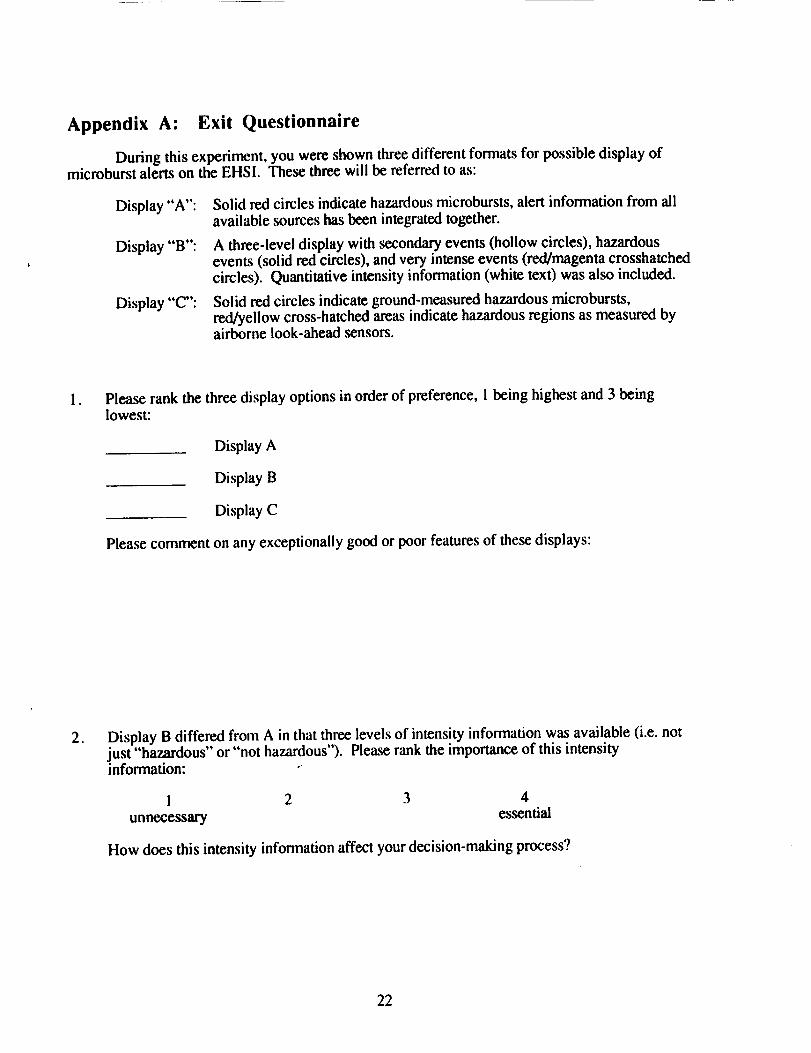
Appendix A: Exit Questionnaire
During this experiment, you were shown three different formats for possible display ofmicroburst alerts on the EHSI. These three will be referred to as:
Display "A":
Display "B":
Display "C":
Solid red circles indicate hazardous microbursts, alert information from all
available sources has been integrated together.
A three-level display with secondary events (hollow circles), hazardousevents (solid red circles), and very intense events (red/magenta crosshatchedcircles). Quantitative intensity information (white tex0 was also included.
Solid red circles indicate ground-measured hazardous microbursts,
red/yellow cross-hatched areas indicate hazardous regions as measured byairborne look-ahead sensors.
° Please rank the three display options in order of preference, 1 being highest and 3 being
lowest:
Display A
Display B
Display C
Please comment on any exceptionally good or poor features of these displays:
. Display B differed fi'om A in that three levels of intensity information was available (i.e. notjust "hazardous" or "'not hazardous"). Please rank the importance of this intensityinformation: "_
1 2 3 4
unnecessary essential
How does this intensity information affect your decision-making process?
22
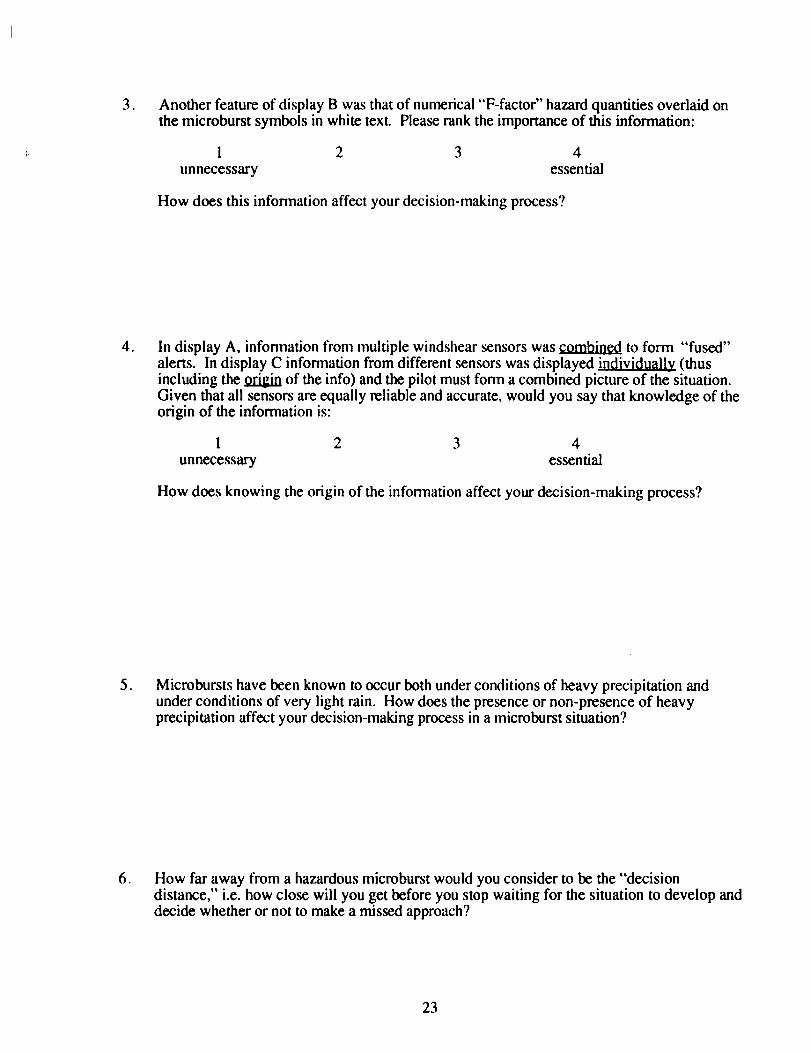
. Another feature of display B was that of numerical "F-factor" hazard quantifies overlaid onthe microburst symbols in white text. Please rank the importance of this information:
1 2 3 4
unnecessary essential
How does this information affect your decision-making process?
. In display A, information from multiple windshear sensors was combined to form "fused"
alerts. In display C information from different sensors was displayed individually (thusincluding the _ of the info) and the pilot must form a combined picture of the situation.Given that all sensors are equally reliable and accurate, would you say that knowledge of theorigin of the information is:
1 2 3 4
unnecessary essential
How does knowing the origin of the information affect your decision-making process?
. Microbursts have been known to occur both under conditions of heavy precipitation andunder conditions of very light rain. How does the presence or non-presence of heavyprecipitation affect your decision-making process in a microburst situation?
. How far away from a hazardous microburst would you consider to be the "decisiondistance," i.e. how close will you get before you stop waiting for the situation to develop and
decide whether or not to make a missed approach?
23
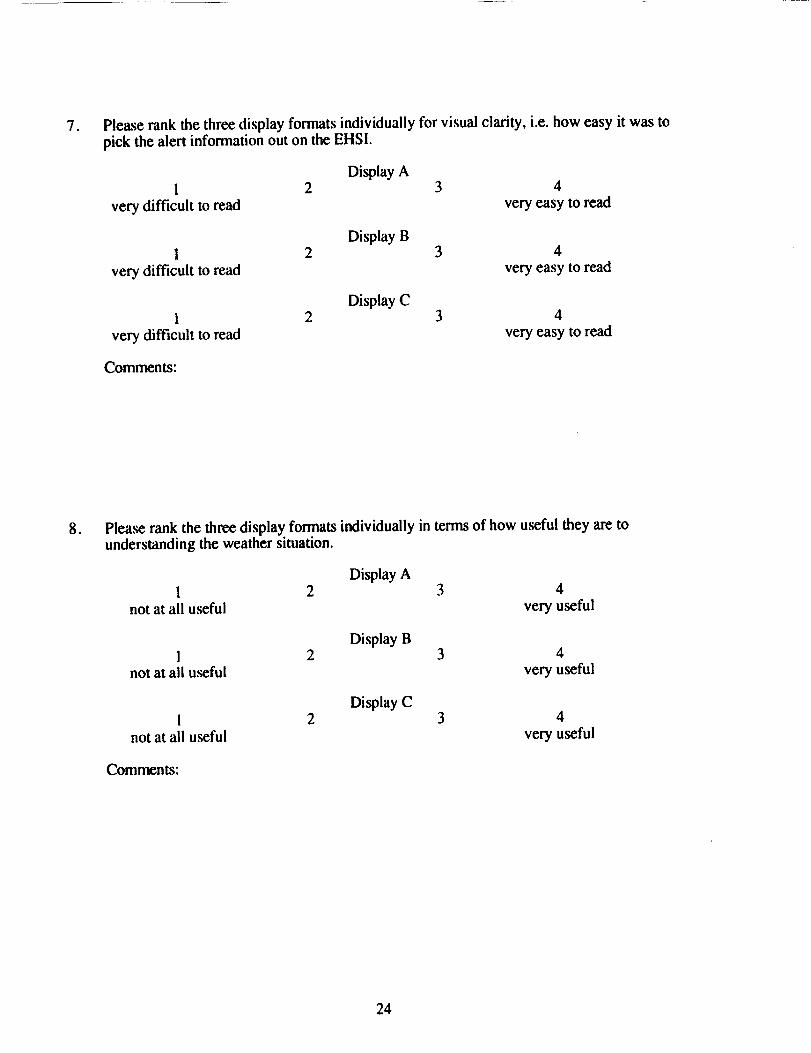
o Please rank the three display formats individually for visual clarity, i.e. how easy it was topick the alert information out on the EHSI.
Display A1 2 3 4
very difficult to read very easy to read
Display B1 2 3 4
very difficult to read very easy to read
Display C1 2 3 4
very difficult to read very easy to read
Comments:
go Please rank the three display formats individually in terms of how useful they are tounderstanding the weather situation.
Display A1 2 3 4
not at all useful very useful
Display B1 2 3 4
not at all useful very useful
Display C1 2 3 4
not at all useful very useful
Comments:
24

REPORT DOCUMENTATION PAGE I Fon,A_oro,_dOMB No. 0704-0188I
rec_Ir_ _ tot mJ; cx_cUon ol _lom_fk_ is mtlma_ _or.'etage ! I_ur per respond. _ t_ m_e for rev_v_ _mc_4. semc_g exs_i _gathenn0 and m=_m*clng1he0a=aneeded.=nd coml_l and r_W.V_ngChemllectk_ o_tnlom_lk_. S4mdoomm_R rel_rd_ thisbuYeR utlmme or amyocher_ _oole_li_t el Icdamw_l, btd_ lugoNtkm4 lot rlKlU¢_ tNI t)urdqm, to WiIN_ I'_ual1_ _ _ _ _ _ _ _. 1215 J_ _
H_.SUlmI_O4,1_.VA 22202"430_,andlol_,,Offloe of M,iM0emema_lguclg_, Paoe_v_Red_mKkmPro_(070,I.O1il_. W_._ 20503.I. AGENCY USE ONLY (Leavebiank) 2. REPORT DATE 3. REPORT TYPE AND DATES COVERED
June 1992 Contractor Report4. TITLE AND SUBTITLE .5. FUNDING NUMBERS
Experimental Evaluation of Candidate Graphical Microburst WU 505-64-12-01Alert Displays L-91172C
6 AU_OR(S)
Craig R. Wanke and R. John Hansman
7. PERFORM'NOOROAN_J_TK)NNAME(S)ANOADORi:.SS(ES)Aeronautical Systems Laboratory
Department of Aeronautics and AstronauticsMassachusetts Institute of TechnologyCambridge, Massachusetts
=. _po.som.o, uo.i_romNoAGS.CYN_UEiS)ANOAOORE_(ES)
National Aeronautics and Space Administration
Langley Research CenterHampton, VA 23665-5225
.. SUPPLEMEmARY.OTSS I.A.A. Interim Annual Report
8. PERFORMING ORGANIZATION
REPORT NUMBER
ASL-91-2
10. SFON_ORINGI MONITORING
AGENCY REPORT NUMBER
NASA CR-189633
Langley Technical Monitor: David A. HintonFtmded via NASA Langley Purchase Order L-91172C under U.S. Air Force Contract No. F19628-90-C-0002.
_.. &STmBU_, &VAI'*.I,_ STATEME_ ,_ =STR'eUT_.COO_
Unclassified-- Unlimited
Subject Category 06
13. ABSTRACT (M_xlmu_ 200 womb;)
A piloted flight simulator experiment has been conducted to evaluate issues related to the
display of microburst alerts on electronic cockpit instrumentation. Issues addressed includedisplay clarity, usefulness of multi-level microburst intensity information, and whetherinformation from multiple sensors should be presented separately or "fused" into combined
alerts. Nine active airline pilots of "glass-cockpit" aircraft participated in the study.
Microburst alerts presented on a moving map of display were found to be visually clear anduseful to pilots. Also, multi-level intensity information coded by colors or patterns was foundto be important for decision-making purposes. Pilot opinion was mixed on whether to "fuse"data from multiple sensors, and some resulting design tradeoffs have been identified. The
positional information included in the graphical alert presentation was found useful by thepilots for planning lateral missed approach maneuvers, but may result in deviations whichcould interfere with normal airport operations. A number of flight crew training issues werealso identified.
14. _IJBJECT TERMS .... l liE NUMBER OF PA_
Microburst; Wind Shear; Cockpit Displays; Graphical Weather; Piloted 28Simulation
_7.==cunn'vCL_=FCAT_ 111. SECUIIrrY CI.ASSW_.ATION
OF REPORT OF THIS PAGE
Unclassified Unclassified
NSN 7540-01-280-5500
_11.sECuRITYct,._s_¢_'noNOF ABSTRACT
11. PRICE CODE
A03
Prmcdm_ tW/UCSI$=L2g_-102


