
Quest for World-Class Traffic Signals
Mark Taylor Traffic Signal Operations Engineer
Utah Department of Transportation
Northern California Section – ITE June 15, 2016
Agenda
• About UDOT & UDOT Traffic Operations Center
• Innovative ideas
• Reflectorized backplates
• Custom controller logic
• Generator plug transfer switch; Key switch for crossing guards
• Vehicle Detection – UDOT’s use of Wavetronix radar
• Automated Traffic Signal Performance Metrics (SPMs)
• How they work, how to get them, case studies
• Impacts on operations in Utah
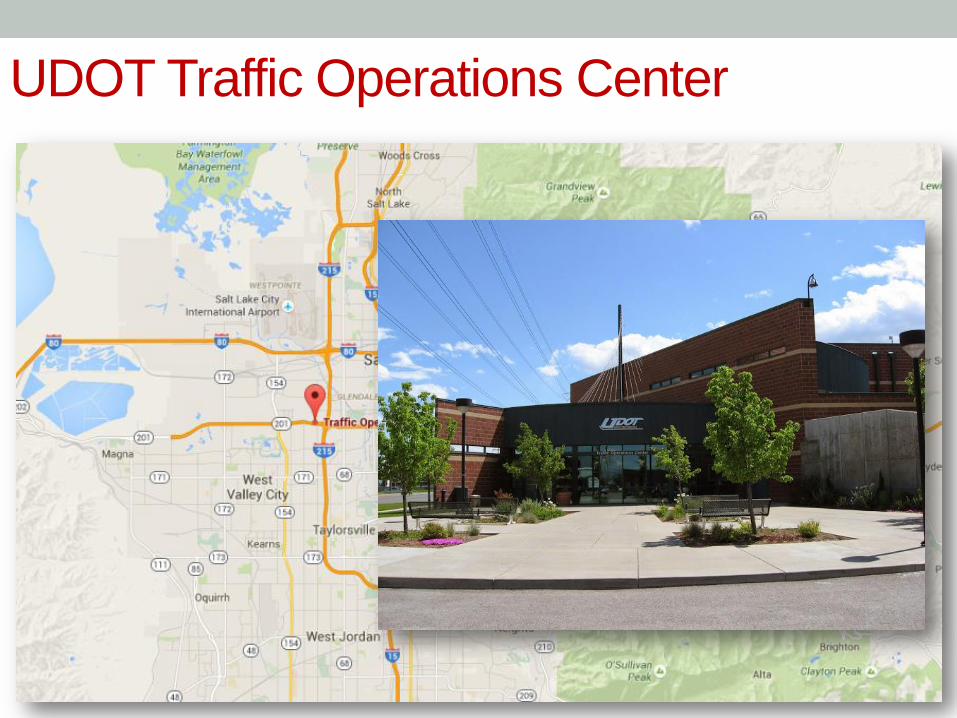
UDOT Traffic Operations Center
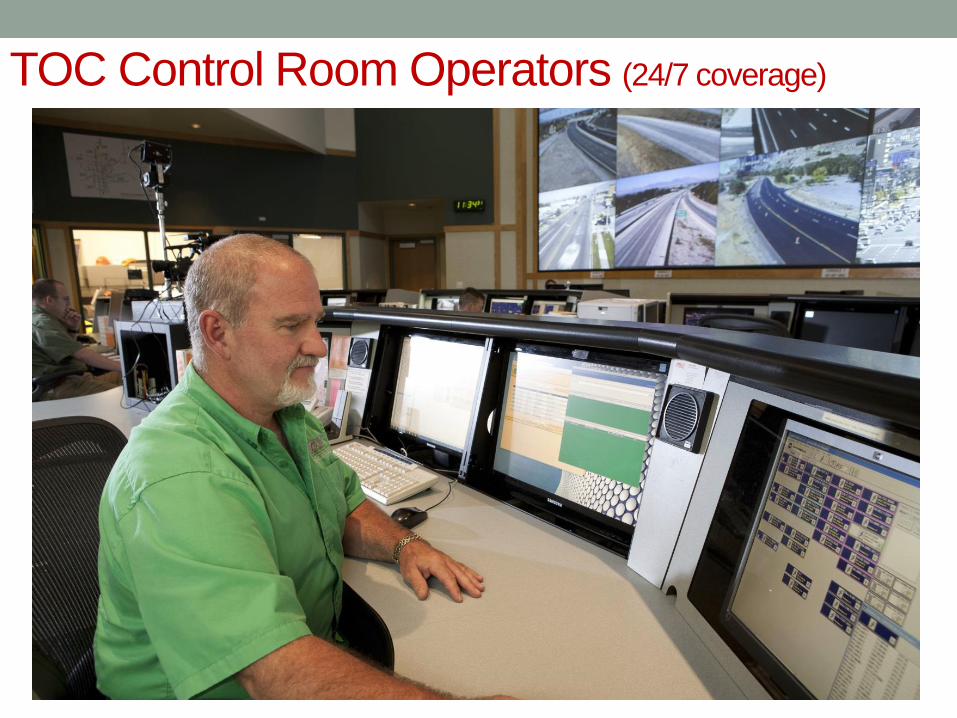
TOC Control Room Operators (24/7 coverage)
4

Variable Message Signs (96 Freeway, 49 surface street)
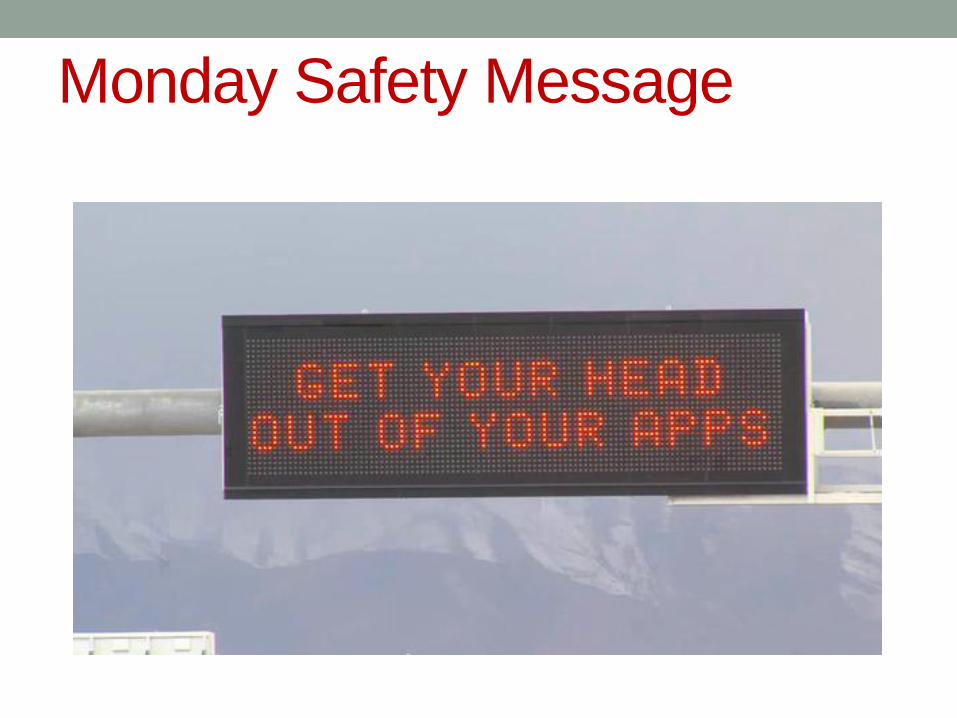
Monday Safety Message
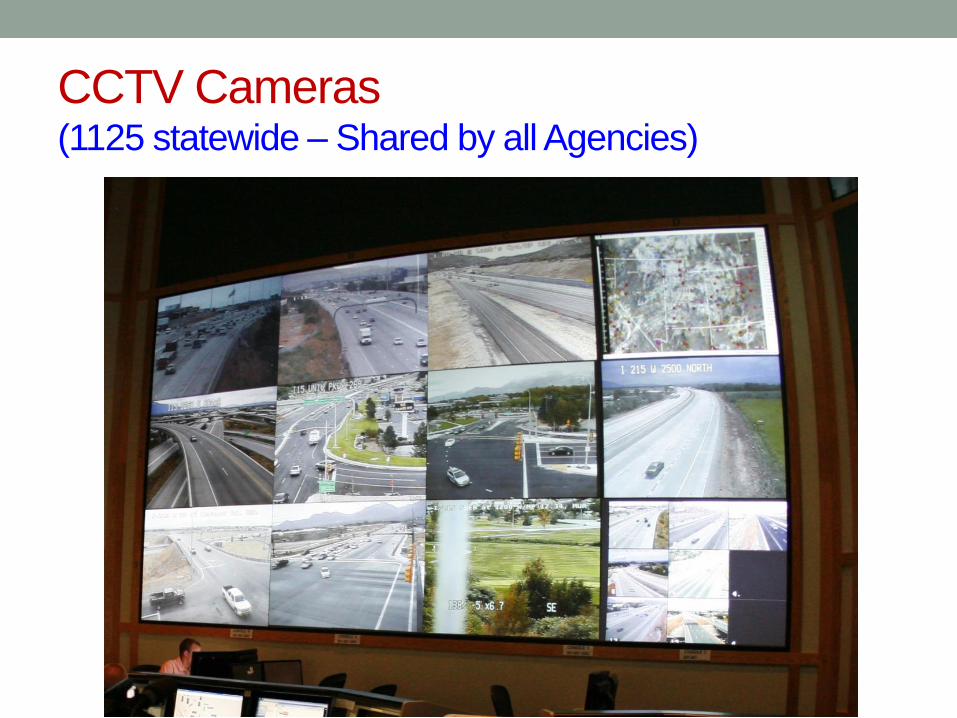
CCTV Cameras (1125 statewide – Shared by all Agencies)
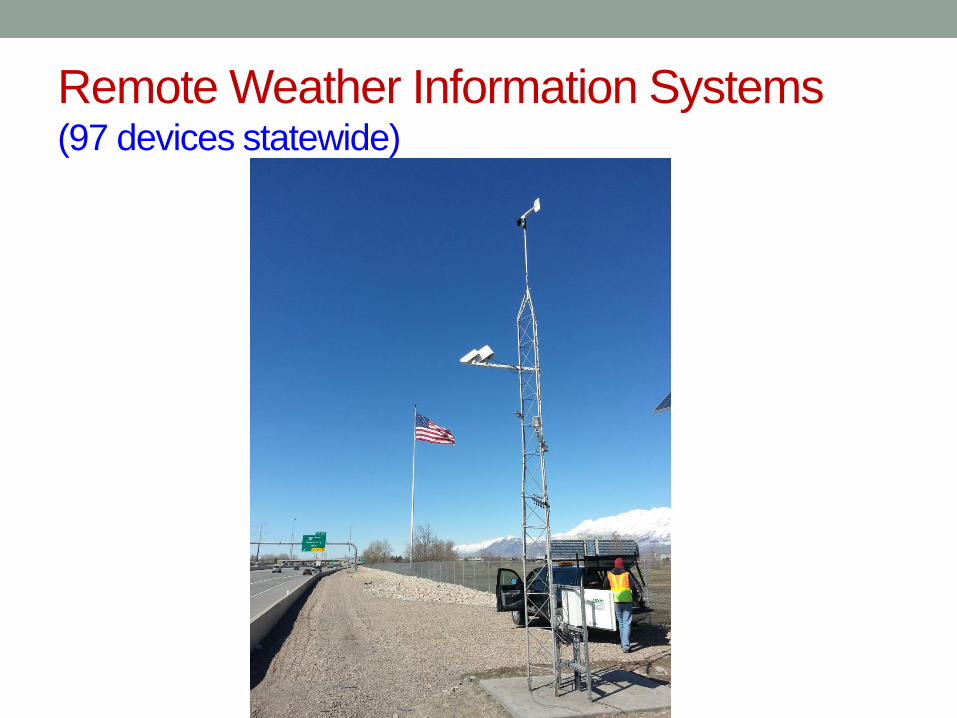
Remote Weather Information Systems (97 devices statewide)
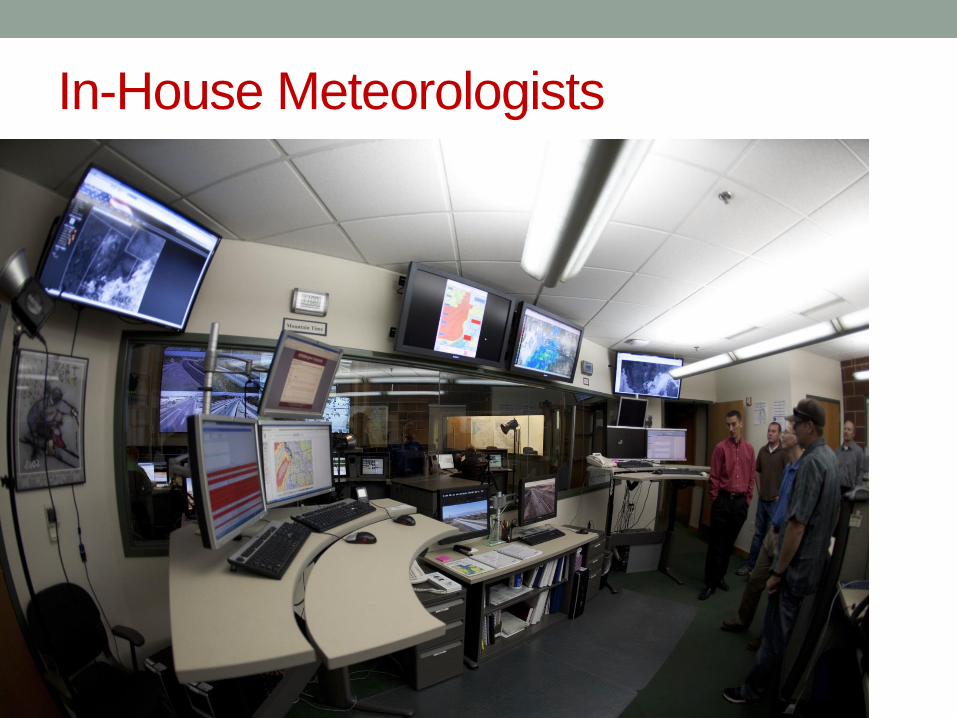
In-House Meteorologists

Accurate Road Weather Forecasts help with
Mobility and Safety
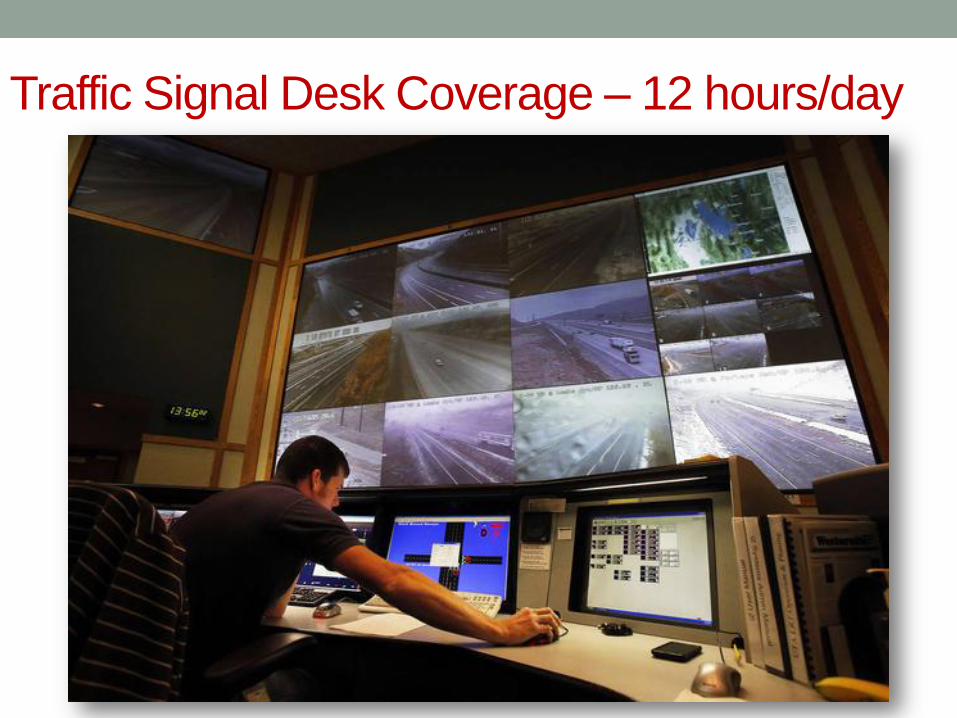
Traffic Signal Desk Coverage – 12 hours/day
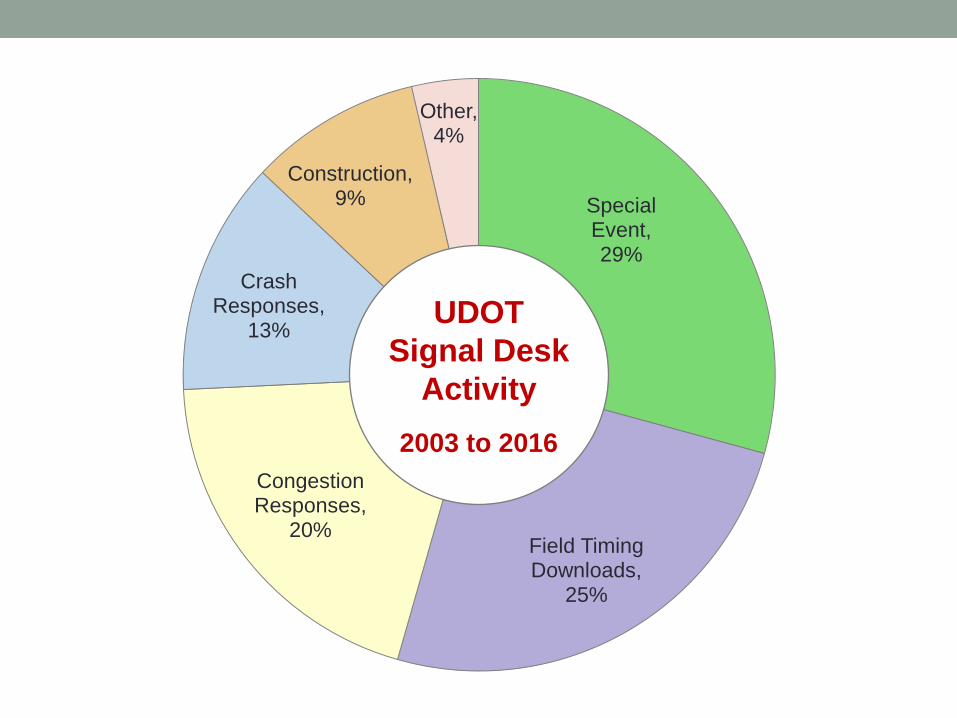
Special Event, 29%
Field Timing Downloads,
25%
Congestion Responses,
20%
Crash Responses,
13%
Construction, 9%
Other, 4%
UDOT
Signal Desk
Activity
2003 to 2016
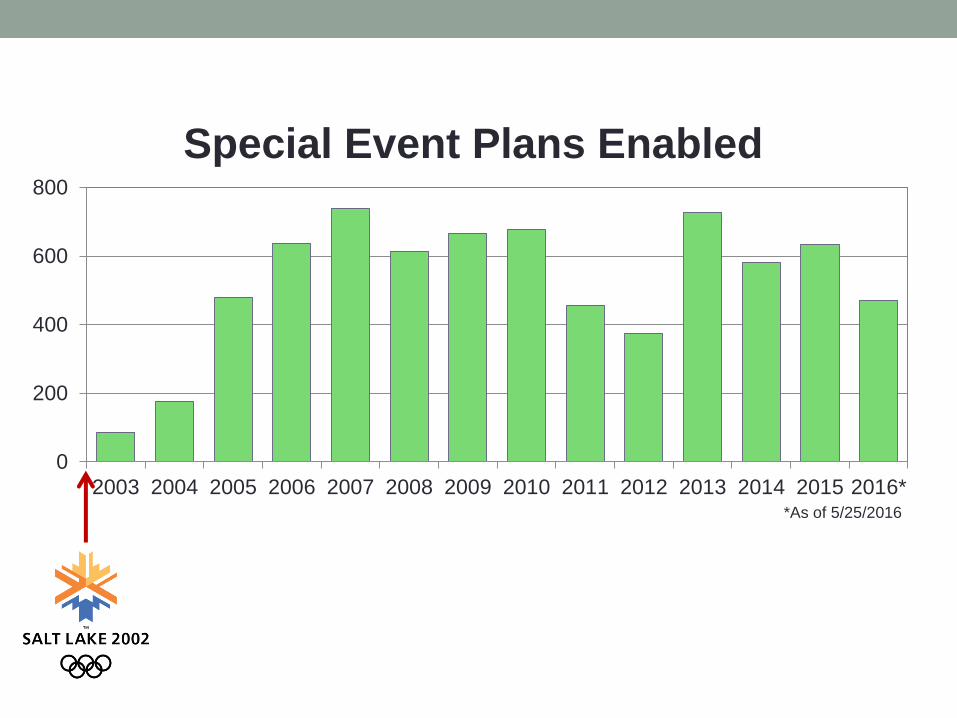
0
200
400
600
800
2003 2004 2005 2006 2007 2008 2009 2010 2011 2012 2013 2014 2015 2016*
Special Event Plans Enabled
*As of 5/25/2016
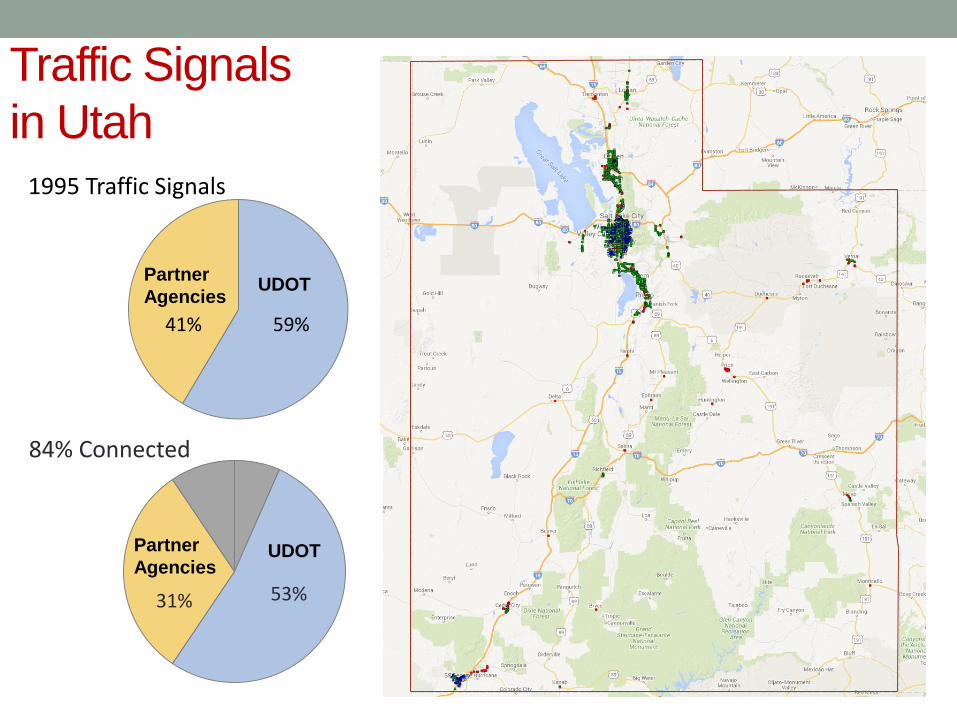
53% 31%
84% Connected
UDOT Partner
Agencies
Traffic Signals
in Utah
59% 41%
1995 Traffic Signals
UDOT Partner
Agencies
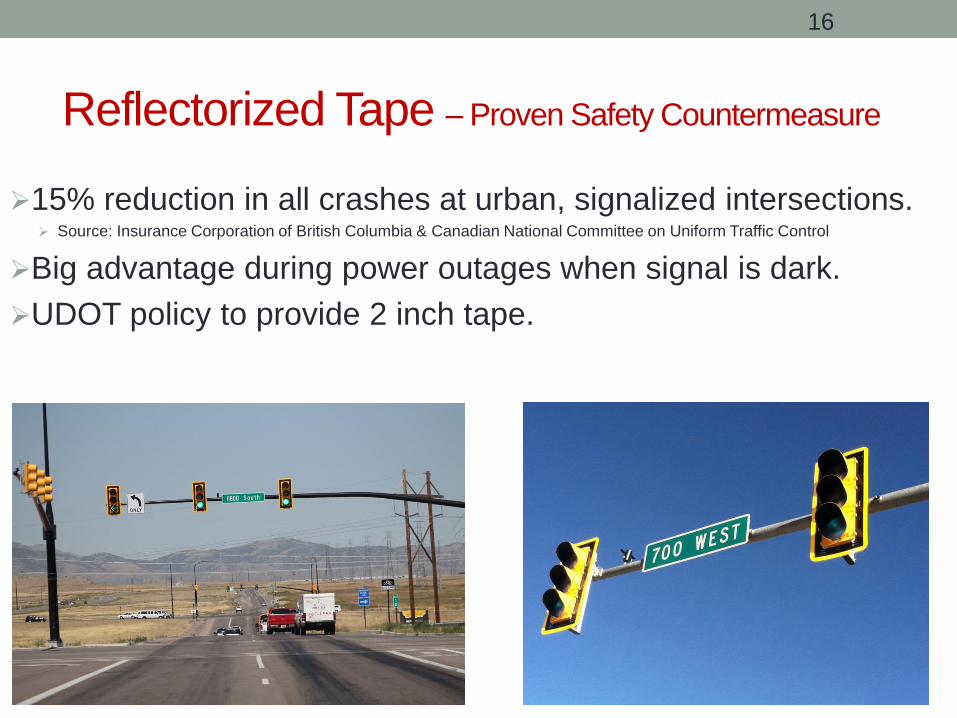
Reflectorized Tape – Proven Safety Countermeasure
15% reduction in all crashes at urban, signalized intersections. Source: Insurance Corporation of British Columbia & Canadian National Committee on Uniform Traffic Control
Big advantage during power outages when signal is dark.
UDOT policy to provide 2 inch tape.
16
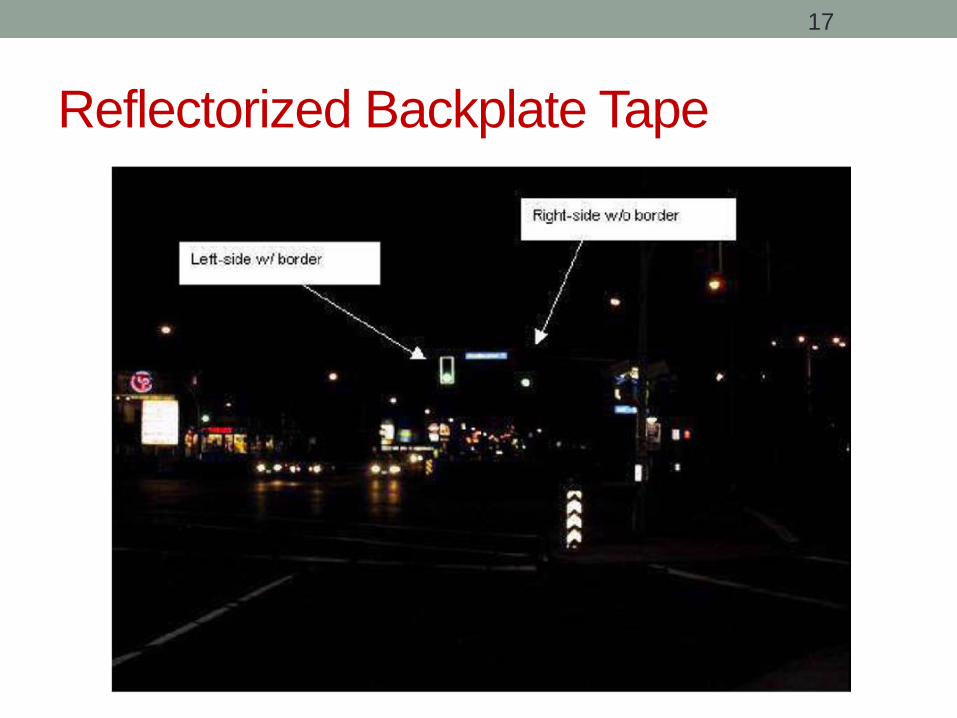
Reflectorized Backplate Tape
17
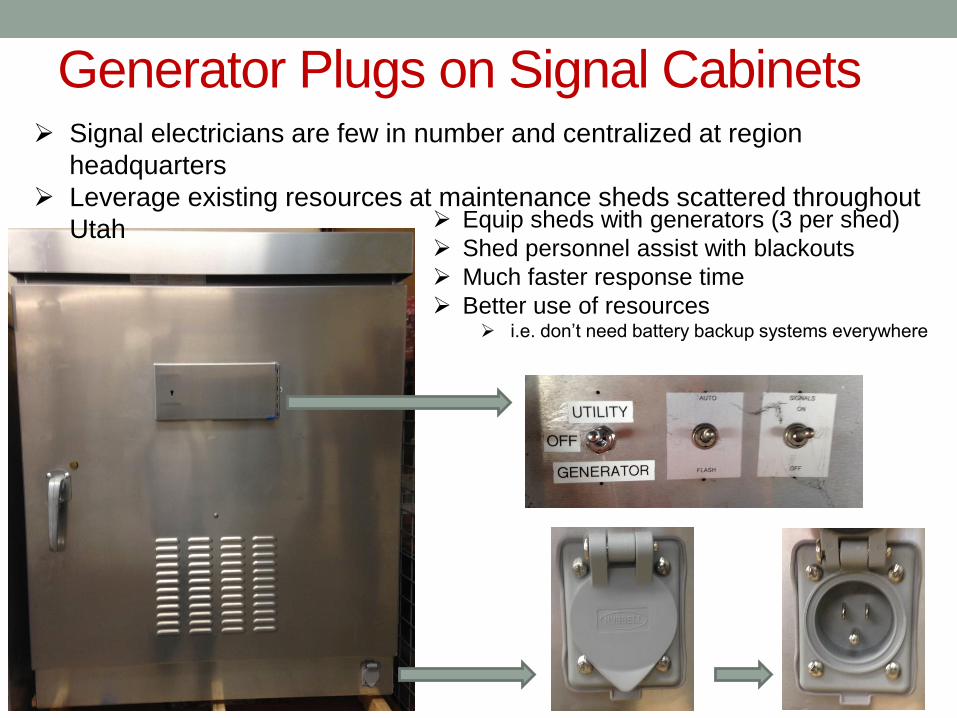
Generator Plugs on Signal Cabinets Signal electricians are few in number and centralized at region
headquarters
Leverage existing resources at maintenance sheds scattered throughout
Utah Equip sheds with generators (3 per shed)
Shed personnel assist with blackouts
Much faster response time
Better use of resources i.e. don’t need battery backup systems everywhere

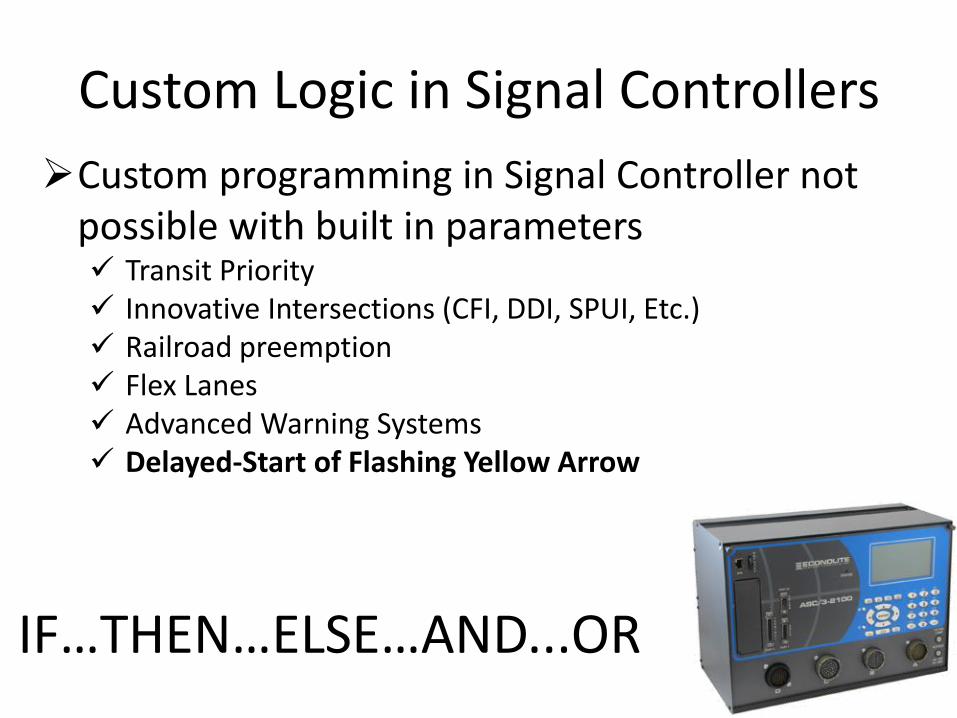
Custom Logic in Signal Controllers
Custom programming in Signal Controller not possible with built in parameters Transit Priority Innovative Intersections (CFI, DDI, SPUI, Etc.) Railroad preemption Flex Lanes Advanced Warning Systems Delayed-Start of Flashing Yellow Arrow
IF…THEN…ELSE…AND...OR
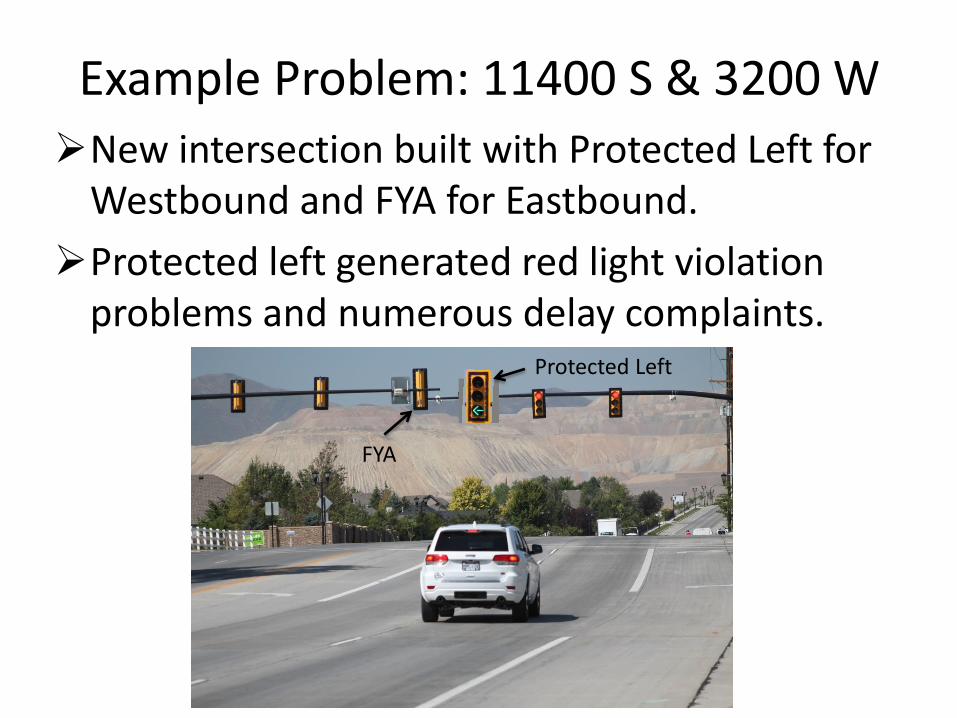
Example Problem: 11400 S & 3200 W
New intersection built with Protected Left for Westbound and FYA for Eastbound.
Protected left generated red light violation problems and numerous delay complaints.
FYA
Protected Left

Example Problem: 11400 S & 3200 W
• If there is a car in the EB-to-NB left turn lane, it may be hard for a driver in WB-to-SB left turn lane to see EB traffic.

Example Problem: 11400 S & 3200 W
• View from perspective of WB-to-SB left turn lane
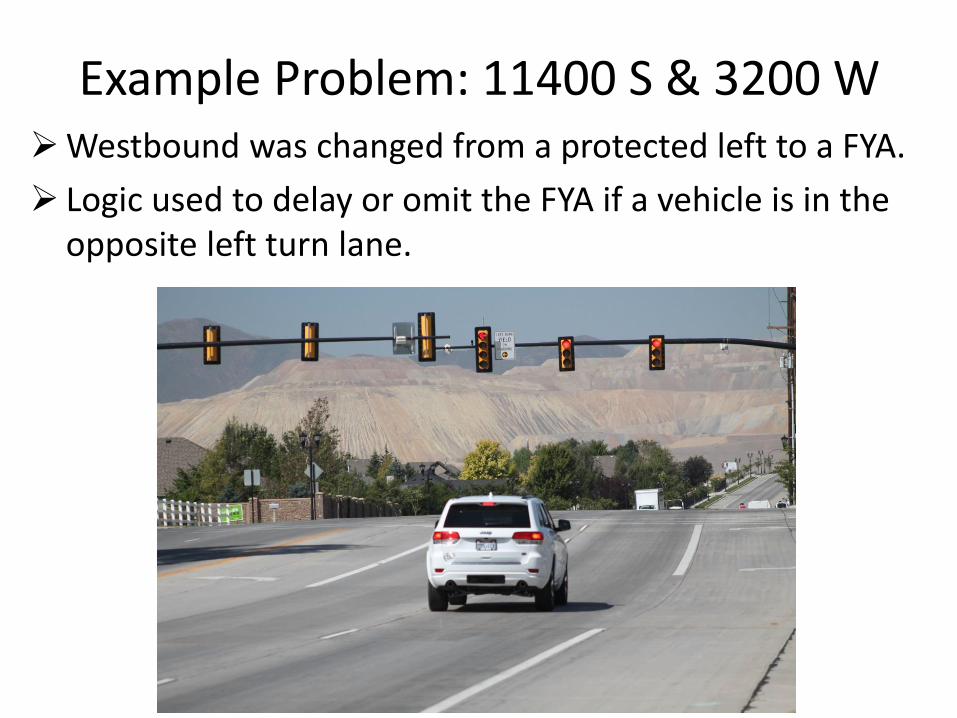
Example Problem: 11400 S & 3200 W Westbound was changed from a protected left to a FYA.
Logic used to delay or omit the FYA if a vehicle is in the opposite left turn lane.
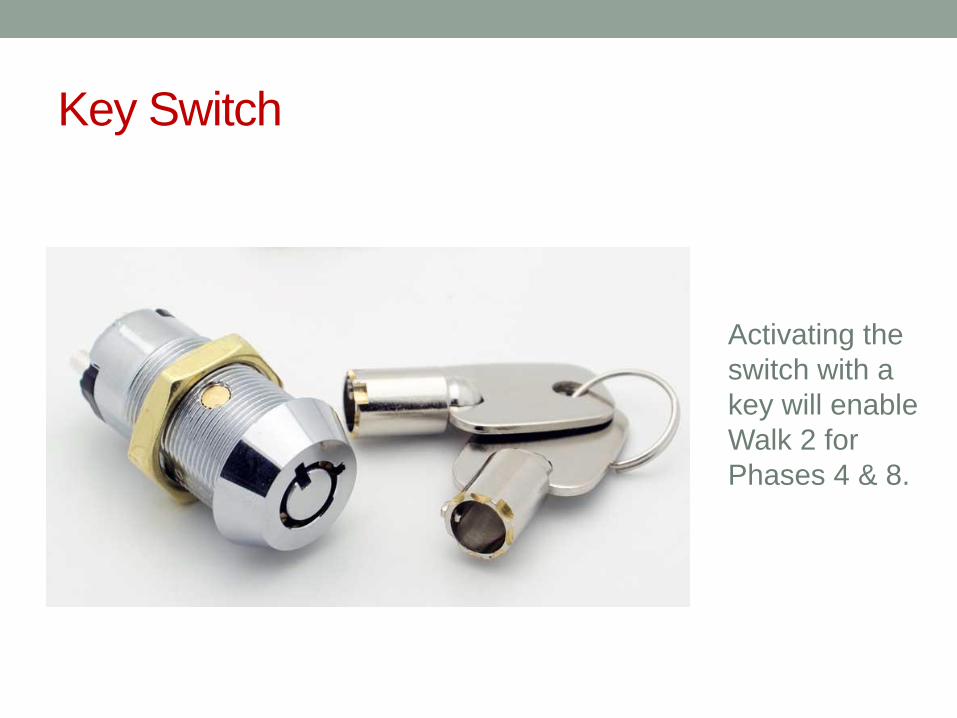
Key Switch
Activating the
switch with a
key will enable
Walk 2 for
Phases 4 & 8.
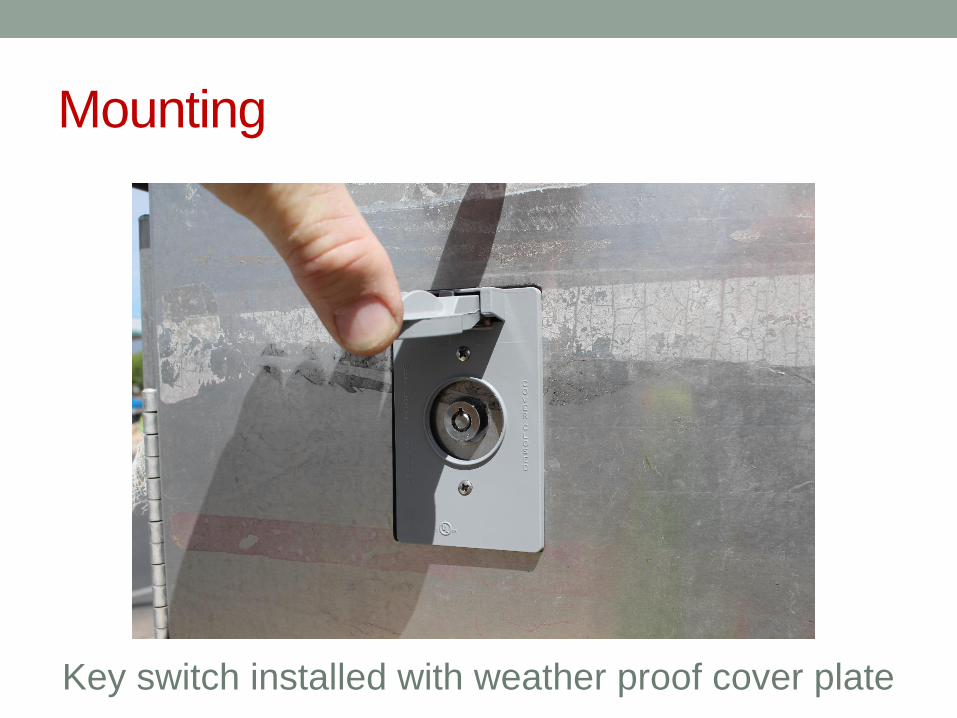
Mounting
Key switch installed with weather proof cover plate
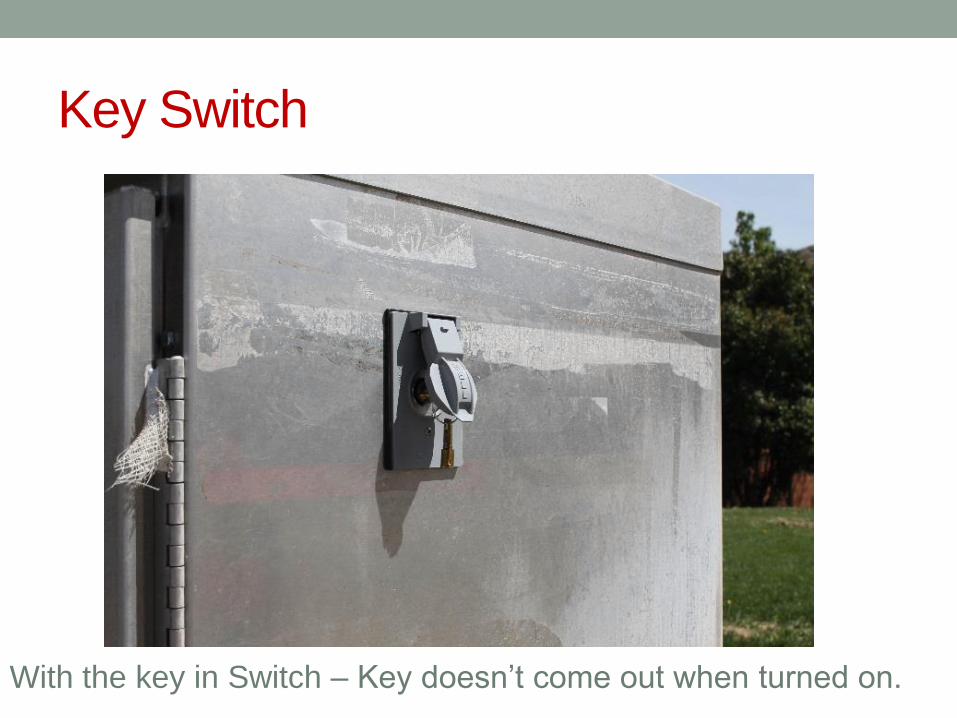
Key Switch
With the key in Switch – Key doesn’t come out when turned on.
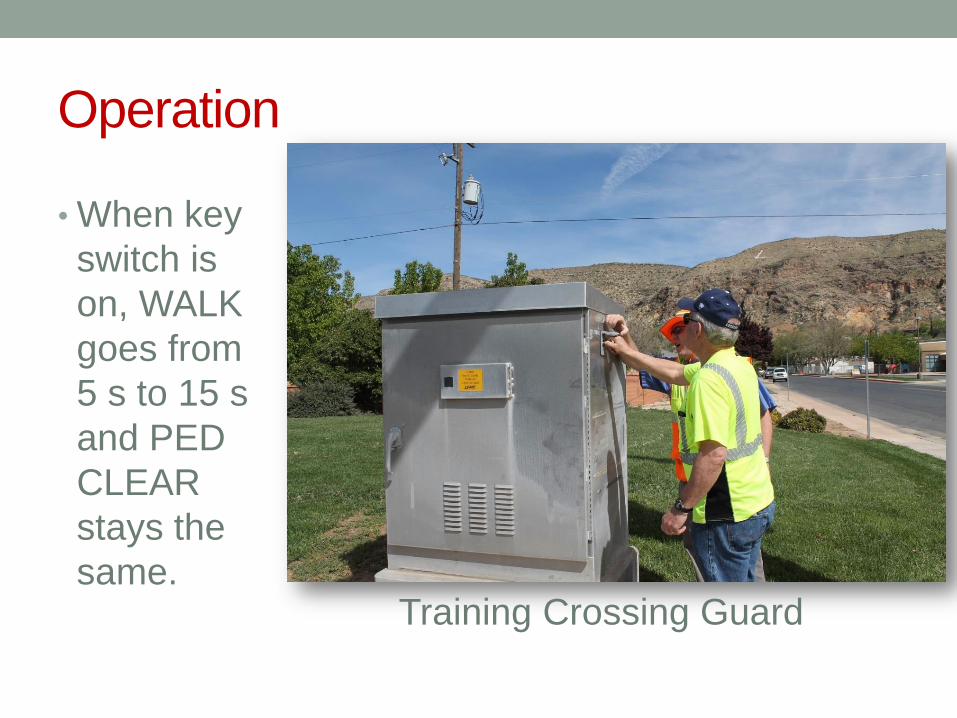
Operation
• When key
switch is
on, WALK
goes from
5 s to 15 s
and PED
CLEAR
stays the
same. Training Crossing Guard
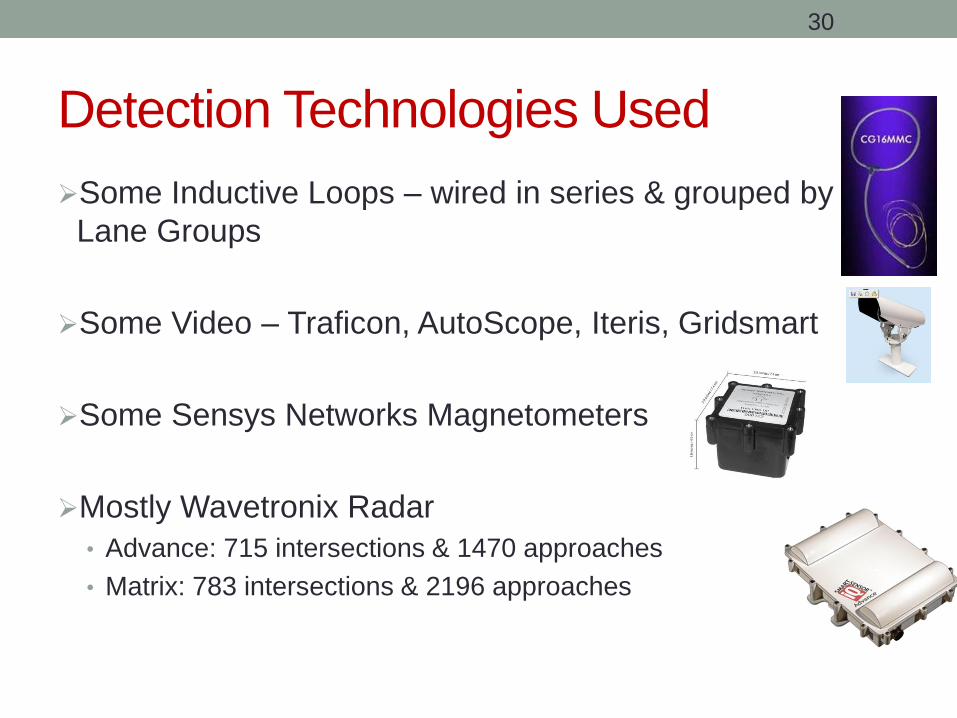
Detection Technologies Used
Some Inductive Loops – wired in series & grouped by
Lane Groups
Some Video – Traficon, AutoScope, Iteris, Gridsmart
Some Sensys Networks Magnetometers
Mostly Wavetronix Radar
• Advance: 715 intersections & 1470 approaches
• Matrix: 783 intersections & 2196 approaches
30
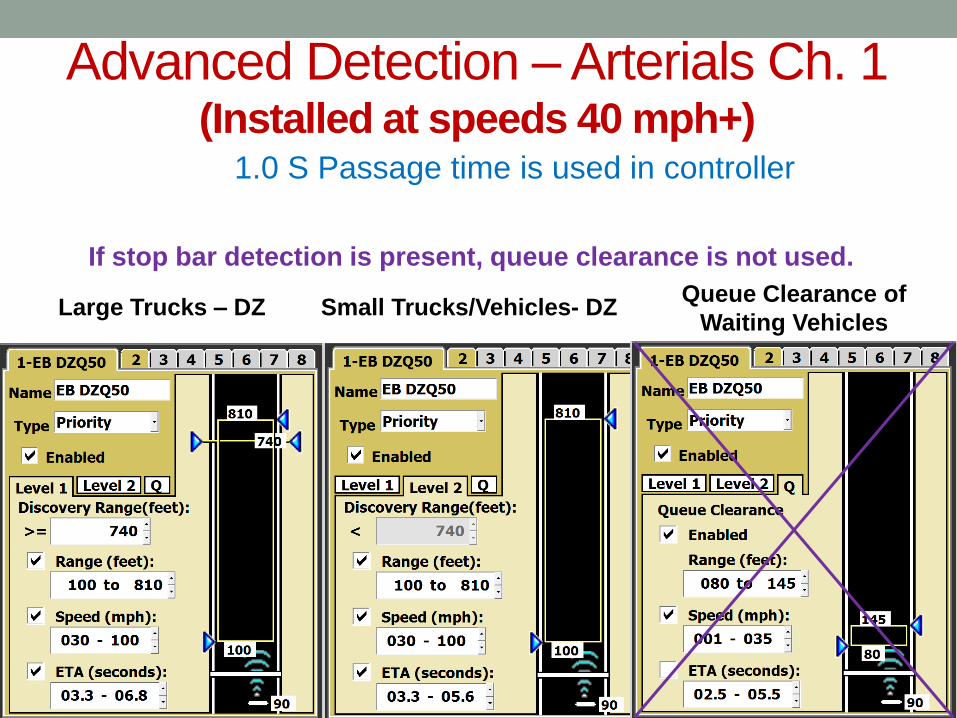
Advanced Detection – Arterials Ch. 1 (Installed at speeds 40 mph+)
Large Trucks – DZ Small Trucks/Vehicles- DZ Queue Clearance of
Waiting Vehicles
1.0 S Passage time is used in controller
If stop bar detection is present, queue clearance is not used.

Advanced Detection – Arterials Ch. 2 (Installed at speeds 40 mph+)
Channel 2 used for
approach volume
counts with a 10
foot zone
approximately 400
feet from the
stopbar.
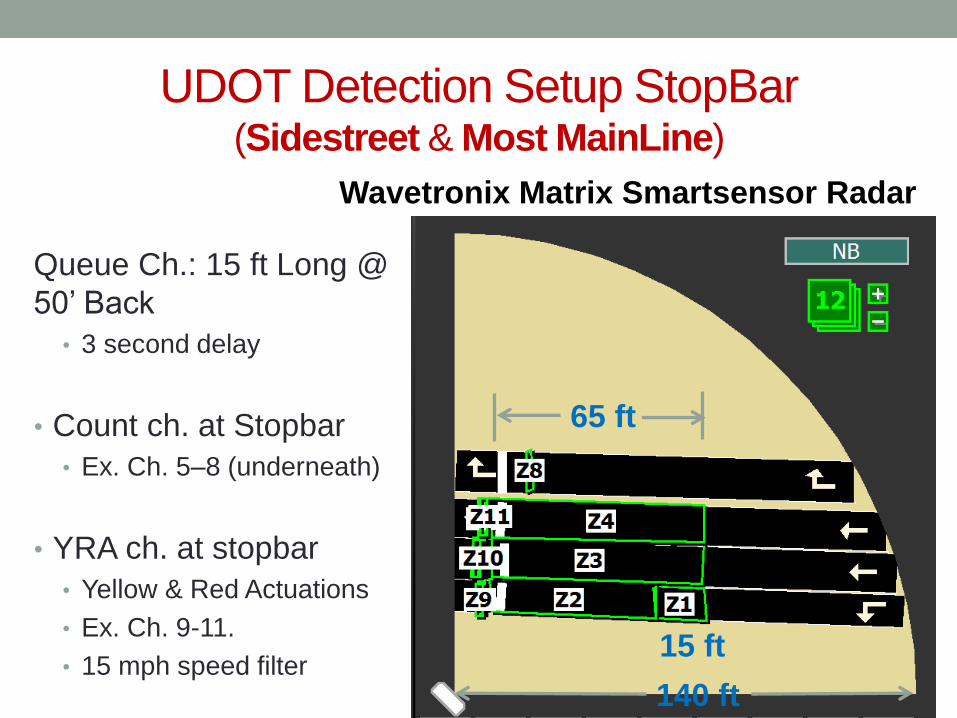
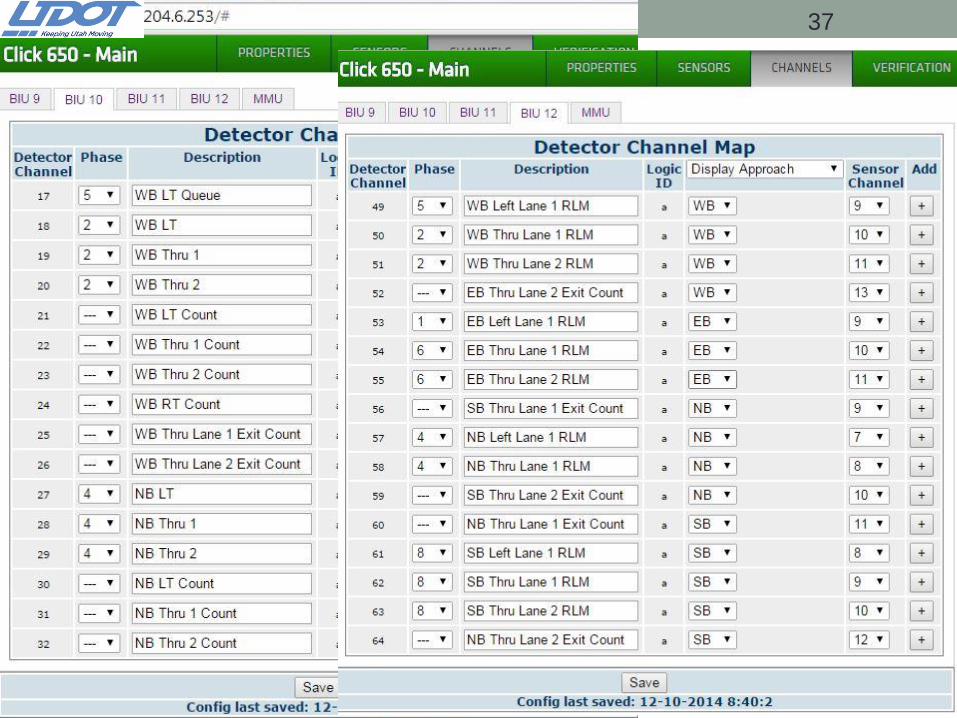
UDOT Detection Setup StopBar (Sidestreet & Most MainLine)
Wavetronix Matrix Smartsensor Radar
140 ft
65 ft
15 ft
Queue Ch.: 15 ft Long @
50’ Back
• 3 second delay
• Count ch. at Stopbar
• Ex. Ch. 5–8 (underneath)
• YRA ch. at stopbar
• Yellow & Red Actuations
• Ex. Ch. 9-11.
• 15 mph speed filter
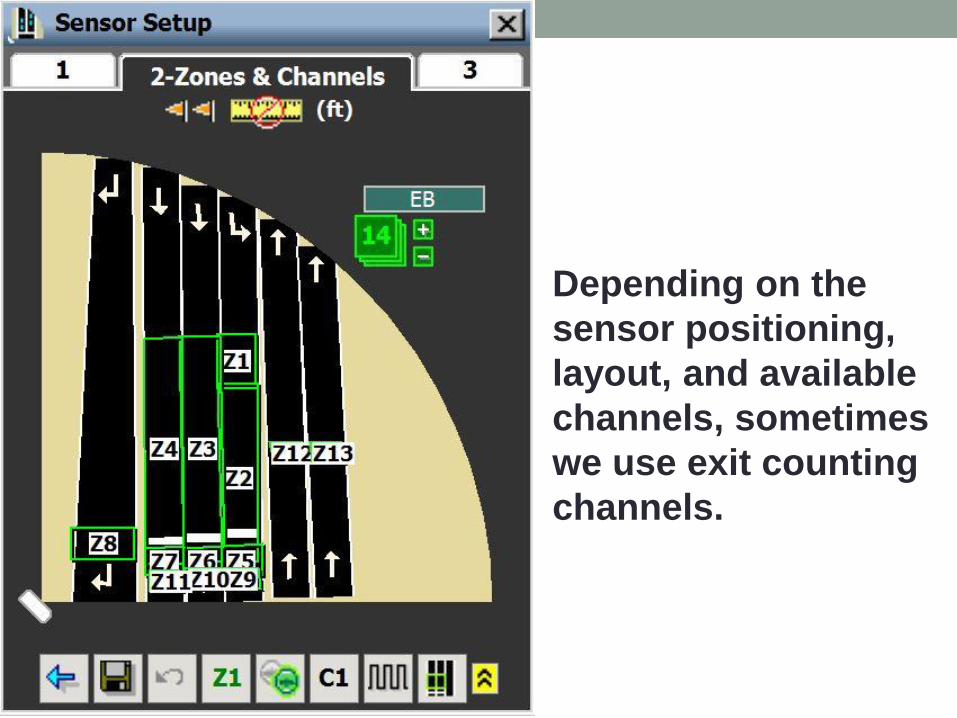
Depending on the
sensor positioning,
layout, and available
channels, sometimes
we use exit counting
channels.
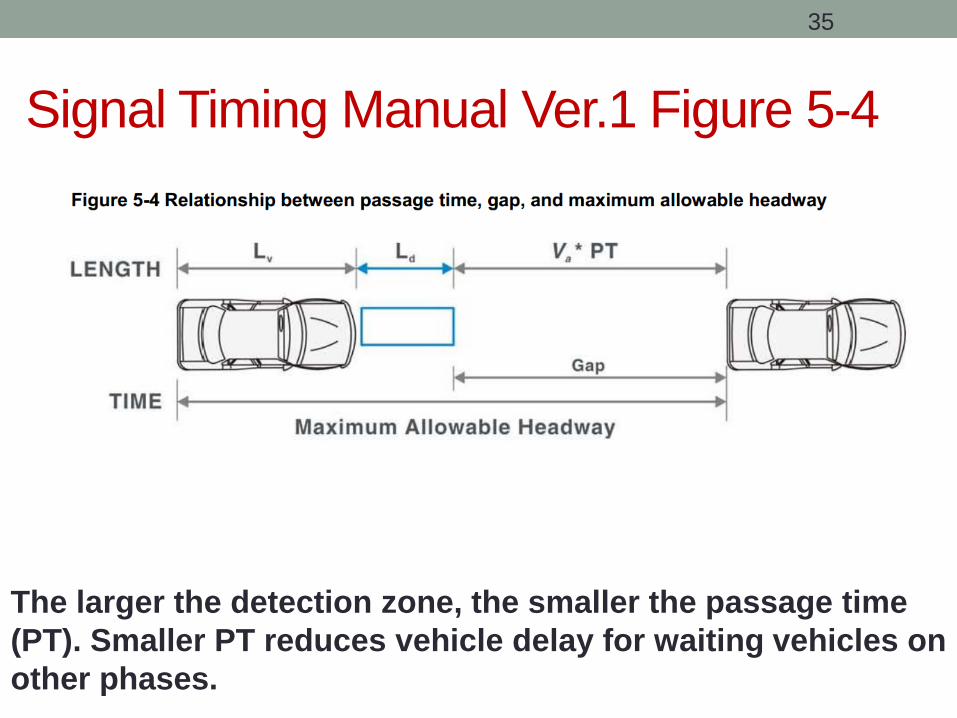
Signal Timing Manual Ver.1 Figure 5-4
35
The larger the detection zone, the smaller the passage time
(PT). Smaller PT reduces vehicle delay for waiting vehicles on
other phases.
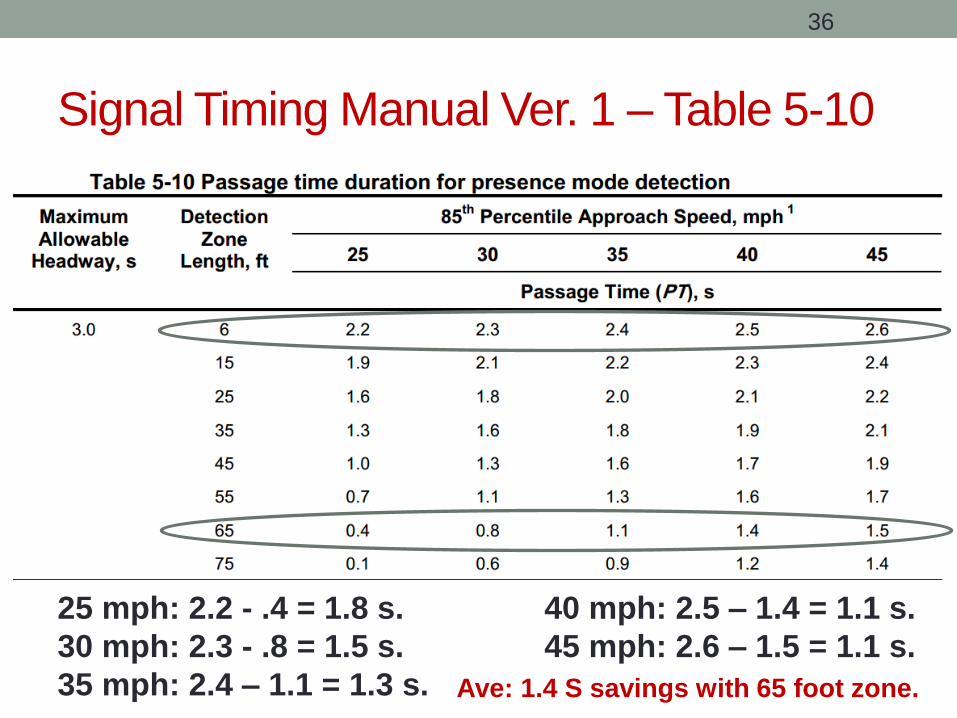
Signal Timing Manual Ver. 1 – Table 5-10
36
25 mph: 2.2 - .4 = 1.8 s.
30 mph: 2.3 - .8 = 1.5 s.
35 mph: 2.4 – 1.1 = 1.3 s.
40 mph: 2.5 – 1.4 = 1.1 s.
45 mph: 2.6 – 1.5 = 1.1 s.
Ave: 1.4 S savings with 65 foot zone.
37
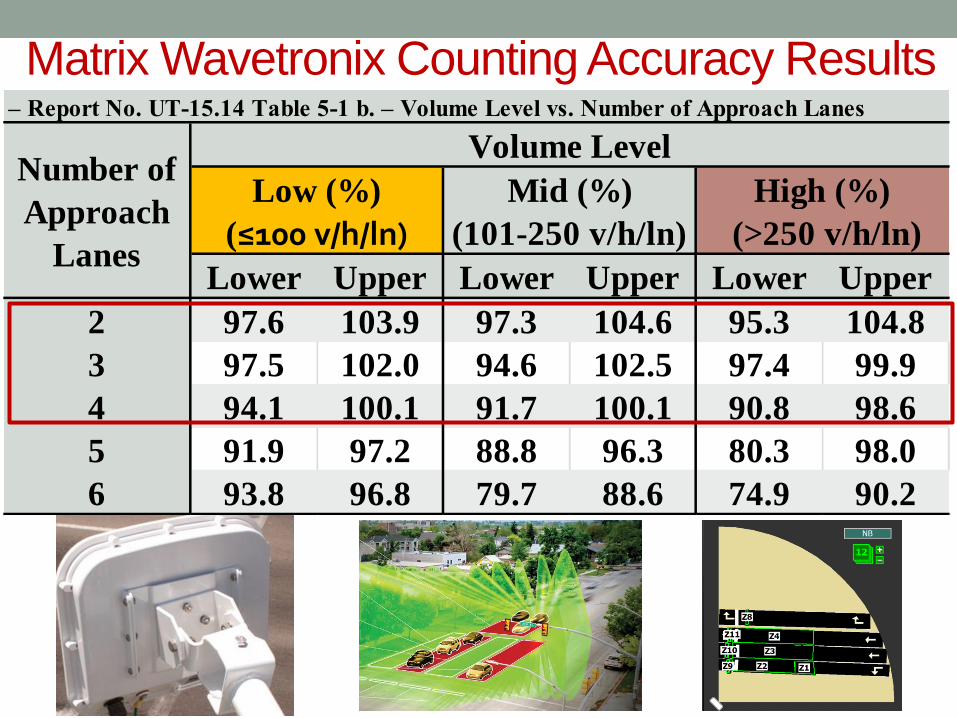
Lower Upper Lower Upper Lower Upper
2 97.6 103.9 97.3 104.6 95.3 104.8
3 97.5 102.0 94.6 102.5 97.4 99.9
4 94.1 100.1 91.7 100.1 90.8 98.6
5 91.9 97.2 88.8 96.3 80.3 98.0
6 93.8 96.8 79.7 88.6 74.9 90.2
Radar Wavetronix Matrix - Volume Accuracy: 95 Percent Confidence Interval of the Mean
– Report No. UT-15.14 Table 5-1 b. – Volume Level vs. Number of Approach Lanes
Number of
Approach
Lanes
Volume Level
Low (%)
(≤100 v/h/ln)
Mid (%)
(101-250 v/h/ln)
High (%)
(>250 v/h/ln)
Matrix Wavetronix Counting Accuracy Results

Lower Upper Lower Upper Lower Upper
1 94.7 116.7 98.1 104.7 86.6 100.4
2 87.6 104.0 86.9 94.1 83.4 92.2
3 85.7 94.9 80.6 90.2 74.1 81.5
Radar Wavetronix Advance - Volume Accuracy – Report No. UT-16.05 Table 5-4. –
Combined 95% Confidence Interval of the Mean
Number of
Approach
Lanes
Volume Level
Low (%) Mid (%) High (%)
(≤100 v/h/ln) (101-250 v/h/ln) (>250 v/h/ln)
Wavetronix Advance Counting Accuracy Results)
Speed Accuracy
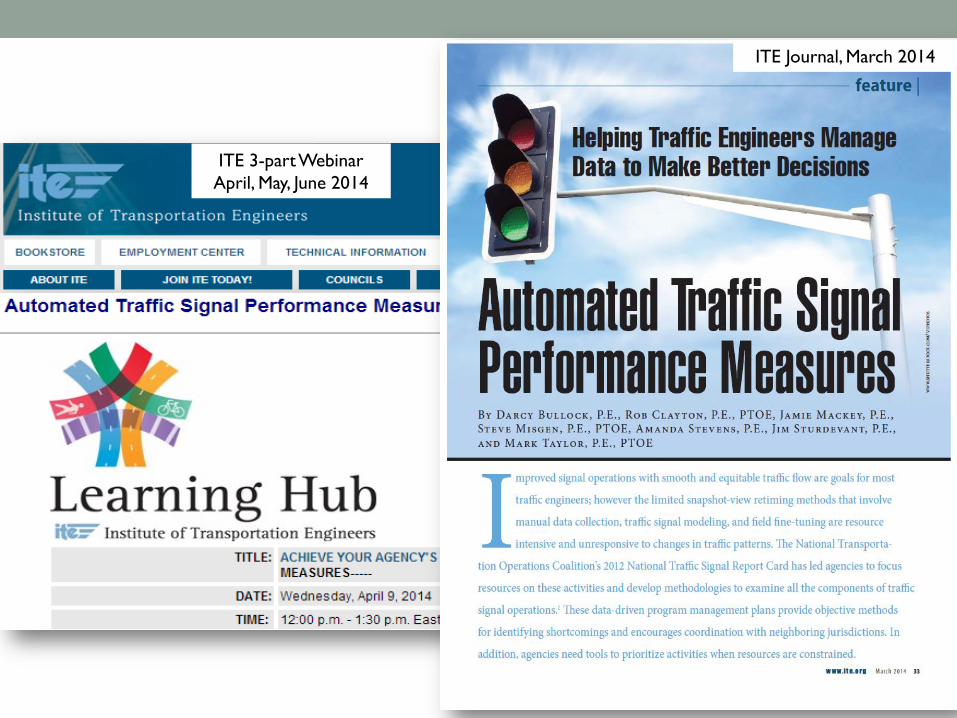
ITE 3-part Webinar
April, May, June 2014
ITE Journal, March 2014
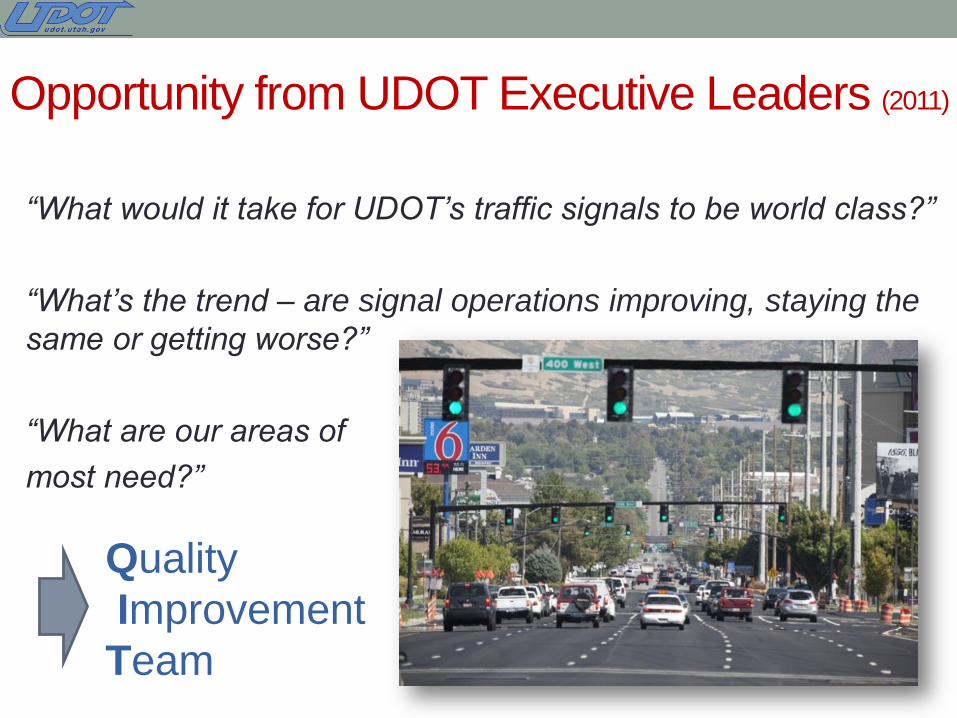
Opportunity from UDOT Executive Leaders (2011)
“What would it take for UDOT’s traffic signals to be world class?”
“What’s the trend – are signal operations improving, staying the
same or getting worse?”
“What are our areas of
most need?”
Quality
Improvement
Team
QIT Recommendations (July 2011)
• Communications and
detection maintained
during projects
• Proactive signal
maintenance
• Real-time monitoring
of system health and
quality of operations
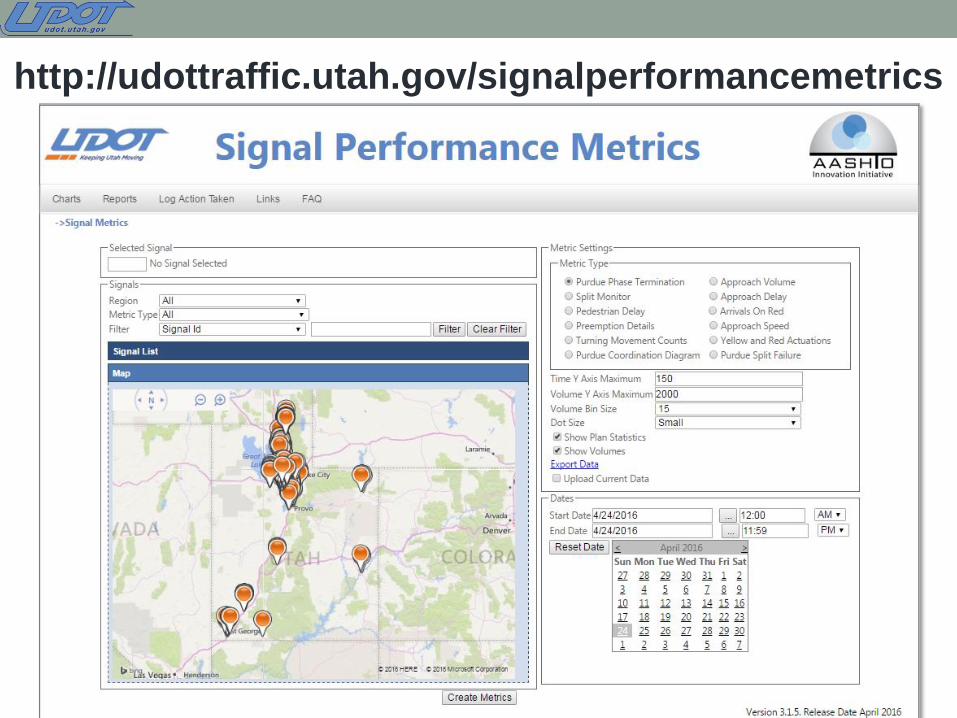
http://udottraffic.utah.gov/signalperformancemetrics
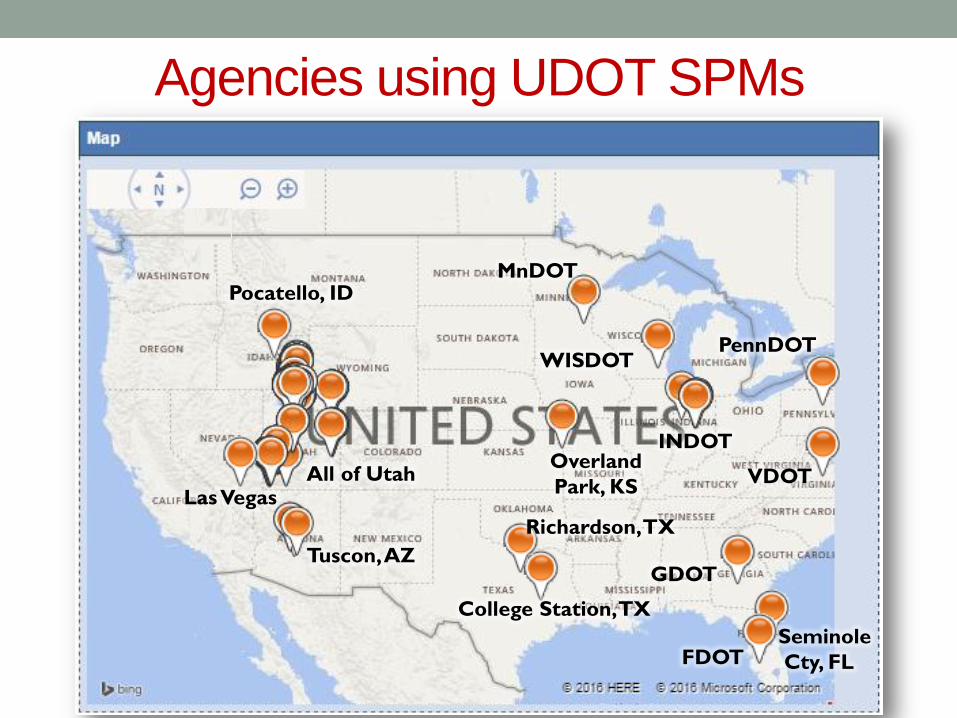
Agencies using UDOT SPMs Overland Park, KS,
MnDOT
GDOT
FDOT
Seminole County, FL
Tucson AZ
Las Vegas
VDOT
WISDOT
College Station,Texas
Pocatello, ID
PennDOT
Richardson, TX
College Station, TX
MnDOT
Overland
Park, KS All of Utah
INDOT
FDOT Seminole
Cty, FL
WISDOT
VDOT
GDOT Tuscon, AZ
College Station, TX
Richardson, TX
PennDOT
Pocatello, ID
Las Vegas
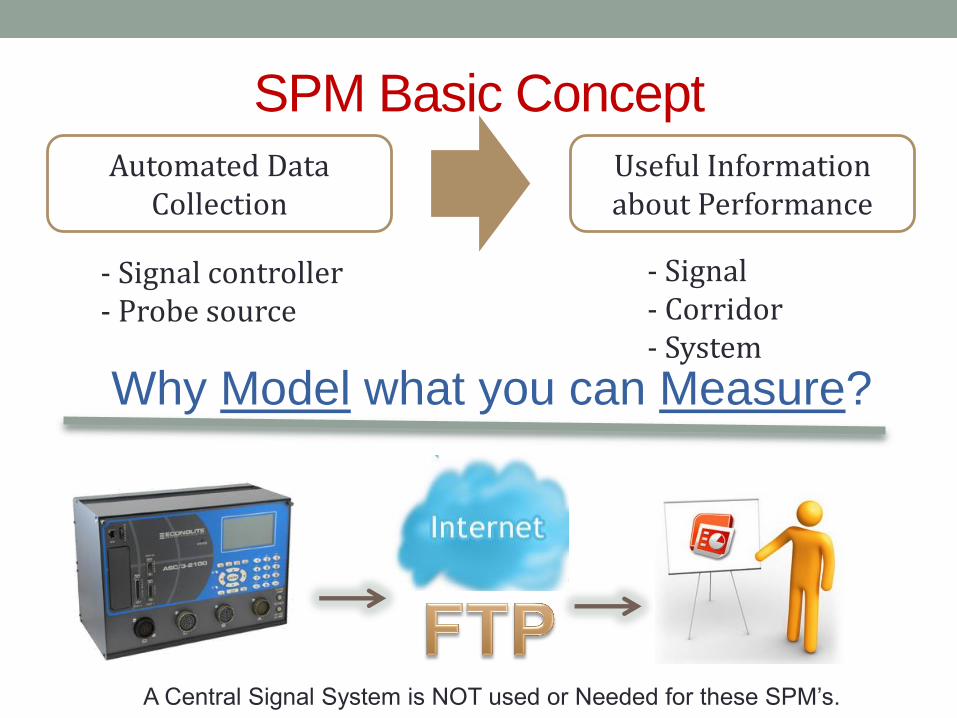
SPM Basic Concept
- Signal controller - Probe source
- Signal - Corridor - System
Automated Data Collection
Useful Information about Performance
A Central Signal System is NOT used or Needed for these SPM’s.
Why Model what you can Measure?
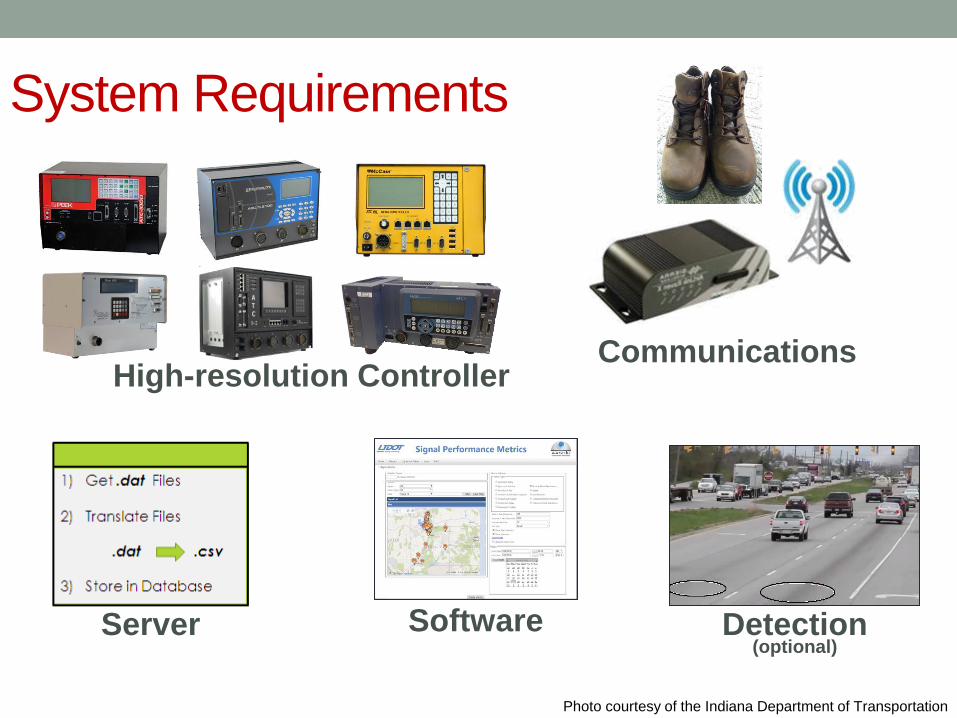
System Requirements
Detection Server Software
Communications
Photo courtesy of the Indiana Department of Transportation
(optional)
High-resolution Controller
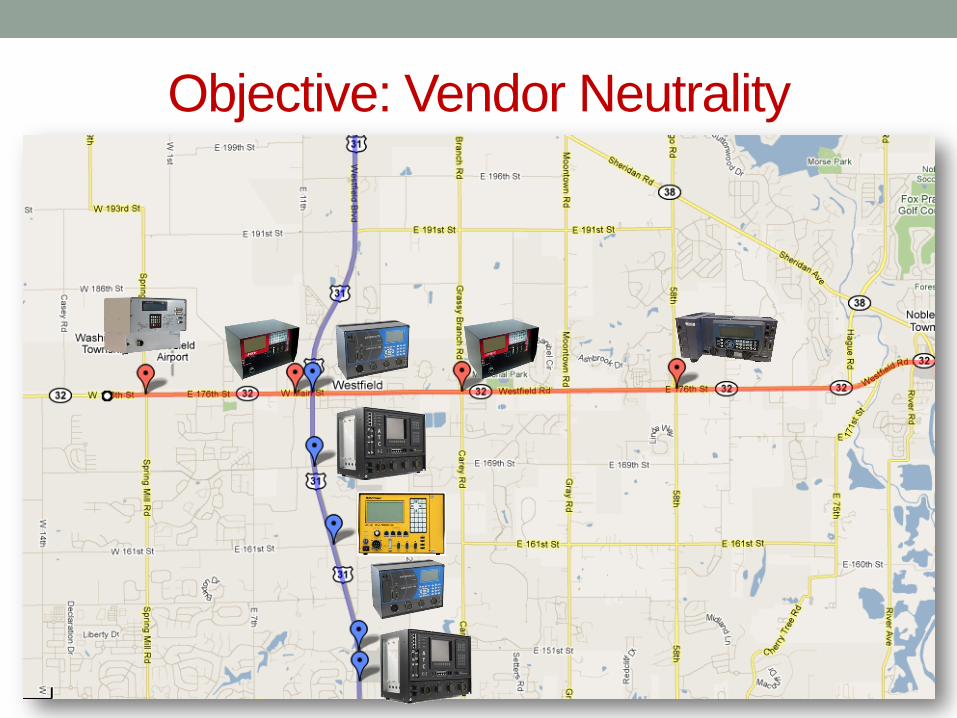
Objective: Vendor Neutrality
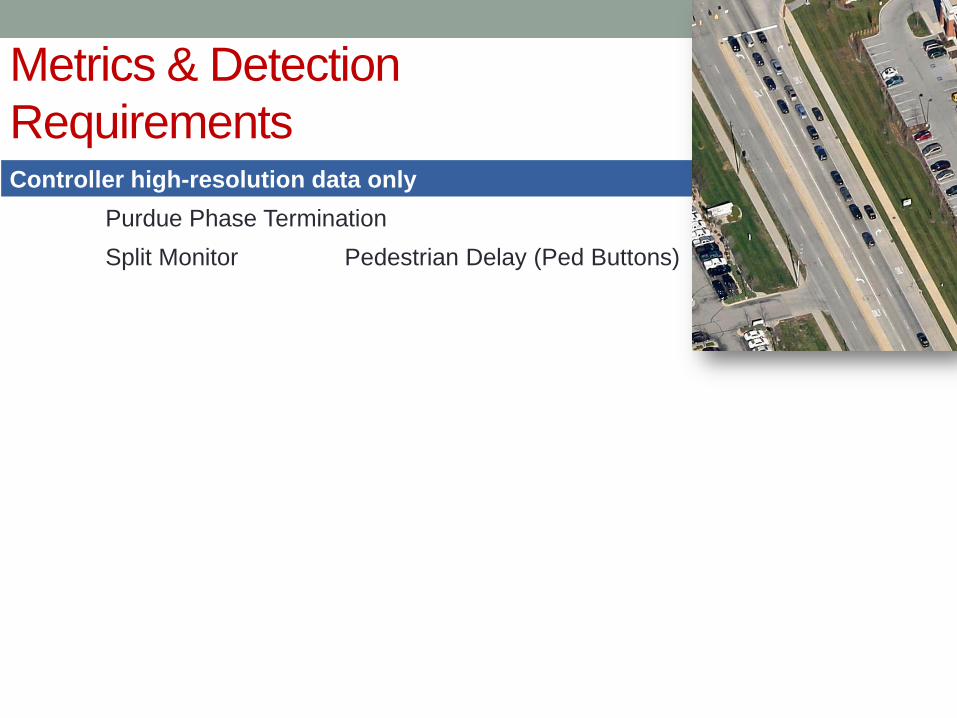
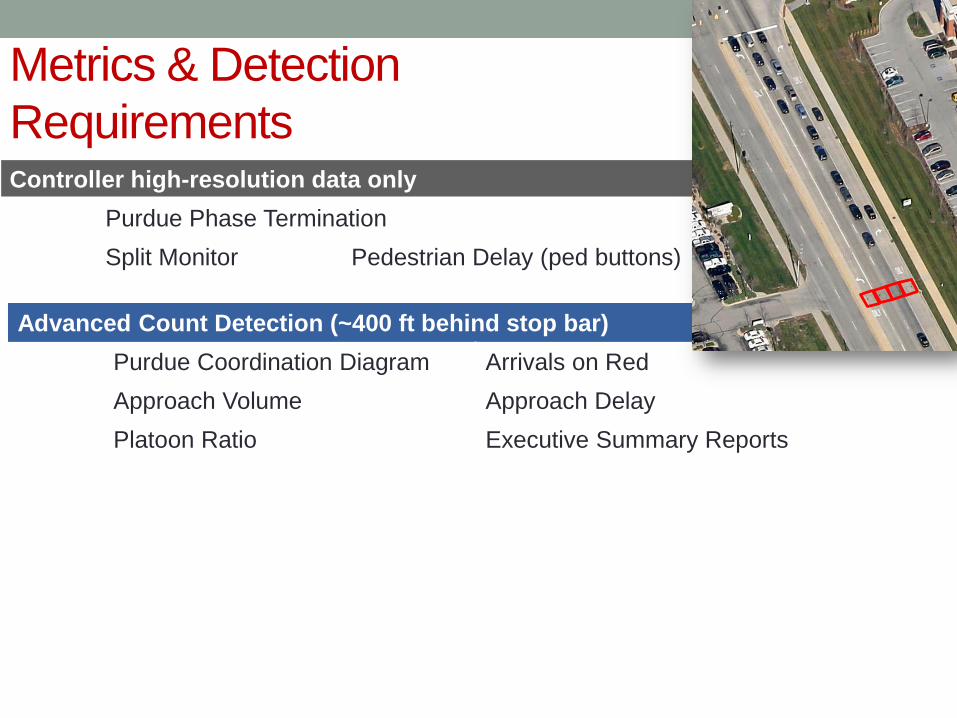
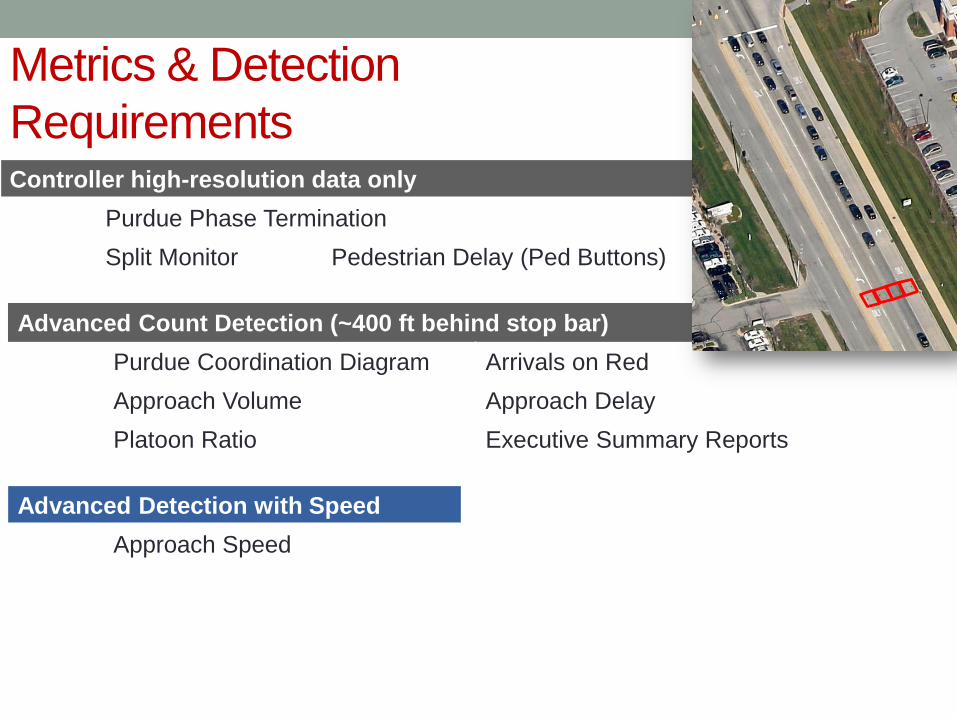
Metrics & Detection
Requirements Controller high-resolution data only
Purdue Phase Termination
Split Monitor Pedestrian Delay (Ped Buttons)
Gap out
Max out
Force off
Pedestrian activation
Skip
(shown above phase line)
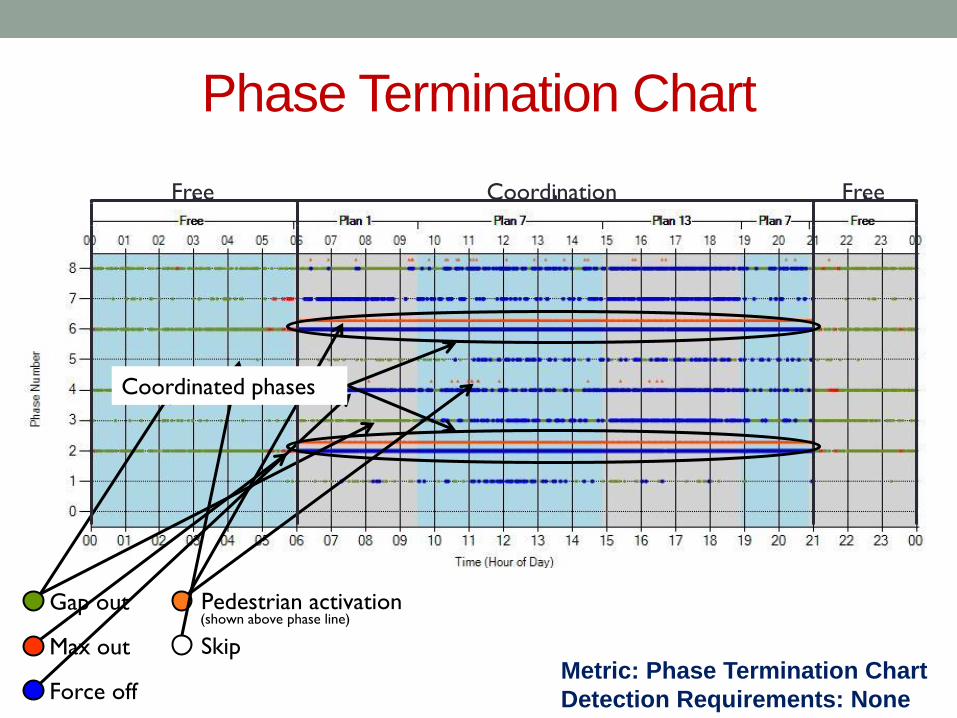
Phase Termination Chart
Metric: Phase Termination Chart
Detection Requirements: None
Free Free Coordination
Coordinated phases

BEFORE: Video detection not working at night
Nighttime detection problem
Metric: Purdue Phase Termination
Detection Requirements: None
Gap out
Max out
Force off
Pedestrian activation
Skip
(shown above phase line)
Minor street through & left turn max out at night only
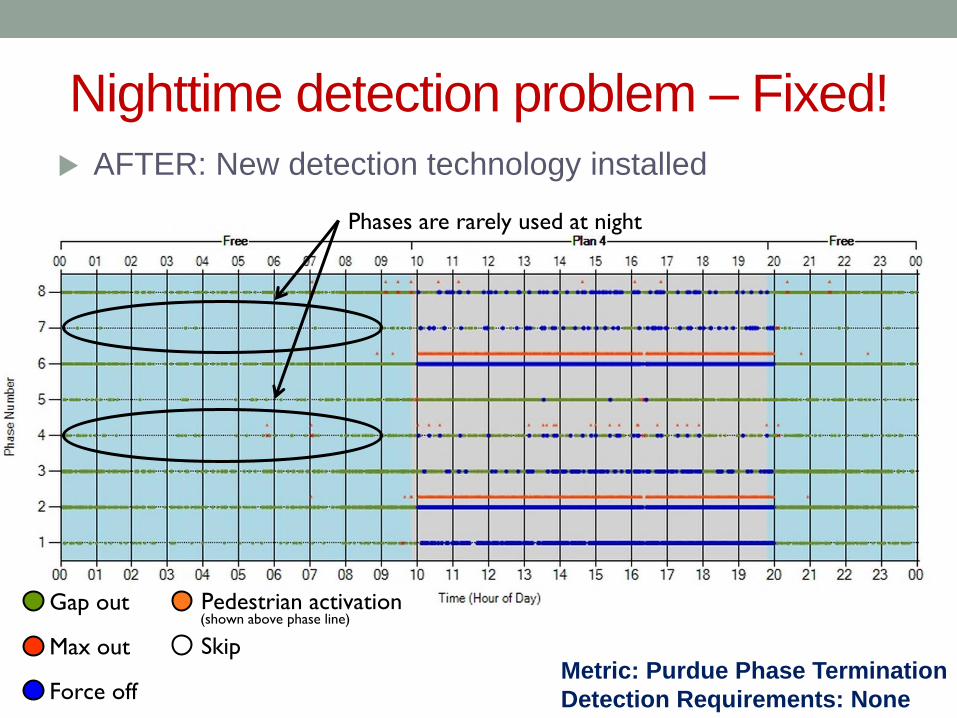
AFTER: New detection technology installed
Nighttime detection problem – Fixed!
Metric: Purdue Phase Termination
Detection Requirements: None
Phases are rarely used at night
Gap out
Max out
Force off
Pedestrian activation
Skip
(shown above phase line)

Daily email at 7 a.m.
Uses Purdue Phase Termination chart data
Flags phases with >90% max-outs on each phase
between 1 a.m. and 5 a.m. after 20 occurrences
Compare to previous day’s list. Only phases with new
flags are sent in the email.
Alert Example: 100% Max Out
Metric: Purdue Phase Termination
Detection Requirements: None
Example

Split Monitor Phase 6
Metric: Split Monitor
Detection Requirements: None
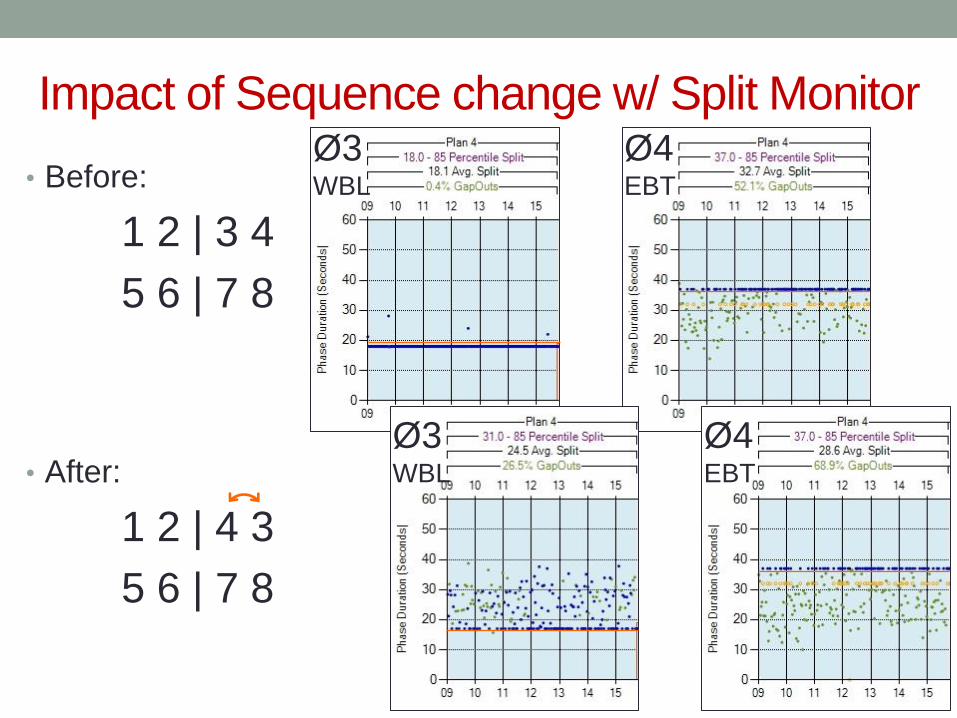
Impact of Sequence change w/ Split Monitor
• Before:
1 2 | 3 4
5 6 | 7 8
• After:
1 2 | 4 3
5 6 | 7 8
Ø3 WBL
Ø4 EBT
Ø3 WBL
Ø4 EBT
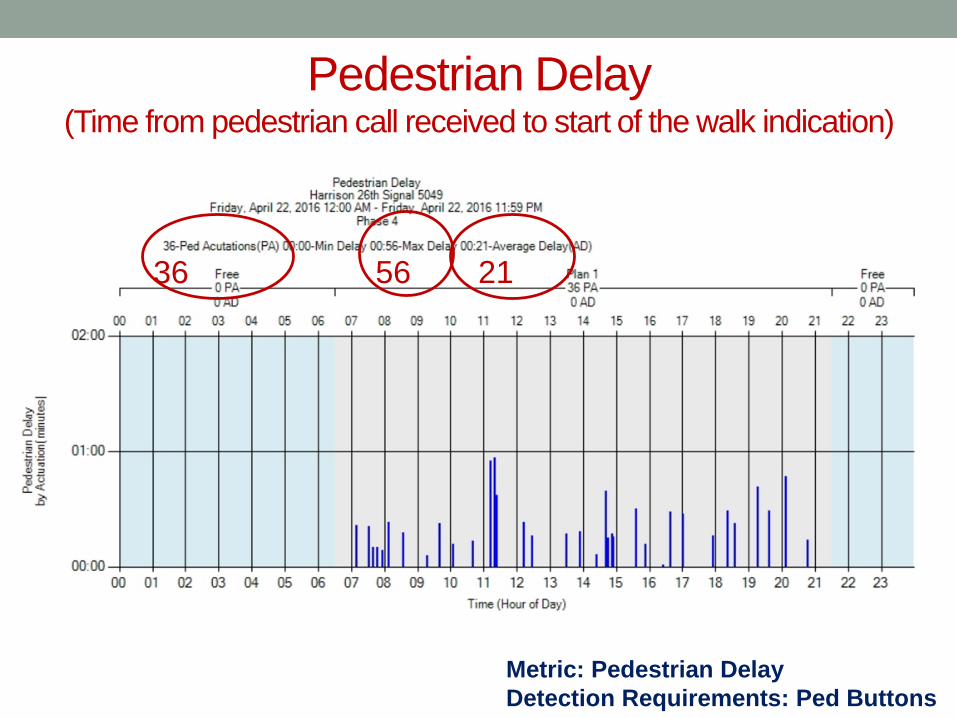
Pedestrian Delay (Time from pedestrian call received to start of the walk indication)
Metric: Pedestrian Delay
Detection Requirements: Ped Buttons
36 56 21
Metrics & Detection
Requirements Controller high-resolution data only
Purdue Phase Termination
Split Monitor Pedestrian Delay (ped buttons)
Advanced Count Detection (~400 ft behind stop bar)
Purdue Coordination Diagram Arrivals on Red
Approach Volume Approach Delay
Platoon Ratio Executive Summary Reports

Progression Quality
Metric: Purdue Coordination Diagram Detection Requirements: Advance Counters
Vehicles arriving on green Vehicles arriving on red
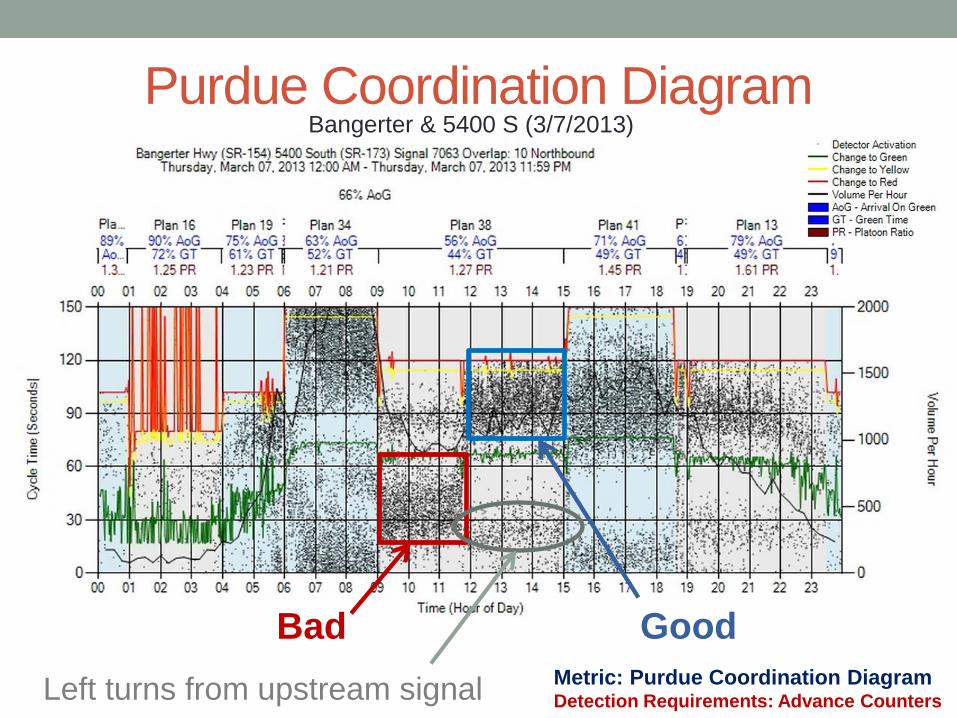
Purdue Coordination Diagram Bangerter & 5400 S (3/7/2013)
Metric: Purdue Coordination Diagram Detection Requirements: Advance Counters
Bad Good
Left turns from upstream signal
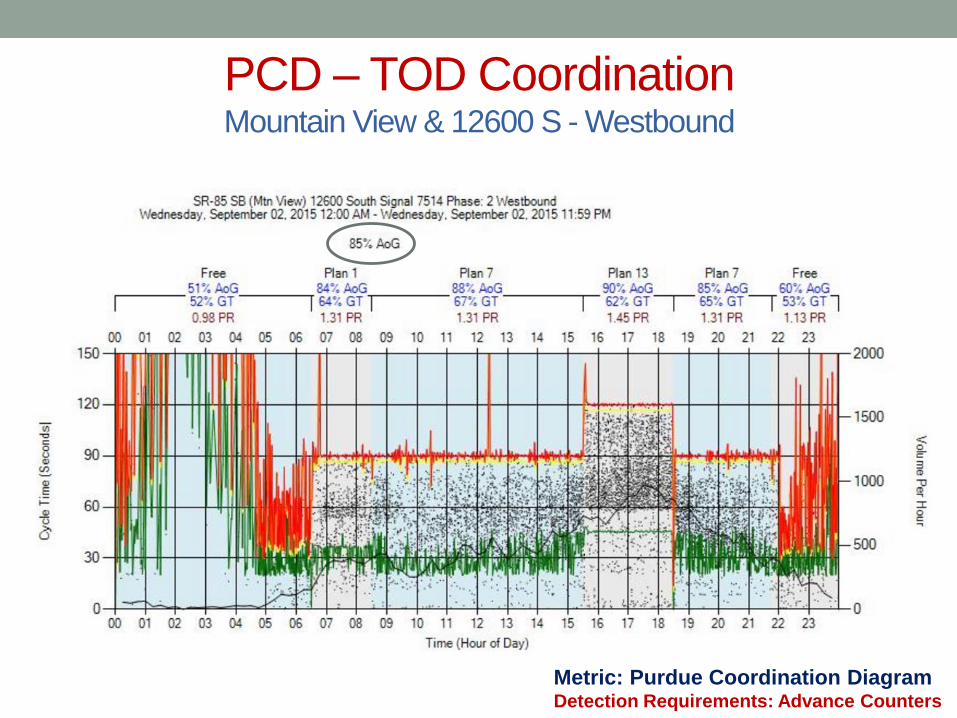
PCD – TOD Coordination Mountain View & 12600 S - Westbound
Metric: Purdue Coordination Diagram Detection Requirements: Advance Counters

PCD – Peer to Peer Logic Mountain View & 12600 S - Westbound
Metric: Purdue Coordination Diagram Detection Requirements: Advance Counters

Offset Optimization using Purdue Link Pivot
Village
Blvd
Bates
Canyon Rd
Erda Way
2400 N
2000 N
SR-36
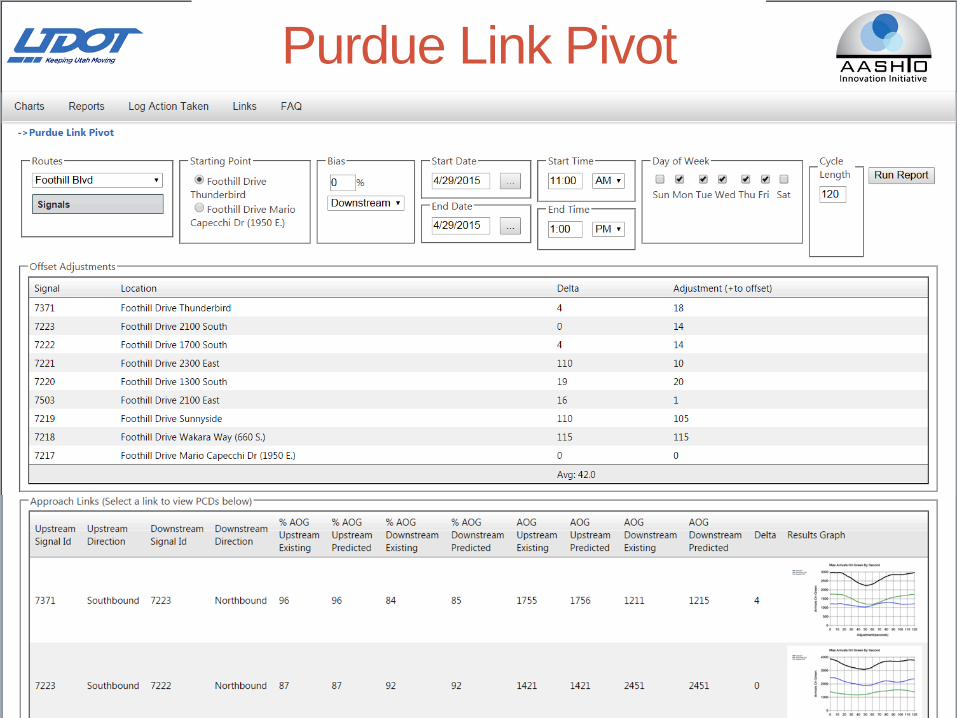
Purdue Link Pivot
Metrics & Detection
Requirements Controller high-resolution data only
Purdue Phase Termination
Split Monitor Pedestrian Delay (Ped Buttons)
Advanced Count Detection (~400 ft behind stop bar)
Purdue Coordination Diagram Arrivals on Red
Approach Volume Approach Delay
Platoon Ratio Executive Summary Reports
Advanced Detection with Speed
Approach Speed
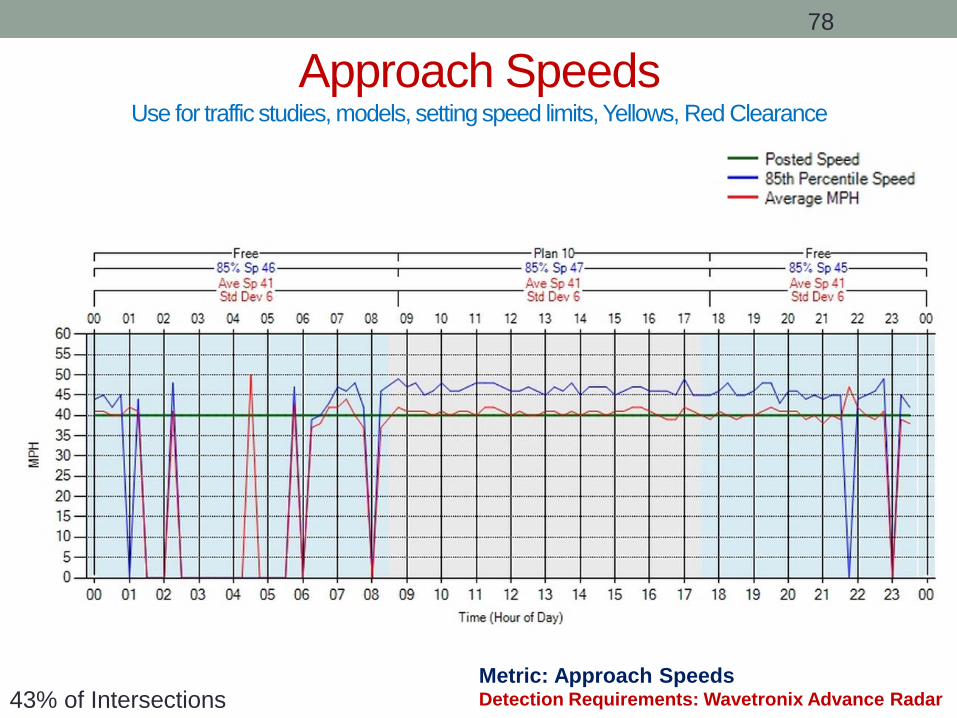
Approach Speeds Use for traffic studies, models, setting speed limits, Yellows, Red Clearance
Metric: Approach Speeds Detection Requirements: Wavetronix Advance Radar
78
43% of Intersections
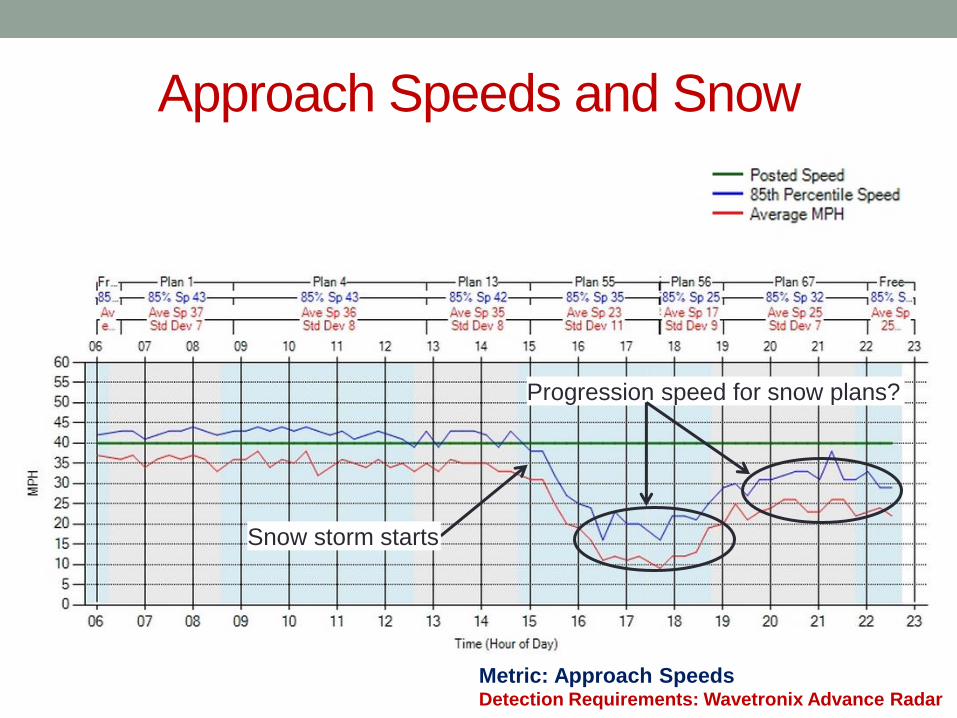
Approach Speeds and Snow
Snow storm starts
Progression speed for snow plans?
Metric: Approach Speeds Detection Requirements: Wavetronix Advance Radar
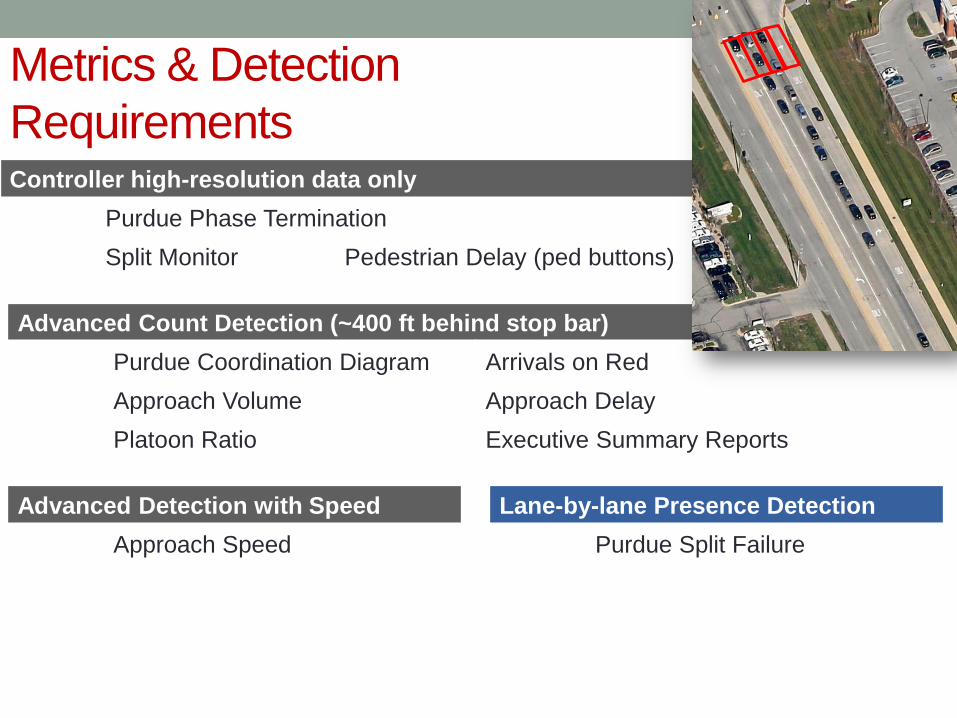
Metrics & Detection
Requirements Controller high-resolution data only
Purdue Phase Termination
Split Monitor Pedestrian Delay (ped buttons)
Advanced Count Detection (~400 ft behind stop bar)
Purdue Coordination Diagram Arrivals on Red
Approach Volume Approach Delay
Platoon Ratio Executive Summary Reports
Advanced Detection with Speed
Approach Speed
Lane-by-lane Presence Detection
Purdue Split Failure
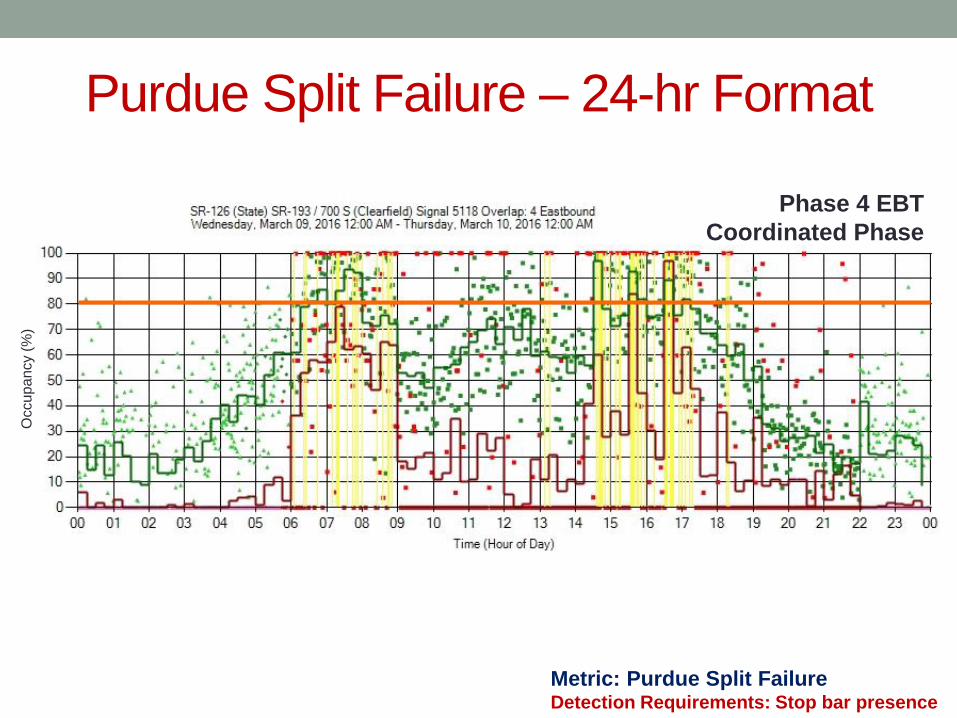
Purdue Split Failure – 24-hr Format
Occu
pa
ncy (
%)
Phase 4 EBT
Coordinated Phase
Metric: Purdue Split Failure Detection Requirements: Stop bar presence

Moab, Utah – The Adventure Capital of the United States (Two National Parks within 20 miles)
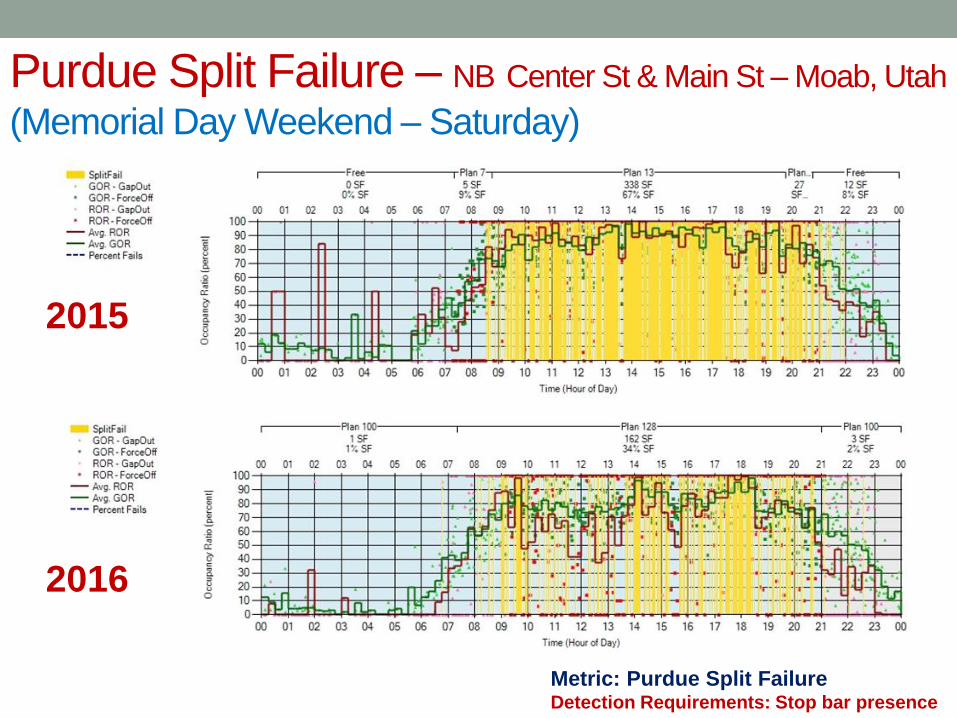
Purdue Split Failure – NB Center St & Main St – Moab, Utah
(Memorial Day Weekend – Saturday)
Metric: Purdue Split Failure Detection Requirements: Stop bar presence
2015
2016

Purdue Split Failure – SB Center St & Main St – Moab, Utah
(Memorial Day Weekend – Saturday)
Metric: Purdue Split Failure Detection Requirements: Stop bar presence
2015
2016
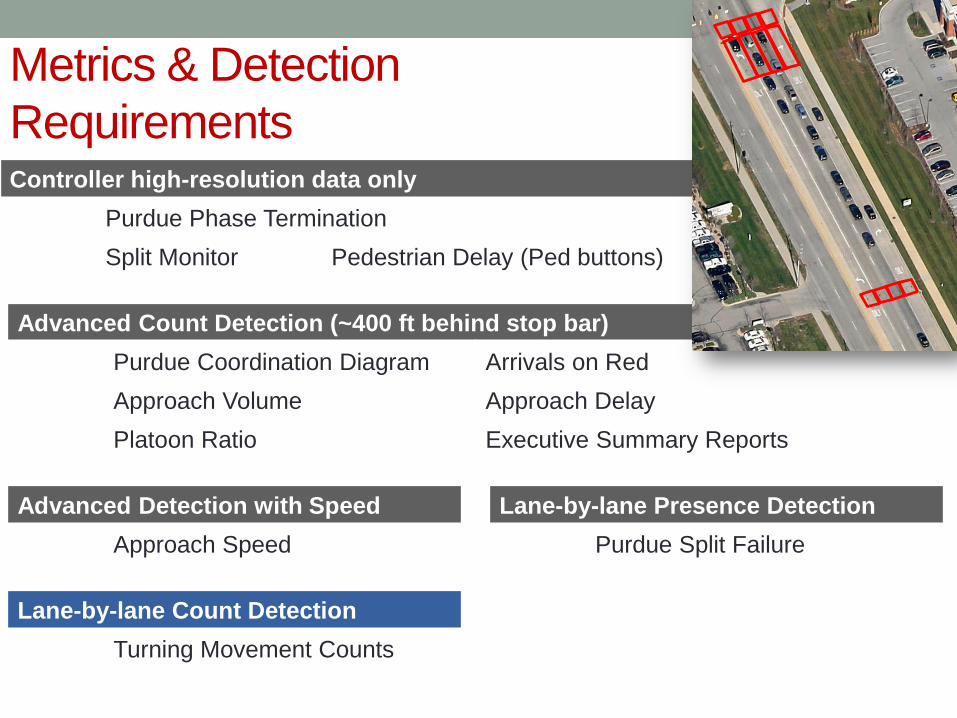
Lane-by-lane Count Detection
Turning Movement Counts
Metrics & Detection
Requirements Controller high-resolution data only
Purdue Phase Termination
Split Monitor Pedestrian Delay (Ped buttons)
Advanced Count Detection (~400 ft behind stop bar)
Purdue Coordination Diagram Arrivals on Red
Approach Volume Approach Delay
Platoon Ratio Executive Summary Reports
Advanced Detection with Speed
Approach Speed
Lane-by-lane Presence Detection
Purdue Split Failure
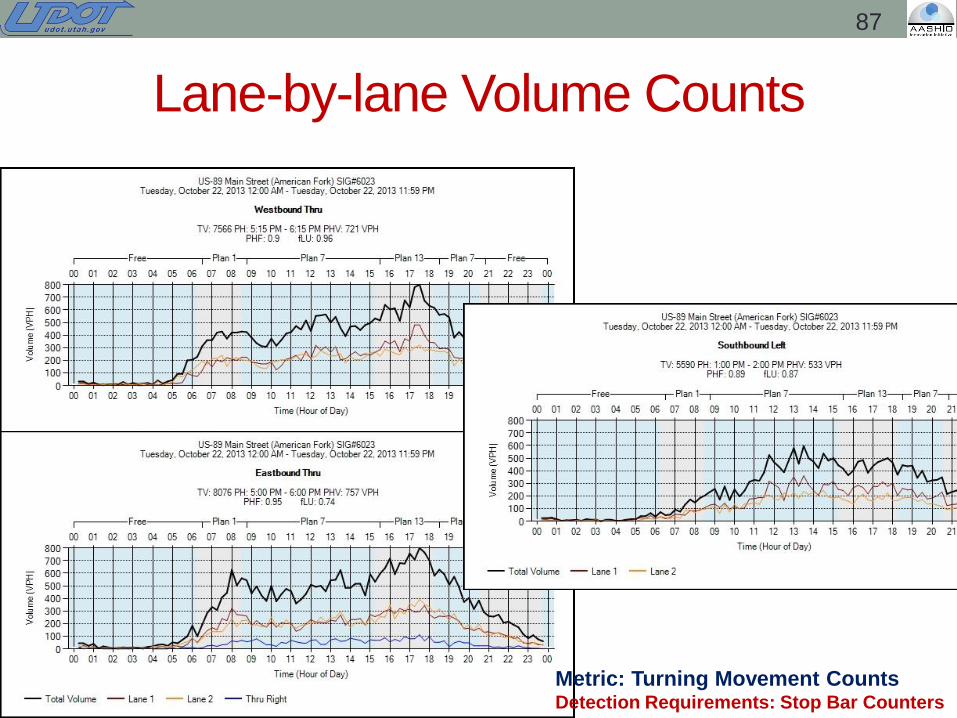
Lane-by-lane Volume Counts
87
Metric: Turning Movement Counts Detection Requirements: Stop Bar Counters

Impact of SPMs on
Signal Operations in Utah

Performance Metrics Uses
• Daily Operations
• Basic parameters
• Detection problems
• Complaint response/
troubleshooting
• Coordination
• Events, Incidents,
Weather, & Construction
• Alerts
• Modeling/planning
• Approach Volumes
• Turning Movement
Counts
• Speed
• Reporting
• Prioritize signal needs
• Communicate system
status to region/senior
leaders and public

0
50
100
150
200
250
300
DetectorIssue
Modeling SplitAdjustment
CycleLength
Time OfDay
Offset CoordOn/Off
ActuatedCoord
Force OffType
Sequence
# A
cti
on
s T
ak
en
Actions Resulting from
Signal Performance Metrics January 1 - June 18, 2014
Phase Termination Split Monitor Purdue Coordination Diagram Other
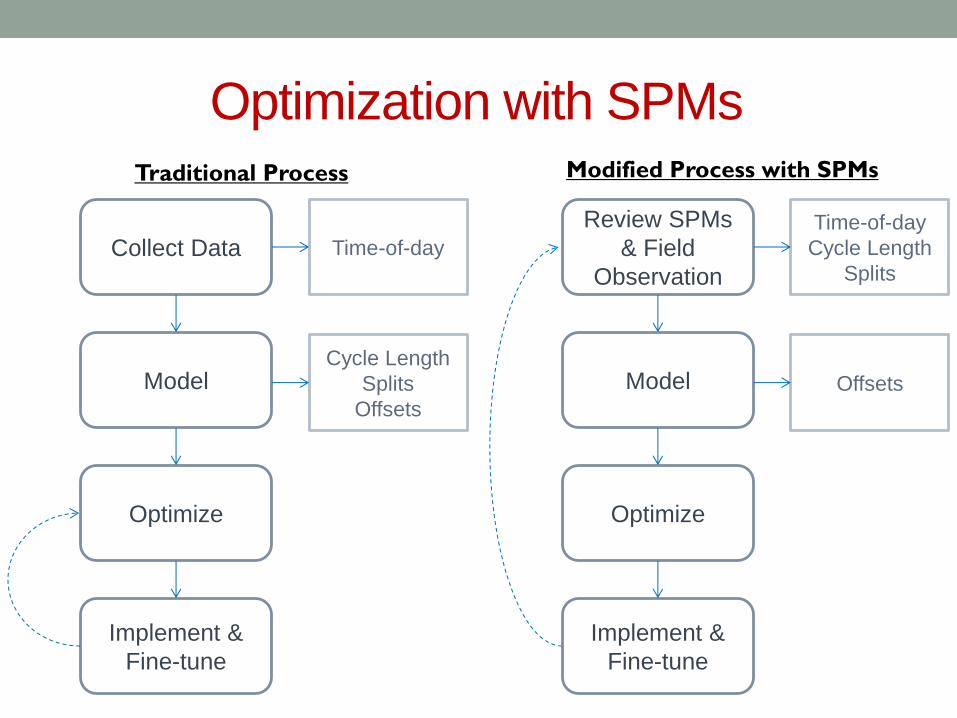
Traditional Process Modified Process with SPMs
Collect Data
Model
Optimize
Implement &
Fine-tune
Time-of-day
Cycle Length
Splits
Offsets
Review SPMs
& Field
Observation
Model
Optimize
Implement &
Fine-tune
Time-of-day
Cycle Length
Splits
Offsets
Optimization with SPMs
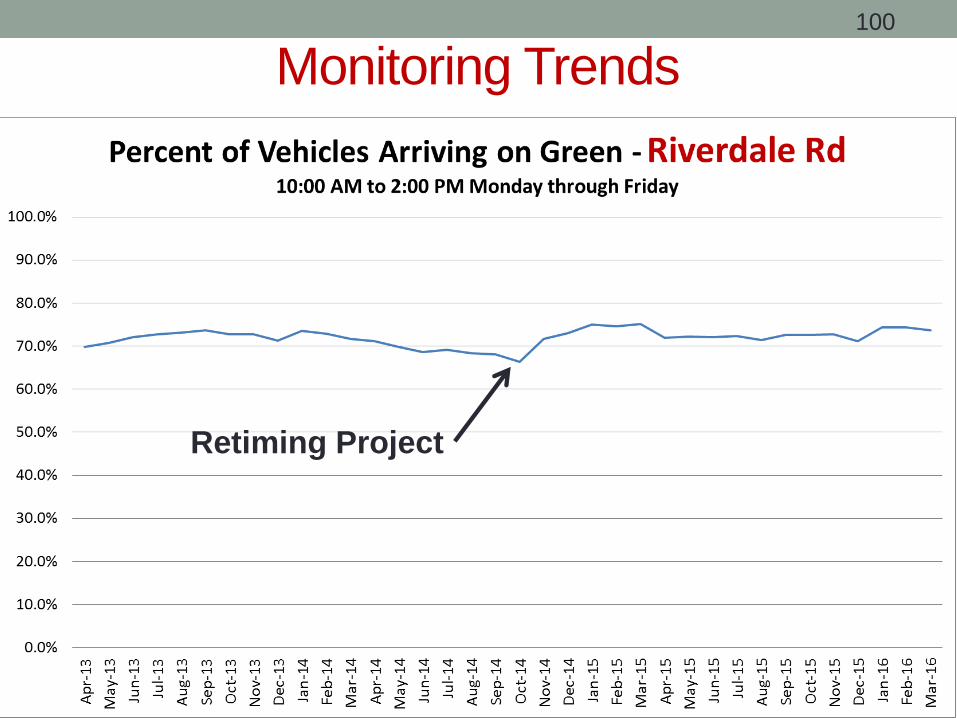
Monitoring Trends 100
Retiming Project

UDOT Signal Timing Focus Group (July 2014)
• How do you feel about UDOT?
• How do traffic signals make you feel?
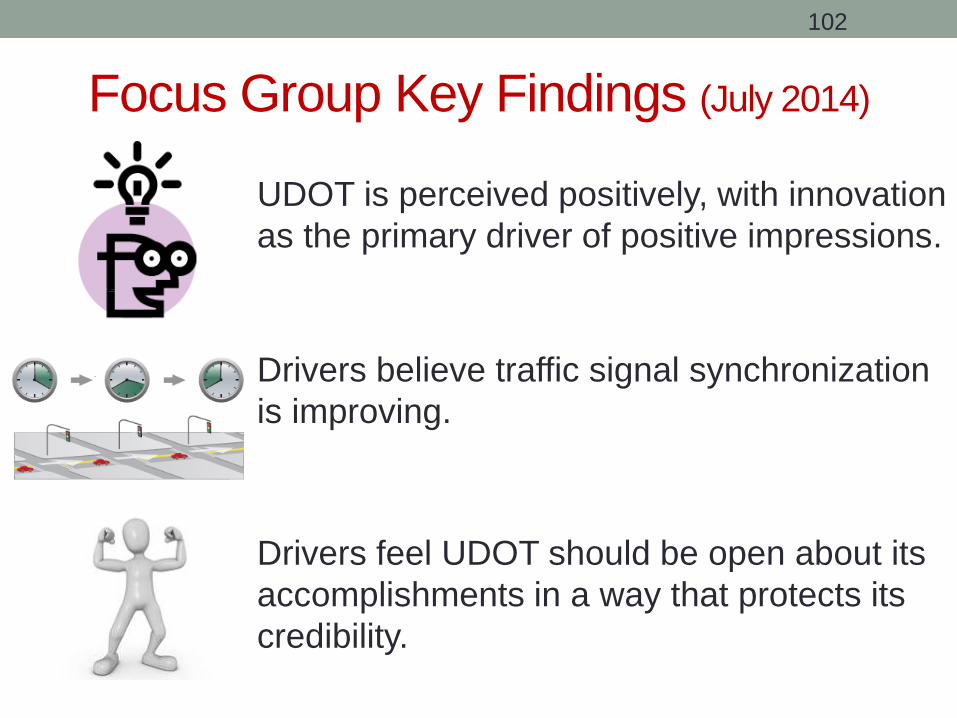
Focus Group Key Findings (July 2014)
UDOT is perceived positively, with innovation
as the primary driver of positive impressions.
Drivers believe traffic signal synchronization
is improving.
Drivers feel UDOT should be open about its
accomplishments in a way that protects its
credibility.
102

60 S Commercial – Green Lights
udottraffic.utah.gov/signalperformancemetrics
Mark Taylor –


