
Online Appendix
The online appendix is organized as follows. Appendix A presents a list of parties clas-
sified by whether they are mainstream or niche, as well as by major and minor party
status. Appendix B provides more information on the coding and characteristics of vari-
ables from the main analyses. Appendix C discusses the BUC estimator and preferred
empirical specification at greater length. Appendix D elaborates on additional analyses
that address and refute a series of alternative hypotheses that could potentially explain
my results. Finally, Appendix E demonstrates that the results in the paper are robust to
other measures of party emphasis and core supporters, alternative estimators and mea-
sures of key variables, and the exclusion of any particular country or issue. Appendix
E also includes evidence that the chosen seat share threshold and time frame used to
calculate historical electoral performance, 2000–2014, provide the best model fit.
Appendix A List of Parties
Table A.1: Classification of Parties by Party Family and Size
Country Large Mst.1 Large Niche Small Mst. Small Niche
Austria OVP, SPO FPO NEOS BZO, GRUNEBulgaria GERB, SDS ABV DPS, ATAKA
Croatia HDZ, SDP HSLS, HSSIDS, ORaH,HSP, HL-SR,HDSSB
Czech Republic ODS, CSSD KSCM
ANO 2011,KDU-CSL,TOP 09, SVO-BODNI
SZ
Denmark V, SD KF, LA, RV DF, SFEstonia EK, ER IRL, SDE EER
FinlandKESK, SDP,KOK
KD, PSVAS, VIHR,RKP/SFP
FlandersCD&V, VLD,SPA
VB, N-VA Groen
France PS, UMP EELV, FN, PG
Germany CDU, SPD FDPLinke, Grunen,AfD, Piraten
1

Table A.1: Classification of Parties by Party Family and Size
Country Large Mst.1 Large Niche Small Mst. Small Niche
Greece ND, PASOK Potami
ANEL, DI-MAR, KKE,LAOS,SYRIZA,XA
Hungary Fidesz, MSZPDK, JOBBIK,LMP, E14
Ireland FF, FGGP, SP, SinnFein
Italy PD, FIFdl, NCD,UDC
SEL, M5S, LN
Latvia SDPS, ZZS V LKS
LithuaniaDP, LSDP, TS-LKD
LRLS, LVZS,TT
LLRA
Poland PO, PiS, SLDKNP, PSL, SP,RP
Portugal PSD, PS PP MPT, BERomania PNL, PSD PC, PDL, PMP UDMR, PP-DD
SlovakiaSDKU-DS,Smer-SD
KDH, SaS,NOVA, OLaNO
MH, SMK-MKP, SNS
Slovenia SDS, SD PS, SLS DeSUS
Spain PP, PSOE UpyDEAJ/PNV,CC, ERC, C’s,BNG, Podemos
Sweden M, SAP C, KD, FPSD, PIRAT, FI,MP, V
The Nether-lands
CDA, PvdA,VVD
D66GL, PvdD,PVV, SP
United King-dom
CONS, LAB LIBDEMPlaid, SNP,Green, UKIP
Wallonia PS, MR cdH, PP ECOLO
2
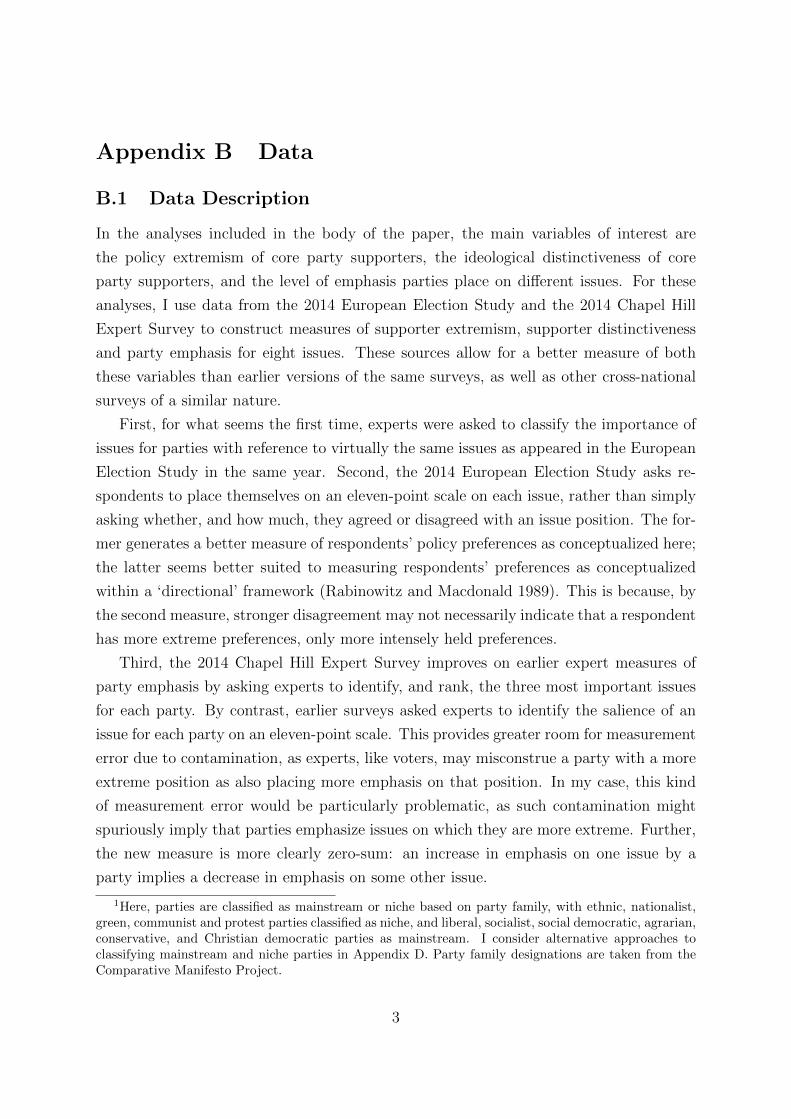
Appendix B Data
B.1 Data Description
In the analyses included in the body of the paper, the main variables of interest are
the policy extremism of core party supporters, the ideological distinctiveness of core
party supporters, and the level of emphasis parties place on different issues. For these
analyses, I use data from the 2014 European Election Study and the 2014 Chapel Hill
Expert Survey to construct measures of supporter extremism, supporter distinctiveness
and party emphasis for eight issues. These sources allow for a better measure of both
these variables than earlier versions of the same surveys, as well as other cross-national
surveys of a similar nature.
First, for what seems the first time, experts were asked to classify the importance of
issues for parties with reference to virtually the same issues as appeared in the European
Election Study in the same year. Second, the 2014 European Election Study asks re-
spondents to place themselves on an eleven-point scale on each issue, rather than simply
asking whether, and how much, they agreed or disagreed with an issue position. The for-
mer generates a better measure of respondents’ policy preferences as conceptualized here;
the latter seems better suited to measuring respondents’ preferences as conceptualized
within a ‘directional’ framework (Rabinowitz and Macdonald 1989). This is because, by
the second measure, stronger disagreement may not necessarily indicate that a respondent
has more extreme preferences, only more intensely held preferences.
Third, the 2014 Chapel Hill Expert Survey improves on earlier expert measures of
party emphasis by asking experts to identify, and rank, the three most important issues
for each party. By contrast, earlier surveys asked experts to identify the salience of an
issue for each party on an eleven-point scale. This provides greater room for measurement
error due to contamination, as experts, like voters, may misconstrue a party with a more
extreme position as also placing more emphasis on that position. In my case, this kind
of measurement error would be particularly problematic, as such contamination might
spuriously imply that parties emphasize issues on which they are more extreme. Further,
the new measure is more clearly zero-sum: an increase in emphasis on one issue by a
party implies a decrease in emphasis on some other issue.
1Here, parties are classified as mainstream or niche based on party family, with ethnic, nationalist,green, communist and protest parties classified as niche, and liberal, socialist, social democratic, agrarian,conservative, and Christian democratic parties as mainstream. I consider alternative approaches toclassifying mainstream and niche parties in Appendix D. Party family designations are taken from theComparative Manifesto Project.
3

Table B.1: Descriptive Statistics
Variable Mean Median Min. Max.
Full SampleParty Emphasis 0.48 0.00 0.00 3.00Supporter Extremism 1.44 1.10 0.00 8.86Supporter Distinctiveness 1.91 1.58 0.00 8.19
Major PartiesParty Emphasis 0.56 0.00 0.00 3.00Supporter Extremism 0.99 0.78 0.00 6.70Supporter Distinctiveness 1.85 1.54 0.00 8.19
Minor PartiesParty Emphasis 0.44 0.00 0.00 3.00Supporter Extremism 1.72 1.39 0.00 8.86Supporter Distinctiveness 1.95 1.61 0.01 7.85
Table B.1 reports descriptive statistics for party emphasis, core supporter extremism
and core supporter distinctiveness for each issue. As might be expected, major party
supporters are, on average, less extreme relative to the mean voter than minor party
supporters. Figure B.1 presents kernel density plots of average European voter prefer-
ences on each issue. Recall that the argument laid out in Section 2 assumes that voter
preferences on any given issue are approximately single-peaked and symmetric – implying
that there are more voters with moderate rather than extreme policy preferences on each
issue. Figure B.1 makes evident that this assumption is satisfied except in two cases: EU
integration, where voter preferences are, on average, highly right-skewed, and same sex
marriage, where voter preferences are, on average, trimodal. Nevertheless, my results are
robust to excluding these two issues from the analyses.
4
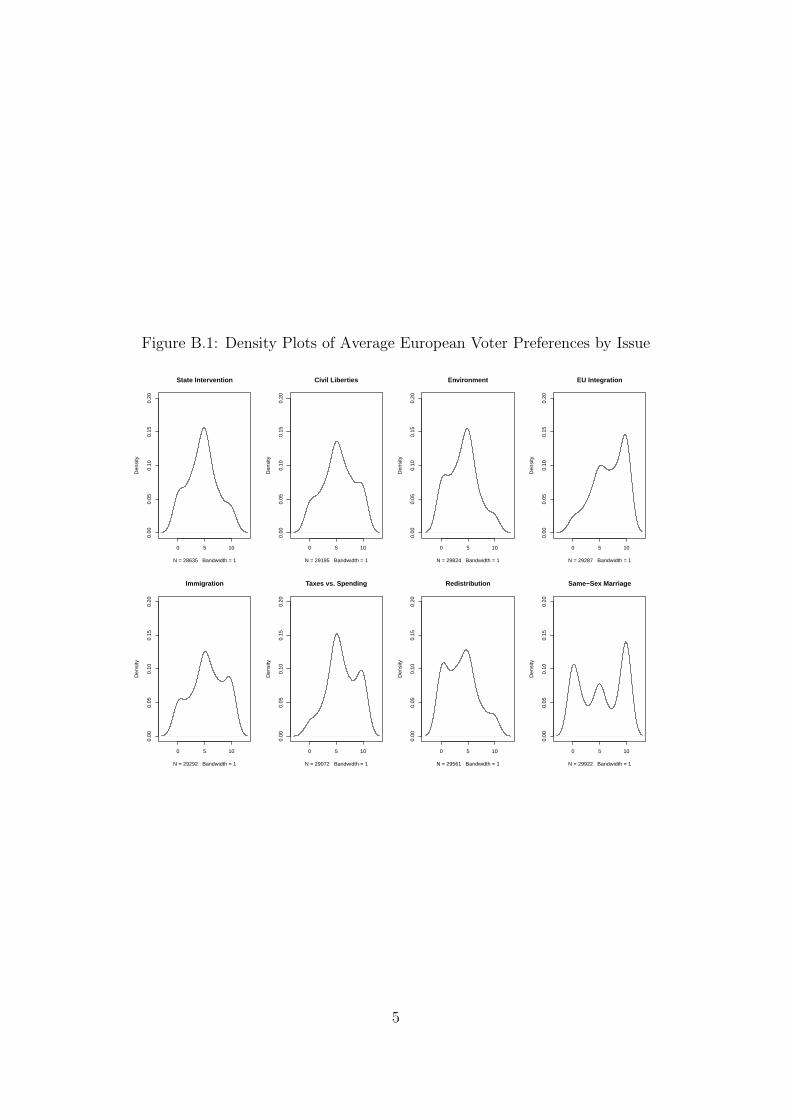
Figure B.1: Density Plots of Average European Voter Preferences by Issue
0 5 10
0.00
0.05
0.10
0.15
0.20
State Intervention
N = 28635 Bandwidth = 1
Den
sity
0 5 10
0.00
0.05
0.10
0.15
0.20
Civil Liberties
N = 29195 Bandwidth = 1
Den
sity
0 5 10
0.00
0.05
0.10
0.15
0.20
Environment
N = 29824 Bandwidth = 1
Den
sity
0 5 100.
000.
050.
100.
150.
20
EU Integration
N = 29287 Bandwidth = 1
Den
sity
0 5 10
0.00
0.05
0.10
0.15
0.20
Immigration
N = 29292 Bandwidth = 1
Den
sity
0 5 10
0.00
0.05
0.10
0.15
0.20
Taxes vs. Spending
N = 29072 Bandwidth = 1
Den
sity
0 5 10
0.00
0.05
0.10
0.15
0.20
Redistribution
N = 29561 Bandwidth = 1
Den
sity
0 5 10
0.00
0.05
0.10
0.15
0.20
Same−Sex Marriage
N = 29922 Bandwidth = 1
Den
sity
5

B.2 Coding Decisions
Table B.2: Coding Issue Emphasis by Parties
EES 2014 Voter Survey2 CHES 2014 MIP Issue Category
Q17.1 You are fully in favour ofstate intervention in the economy.
1. State Intervention
Q17.2 You are fully in favour of theredistribution of wealth from therich to the poor in (country).
2. Redistribution
Q17.3 You are fully in favour of rais-ing taxes to increase public services.
3. Public Services vs. Taxes
Q17.4 You are fully in favour ofsame-sex marriage.
4. Social Lifestyle
Q17.5 You fully support privacyrights even if they hinder efforts tocombat crime.
5. Civil Liberties
Q17.6 You are fully in favour of arestrictive policy on immigration.3
6. Immigration; Multiculturalism
Q17.7 The EU should have more au-thority over the EU Member States’economic and budgetary policies.
7. EU Integration
Q17.8 Environmental protectionshould always take priority even atthe cost of economic growth.
8. Environment
2For each issue, respondents were asked to place themselves on a scale from 0 to 10. The ‘0’ end ofthe scale for each issue is given below.
3Observations for this issue were recoded so that ‘10’ measures the most right-wing position possibleon this issue.
6
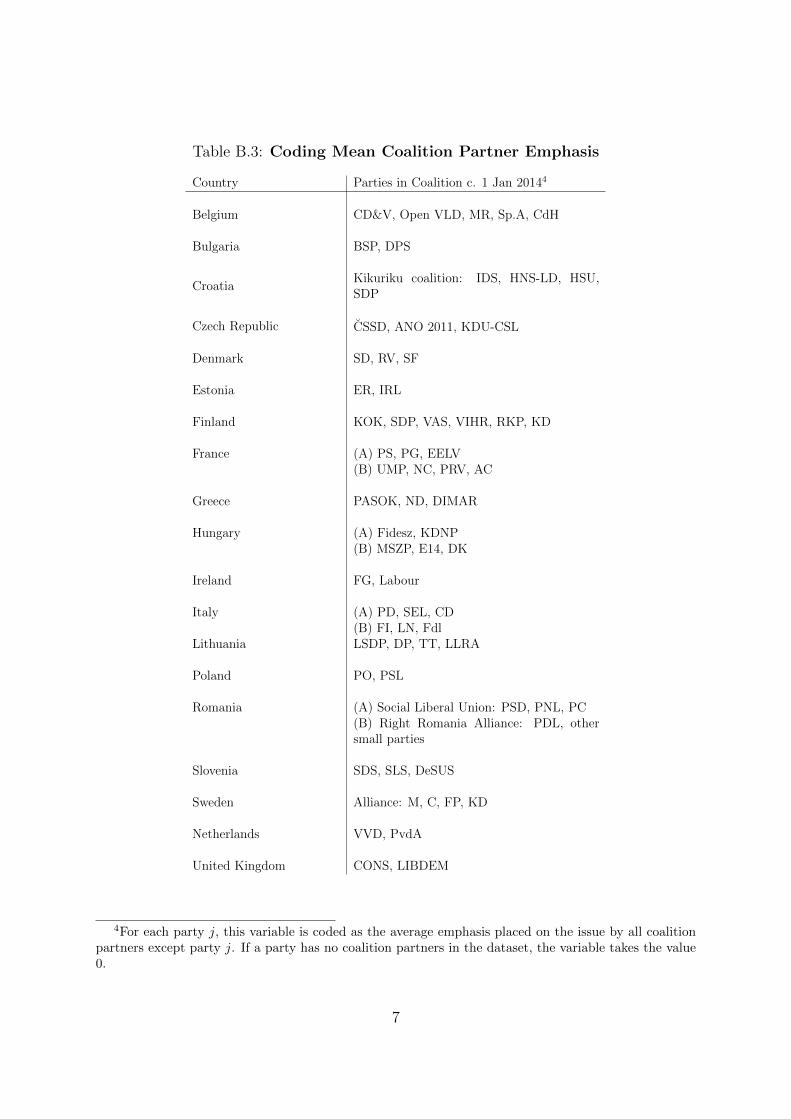
Table B.3: Coding Mean Coalition Partner Emphasis
Country Parties in Coalition c. 1 Jan 20144
Belgium CD&V, Open VLD, MR, Sp.A, CdH
Bulgaria BSP, DPS
CroatiaKikuriku coalition: IDS, HNS-LD, HSU,SDP
Czech Republic CSSD, ANO 2011, KDU-CSL
Denmark SD, RV, SF
Estonia ER, IRL
Finland KOK, SDP, VAS, VIHR, RKP, KD
France (A) PS, PG, EELV(B) UMP, NC, PRV, AC
Greece PASOK, ND, DIMAR
Hungary (A) Fidesz, KDNP(B) MSZP, E14, DK
Ireland FG, Labour
Italy (A) PD, SEL, CD(B) FI, LN, Fdl
Lithuania LSDP, DP, TT, LLRA
Poland PO, PSL
Romania (A) Social Liberal Union: PSD, PNL, PC(B) Right Romania Alliance: PDL, othersmall parties
Slovenia SDS, SLS, DeSUS
Sweden Alliance: M, C, FP, KD
Netherlands VVD, PvdA
United Kingdom CONS, LIBDEM
4For each party j, this variable is coded as the average emphasis placed on the issue by all coalitionpartners except party j. If a party has no coalition partners in the dataset, the variable takes the value0.
7

Appendix C Empirical Strategy
I estimate the effect of, variously, supporter extremism, supporter distinctiveness or party
positional extremism on parties’ emphasis decisions using the BUC fixed effects ordered
logit estimator proposed by Baetschmann, Staub and Winkelmann (2015). The latent
model that I estimate is the following:
Y ∗ijk = Xijkβ1 +XijkMjβ2 + Zijkβ +Mjγk + αik + εijk
Yijk = n ⇐⇒ λnik ≤ Y ∗ijk < λn+1
ik
Here, for each country i, Y ∗ijk measures each party j’s (unobserved) level of emphasis
on issue k, Xijk measures the extremism, or distinctiveness, of party j’s core supporters
on issue k (or the extremism of the party’s own position), and Zijk is a vector of control
variables. Mj is an indicator variable that takes the value 1 if party j is a major party,
and 0 otherwise. Parties’ observed level of emphasis on each issue k is measured by an
ordered categorical response variable Yijk, which takes the value n when the unobserved
value of Y ∗ijk is between λnik and λn+1
ik .
The theory developed in Section 2 suggests that a party’s emphasis on an issue rel-
ative to its opponents will depend on the extremism of its core supporters relative to its
opponents’ supporters, with a party’s optimal emphasis strategy depending on whether
it is a minor or a major party. In particular, all parties face an incentive to dispropor-
tionately emphasize the issue which, if it were the only issue important to voters, would
mean the party would be preferred to all its opponents by the voters it is targeting. The
implications of this incentive for parties’ salience strategies are the following. On a par-
ticular issue, the major party that is most centrist on the issue relative to its opponents
will prefer to place more emphasis on that issue than its opponents. This may lead such
a party to disproportionately emphasize an issue on which its position is more extreme
than on other issues, but more centrist than its opponents on that issue. Analogously,
among minor parties, the party with the most extreme position on the issue relative
to its opponents will prefer to place more emphasis on that issue than its opponents –
which may lead such a party to place less emphasis on an issue on which its position is,
in absolute terms, more extreme. While some parties will be more centrist than others
on average, across all issues, each party will have some issue positions which are more
centrist relative to its opponents’ positions on those issues, and some positions which are
more extreme relative to those of its opponents.
To assess the empirical evidence for this precise relationship, I include an interaction
8

term between Xijk and the indicator variable Mj, and also include country-issue fixed
effects, denoted αik in the regression equation above. Country-issue fixed effects ensure
that only variation in emphasis and supporter extremism between parties on an issue in a
given country is used to identify the desired effect. Without these fixed effects, we might,
for instance, spuriously identify a positive association between supporter extremism and
party emphasis if it is the case that all parties place more emphasis on issues on which
parties’ core supporters are, on average, more polarized in a country – even if it is the
case that, in a given country and for a particular issue, the party with more extreme
supporters places less emphasis on the issue than its opponents. The inclusion of country-
issue fixed effects also controls for country, issue, and country-issue specific factors that
may lead parties to emphasize some issues more than others. For instance, in a particular
country the issue of immigration might be especially salient, leading all parties to place
relatively more emphasis on this issue, regardless of their core supporters’ preferences. I
also estimate issue-specific intercepts for major and minor parties, denoted Mjγk in the
regression equation above, to account for the differences in the issues favored by each
type of party.
In performing this analysis, the BUC fixed effects ordered logit estimator (hereafter
BUC estimator) proposed by Baetschmann, Staub and Winkelmann (2015) is preferred
to an unconditional fixed effects ordered logit estimator and to a linear fixed effects model
estimated by OLS. The BUC estimator generalizes the conditional logit estimator to ac-
commodate ordered dependent variables. The conditional logit estimator (Chamberlain
1980) allows us to consistently estimate coefficients in a model with both a binary depen-
dent variable and fixed effects, when using an unconditional fixed effects logit estimator
would produce coefficient estimates that are inconsistent as well as severely biased. When
dealing with an ordered dependent variable in a model with fixed effects, researchers have
frequently recoded the dependent variable as a binary variable and used a conditional
logit estimator to obtain consistent parameter estimates (Kassenbohmer and Haisken-
DeNew 2009; Senik 2004). However, this requires the researcher to arbitrarily choose a
threshold above which the dependent variable takes the value one, and discards poten-
tially important variation. A variety of approaches have been suggested for estimating an
ordered logit model with fixed effects; in their survey of available estimators, Riedl and
Geishecker (2014) show that the BUC estimator consistently delivers the most efficient,
consistent and least biased parameter estimates.
The BUC estimator is a binary recoded conditional logit estimator, where the original
dependent variable with N categories is recoded into N − 1 different dichotomizations
9
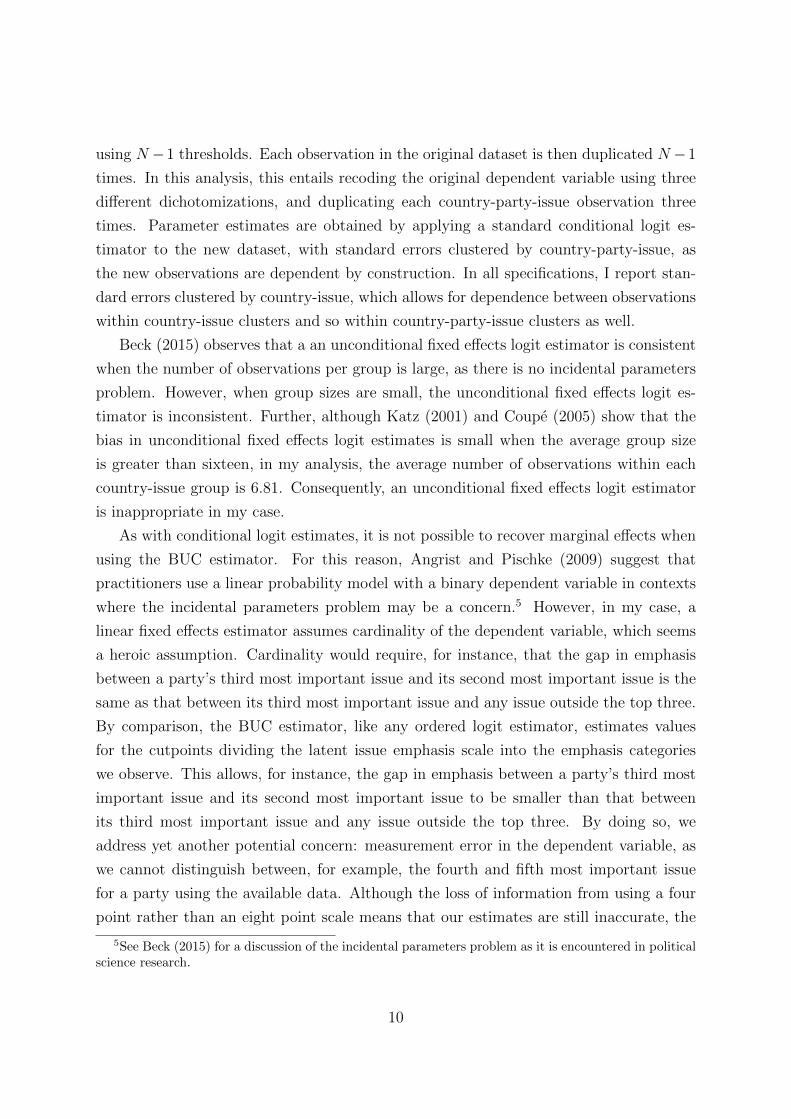
using N −1 thresholds. Each observation in the original dataset is then duplicated N −1
times. In this analysis, this entails recoding the original dependent variable using three
different dichotomizations, and duplicating each country-party-issue observation three
times. Parameter estimates are obtained by applying a standard conditional logit es-
timator to the new dataset, with standard errors clustered by country-party-issue, as
the new observations are dependent by construction. In all specifications, I report stan-
dard errors clustered by country-issue, which allows for dependence between observations
within country-issue clusters and so within country-party-issue clusters as well.
Beck (2015) observes that a an unconditional fixed effects logit estimator is consistent
when the number of observations per group is large, as there is no incidental parameters
problem. However, when group sizes are small, the unconditional fixed effects logit es-
timator is inconsistent. Further, although Katz (2001) and Coupe (2005) show that the
bias in unconditional fixed effects logit estimates is small when the average group size
is greater than sixteen, in my analysis, the average number of observations within each
country-issue group is 6.81. Consequently, an unconditional fixed effects logit estimator
is inappropriate in my case.
As with conditional logit estimates, it is not possible to recover marginal effects when
using the BUC estimator. For this reason, Angrist and Pischke (2009) suggest that
practitioners use a linear probability model with a binary dependent variable in contexts
where the incidental parameters problem may be a concern.5 However, in my case, a
linear fixed effects estimator assumes cardinality of the dependent variable, which seems
a heroic assumption. Cardinality would require, for instance, that the gap in emphasis
between a party’s third most important issue and its second most important issue is the
same as that between its third most important issue and any issue outside the top three.
By comparison, the BUC estimator, like any ordered logit estimator, estimates values
for the cutpoints dividing the latent issue emphasis scale into the emphasis categories
we observe. This allows, for instance, the gap in emphasis between a party’s third most
important issue and its second most important issue to be smaller than that between
its third most important issue and any issue outside the top three. By doing so, we
address yet another potential concern: measurement error in the dependent variable, as
we cannot distinguish between, for example, the fourth and fifth most important issue
for a party using the available data. Although the loss of information from using a four
point rather than an eight point scale means that our estimates are still inaccurate, the
5See Beck (2015) for a discussion of the incidental parameters problem as it is encountered in politicalscience research.
10

loss of efficiency is diminished when using an ordered logit estimator instead of OLS.
Further, Beck (2015, 11-17) notes that when there are very few observations within a
group fixed effect, an OLS estimator produces less accurate estimates than a conditional
logit estimator.
Regardless, using either an unconditional fixed effects ordered logit estimator or a
linear fixed effects model produces substantively similar results to those I report in the
paper, as demonstrated in Section E of this document.
Appendix D Alternative Hypotheses
D.1 Do Emphasis Decisions Determine Major Party Status?
It is possible that the parties that emphasize their more moderate positions are more
likely to become major parties, and parties that emphasize their more extreme positions
are more likely to remain minor parties. However, the following analyses suggest that
this cannot credibly account for the findings in Section 4. Rather, it is more plausible
that traditionally large parties prefer to emphasize their more moderate positions, and
traditionally small parties prefer to emphasize their more distinctive and typically extreme
positions.
First, consider Table D.1, which suggests that changes in party seat share pre-date
rather than post-date the issue emphasis decisions I have highlighted. For convenience,
Models 1 and 3 repeat the analyses from Table 2, which find the expected relationships
between party size, supporter extremism, supporter distinctiveness and issue emphasis
when using average historical electoral performance to classify major and minor parties.
However, when these analyses are replicated using parties’ current seat share6 to classify
parties, we find no statistically significant difference between the emphasis strategies of
major and minor parties in response to supporter extremism (Model 2), and estimate
a smaller z-statistic for the interaction term between major party status and supporter
distinctiveness than before (Model 4).
That the difference between major and minor parties we observe is better predicted
by their average historical electoral performance than their current electoral performance
6When measuring a party’s ‘current’ seat share, I use the seat share received by each party in thenational legislature following the election most proximate to 1 January 2014. This includes elections thatwere held after the completion of fieldwork for the 2014 European Election Study and the 2014 ChapelHill Expert Survey. However, I contend that these figures better reflect the party’s electoral position atthe time of fieldwork than its vote share in an election held more than four years prior.
11
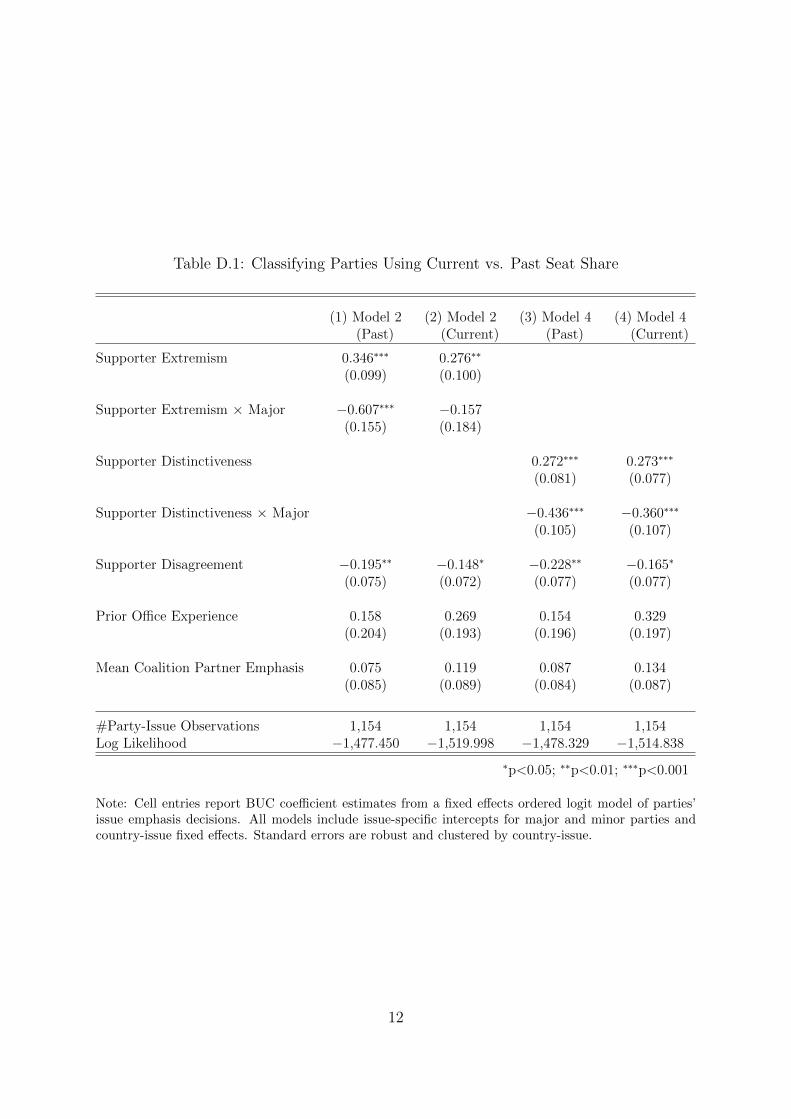
Table D.1: Classifying Parties Using Current vs. Past Seat Share
(1) Model 2 (2) Model 2 (3) Model 4 (4) Model 4(Past) (Current) (Past) (Current)
Supporter Extremism 0.346∗∗∗ 0.276∗∗
(0.099) (0.100)
Supporter Extremism × Major −0.607∗∗∗ −0.157(0.155) (0.184)
Supporter Distinctiveness 0.272∗∗∗ 0.273∗∗∗
(0.081) (0.077)
Supporter Distinctiveness × Major −0.436∗∗∗ −0.360∗∗∗
(0.105) (0.107)
Supporter Disagreement −0.195∗∗ −0.148∗ −0.228∗∗ −0.165∗
(0.075) (0.072) (0.077) (0.077)
Prior Office Experience 0.158 0.269 0.154 0.329(0.204) (0.193) (0.196) (0.197)
Mean Coalition Partner Emphasis 0.075 0.119 0.087 0.134(0.085) (0.089) (0.084) (0.087)
#Party-Issue Observations 1,154 1,154 1,154 1,154Log Likelihood −1,477.450 −1,519.998 −1,478.329 −1,514.838
∗p<0.05; ∗∗p<0.01; ∗∗∗p<0.001
Note: Cell entries report BUC coefficient estimates from a fixed effects ordered logit model of parties’issue emphasis decisions. All models include issue-specific intercepts for major and minor parties andcountry-issue fixed effects. Standard errors are robust and clustered by country-issue.
12

is corroborated by analyses which use party seat share from 1995, first, as a proxy, and
second, as an instrument for current electoral performance.7 These results are reported in
Table D.2. Again, for convenience, Table D.2 reproduces Model 2 from Table 2 in Section
4 (now Model 1). Model 2 in Table D.2 repeats the same analysis using party seat share
from 1995 as a proxy for current seat share when coding major party status.8 This coding
decision means parties which have only recently achieved substantial electoral success are
classed as ‘minor’ rather than ‘major’. We continue to find the expected statistically
significant relationship between party size, supporter extremism and issue emphasis, and
also a statistically and substantively significant difference between how major and minor
parties, thus coded, respond to changes in supporter extremism (p < 0.001).
Models 3 and 4 use party seat share from 1995 as an instrument for current seat share
when coding major party status. There are two prevailing approaches that have been
used to extend the linear two-stage least squares (2SLS) approach to non-linear models:
two-stage predictor substitution (2SPS) and two-stage residual inclusion (2SRI) (Blundell
and Smith 1989; Terza, Basu and Rathouz 2008).9 While 2SPS is more frequently used
in a non-linear context, only 2SRI delivers consistent estimates in general. Model 3
presents estimates using the 2SPS approach to instrument for current major party status,
and Model 4 presents estimates using the 2SRI approach.10 Both approaches produce
statistically and substantively similar results, and also similar results to the original
analyses.
The evidence presented in this section strongly counters the suggestion that party
emphasis strategies are driving their electoral performance, rather than the other way
around. Suppose otherwise. Then, we would expect parties’ current seat share (and
major party status) to be very well correlated with their emphasis strategies, but historical
seat share to be less so – since parties’ current emphasis decisions are likely imperfectly
correlated with their past emphasis decisions. The results presented in Tables D.1 and
D.2 show the reverse to be the case: the difference between major and minor party
7This variable is coded using the seat share received by each party following the election most proxi-mate to 1 January 1995, and includes information from elections ranging between 1993 and 1997.
8In cases where a party did not contest the most proximate election to 1 January 1995 – like, forexample, the Five Star Movement in Italy – its 1995 seat share was coded as zero.
9Like the 2SLS approach, the 2SPS approach requires that we substitute fitted values from thefirst-stage regression for the endogenous regressor in the second-stage equation. However, unlike 2SLS,this does not necessarily produce consistent estimates in the non-linear case. In the 2SRI approach,we instead include the first-stage residuals as additional regressors in the second-stage equation, whileretaining the endogenous regressors. To adjust for the additional uncertainty our estimates as a result ofthese procedures, I present bootstrapped standard errors, accounting for the dependence of observationswithin each country-issue cluster by randomly drawing country-issue clusters.
10The first-stage F-statistic is 363.64.
13

Table D.2: Using Past Seat Share to Instrument for Current Major Party Status
(1) Original (2) Proxy (3) 2SPS (4) 2SRI
Supporter Extremism 0.346∗∗∗ 0.362∗∗∗ 0.482∗∗∗ 0.463∗∗∗
(0.099) (0.949) (0.130) (0.149)
Supporter Extremism × Major −0.607∗∗∗ −0.589∗∗∗ −0.849∗∗∗ −0.896∗∗∗
(0.155) (0.145) (0.238) (0.250)
Supporter Extremism × First Stage Residual 0.708(0.379)
Supporter Disagreement −0.195∗∗ −0.118 −0.090 −0.140(0.075) (0.076) (0.099) (0.100)
Prior Office Experience 0.158 0.252 0.301 0.211(0.204) (0.198) (0.295) (0.299)
Mean Coalition Partner Emphasis 0.075 0.088 0.050 0.047(0.085) (0.085) (0.092) (0.091)
#Party-Issue Observations 1,154 1,154 1,154 1,154Log Likelihood −1,477.450 −1,441.729 −1,433.095 −1,410.601
∗p<0.05; ∗∗p<0.01; ∗∗∗p<0.001
Note: Cell entries report BUC coefficient estimates from a fixed effects ordered logit model of party issueemphases. All models include issue-specific intercepts for major and minor parties and country-issuefixed effects. For Models 1 and 2, standard errors are robust and clustered by country-issue; for Models3 and 4, bootstrapped standard errors are reported.
14

emphasis strategy we observe is well predicted by their past electoral performance (or that
component of current electoral performance that is predicted by their past performance),
but not by parties’ current electoral performance. The only remaining possibility is that
there exists some other extremely persistent factor that is highly correlated with whether
a party is major or minor, or which determines a party’s historical electoral performance
and also its current emphasis strategy. In Table 3 from the paper, I show that none of
the following long-standing characteristics of parties fulfill this role: (1) a party’s left-
right ideology, (2) party family, (3) whether a party is mainstream or niche, (4) whether
a party has previously held ministerial office and (5) whether a party is leadership or
activist-dominated. In the next section, I elaborate further on the analyses included in
Table 3 and report some additional robustness checks.
D.2 Other Alternative Hypotheses
For convenience, I replicate Table 3 here, now labeled Table D.3.
Models 1 and 2 in Table D.3 consider the possibility that the observed distinction
in emphasis strategy between major and minor parties is driven by selection by party
ideology or party family into these categories (Williams, Seki and Whitten 2016). For
instance, we might worry that these results are an artefact of social democratic parties in
Europe being overwhelmingly ‘major parties’, emphasizing redistribution, and locating
close to the median voter on this issue. To assuage these concerns, I allow for an issue-
specific effect of parties’ overall left-right position on their issue emphasis in Model 111,
and control for the average emphasis placed on each issue by parties in the same family
in Model 2.12 We continue to find a statistically significant difference between major
and minor party emphasis strategy in response to changes in core supporter preferences,
suggesting that selection by ideology or party family cannot explain the differences we
observe.
Model 3 considers the possibility that the difference in behavior between major and
minor parties that I find may just reflect the different strategies preferred by ‘mainstream’
and ‘niche’ parties (Meguid 2005; Wagner 2012b; Meyer and Wagner 2015; Bischof 2017)
– since mainstream parties are often ‘major’ and niche parties usually ‘minor’. However,
the results in Table D.3 suggest that the distinction between major and minor parties
still has considerable explanatory power with respect to this aspect of party emphasis
11Measures of each party’s overall left-right placement are taken from the 2014 Chapel Hill ExpertSurvey
12Party family designations are taken from the Comparative Manifesto Project.
15

Table D.3: Alternative Explanations for Major vs. Minor Party Emphasis Strategy
(1) (2) (3) (4) (5) (6)
Supporter Extremism 0.344∗∗∗ 0.379∗∗∗ 0.223∗ 0.308 0.393∗∗ 0.464∗
(0.098) (0.091) (0.108) (0.260) (0.123) (0.204)
Supporter Extremism × Major −0.299∗ −0.359∗ −1.063∗∗∗ −0.498∗∗ −0.976∗∗
(0.146) (0.163) (0.263) (0.166) (0.353)
Mean Party Family Emphasis 1.644∗∗∗
(0.124)
Supporter Extremism × Major Mainstream −0.522∗∗∗
(0.157)
Supporter Extremism × Minor Niche 0.203(0.153)
Supporter Extremism × Major Niche 0.280(0.663)
Supporter Extremism × Leadership Domination Index 0.578(0.483)
Supporter Extremism × Prior Office Experience −0.224(0.177)
Supporter Extremism × Proportion of Years in Office 0.278(0.535)
Supporter Disagreement −0.127 −0.148∗ −0.162∗ −0.005 −0.206∗∗ −0.128(0.079) (0.074) (0.077) (0.128) (0.075) (0.166)
Prior Office Experience 0.439∗ 0.194 0.062 0.562∗ 0.421(0.186) (0.197) (0.198) (0.228) (0.262)
Mean Coalition Partner Emphasis 0.095 −0.053 −0.004 0.062 0.044 0.039(0.088) (0.075) (0.078) (0.087) (0.080) (0.091)
Observations 1,154 1,154 1,154 615 1,154 615Log Likelihood −1,326.411 −1,271.749 −1,406.627 −783.804 −1,448.461 −809.004
∗p<0.05; ∗∗p<0.01; ∗∗∗p<0.001
Note: Cell entries report BUC estimates from a fixed effects ordered logit model of party issue emphases.All models include country-issue fixed effects, and all except Model 3 include issue-specific intercepts formajor and minor parties. Model 3 includes issue-specific intercepts for major mainstream, major niche,minor mainstream and minor niche parties, while Models 4, 5 and 6 also allow for leadership domination,prior office experience and a party’s governing history, respectively, to have an issue-specific influence onparty emphasis. Standard errors are robust and clustered by country-issue.
16

strategies, even after accounting for whether a party is mainstream or niche. In fact, I
will go on to show that major and minor parties exhibit considerable variation in their
‘nicheness’, regardless of the measure used.
There is considerable debate as to how best to classify parties as mainstream or niche.
Early research on this topic distinguished mainstream and niche parties on the basis of
party family (Meguid 2005; Adams et al. 2006); more recently, researchers have argued
that party ‘nicheness’ is a continuous variable, relating to the number or nature of issues
parties emphasize (Wagner 2012a; Meyer and Miller 2015; Bischof 2017). For Model 3
in Table D.3, I classify all parties considered by either Meguid (2005) or Adams et al.
(2006) as ‘mainstream’ to be such, and all others as ‘niche’ – leading me to classify
only socialist, social democratic, liberal, conservative, agrarian and Christian democratic
parties as mainstream, and all others as niche.13 However, I show below that the results
reported in Table D.3 are also robust to four alternative approaches to classify parties
as either mainstream or niche. These are: (1) the classification scheme proposed by
Meguid (2005, 2008), where only green, radical right and ethnoterritorial parties are
labeled ‘niche’ and all other parties mainstream; (2) the classification scheme preferred
by Adams et al. (2006), where communist, green and extreme nationalist (or radical right)
parties are classified as niche parties, and socialist, social democratic, liberal, conservative
and Christian democratic parties as mainstream; (3) the continuous measure of a party’s
‘nicheness’ suggested by Bischof (2017), which defines a party’s ‘nicheness’ as the extent to
which it focuses its attention on a particular ideological segment of the political market;
(4) the alternative continuous measure of ‘nicheness’ proposed by (Meyer and Miller
2015). When implementing the last two approaches, I classify the parties which obtain
an above-median ‘nicheness’ score as niche, and the remainder as mainstream.
Figure D.1 demonstrates that even if parties’ major party status and ‘nicheness’ are
negatively associated14, there is considerable heterogeneity in the ‘nicheness’ of major
and minor parties, regardless of the approach used. In particular, around half the main-
stream parties in the sample are small, rather than large, mainstream parties, and small
mainstream parties constitute between a quarter and a third of parties in the sample.
These are parties like the Free Democratic Party in Germany or the Christian Democrats
in Sweden – parties which are commonplace in governing coalitions across Europe, and
13As in Meguid (2005, 2008) and Adams et al. (2006), party family designations are taken from theComparative Manifesto Project.
14An LPM analysis of the association between major party status and party nicheness, with countryfixed effects, finds a strong and statistically significant negative association between the two, by eithermeasure.
17

Figure D.1: Distributions of ‘Nicheness’ by Party Size
0.00
0.25
0.50
0.75
1.00
Major Mst Major Niche Minor Mst Minor Niche
Party Type
Pro
port
ion
(1) Meguid (2005, 2008)
0.00
0.25
0.50
0.75
1.00
Major Mst Major Niche Minor Mst Minor Niche
Party Type
Pro
port
ion
(2) Adams (2006)
0.00
0.25
0.50
0.75
1.00
Major Mst Major Niche Minor Mst Minor Niche
Party Type
Pro
port
ion
(3) Meguid (2005, 2008) and Adams (2006)
0.00
0.25
0.50
0.75
1.00
Major Mst Major Niche Minor Mst Minor Niche
Party Type
Pro
port
ion
(4) Bischof (2017)
0.00
0.25
0.50
0.75
1.00
Major Mst Major Niche Minor Mst Minor Niche
Party Type
Pro
port
ion
(5) Meyer and Miller (2015)
Note: These figures plot the distribution of ‘nicheness’ for major and minor parties, demonstrating thatthere is heterogeneity in the ‘nicheness’ of minor parties, and also of major parties, to some degree.In Figure C.1.1, following Meguid (2005), parties are classified as mainstream or niche on the basis ofparty family, with green, radical right and ethnoterritorial parties classified as ‘niche’ and all othersmainstream. In Figure C.1.2, following Adams et al. (2006), communist, green and radical right partiesas niche and all others mainstream. Figure C.1.3 classifies all parties considered by Meguid (2005) orAdams et al. (2006) to be ‘mainstream’ as such and all others as ‘niche’. Figure C.1.4 classifies partieswith above-median nicheness scores in Bischof (2017) as niche and the remainder as mainstream. FigureC.1.5 repeats this procedure using nicheness scores from Meyer and Miller (2015). Per the discussion inSection 3.1, I classify those parties which obtained at least 13% of seats, on average, between 2000 and2014 as ‘major’, and the remainder as ‘minor’.
18

often assume the role of kingmaker in coalition negotiations. Meanwhile, there also exist
several examples of large niche parties – such as the Freedom Party of Austria or the
New Flemish Alliance in Flanders — although fewer in number.
Table D.4: Mainstream and Niche Party Behavior by Party Size
(1) Meguid (2005) (2) Adams (2006) (3) Bischof (2017) (4) Meyer & Miller (2015)
Supporter Extremism 0.223 0.115 0.268 0.326(0.115) (0.096) (0.189) (0.199)
Supporter Extremism × Major Niche 0.073 −0.314 −0.394 −0.606(0.129) (0.612) (0.418) (0.339)
Supporter Extremism × Minor Niche 0.242 0.348∗ 0.216 0.126(0.205) (0.136) (0.232) (0.277)
Supporter Extremism × Major Mainstream −0.505∗∗∗ −0.367∗ −0.622∗∗ −0.613∗∗
(0.153) (0.161) (0.213) (0.208)
Supporter Disagreement −0.203∗ −0.181∗ −0.137 −0.102(0.080) (0.080) (0.101) (0.106)
Prior Office Experience 0.120 0.098 0.295 0.242(0.208) (0.207) (0.225) (0.221)
Mean Coalition Partner Emphasis −0.076 0.032 0.007 0.037(0.077) (0.082) (0.080) (0.082)
#Party-Issue Observations 1,154 1,154 1,058 1,058Log Likelihood −1,379.705 −1,408.085 −1,282.421 −1,312.295
∗p<0.05; ∗∗p<0.01; ∗∗∗p<0.001
Note: Cell entries report BUC coefficient estimates from a fixed effects ordered logit model of partyissue emphases. All models include issue-specific intercepts for major mainstream, major niche, minormainstream and minor niche parties, as well as country-issue fixed effects. Standard errors are robustand clustered by country-issue.
Table D.4 replicates Model 3 from Table D.3 using the four alternative classification
strategies discussed above. As in the original analysis, the estimates strongly support
the view that minor mainstream parties behave more like minor niche parties than larger
mainstream parties when choosing issues to emphasized – evidenced by the consistently
positive coefficient on supporter extremism, alongside the robustly negative and statis-
tically significant coefficient on the interaction between supporter extremism and major
mainstream party status.
Next, Model 4 in Table D.3 explores the possibility that systematic differences in the
organizational structure of major and minor parties may be driving their differences in em-
phasis strategy. Empirically, major parties are more often leadership-dominated, whereas
19

minor parties are more likely to be activist-dominated.15 Leader-dominated parties might
have emphasis strategies more focused on the median voter, and therefore be more elec-
torally successful, and activist-dominated parties might have emphasis strategies that are
more focused on voters similar to party activists, and so are less electorally successful.
To evaluate this possibility, I interact a measure of the degree to which the formal party
structure is dominated by the party leadership with the extremism, or distinctiveness,
of the party’s core supporters – using the measure developed by Schumacher and Giger
(2017) to measure the extent of leadership domination within a party. This measure
considers the degree to which a party is activist-dominated or leadership-dominated.16
However, as this variable is only available for a subset of the parties in my full sam-
ple, the number of observations I rely on for my inferences shrinks considerably in the
following analyses.17 To allow activist-dominated parties to emphasize different issues
from leader-dominated parties, I allow leadership domination to have an issue-specific
effect on party emphasis. We continue to find a substantively and statistically significant
difference between major and minor party emphasis strategy – suggesting the dominant
role of party leaders vs. activists within some parties cannot explain the difference we
observe between major and minor parties’ emphasis strategies.
Model 5 in Table D.3 examine the possibility that the difference in behavior between
major and minor parties we observe is actually being driven by systematic differences in
the ‘challenger party status’ of these two types of parties – major parties typically being
‘mainstream’ and ‘challenger’ parties typically minor. A party type first identified by
Hobolt and de Vries (2012), challenger parties are parties with no post-war experience
of office – in contrast with ‘mainstream’ parties, which have some (relatively recent)
experience of government. However, while there is substantial overlap in the parties
which are major and parties which are ‘mainstream’ by this account, many of the parties
I label ‘minor’ do, in fact, have substantial cabinet experience as junior coalition partners.
Indeed, while 95.1% of major parties have post-war office experience, so do 43.9% of
15I find this to be the case by a small margin in my dataset, using information on membership influencewithin parties available in the Integrated Party Organization Dataset (Schumacher and Giger 2017).
16In my sample, this measure ranges between −0.25 and 1 with a standard deviation of 0.248, withlarger values indicating that a party is more leadership-dominated. The measure is constructed usingresponses to expert surveys collected by Rohrschneider and Whitefield (2012). They define leadershipdomination as in Schumacher, de Vries and Vis (2013), with leadership-dominated parties being charac-terized by “a limited number of internal veto players and a concentration of power among a select groupof party leaders”, whereas activist-dominated parties those in which “decision-making and veto power isdispersed among large groups of party activists, organized in local, regional and national party branchesor civil society organizations” (Schumacher, de Vries and Vis 2013, 464).
17This data is only available for the following countries: Austria, Belgium, Denmark, Finland, France,Germany, Greece, Ireland, Italy, the Netherlands, Portugal, Spain, Sweden, and the United Kingdom.
20
minor parties – implying that the major-minor party distinction may still be meaningful
even after challenger party status is accounted for. Model 5 evaluates this possibility
by including an additional interaction term between supporter extremism and whether a
party has held office in the post-war period. As in previous analyses, I allow challenger
parties to emphasize different issues from mainstream parties by allowing prior office
experience to have an issue-specific effect on party emphasis. We continue to find a
large and statistically significant difference between major and minor party emphasis
strategy, suggesting that the observed difference is not a consequence of major parties’
disproportionate presence among the ranks of governing parties.
Finally, Model 6 explores the possibility that the observed difference is a consequence
of systematic underlying differences in the office aspirations of these two types of parties.
That is, perhaps minor parties tend to emphasize their more extreme or distinctive policy
positions because they are policy-seeking rather than office-seeking, and thus remain
small, whereas major parties are those whose leaders aspire to, and therefore can achieve,
higher political office. I evaluate this possibility by interacting a measure of each party’s
office aspirations with the extremism, or distinctiveness, of the party’s core supporters.
Following Schumacher et al. (2015), I measure a party’s latent office aspirations using
its historical success or failure in achieving office.18 We continue to find a statistically
significant difference in emphasis strategy between major and minor parties. This suggests
that, even after controlling for the revealed office aspirations of a party, minor parties are
systematically more likely than major parties to emphasize issues where their policies are
further from the median voter than those of their competitors.19
Appendix E Robustness Checks
E.1 Replication of Baseline Results with Manifesto Data
Table E.1 replicates Table 2 from the paper using data from the 2017a release of the
Comparative Manifesto Project to measure parties’ issue emphases in place of expert
18This is operationalized using the proportion of years a party has been in office since its foundation.Information on each party’s governing history is taken from the Integrated Party Organization Dataset(IPOD) constructed by Giger and Schumacher (2015).
19Relatedly, it might be argued that whether a party is vote-seeking or policy-seeking depends on howlong it has been out of government. To investigate this possibility, I reestimate Model 6 using time outof government rather than the Schumacher et. al. measure of fraction of years in government. The twomeasures are, unsurprisingly, correlated. I find that the substantive results of Model 6 are unchanged inthis case (results available upon request).
21

Table E.1: Table 2 Results Replicated with Manifesto Data
(1) (2) (3) (4)
Supporter Extremism 0.425 1.419∗
(0.294) (0.564)
Supporter Extremism × Major −0.590 −1.860∗
(0.436) (0.832)
Supporter Distinctiveness 0.287 0.645∗
(0.215) (0.328)
Supporter Distinctiveness × Major −0.570 −1.004∗
(0.309) (0.393)
Supporter Disagreement 0.063 −0.130(0.256) (0.284)
Prior Office Experience −0.001 0.073(0.627) (0.621)
Mean Coalition Partner Emphasis 0.090 0.092(0.069) (0.069)
#Party-Issue Observations 803 719 803 719R2 0.683 0.697 0.682 0.690Adjusted R2 0.604 0.607 0.603 0.599
∗p<0.05; ∗∗p<0.01; ∗∗∗p<0.001
Note: Cell entries report OLS coefficient estimates from a fixed effects linear model of parties’ issueemphasis decisions. All models include issue-specific intercepts for major and minor parties. Standarderrors are robust and clustered by country-issue.
22

assessments from CHES (Volkens et al. 2017). Although available for the widest range of
country-election observations, and asking experts to consider virtually the same issues as
in the 2014 EES, CHES data only provides an indirect measure of party emphasis deci-
sions. Alternatively, data from party manifestos provides us with a direct and continuous
measure of party emphasis on various issues.20 However, data from CHES is preferred
for the baseline analyses, as the CMP does not contain information for as many minor
parties, and has not yet incorporated manifestos from elections most proximate to 2014
for many countries I am able to include in the analysis when using CHES data.21 As
a consequence, the size of the sample falls by more than a third when we move from
using CHES to CMP data to measure party issue emphases. Nevertheless, so long as
we control for other factors important for party emphasis strategies (Models 2 and 4),
we continue to find a statistically significant difference between major and minor party
emphasis strategy in response to changes in core supporter preferences.
E.2 Replication of Baseline Results with Continuous Measure
of Historical Performance
In the paper, following the discussion in Section 2 and 3.1, I distinguish between major
and minor parties on the basis of differences in their historical electoral performance.
However, given the analyses I present in Figure 1—revealing a near-discontinuous dif-
ference in party strategy between parties that obtained less than 11 or 12% of seats, on
average, between 2000 and 2014, and those that exceeded this threshold—I argue for a
qualitative difference in the strategies preferred by parties I class as major, and those I
class as minor. Nevertheless, Table E.2 replicates Table 2 while interacting the extremism
of party’s core supporters with a continuous measure of historical electoral performance
instead. The coefficient on this interaction term is negative and statistically significant
across specifications, consistent with the argument that parties which were historically
more successful are more likely to de-emphasize issues where their core supporters are
more extreme. However, a comparison of Akaike Information Criterion (or Bayesian In-
formation Criterion) scores reveals that Model 2 from Table 2 provides a better fit for the
20CMP coded quasi-sentences were assigned to issues as follows: civil liberties (per201, per605), stateintervention in the economy (per401–407, per409, p411–415), redistribution (per503), same sex mar-riage (per603–604), environmental protection (per416, per501), restrictions on immigration (per601 2,per602 2), taxes versus public spending (per505–507), EU integration (per108, per110).
21CMP data for the relevant election is only available for the following countries: Bulgaria, Croatia, theCzech Republic, Denmark, Estonia, Finland, France, Germany, Greece, Hungary, Ireland, Italy, Latvia,Lithuania, Poland, Portugal, Romania, Slovakia, Spain, the Netherlands, and the United Kingdom.
23

data than Model 2 from Table E.2, suggesting that the effect of historical electoral perfor-
mance on its emphasis strategy tapers off after a party’s historical electoral performance
surmounts some threshold near 12% of seats.
Table E.2: Table 2 Results Replicated with Continuous Measure of Historical Performance
(1) (2) (3) (4)
Supporter Extremism 0.203∗∗∗ 0.339∗∗∗
(0.058) (0.100)
Supporter Extremism × Average Historical Seat Share −0.009∗ −0.014∗∗
(0.004) (0.005)
Supporter Distinctiveness 0.211∗∗ 0.277∗∗∗
(0.067) (0.083)
Supporter Distinctiveness × Average Historical Seat Share −0.011∗∗∗ −0.012∗∗∗
(0.003) (0.003)
Supporter Disagreement −0.182∗ −0.210∗∗
(0.078) (0.078)
Prior Office Experience 0.182 0.214(0.215) (0.207)
Mean Coalition Partner Emphasis 0.053 0.072(0.085) (0.086)
Observations 1,298 1,154 1,298 1,154Log Likelihood −1,685.799 −1,482.017 −1,683.554 −1,481.588
∗p<0.05; ∗∗p<0.01; ∗∗∗p<0.001
Note: Cell entries report coefficient estimates from an unconditional fixed effects ordered logit modelof parties’ issue emphasis decisions. A party’s average historical seat share is its average seat share innational legislative elections between 2000 and 2014. All models include country-issue fixed effects andallow historical seat share to have an issue-specific effect on party emphasis. Standard errors are robustand clustered by country-issue.
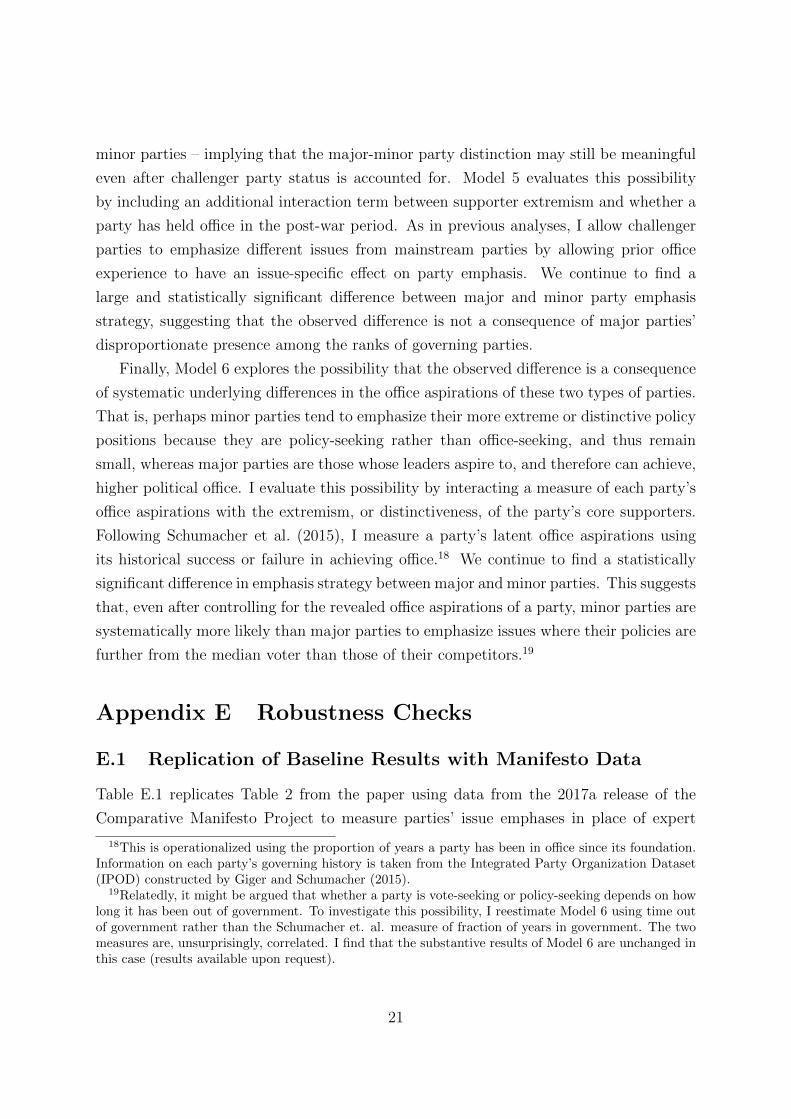
E.3 Replication of Baseline Results by FE Ordered Logit
Table E.3 replicates Table 2 from the paper using an unconditional fixed effects ordered
logit estimator in place of the BUC estimator. The BUC estimator is preferred to the
unconditional fixed effects logit estimator as the latter produces estimates that are incon-
sistent as well as severely biased when group sizes are small (Beck 2015; Katz 2001; Coupe
2005). Regardless, the results we obtain are substantively and statistically similar: in
24
all cases, we find a large and statistically significant difference between major and minor
party emphasis strategy in response to changes in core supporter preferences. Moreover,
our estimates imply that major parties will tend to place less emphasis on an issue when
core supporters have more extreme preferences on the issue, whereas minor parties will
increase their emphasis on the issue under similar circumstances.
Table E.3: Table 2 Results Replicated by FE Ordered Logit
(1) (2) (3) (4)
Supporter Extremism 0.253∗∗ 0.435∗∗
(0.092) (0.148)
Supporter Extremism × Major −0.413∗ −0.797∗∗
(0.164) (0.257)
Supporter Distinctiveness 0.259∗∗ 0.343∗∗
(0.091) (0.122)
Supporter Distinctiveness × Major −0.469∗∗∗ −0.568∗∗∗
(0.141) (0.162)
Supporter Disagreement −0.309∗∗ −0.326∗∗
(0.113) (0.115)
Prior Office Experience 0.218 0.219(0.283) (0.276)
Mean Coalition Partner Emphasis 0.145 0.183(0.186) (0.191)
#Party-Issue Observations 1,298 1,154 1,298 1,154Log Likelihood −778.134 −679.0436 −775.9729 −679.2799
∗p<0.05; ∗∗p<0.01; ∗∗∗p<0.001
Note: Cell entries report coefficient estimates from an unconditional fixed effects ordered logit modelof parties’ issue emphasis decisions. All models include issue-specific intercepts for major and minorparties. Standard errors are robust and clustered by country-issue.
Relative to the results obtained when using a BUC estimator, the size of the effects
implied by the coefficient estimates are consistently larger in magnitude – whether for
25

major parties or minor parties. However, this is likely a result of bias in our estimates,
as previous analyses have shown that when the number of observations in a group is
2, β → 2β as N → ∞ (Andersen 1973, 66). In my analysis, the average number of
observations within each country-issue group is 6.81.
E.4 Replication of Baseline Results by OLS
Next, Table E.4 replicates Table 2 in the paper using OLS in place of the BUC estimator.
In cases where the incidental parameters problem may pose a concern, researchers have
frequently advocated using OLS instead of a conditional logit or an unconditional fixed
effects logit estimator, as this allows us to recover marginal effects uncontaminated by
any inconsistently estimated fixed effects (Angrist and Pischke 2009; Greene 2005, 697).
However, there are three concerns with using an OLS estimator in my case. First, when
there are very few observations within a group fixed effect, it emerges that an OLS es-
timator produces estimates that are less accurate than those produced by a conditional
logit estimator (Beck 2015, 11–17). Second, an OLS approach assumes a cardinal de-
pendent variable – a heroic assumption in my case, as this requires, for instance, that
the gap in emphasis between a party’s third most important issue and its second most
important issue is the same as that between its third most important issue and any issue
outside the top three. Third, as the BUC estimator estimates values for the threshold
parameters in addition to the regressors, it reduces the loss of efficiency that results from
using a four point scale rather than an eight point scale to measure the distribution of
party emphasis across eight issues.
Still, the results we obtain using OLS are very similar to those obtained using the
BUC estimator, albeit with estimates for the effect of supporter extremism on parties’
issue emphasis decisions that are smaller in magnitude. However, this might be explained
by any attenuation bias that results from assuming cardinality of the dependent variable
in OLS. This seems likely, as there are several issues which both major and minor parties
place little emphasis on, when emphasis is measured using a four point scale – for in-
stance, civil liberties and the environment. Consequently, for some issues, there is likely
considerable unmeasured variation in the dependent variable, which is accounted for to
some extent by allowing the threshold parameters to vary (as in the BUC estimator).
26

Table E.4: Table 2 Results Replicated by OLS
(1) (2) (3) (4)
Supporter Extremism 0.088∗∗ 0.169∗∗
(0.028) (0.051)
Supporter Extremism × Major −0.120∗ −0.252∗∗∗
(0.052) (0.075)
Supporter Distinctiveness 0.069∗∗ 0.118∗∗
(0.026) (0.040)
Supporter Distinctiveness × Major −0.124∗∗ −0.187∗∗∗
(0.042) (0.054)
Supporter Disagreement −0.059 −0.078∗
(0.032) (0.031)
Prior Office Experience 0.039 0.044(0.082) (0.082)
Mean Coalition Partner Emphasis 0.085 0.093(0.094) (0.093)
#Party-Issue Observations 1,298 1,154 1,298 1,154R2 0.386 0.413 0.385 0.411Adjusted R2 0.263 0.275 0.262 0.272
∗p<0.05; ∗∗p<0.01; ∗∗∗p<0.001
Note: Cell entries report coefficient estimates from a fixed effects linear model of parties’ issue emphasisdecisions. All models include issue-specific intercepts for major and minor parties. Standard errors arerobust and clustered by country-issue.
27

Table E.5: Robustness to Excluding Particular Issues
Excluded Category Supporter Extremism Supporter Extremism × Major
Civil Liberties 0.415*** -0.740***(0.106) (0.158)
Environment 0.251* -0.544***(0.101) (0.152)
EU Integration 0.397*** -0.733***(0.113) (0.165)
Immigration 0.379*** -0.732***(0.103) (0.146)
Public Spending vs. Taxation 0.411*** -0.897***(0.119) (0.213)
Redistribution 0.416*** -0.336*(0.103) (0.166)
Same Sex Marriage 0.343** -0.631***(0.107) (0.157)
State Intervention 0.377*** -0.718***(0.101) (0.161)
∗p<0.05; ∗∗p<0.01; ∗∗∗p<0.001
28

E.5 Robustness to Influential Observations
In cross-sectional analyses, a possible concern is that the results may be very sensitive to
the exclusion of particular cases. To eliminate this possibility, I replicate Model 2 from
Table 2 in the paper while excluding issues and countries one at a time. The results of
this exercise are presented in Tables E.5 and E.6. We see that the relevant coefficient
estimates and standard errors are exceedingly stable across specifications.
Table E.6: Robustness to Excluding Particular Countries
Excluded Category Supporter ExtremismSupporter Extremism ×Major
Austria 0.337*** -0.537***
(0.101) (0.154)
Bulgaria 0.341*** -0.591***
(0.099) (0.154)
Croatia 0.361*** -0.636***
(0.102) (0.159)
Czech Republic 0.403*** -0.650***
(0.097) (0.165)
Denmark 0.345*** -0.607***
(0.103) (0.160)
Estonia 0.339*** -0.550***
(0.100) (0.152)
Finland 0.297*** -0.599***
(0.100) (0.159)
Flanders 0.347*** -0.659***
(0.102) (0.151)
France 0.336*** -0.621***
(0.100) (0.161)
Germany 0.328*** -0.591***
(0.101) (0.155)
Greece 0.352*** -0.650***
(0.110) (0.168)
Hungary 0.331*** -0.575***
(0.100) (0.155)
29

Table E.6: Robustness to Excluding Particular Countries
Excluded Category Supporter ExtremismSupporter Extremism ×Major
Ireland 0.338*** -0.616***
(0.101) (0.159)
Italy 0.359*** -0.628***
(0.104) (0.163)
Latvia 0.353*** -0.613***
(0.100) (0.156)
Lithuania 0.361*** -0.619***
(0.102) (0.158)
Poland 0.346*** -0.626***
(0.100) (0.159)
Portugal 0.338*** -0.624***
(0.100) (0.162)
Romania 0.361*** -0.618***
(0.105) (0.159)
Slovakia 0.365*** -0.628***
(0.103) (0.158)
Slovenia 0.353*** -0.594***
(0.100) (0.158)
Spain 0.355*** -0.576***
(0.100) (0.156)
Sweden 0.275** -0.565***
(0.104) (0.168)
The Netherlands 0.339*** -0.562***
(0.102) (0.159)
United Kingdom 0.404*** -0.648***
(0.098) (0.157)
Wallonia 0.346*** -0.611***
(0.099) (0.156)
∗p<0.05; ∗∗p<0.01; ∗∗∗p<0.001
30
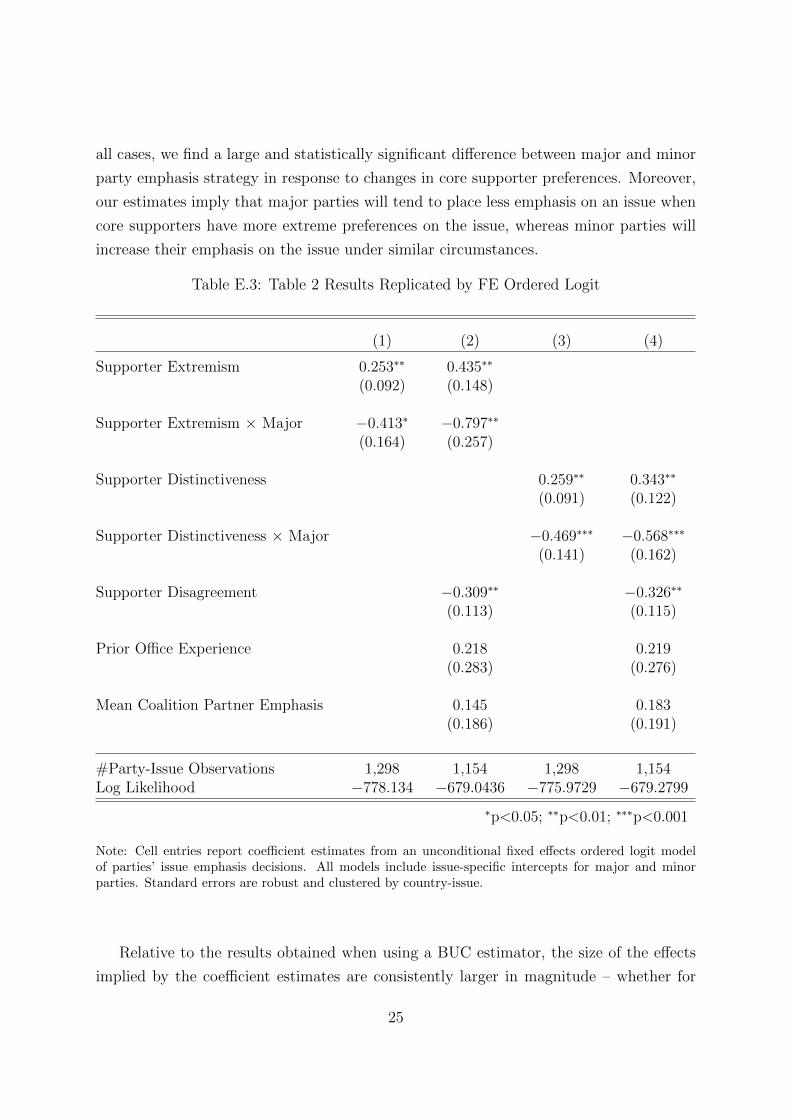
E.6 Alternative Measures of Core Supporters
Table E.7: Table 2 Results with Alternative Measures of Core Supporters
(1) >10 Supporters (2) >15 Supporters (3) Approach A (4) Approach B (5) Approach C (6) Approach D
Supporter Extremism 0.592∗∗ 0.266 0.289∗ 0.195∗∗ 0.447∗∗ 0.373∗∗∗
(0.204) (0.283) (0.089) (0.064) (0.173) (0.094)
Supporter Extremism × Major −0.814∗∗ −0.734∗ −0.425∗∗ −0.206∗ −0.750∗ −0.521∗
(0.267) (0.353) (0.150) (0.096) (0.264) (0.218)
Supporter Disagreement −0.331 −0.469 −0.055 −0.353∗∗ −0.100 −0.115(0.228) (0.335) (0.072) (0.118) (0.134) (0.101)
Prior Office Experience 0.213 0.097 0.144 0.072 −0.333 0.081(0.299) (0.300) (0.217) (0.197) (0.432) (0.182)
Mean Coalition Partner Emphasis 0.004 0.051 0.033 0.072 −0.214 0.044(0.104) (0.106) (0.082) (0.085) (0.184) (0.084)
#Party-Issue Observations 576 424 1042 1252 420 1,373Log Likelihood −655.716 −471.142 −1,299.158 −1,622.397 −483.347 −1,794.978
∗p<0.05; ∗∗p<0.01; ∗∗∗p<0.001
Note: Cell entries report BUC coefficient estimates from a fixed effects ordered logit model of parties’ issueemphasis decisions. All models include issue-specific intercepts for major and minor parties. Standarderrors are robust and clustered by country-issue.
For the main analyses, two types of respondents are coded as ‘core supporters’ of a
party: (i) strong or weak partisans with high political interest, and (ii) strong partisans
with moderate political interest. This approach leads to 6.8% of EES respondents be-
ing classified as core supporters of a party, with an average of 28.8 core supporters for
each major party and 8.1 core supporters for each minor party. Table E.7 explores the
implications of requiring that a party have at least 10 or 15 core supporters to be in-
cluded in the sample (Models 1–2), as well as using four other approaches to identify core
supporters (Models 3–6): (A) strong partisans with at least moderate political interest,
(B) all partisans with at least moderate political interest, (C) all strong partisans and
(D) all partisans. Again, across specifications, we continue to find a substantively and
statistically significant difference between major and minor party emphasis strategy in
response to changes in core supporter preferences.
31

E.7 Alternative Thresholds for Major Party Classification
Figure E.1: Trend in Model Fit as Threshold for Historical Electoral Performance Varies
1960 1970 1980 1990 2000 2010
2900
2950
3000
3050
3100
Threshold Year for Historical Electoral Performance
AIC
for
Mod
el o
f Maj
or P
arty
Em
phas
is S
trat
egy
In the paper, I identify major and minor parties on the basis of their average seat
share in national legislative elections between 2000 and 2014, with parties that received
at least 13% of seats, on average, in this period being classed as ‘major’ and the remain-
der ‘minor’. Figure E.1 demonstrates that the statistical model best explains parties’
emphasis strategies when this is the selected combination of time frame and seat share
threshold, and that a different time frame reduces model fit (when measured using the
Akaike Information Criterion).22 To generate this figure, I re-estimate Model 2 from Ta-
ble 2 in the paper, using a different combination of year threshold and average seat share
threshold to classify parties as major and minor each time. The red line in Figure E.1
plots the trend in AIC score when the year threshold moves from 1960 to 2014, holding
the average seat share threshold constant at 13%. The remaining trend lines in Figure
E.1 (plotted in orange) depict the trend in the AIC score when the average seat share
threshold is instead held constant at other values between 1% and 20%. We arrive at
22A lower Akaike Infomrmation Criterion (AIC) score indicates better in-sample model fit.
32
the same conclusion when the Bayesian Information Criterion (BIC) is used to measure
model fit instead.
E.8 Moving Between Major and Minor Party Status
In Section 2, I observe that an implication of the theory is that major and minor parties
might change which voters they target in response to changes in their electoral perfor-
mance. In particular, it seems likely that when a formerly major party loses enough
support to become a minor party, its emphasis strategy will evolve accordingly. Likewise,
a minor party with growing electoral support may increasingly prefer to emphasize its less
distinctive, and more popular, issue positions in order to win support among a broader
electorate. In order to fully explore this possibility, a panel analysis of change in party
emphasis strategy is necessary. However, as data on both the preferences of party sup-
porters on a range of issues and on the emphasis placed by parties on these issues is only
available for multiple countries for one year (2014), such an analysis is infeasible at this
stage. However, in this section, I use the available data to evaluate whether parties that
have only recently surmounted the 13% seat share threshold behave similarly to parties
that have long cleared that threshold. Table E.8 reports results from a series of analyses
that speak to this question.
Building on the analyses in Section E.7, I replicate Model 2 in Table 2 while gradually
lengthening the time frame used to determine a party’s historical electoral performance,
and therefore, its major party status. I find that there is no statistically significant differ-
ence in the emphasis strategy of parties that obtained more than 13% of seats in the most
recent election to 2014 and those that did not (Model 1); however, we begin to observe
a statistically significant difference in emphasis strategy between parties that surpassed
this threshold, on average, in the last four years, and those that did not (Model 2). How-
ever, the coefficient on the relevant interaction term increases in magnitude, and the fit
of the statistical model (as reflected by the models’ AIC/BIC scores) continues to im-
prove, when parties’ electoral performance over a longer time frame is taken into account
– stabilizing in magnitude as well as fit after about fourteen years. These analyses also
speak to the question of how long it takes for a minor party that is electorally successful
to begin behaving like a major party – that is, moving from disproportionately empha-
sizing its distinctive policies to de-emphasizing those issues. The estimates reported in
Table E.8 suggest that it takes about fourteen years of surpassing (or falling short of) this
threshold, on average, before changes in a party’s electoral trajectory are fully reflected
33

in its emphasis strategy.
Table E.8: How Long Does It Take To Become A Major Party?
Party Considered ‘Major’ if Obtained ≥13% of Seats Between:
(1) 2014–2014 (2) 2010–2014 (3) 2005–2014 (4) 2000–2014 (5) 1995–2014 (6) 1990–2014 (7) 1980–2014 (8) 1970–2014 (9) 1960–2014
Supporter Extremism 0.272∗∗ 0.336∗∗∗ 0.336∗∗∗ 0.367∗∗∗ 0.372∗∗∗ 0.353∗∗∗ 0.351∗∗∗ 0.355∗∗∗ 0.329∗∗∗
(0.098) (0.097) (0.099) (0.094) (0.096) (0.092) (0.092) (0.092) (0.094)
Supporter Extremism × Major −0.155 −0.560∗∗∗ −0.472∗∗ −0.690∗∗∗ −0.648∗∗∗ −0.619∗∗∗ −0.663∗∗∗ −0.677∗∗∗ −0.544∗∗∗
(0.183) (0.153) (0.151) (0.158) (0.205) (0.156) (0.154) (0.159) (0.152)
Supporter Disagreement −0.148∗ −0.170∗ −0.172∗ −0.171∗ −0.175∗ −0.159∗ −0.177∗ −0.174∗ −0.188∗
(0.072) (0.074) (0.074) (0.075) (0.075) (0.075) (0.076) (0.077) (0.078)
Prior Office Experience 0.272 0.209 0.219 0.205 0.200 0.250 0.236 0.220 0.192(0.192) (0.201) (0.200) (0.205) (0.205) (0.202) (0.202) (0.202) (0.204)
Mean Coalition Partner Emphasis 0.122 0.086 0.087 0.074 0.074 0.079 0.089 0.086 0.073(0.089) (0.089) (0.083) (0.083) (0.083) (0.085) (0.085) (0.085) (0.085)
#Party-Issue Observations 1,154 1,154 1,154 1,154 1,154 1,154 1,154 1,154 1,154Log Likelihood −1,520.004 −1,491.336 −1,491.915 −1,482.584 −1,486.280 −1,489.325 −1,488.526 −1,490.295 −1,486.744Akaike Information Criterion 3066.007 3008.672 3009.830 2991.168 2998.561 3004.651 3003.053 3006.591 2999.488Bayesian Information Criterion 3122.927 3065.591 3066.750 3048.087 3055.480 3061.570 3059.972 3063.510 3056.408
∗p<0.05; ∗∗p<0.01; ∗∗∗p<0.001
Note: Cell entries report BUC coefficient estimates from a fixed effects ordered logit model of parties’issue emphasis decisions. All models include issue-specific intercepts for major and minor parties as wellas country-issue fixed effects. Standard errors are robust and clustered by country-issue.
That the evolution of a party from major to minor status is likely a gradual but
converging process is also corroborated by the analyses reported in Table E.9. Models
1 and 2 in Table E.9 replicate Models 1 and 2 from Table 2 in the main paper while
adding a second interaction term, this time between the policy extremism of a party’s
core supporters and its electoral performance between immediately prior to the relevant
timeframe. In particular, a party is coded as “Past Major” if its average seat share
between 1990 and 2000 exceeded 13%. If it were the case that current major party
emphasis strategy was also substantially influenced by its electoral performance more than
fourteen years prior, we should observe a negative and statistically significant coefficient
on this interaction term as well. We do not observe this in either case.
Models 3 and 4 further embellish the case that the process of evolution between major
and minor party status is gradual, finding no evidence that ‘rising’ and ‘declining’ major
parties differ in their responses to the extremism of their core supporters. To evaluate
this, I code parties which gained seats in the most recent election as “rising parties”
and those that lost seats in the most recent election as “declining parties”, and allow
for a possible interaction affect between whether or not a party is “rising”, its major
party status and the extremism of its core supporters. If rising major parties are more
likely to de-emphasize issues where their core supporters are extreme than declining
major parties, we should observe a negative and statistically significant coefficient on this
34

interaction term. I find no statistically significant difference in emphasis strategy even
between declining and rising major parties, suggesting that while major parties may move
towards their core voters, in left-right terms, following a loss of votes or seats (Adams
et al. 2004; Adams 2012), they may continue to emphasize the issues where their positions
are relatively centrist until they lose enough support to become minor parties.
Table E.9: Declining, Rising, Past vs. Current Major Party Emphasis Strategy
(1) (2) (3) (4)
Supporter Extremism 0.205∗∗∗ 0.350∗∗∗ 0.159∗∗ 0.297∗
(0.058) (0.100) (0.060) (0.120)
Supporter Extremism × Major −0.354∗∗ −0.473 −0.402∗∗ −0.573∗∗∗
(0.119) (0.270) (0.135) (0.165)
Supporter Extremism × Past Major 0.024 −0.178(0.103) (0.258)
Past Major 0.150 0.387(0.263) (0.316)
Supporter Extremism × Rising 0.187 0.108(0.098) (0.143)
Supporter Extremism × Rising × Major 0.007 −0.156(0.165) (0.208)
Rising −0.363 −0.167(0.199) (0.225)
Supporter Disagreement −0.197∗∗ −0.201∗∗
(0.076) (0.077)
Prior Office Experience 0.127 0.172(0.209) (0.208)
Mean Coalition Partner Emphasis 0.069 0.084(0.085) (0.086)
#Party-Issue Observations 1,298 1,154 1,298 1,154Log Likelihood −1,686.308 −1,476.194 −1,683.202 −1,475.801
∗p<0.05; ∗∗p<0.01; ∗∗∗p<0.001
Note: Cell entries report BUC coefficient estimates from a fixed effects ordered logit model of parties’ issueemphasis decisions. All models include issue-specific intercepts for major and minor parties. Standarderrors are robust and clustered by country-issue.
35

References
Adams, James. 2012. “Causes and Electoral Consequences of Party Policy Shifts inMultiparty Elections: Theoretical Results and Empirical Evidence.” Annual Review ofPolitical Science 15:401–19.
Adams, James, Michael Clark, Lawrence Ezrow and Garrett Glasgow. 2004. “Understand-ing Change and Stability in Party Ideologies: Do Parties Respond to Public Opinionor to Past Election Results?” British Journal of Political Science 34(4):589–610.
Adams, James, Michael Clark, Lawrence Ezrow and Garrett Glasgow. 2006. “Are NicheParties Fundamentally Different from Mainstream Parties? The Causes and the Elec-toral Consequences of Western European Parties’ Policy Shifts, 1976–1998.” AmericanJournal of Political Science 50(3):513–529.
Andersen, Bernhard Erling. 1973. Conditional Inference and Models for Measuring. Men-talhygiejnisk Forsknings Institut.
Angrist, Joshua D. and Jorn-Steffen Pischke. 2009. Mostly Harmless Econometrics.Princeton University Press.
Baetschmann, Gregori, Kevin E. Staub and Rainer Winkelmann. 2015. “Consistent Es-timation of the Fixed Effects Ordered Logit Model.” Journal of the Royal StatisticalSociety: Series A (Statistics in Society) 178(3):685–703.
Beck, Nathaniel. 2015. “Estimating Grouped Data Models with a Binary DependentVariable and Fixed Effects: What are the Issues?” Manuscript.
Bischof, Daniel. 2017. “Towards a Renewal of the Niche Party Concept: Parties, MarketShares and Condensed Offers.” Party Politics 23(3):220–235.
Blundell, Richard W. and Richard J. Smith. 1989. “Estimation in a Class of Simultane-ous Equation Limited Dependent Variable Models.” The Review of Economic Studies56(1):37–57.
Chamberlain, Gary. 1980. “Analysis of Covariance with Qualitative Data.” Review ofEconomic Studies 47:225–38.
Coupe, Tom. 2005. “Bias in Conditional and Unconditional Fixed Effects Logit Estima-tion: A Correction.” Political Analysis 13(3):292–295.
Giger, Nathalie and Gijs Schumacher. 2015. “Integrated Party Organization Dataset(IPOD).” http://dx.doi.org/10.7910/DVN/PE8TWP, Harvard Dataverse. Version 1.
Greene, William H. 2005. Econometric Analysis. 5th ed. Pearson Education, Inc.
Hobolt, Sara B. and Catherine E. de Vries. 2012. “When Dimensions Collide: TheElectoral Success of Issue Entrepreneurs.” European Union Politics 13(2):246–268.
36

Kassenbohmer, Sonja C. and John P. Haisken-DeNew. 2009. “You’re Fired! TheCausal Negative Effect of Entry Unemployment on Life Satisfaction.” Economic Jour-nal 119(536):448–462.
Katz, Ethan. 2001. “Bias in Conditional and Unconditional Fixed Effects Logit Estima-tion.” Political Analysis 9(4):379–384.
Meguid, Bonnie. 2005. “Competition Between Unequals: The Role of Mainstream PartyStrategy in Niche Party Success.” American Political Science Review 99(3):347–359.
Meguid, Bonnie M. 2008. Party Competition between Unequals: Strategies and ElectoralFortunes in Western Europe. Cambridge University Press.
Meyer, Thomas M. and Bernhard Miller. 2015. “The Niche Party Concept and Its Mea-surement.” Party Politics 21(2):259–271.
Meyer, Thomas M. and Markus Wagner. 2015. “Issue Engagement in Election Campaigns:The Impact of Electoral Incentives and Organizational Constraints.” Political ScienceResearch and Methods .
Rabinowitz, G. and S. E. Macdonald. 1989. “A Directional Theory of Issue Voting.”American Political Science Review 83(1):93–121.
Riedl, Maxmilian and Ingo Geishecker. 2014. “Keep It Simple: Estimation Strate-gies for Ordered Response Models with Fixed Effects.” Journal of Applied Statistics41(11):2358–2374.
Rohrschneider, Robert and Stephen Whitefield. 2012. The Strain of Representation: HowParties Represent Diverse Voters in Western and Eastern Europe. Oxford UniversityPress.
Schumacher, Gijs, Catherine E. de Vries and Barbara Vis. 2013. “Why Do PartiesChange Position? Party Organization and Environmental Incentives.” Journal of Pol-itics 75(2):464–477.
Schumacher, Gijs, Marc Van de Wardt, Barbara Vis and Michael Baggesen Klitgaard.2015. “How Aspiration to Office Conditions the Impact of Government Participationon Party Platform Change.” American Journal of Political Science 59(4):1040–1054.
Schumacher, Gijs and Nathalie Giger. 2017. “Who Leads the Party? On MembershipSize, Selectorates and Party Oligarchy.” Political Studies 65(1):162–181.
Senik, Claudia. 2004. “When Information Dominates Comparison: Learning from RussianSubjective Panel Data.” Journal of Public Economics 88(9):2099–2123.
Terza, Joseph V., Anirban Basu and Paul J. Rathouz. 2008. “Two-Stage Residual Inclu-sion Estimation: Addressing Endogeneity in Health Econometric Modeling.” Journalof Health Economics 27(3):531–543.
37

Volkens, Andrea, Pola Lehmann, Theres Matthieß, Nicolas Merz, Sven Regel andBernhard Weßels. 2017. “The Manifesto Data Collection. Manifesto Project(MRG/CMP/MARPOR). Version 2017a.”.URL: https://doi.org/10.25522/manifesto.mpds.2017a
Wagner, Markus. 2012a. “Defining and Measuring Niche Parties.” Party Politics18(6):845–864.
Wagner, Markus. 2012b. “When Do Parties Emphasise Extreme Positions? How StrategicIncentives for Policy Diferentiation Influence Issue Importance.” European Journal ofPolitical Research 51:64–88.
Williams, Laron K., Katsunori Seki and Guy D. Whitten. 2016. “You’ve Got SomeExplaining to Do: The Influence of Economic Conditions and Spatial Competition onParty Strategy.” Political Science Research and Methods 4(1):47–63.
38


