
Optimal Marketing Strategies for a Customer Data Intermediary*
Joseph Pancras University of Connecticut School of Business
Marketing Department 2100 Hillside Road, Unit 1041
Storrs, CT 06269-1041 [email protected]
Phone: 860-486-0810 Fax: 860-486-5246
K. Sudhir Yale School of Management
135 Prospect St, PO Box 208200 New Haven, CT 06520-8200
Email: [email protected] Phone: 203-432-3289 Fax: 203-432-3003
September 2006
* Joseph Pancras is an Assistant Professor of Marketing at the University of Connecticut and K. Sudhir is Professor of Marketing at Yale University. The paper is based on an essay from the first author’s dissertation at New York University. The authors thank Joel Steckel, Yuxin Chen, Paris Cleanthous, Russell Winer, Vicki Morwitz and Jiwoong Shin for feedback and helpful discussions and the workshop participants at Carnegie Mellon University, Koc University, London Business School, New York University, Purdue, SUNY Buffalo, University of Central Florida, UC Berkeley, UCLA, University of Connecticut, University of Georgia, University of Southern California, University of Texas at Austin, Washington University at St. Louis and Yale University for their comments. This paper was originally titled: “The Personalization Services Firm: What to Sell, To Whom to Sell and For How Much?”

1
Optimal Marketing Strategies for a Customer Data Intermediary
Abstract
Advances in data collection and storage technologies have given rise to the “customer
data intermediary” (CDI)—a firm that collects customer data to offer customer-specific
marketing services to marketers. With widespread adoption of customer relationship
management (CRM) and one-to-one (1:1) marketing, the demand for such services continues to
grow. Extant empirical research using customer data for CRM and 1:1 marketing tends to have
an engineering emphasis; they focus on developing analysis techniques to optimally implement
CRM and 1:1 marketing; i.e., the technology for the CDI. In contrast, this paper focuses on
marketing strategy issues faced by the intermediary, given the availability of the technology to
implement such services. Specifically, we develop an empirical framework to evaluate the
optimal customer (exclusive/non-exclusive), product (quality or accuracy of the 1:1
customization) and pricing strategy for a CDI. We illustrate the framework for one type of CDI -
- a 1:1 coupon service firm catering to grocery manufacturers using household purchase history
data from the ketchup market. We find that selling on a non-exclusive basis using the maximum
available purchase history data is the most profitable strategy for the CDI in the particular
market. We also evaluate the potential impact of retailers entering the 1:1 coupon service
business. Since 1:1 marketing can increase the retailer’s profits from goods sold, it is optimal for
the retailer to undercut the prices of a pure play CDI offering 1:1 coupon services.
Keywords: Customer Information, CRM, One-to-One Marketing, Database Marketing, Couponing, Price Discrimination, Competition, Marketing Channels, Customer Data Intermediaries.

1
Optimal Marketing Strategies for a Customer Data Intermediary
In recent years, a new type of firm— “customer data intermediaries” (CDI)— firms that
specialize in collecting customer behavior and demographic data and offer customer-specific
marketing services has emerged. For example, in the grocery and drugstore markets, Catalina
Marketing obtains purchase history data through cooperating retailers and provides targeted
coupons on behalf of grocery manufacturers to households purchasing at that particular retailer.1
On the Internet, companies such as DoubleClick and Tacoda Systems collect past visit data from
cooperating websites and use these to deliver targeted advertising for its advertising clients. In
the catalog and specialty retailing industry, firms such as Abacus B2C Alliance and i-BehaviorTM
pool transactional data from over a thousand catalog titles/retailers to offer improved targeted
direct marketing services to its members.2
With widespread adoption of customer relationship management (CRM) and one-to-one
(1:1) marketing, the demand for CDI services continues to grow. Table 1 lists some of the major
players in the CDI services business. For each of these players, we provide a brief description of
their business and report their revenues, market capitalization and growth rates. As can be seen
from Table 1, the industry is gaining in importance as reflected in its market valuations as well as
revenues and growth rates. Several companies in this industry have revenues in the hundreds of
millions of dollars and valuations over a billion dollars.
**** Insert Table 1 here****
Advances in data collection, data storage and customer-specific promotion delivery
technologies fuel the rise and growth of customer data intermediaries. The use of scanners in
offline retailing and the intrinsic digital nature of online retailing have enabled the easy
collection of purchase and other transaction histories, while the falling costs of digital storage
and computation have made the recording and analysis of vast amounts of purchase history data
for 1:1 marketing feasible. Further, advances in promotion delivery technologies to individuals 1 Catalina Marketing has penetrated about 21,000 of the roughly 34,000 supermarkets in the United States and records about 250 million transactions per week. The 1:1 couponing considerably increases redemption rates. Catalina’s redemption rates for its 1:1 coupons are about 6-9% in contrast to 1-2% for FSI coupons. Catalina’s focus is primarily on grocery and pharmaceutical manufacturers. Revenues from retailer couponing are less than 9% (Catalina’s 2003 10 K). 2 While Abacus collects data only at the catalog level, i-BehaviorTM collect data at the SKU level. The Abacus B2C Alliance has 1550 catalogs/retailers who have pooled together data on over 4.4 billion transactions from over 90 million households (Miller 2003). I-Behavior has data on over 1000 mid-sized catalog companies on over 103 million consumers from 89 million households.

2
(in-store at the point of purchase; at home through direct mail; online through email; and even by
wireless through cell-phones when on the move) increases the effectiveness and timeliness of 1:1
marketing strategies.
Despite their growing economic importance, there is little empirical research addressing
strategic issues of concern to this industry. Extant research on this industry to-date tends to be of
an “engineering” nature focusing on how firms should use individual browsing/purchasing data
to personalize advertising or promotions. This research has occurred in marketing, information
systems and computer science. (e.g., Ansari and Mela 2003, Liu and Shih 2005, Adomavicius,
Sankaranarayanan, Sen and Tuzhilin 2005) and is typically positioned as a means by which a
firm can take advantage of its customer databases to improve marketing effectiveness. From the
CDI perspective, this research develops the technology to create their customer-specific
marketing services.
In contrast to such “engineering” research, this paper focuses on “marketing” problems
facing the CDI. Specifically, we ask the research question: conditional on the availability of the
1:1 technology, what is the optimal customer and product strategy for the CDI? And conditional
on the customer and product strategy, what price should the CDI charge for the service?
In practice, there is considerable diversity in the customer and product strategies of CDIs.
Some sell their services on an exclusive basis, while others sell on a non-exclusive basis. For
example, Catalina sells on an exclusive basis to only one grocery manufacturer in a particular
category in any given time period.3 In contrast, Abacus and i-BehaviorTM sell on a non-exclusive
basis to any catalog marketer or specialty retailer who requests their services.
CDIs also differ in their outlook toward increasing the accuracy of their targeting
services. Catalina voluntarily restricts the length of transaction history used for couponing to a
maximum of 65 weeks.4 In contrast to Catalina, Abacus continues to expand the accuracy of its
database. Abacus pools data from over 1550 catalog marketers/specialty retailers on over 90
3 Catalina divides a year into four thirteen-week periods and divides the United States into several regions in defining the product. They divide a retailer’s product offerings into hundreds of finely divided categories (currently over 500 categories). Within a region, in a given time period, Catalina offers the 1:1 coupon service on an exclusive basis to manufacturers within a product category. 4 Catalina’s offers two types of targeting services: (1) Checkout Coupon®, based on last purchase data and (2) Checkout Direct® based on 65 weeks of purchase history data.

3
million households and continues to increase the extent of household purchase information in its
database. Abacus uses data for up to 5 years on each household in its database.5
It is possible that the existing strategies of an intermediary may have arisen due to
historical reasons, but may not be optimal in the current environment. For example, Catalina may
have chosen an exclusive strategy because it served as a convenient sales pitch initially to
prospective clients that they can have a competitive advantage by working with Catalina. But
with its current widespread acceptance by grocery manufacturers, exclusivity may no longer be
necessary to win clients. In contrast, since Abacus uses a cooperative approach to collect data
from its members, it may not be possible for Abacus to discriminate among its members by using
a non-exclusive strategy. Similarly, Catalina’s choice of restricting transaction histories to 65
weeks may have been due to the relatively high cost of storage two decades ago. Firms such as
Abacus and i-BehaviorTM may have been able to use longer histories because of their
comparatively recent entry into these markets, by which time data storage costs had reduced
considerably.
Can customer data intermediaries benefit from changing their current customer and
product strategies? Currently, there is little research to guide them on what the optimal strategy
should be. In this paper, we offer an empirical framework to help an intermediary arrive at an
optimal customer and product strategy. We illustrate the framework for a 1:1 coupon service
firm such as Catalina using data from the ketchup market. Therefore the details of the empirical
modeling in this paper will be tailored to the environment in which Catalina operates. However,
the approach can be applied in other empirical contexts with appropriate modifications for the
specific characteristics of that context. For example, the framework can be used to help answer
whether DoubleClick should sell its targeted advertising services on an exclusive basis or a non-
exclusive basis. For this, we need to calibrate the impact of advertising (as opposed to
couponing) on the downstream firms’ profitability, but the rest of the analysis would be similar.
Such an approach would complement the theoretical analysis of targeted advertising by Iyer,
Villas-Boas and Soberman (2005).
5 When DoubleClick purchased Abacus in 1999, it sought to further improve accuracy by combining the offline data from Abacus with online transaction behavior captured by DoubleClick. DoubleClick however did not combine their offline and online data because privacy advocates vehemently opposed the idea and it created a public relations problem for DoubleClick.

4
The timeliness of this research question is highlighted in a recent stock analysis report
about Catalina by Deutsche Bank (Ginocchio, Chesler and Clark 2005) on how this $1.3 billion
market capitalization company can grow further, given that it has achieved virtually complete
penetration at all major supermarkets within the U.S. The report states: “Categories are sold on
four thirteen-week cycles with exclusivity (only one manufacturer can promote that category
during that period). As Catalina believes that only approximately 20-25% of its customers want
exclusivity, they are looking at ways to potentially sell more than one manufacturer in a
category.” Our approach will provide Catalina an empirical basis to answer this critical business
question that it currently faces.
In the grocery context, the retailer is the source of the customer purchase history data
used for 1:1 coupon services. Catalina’s intermediary business model is predicated on
cooperation from the retailer. A natural question that arises is: What if the retailer chooses to dis-
intermediate Catalina and offer the service itself? Large retailers with the appropriate
infrastructure could easily implement such a targeting solution. In fact, Tesco in the U.K. has
been successfully collaborating with dunnhumby, a U.K. based firm in the development of 1:1
marketing services that includes targeted couponing over the last decade (Humby 2004, Humby,
Hunt and Phillips 2003). In the U.S., dunnhumbyUSA is a joint venture between Kroger and
dunnhumby that seeks to replicate dunnhumby’s success in the U.K. with Tesco. We find that by
providing targeting services, the retailer can also increase profits from the goods sold; therefore
the retailer has an incentive to undercut Catalina’s price for the 1:1 service.
We also evaluate the profits for Catalina by providing 1:1 targeting services to retailers.
We find that the profit from providing the 1:1 targeting service to the retailer is greater than that
from providing the service to the manufacturers. This suggests that retailer services are
potentially an underutilized revenue stream for Catalina. But a practical problem in aggressively
pricing retailer services is that retailers may balk at having to provide the data and then paying
for services using the same data. Catalina may therefore have only limited bargaining power to
extract retailer’s value from targeting, compared to its power over manufacturers. This might
explain why Catalina aggressively markets its manufacturer service compared to its retail
services. Currently, retail services provide less than 9% of Catalina’s total revenues, while
manufacturer services provide more than 53% of revenues.

5
Tradeoffs in Choosing the Optimal Customer and Product Strategy
What are the tradeoffs facing the CDI in deciding the optimal customer and product
strategy? To fix ideas and to facilitate empirical work, we illustrate the tradeoffs in the context of
Catalina for the ketchup category where there are two main competitors: Heinz and Hunt’s.
Unlike standard products or services, where the economic value to a customer is independent of
who else uses it, the value of Catalina’s 1:1 coupon service for Heinz depends on whether Heinz
uses the service exclusively or whether Hunt’s also uses it. This is because the effectiveness of a
1:1 coupon for Heinz in increasing sales is a function of whether Hunt’s also offers targeted
coupons.
What is particularly interesting is that the economic value of the service for Heinz may be
higher or lower if Hunt’s also uses the service; i.e., this service can have positive or negative
externalities. If the service has positive externalities, it makes obvious sense for the firm to sell
its service to both Heinz and Hunt’s. If it has negative externalities, then Catalina would have to
evaluate whether the negative externalities for Heinz and Hunt’s are sufficiently low to still sell
to both; if not, it would have to sell the service on an exclusive basis to only one of them
depending on who has the higher willingness to pay (higher economic value). Thus the optimal
customer strategy of whether to sell on an “exclusive” basis to Heinz or on a “non-exclusive”
basis to multiple manufacturers is an empirical question for Catalina.
Thus far in this scenario, we have treated the “product,” i.e., the quality of the targeting
that Catalina offers as fixed. In the context of 1:1 marketing, the quality of the targeting is related
to the accuracy with which a firm (e.g., Heinz) can identify the segment it seeks to target.
Catalina can increase the accuracy of targeting in a number of ways: (1) use demographic
information; (2) increase the length of purchase history of households within a category at a
cooperating retailer; (3) use information about purchasing behavior in other categories at the
cooperating retailer to take advantage of cross-category similarities in purchase behavior (e.g.,
Ainslie and Rossi 1998; Iyengar, Ansari and Gupta 2003); and (4) combine information about
purchasing behavior of households from other retailers. In this paper, we only consider the first
two options to improve targeting accuracy.6
6 Optimal targeting using cross-category purchase behavior is computationally very cumbersome; hence beyond the scope of our analysis. Catalina does not have the option to pool information across retailers, because it is contractually obliged not to pool information across retailers. Households are identified only by a retailer’s internal

6
What is the optimal product strategy for Catalina? For most products/services, firms
would like to maximize the quality of their products/services if increasing quality were relatively
costless. However, 1:1 targeting is different in that increasing the quality of targeting may reduce
the economic value of the service for the downstream clients. The idea is simple: if the targeting
service is sold on an exclusive basis to only Heinz, the economic value of the targeting service
for Heinz will definitely increase because Heinz can more effectively price discriminate its
customers. But if the targeting service is sold to both Heinz and Hunt’s, the price discrimination
effect of targeting can be overwhelmed by the more intense competition created by targeting
(e.g., Shaffer and Zhang 1995). Whether the price discrimination effect or competition effect
dominates is moderated by the level of targeting accuracy (Chen, Narasimhan and Zhang 2001).
At low levels of accuracy, price discrimination effects dominate competition effects. But at high
levels of accuracy competition effects dominates price discrimination effects. Thus Catalina
could potentially destroy economic value to downstream clients by increasing accuracy if it sold
the product on a non-exclusive basis to both firms (Heinz and Hunt’s). Then, Catalina may find it
optimal to increase accuracy, but sell on an exclusive basis to only one of the firms to reduce the
competition effect. Alternatively, it could reduce accuracy and sell to both firms and thus extract
greater total revenues from both. Therefore the customer strategy and the product strategy of a
CDI are intertwined and the empirical question of what is the optimal strategy for a particular
CDI needs to be determined in the relevant empirical context.
Further, it is important to note that theoretical models abstract away from many
complexities of real world markets, but these need to be accounted for in an empirical model. For
example, theoretical models have typically allowed for household heterogeneity only on
horizontal attributes, but in reality households are also heterogeneous on vertical attributes. The
empirical analysis needs to model the real world demand and supply characteristics appropriate
for the particular market in order to arrive at the correct product and customer strategies for the
CDI.
Literature Review
This paper is related to both theoretical and empirical research streams on 1:1 pricing.
The literature refers to 1:1 pricing broadly using terms such as targeted couponing and behavior
identification number (say from a loyalty program) and therefore Catalina cannot pool information across multiple retailers.

7
based pricing. Using similar models, Thisse and Vives (1988) and Shaffer and Zhang (1995)
showed that in a competitive market, spatial discriminatory pricing or targeted coupons lead to a
prisoner’s dilemma relative to uniform pricing. These models assumed symmetric firms. Shaffer
and Zhang (2002) show that in the presence of firm asymmetry, higher quality firms with larger
market shares can improve volumes and profits due to gains in market share though they
continue to get lower profit margins due to increased competition. Importantly, as discussed
earlier, Chen, Narasimhan and Zhang (2001) showed that the level of targeting accuracy
moderates the profits from 1:1 promotions. They show that there is an inverted-U shaped
relationship between profitability and accuracy of targeting (personalization).
There is also a growing literature on behavior based pricing (e.g., Chen 1997, Villas-Boas
1999; Fudenberg and Tirole 2000; Shaffer and Zhang 2002; Chen and Zhang 2004). These
papers generally find that behavior based pricing leads to a prisoner’s dilemma. Taylor (2003)
and Villas-Boas (2004) highlight the effects of “strategic” consumers who alter purchasing
behavior to avoid revealing their preferences. Shin and Sudhir (2006) however develop a model
where customers are distinguished on the basis of their profitability (using the 80/20 rule) and
behavior based pricing does not lead to a prisoner’s dilemma.
In terms of empirical research on 1:1 pricing, Rossi, McCulloch and Allenby (1996) and
Besanko, Dube and Gupta (2003) evaluate the profitability of targeted coupons. Rossi,
McCulloch and Allenby (1996) investigate how manufacturers can improve their profits with
increasing levels of purchase history and demographic information. Unlike this paper, they do
not model the retailer or competition between manufacturers. Besanko, Dube and Gupta (2003)
only study the profitability of targeting using only last visit data, but model both competition and
the retailer. However, unlike this paper, neither paper investigates the 1:1 service provider’s
strategic decisions. Our analysis also finds that these two papers over-estimate the profitability
impact of personalization. This is because the models of consumer behavior used in computing
profits with and without targeting are different. We discuss this issue in detail when reporting our
result on incremental profits. In terms of 1:1 advertising/communication, Ansari and Mela (2003)
develop algorithms for how a firm should use consumer history to customize email
communications. Zhang and Krishnamurthi (2004) empirically study customized pricing in
online stores.

8
The paper is also related to the theoretical literature on information suppliers and
investments in information. Iyer and Soberman (2000) study how the marketing strategies of an
information supplier are affected by downstream competition between firms who use product
modification information. In a similar spirit, this paper analyzes how the marketing strategies of
the CDI are affected by how grocery manufacturers use the service downstream for 1:1
couponing. But the model for how the data is used downstream is very different in the two
papers. Further, our analysis is empirical and therefore requires modeling several specific
features of the market (e.g., strategic interactions between manufacturers and retailers) that can
be abstracted away from a theoretical analysis.
Other related theoretical papers that address some issues in our paper are Chen and Iyer
(2002) and Liu and Zhang (2006). Chen and Iyer (2002) study how firms differentially invest in
customer addressability to avoid the negative effects of downstream competition. Liu and Zhang
(2006) theoretically investigate the interaction between manufacturers and retailers in the
presence of personalized pricing. Even though retailer’s profits are lower in the presence of
personalized pricing either by the manufacturer or the retailer, the retailer prefers to use
personalized retail pricing in order to deter direct selling and personalized pricing by
manufacturers, which leads to even worse outcomes for the retailer.
Model
Figure 1 represents a schematic of the grocery markets in which Catalina operates. There are
four sets of agents involved in this market: (1) The CDI (e.g., Catalina) (2) the manufacturers (3)
a retailer and (4) consumers.
*** Insert Figure 1***
The model of manufacturers selling through a retailer to the consumer has been studied in
previous research (e.g., Sudhir 2001, Berto Villas-Boas 2004, Villas-Boas and Zhao 2005). In
these models, the pricing decisions of manufacturers and retailers are modeled as endogenous.
The model in this paper expands on this literature by endogenously modeling the decisions faced
by a 1:1 coupon service provider (CDI) who facilitates targeted couponing to consumers in the
market. Since Catalina is contractually obliged not to pool purchase history data across multiple
retailers, the assumption that Catalina uses only data from one retailer for its targeting service is
consistent with institutional reality. As in most previous research (e.g., Besanko, Gupta and Jain
1998; Besanko, Dube and Gupta 2003; Sudhir 2001), we assume that the retailer is a local

9
monopolist. Berto Villas-Boas (2004) indeed finds very little evidence for cross-retailer
competition at the single category level.
Figure 2 represents the schematic of the decision alternatives faced by a 1:1 coupon service
provider such as Catalina (CDI) regarding the sales of its services. We model the timing of the
game into two phases: Phase 1 which involves the sale of 1:1 services and Phase 2 which
involves the sale of consumer goods. Below we describe the different stages of the Phase 1
decision related to the sale of targeting services.
*** Insert Figure 2***
Phase 1: Sale of 1:1 Services
Stage 1: Catalina’s Product Choice Decision: At this stage, Catalina decides on the length of
purchase history it should optimally use for targeting. Here we consider three alternatives: (1)
Last Visit, along the lines of targeting used in Besanko, Dube and Gupta 2003, (2) Last Purchase,
as used by Catalina in its Catalina Coupon® program and (3) Full Purchase History, along the
lines of what Catalina uses in its Catalina Direct ® program.7
Stage 2: Catalina’s Initial Customer Choice and Price Decision: For ease of exposition, we will
consider a market with two national brand manufacturers. Catalina has three alternatives to make
initial offers at this stage: (1) Offer the 1:1 service to Firm 1 and set its price ( 1fp ); (2) Offer the
1:1 service to Firm 2 and set the price ( 2fp ); and (3) Offer the 1:1 service to both firms and set
the prices to both firms ( 1 2,b bp p ).
The subscripts “1” and “2” on prices refer to the price charged to firms 1 and 2. The
superscript ‘f’ refers to the fact that firm 1 or 2 is ‘first’ offered the service exclusively. The
superscript ‘b’ refers to the situation when both firms are initially offered the service on a non-
exclusive basis.
Stage 3: Initial Offer Acceptance/Rejection by Manufacturers: Manufacturers decide whether to
accept or reject the offer of 1:1 services at the offered prices. In the case where one firm is
exclusively offered and accepts the offer, the manufacturers and retailers then move to the
second “sales of goods” phase with one of the firms having the capability to target. If both firms
were offered initially, then there are four possible outcomes: where one of the firms accepts, both
accept and neither accept. Given these outcomes, the manufacturers and retailers then move to
7 Catalina restricts the full purchase history to only 65 weeks, but we evaluate different lengths of purchase history.

10
the sales of goods phase with the firms that have accepted the 1:1 service offers having the
capability to target.
Stage 4: Catalina offers 1:1 Service to “Other” Manufacturer at Second Offer Price: If one firm
is exclusively offered the 1:1 service first and rejects it, then Catalina will offer the service
second to the other firm on an exclusive basis. For example, if Firm 2 receives the offer after
Firm 1 rejects the initial offer of exclusive service, this price to firm 2 will be denoted as ( 2sp ),
where the superscript ‘s’ indicates the firm 2 was offered the service second after firm 1 refused.
Stage 5: Second Offer Acceptance/Rejection by Manufacturers: Manufacturers who received the
second offer can either accept or reject the offer for the 1:1 service.
Given these decisions, the manufacturers and retailers then move to the second phase (sales
of goods) with the firms that have accepted the 1:1 service offers having the capability to target.
The payoffs realized after the second phase are shown in three rows in Figure 2. We denote the
profits from the sale of goods to manufacturer ‘f’ by xyfΠ , where x and y refers to the 1:1 service
purchase decisions of firms 1 and 2 respectively. A value of 1 (0) refers to whether the firm uses
(does not use) the 1:1 services. The first row indicates the payoff to the 1:1 service provider (i.e.,
price charged for 1:1 services), the second and third rows indicate the payoffs to Firms 1 and 2
respectively which shows the net profits from the sale of goods and the fees paid (if any) to the
1:1 service provider.
It is important to note that in this game of complete information, Stages 4 and 5 are in the
off-equilibrium path, because Catalina will offer the right price in the initial offer so that
whoever is offered initially will accept. We have marked the equilibrium paths in bold. Hence,
even though there are 10 payoff matrices shown, the only relevant payoffs in equilibrium are the
three payoff matrices where the firms that are initially offered the 1:1 service by Catalina accept
the product. Nevertheless, the payoffs from the off-equilibrium paths are critically important for
Catalina to figure out what price it should charge the firms in Stage 2. This is because Catalina’s
offer price to the firms should take into account the incremental profits a firm will make relative
to the outcome where the competitor obtains exclusive use of 1:1 services. It should be noted that
the price charged is not with respect to the situation where there is no targeting at all. This is
because the scenario where neither firm purchases 1:1 coupons will not be on the sub-game
perfect equilibrium path and therefore is not a credible alternative threat to either firm 1 or firm

11
2. This limits the amount of value that can be extracted from either firm by the 1:1 service
provider. Hence 10 011 11
fP = Π −Π ; 01 102 22
fP = Π −Π and 11 011 1 1bP = Π −Π ; 11 10
2 2 2bP = Π −Π .
Phase 2: Sales of Goods
Stage 1: Manufacturers set wholesale prices and the coupon face values for individual
households. If they have not purchased the 1:1 services, all households are assumed to have a
coupon face value of zero.8
Stage 2: Retailer takes the information about wholesale prices and coupons issued in setting
retail prices. Since the coupons are issued by the retailer, it is reasonable to assume that the
retailers take into account the coupons issued in setting retail prices.9 We follow previous
research (Rossi, McCulloch and Allenby 1996, Besanko, Dube and Gupta 2003) in assuming that
coupons are valid only for the week of issue.
Stage 3: Given the retail prices and coupons issued, the household makes buying decisions in
order to maximize utility. We now develop a detailed model of these three stages of Phase II.
We describe the decisions faced by each of the players below. We begin with the
consumer model, then describe the retailer and manufacturer models respectively.
Consumer
A household i (i = 1,2,...,H) chooses one of J available brands (denoted by j = 1...J) in the
category or decides not to purchase in the category (j = 0, the no-purchase alternative or ‘outside
good’) on each household shopping occasion t = 1,2,...,ni. Let the vector ijtX denote all variables
for brand j experienced by household i at shopping occasion t. This vector includes brand-
specific indicators, marketing mix variables such as features, displays, and household-specific
variables which depend on the previous purchase/s such as state dependence and household stock
on occasion t.
Consumers choose the brand that offers the maximum utility. We specify the indirect
utility of household i for brand j (j = 1...J) on shopping occasion t as follows:
ijt ijt jt it jt ijtu X r Iβ α γ ξ ε= − + + + (1)
8 Technically, manufacturers set the wholesale prices and Catalina decides whether to offer the coupon and what is face value will be, but this distinction is unimportant for the results after the manufacturer has made the decision to purchase the targeting service. 9 For brevity, we only describe the Manufacturer Stackelberg model in the paper, though we also estimate the Vertical Nash model.

12
where Xijt includes all variables that affect household i’s evaluation of brand j on occasion
t (feature, display and lagged brand choice) as well as time invariant brand intercepts, rjt is the
price of brand j at t, itI is the inventory stock of household i in the category (across all brands) at
time t10, jtξ is the brand j-specific effect on utility at shopping occasion t that affects all
households but which is unobserved by the econometrician, and ijtε is the unobserved utility of
brands that vary over shopping occasions across households.
Since the indirect utility for any item in the choice set is identified only in terms of
differences with respect to a base choice in the logit model, we treat the outside good as the base
choice and normalize its utility as follows:
0 0i t i tu ε=
The elements of the vector ( )0 1, ,.it i t i t iJtε ε ε ε= each are assumed to follow an independent
Gumbel distribution with mean zero and scale parameter 1.
We model heterogeneity using a latent class framework (Kamakura and Russell 1989)11.
Consumers are probabilistically allocated to one of K segments, where each segment k has its
own parameter vector ( ),k kα β . The size of segment k is denoted as kf , which can be
interpreted as the likelihood of finding a consumer in segment k, or the relative size of the
segment in the population of consumers. The probability of household i that belongs to segment
k choosing a brand j is given by:
exp( )exp( )
k k kijt ijt it jtk
ijt k k kilt ilt it ltl
X r IS
X r Iβ α γ ξβ α γ ξ− + +
=− + +∑
(2)
10 We calculated inventory as the stock of the relevant category (ketchup) that has accumulated with the household due to previous purchases, with the stock being depleted at the average consumption rate of the household for ketchup. The method of calculating inventory is similar to Gupta (1988). In our model the utility of choosing the outside good, instead of being set to 0 as in Chintagunta (2002) is parameterized by the ketchup inventory stock. In the profit simulations, the probability of purchase in future periods will be affected by the simulated purchase since the inventory variable will be updated and will affect the probability of the outside good choice in future periods. 11 The latent class model with discrete segments has considerable empirical validity and managerial relevance (Wedel and Kamakura 2000). A competing model is one which characterizes consumer heterogeneity using a continuous heterogeneity distribution (Gonul and Srinivasan, 1993). Andrews, Ainslie and Currim (2002) find that both the discrete and continuous heterogeneity distributions fit the data fairly well, though some papers have argued that continuous heterogeneity coupled with discrete heterogeneity can fit the data better (Allenby, Arora and Ginter 1998). In this paper, we apply the latent class approach because of its computational tractability when solving for the equilibrium targeting prices when competitive and retailer reactions are incorporated in the model.

13
Note that jtξ are the common demand shocks that affect all consumers. These are
observable by the price-setting firms and consumers in the market but unobservable by the
researchers. Villas-Boas and Winer 1999 show that profit-maximizing firms will take jtξ into
account when setting prices, therefore price is correlated with jtξ . This causes a price
endogeneity problem. Without correcting for endogeneity, the price coefficient will be biased
towards zero. We will discuss how we address this issue in the estimation section.
Because kf represents the likelihood of finding a consumer in segment k, the unconditional
probability of choice for brand j by consumer i in time period t can be computed as:
1 1
exp( )exp( )
k k kK Kijt ijt it jtk k k
ijt ijt k k kk k ilt ilt it ltl
X r IS f S f
X r Iβ α γ ξβ α γ ξ= =
⎛ ⎞− + += = ⎜ ⎟⎜ ⎟− + +⎝ ⎠∑ ∑ ∑
(3)
Once the estimates of the latent class model are obtained, one can apply the Bayes’ rule on
the aggregate latent class estimates using each household’s purchase history that is available.
The posterior probability that a consumer ‘i’ belongs to a segment ‘k’ conditional on observed
choice history iH is obtained by revising the prior probability of membership kf in a Bayesian
fashion (Kamakura and Russell 1989):
( )( ) '
'
|Pr( | )
| '
i ki
i k
k
L H k fi k H
L H k f∈ =
∑ (4)
Using different levels of household choice history will result in different levels of posterior
probability for each consumer i. The posterior probability using the entire purchase history for
the consumer i, which we will denote by i
FHH plays an important role in our analysis, and we
denote the corresponding posterior probability as:
( )( ) '
'
|Pr( | )
| '
i kFHi
FH i kFH
k
L H k fi k H
L H k f∈ =
∑ (4a)
Retailer
The retailer’s goal is to maximize category profits in time period t, given the decisions to
buy 1:1 services by manufacturers. Let 1(0)x = denote whether manufacturer 1 has purchased
(not purchased) the personalization service. Similarly, let 1(0)y = denote whether manufacturer
2 has purchased (not purchased) the personalization service. Therefore the retailer chooses retail

14
prices 1 ,xy xyt Jtr r… , conditional on which firms have purchased the 1:1 service to solve the
following problem:
1 , , 1 1max [ ] ([ ])
t
xy xyJtt
NJxy xy xy xy xyRt jt jt ijt jt ijt t
r r j ir w S r D M
… = =
Π = − −∑∑ (5)12
where xyijtD is a matrix of individual specific coupon values as described earlier under the
alternative scenarios where the different manufacturers purchase the targeting service, and tM is
the total size of the market on occasion t. The shares ( )xy xyijt jt ijtS r D− in the above equation are the
weighted average of the segment-specific shares across the k segments at the effective price
faced by the consumer of xy xyjt ijtr D− 13. Taking the first order conditions of equation (5) with
respect to retail prices, we obtain the retailer’s pricing equation for each product in the category
in terms of wholesale prices. The details of the derivation are provided in the Web Appendix A.
The retailer price equation can be derived as:
1
1 1[ ] *[ ]
N N
iR ii i
R W S−
= =
= − Θ∑ ∑ (6)
Where iRΘ is the matrix of first derivatives of all the (individual consumers’) shares with respect
to all retail prices (retail prices are common across consumers), with element (j,m) = ( )im m
j
S rr
∂∂
,
R is the vector of retail prices and W is the vector of wholesale prices (which are common across
all consumers) and iS is the vector of shares for each consumer ‘i’ over all the brands:
12 In the following equations, we use the square brackets for grouping terms and the parentheses for denoting arguments of function. For example, in equation 5 the right hand side consists of (1) the retail margin[ ]xy xy
jt jtr w− ,
(2) the share ([ ])xy xyijt jt ijtS r D− , which is a function of the effective price faced by the consumer of xy xy
jt ijtr D− and
(3) tM , the total market size in time t. 13 Note that we assume that the retailer uses the same level of information about consumers as that bought by the manufacturer from Catalina. Here, we follow the assumption made in the previous literature on targeting (e.g., Besanko, Dube and Gupta 2003) that both manufacturers and retailers use the same level of information. Relaxing this assumption to allow the retailer to use customer data, when manufacturer does not buy the CDI’s service leads to a “common knowledge” problem because manufacturers do not know or cannot infer the demand model used by the retailer to set retail prices. Advances in game theory beyond the scope of this paper are needed to solve this problem.

15
1 1 1
1 1 1
, ,
i
i
iJ J JJx Jx Jx
r w SR W S
r w S
⎡ ⎤⎡ ⎤ ⎡ ⎤⎢ ⎥⎢ ⎥ ⎢ ⎥≡ ≡ ≡ ⎢ ⎥⎢ ⎥ ⎢ ⎥⎢ ⎥⎢ ⎥ ⎢ ⎥⎣ ⎦ ⎣ ⎦ ⎣ ⎦
Manufacturer
A manufacturer ‘m’ offering a subset mℵ of brands in the market sets the wholesale
price xyjtw (where mj∈ℵ ) and the coupon face values to individual households ( xy
ijtD ) so as to
maximize the manufacturer’s profits. A manufacturer who has not been sold the personalization
service will have coupon face values set to zero. The manufacturer takes into account the
knowledge that retailer prices ( xyjtr ) will be set taking into account the wholesale prices and the
coupon face values that have been issued to individual households. The profit of manufacturer m
at time t from the sales of goods is given by:
1[ ] ([ ( , ) ])
t
m
Nxy xy xy xy xy xy xymt jt ijt jt ijt jt jt ijt ijt t
j iw D c S r w D D M
∈ℵ =
Π = − − −∑ ∑ (7)
where cjt is the marginal cost of the manufacturer for brand j in period t, and
( ( , ) )xy xy xy xy xyijt jt jt ijt ijtS r w D D− is the probability of household i, buying brand j in period t given the
decisions of manufacturers 1 (denoted by x) and 2 (denoted by y) to buy the purchase history
data. Note that the retailer sets the retail price taking into account both the wholesale price ( xyjtw )
and the vector of discounts offered to all households, i.e., 1{ }xy xy Hjt ijt iD D == .
We can write the manufacturer profit equations at the individual level as follows:
[ ] ( ( , ) )m
xy i xy xy xy xy xy xymt jt ijt jt ijt jt jt ijt ijt
jw D c S r w D D
∈ℵ
Π = − − −∑
Taking the first order conditions of (6), with respect to xy xy xyijt jt ijtw w D= − , we are able to solve
for the effective margin from each household. Then the wholesale price will be maxxy xyjt ijti
w w=
and xy xy xyijt jt ijtD w w= − .
From the manufacturer first order conditions, we can write the manufacturer margin from
a particular household i [ ]iW C− as follows:
1[ ] [ ] *[ ]i ii W WW C O S−− = •Θ − (8)

16
Where iWΘ is defined for each individual consumer such that it contains the first derivatives of
all the (individual consumers’) shares with respect to all wholesale prices (wholesale prices are
common across consumers), with element (j,m) = ij
immim
wDrS
∂−∂ )(
. To account for the set of
brands owned by the same manufacturer, define the manufacturer’s ownership matrix WO such
that element (j,m) is equal to one if the manufacturer who sells brand j also sells brand m, and
zero otherwise. where [ ]iW WO •Θ is the element by element multiplication of the two matrices,
iW is the vector of wholesale prices less the individual coupon values, C is the vector of
marginal costs of the manufacturer (C is common across all consumers), and iS is the vector of
shares for each consumer i :
1
1
1
1
1
11
,,
JXiJ
i
i
JXJJXiJJ
i
i
S
SS
c
cC
Dw
DwW
⎥⎥⎥
⎦
⎤
⎢⎢⎢
⎣
⎡=
⎥⎥⎥
⎦
⎤
⎢⎢⎢
⎣
⎡=
⎥⎥⎥
⎦
⎤
⎢⎢⎢
⎣
⎡
−
−=
The derivation is detailed in the Web Appendix A. It is important to note that though the
assumed demand models entering the objective functions of the manufacturer and the retailer
(and the chosen optimal wholesale prices, household discounts and retail prices) will reflect the
level of information that is available to the market participants based on whether they have
accessed the 1:1 marketing service, the actual demand and the resultant profits resulting from
such pricing strategies will reflect the “true” behavior of the consumer (which we approximate
using estimates from using full purchase history of the consumer i
FHH ).We elaborate on this
further when reporting the profits to manufacturers and retailers from using 1:1 targeting.
We specify manufacturer marginal cost as a function of factor prices, which assumes a fixed
proportions production technology.
*jt j t jtc λ θ υ= + Β + (9)
where tΒ are the factor prices, jλ are brand specific intercepts and jtυ is the cost shock.

17
Estimation and Solution Strategy
The solution strategy consists of the following five steps, where the first two steps
involve estimation to characterize the market and the remaining three steps involve policy
simulations to infer the optimal strategy for the customer data intermediary.
Step 1: Estimate the demand and supply model discussed above. The demand model is a latent
class model of household preferences and responsiveness to marketing mix with alternative
levels of purchase history lengths used to proxy for personalization quality from consumer
information.14 To account for potential price endogeneity concerns, we use the control function
approach developed by Petrin and Train (2004). The control function approach has similarities to
Rivers and Vuong (1988) and Villas Boas and Winer (1999). Essentially, we obtain residuals
from a regression of prices of the different brands against its cost factors and include these
residuals in the utility equation (1) in estimating the demand model. More details of the control
function approach are explained in Web Appendix B. Given the demand estimates, we can
compute the wholesale and retail margins using the equations 6 and 8. Then the cost estimation
reduces to a linear regression, where the dependent variable is (Retailer price – Computed Retail
Margin – Computed Wholesale Margin) and the independent variables are the cost factors and
the brand dummies.
Step 2: Apply Bayes’ rule on the aggregate latent class estimates using each household’s
purchase history (the length of history varies depending on the scenario being considered and the
number of visits of the household during the estimation period) to obtain household level
probabilities of membership in each of the latent classes. When purchase histories are short, the
individual level probabilities differ very little from the aggregate probabilities and as the
purchase histories lengthen, the individual probabilities tend to become more different from the
aggregate probabilities reflecting more closely the idiosyncratic preferences of the household.
The manufacturers may use varying levels of information about consumer purchase history in
targeting them. Note that the demand model will no longer be as in equation 3. The demand
equation will replace the segment probability kf in equation 3 with the household level segment
probability as obtained in equation 4 (or, for the full history case, in equation 4a). The share
14 Other aspects of consumer information, such as consumer demographics could potentially improve the quality of the personalization service, but the incremental impact of demographics over purchase history was miniscule in our analysis. So we focus on purchase history length as a measure of accuracy and omit demographics in further analysis. This is consistent with the findings in Rossi , McCulloch and Allenby (1996).
18
equation used by a manufacturer to target a consumer ‘i’ conditional on observed choice history iH will thus be:
( )( )
( )( )' '
1 1' '
| | exp( )* *
exp( )| ' | 'i
i k i k k k kK Kijt ijt it jtH k
ijt ijt k k ki k i kk k ilt ilt it ltl
k k
L H k f L H k f X r IS S
X r IL H k f L H k fβ α γ ξβ α γ ξ= =
⎧ ⎫ ⎧ ⎫⎡ ⎤ ⎡ ⎤⎛ ⎞− + +⎪ ⎪ ⎪ ⎪⎢ ⎥ ⎢ ⎥= = ⎜ ⎟⎨ ⎬ ⎨ ⎬⎢ ⎥ ⎢ ⎥ ⎜ ⎟− + +⎪ ⎪ ⎪ ⎪⎝ ⎠⎢ ⎥ ⎢ ⎥⎣ ⎦ ⎣ ⎦⎩ ⎭ ⎩ ⎭
∑ ∑ ∑∑ ∑(10)
Step 3: Having thus characterized the household level preferences using different lengths of
purchase history data, solve for the optimal prices and discounts under alternative targeting
scenarios (exclusive, non-exclusive). To obtain steady state profit estimates, solve for prices and
discounts over a large number of weeks tracking both consumer past purchases (to account for
state dependence effects) and inventories (to account for inventory effects on category
purchases) over this period. In solving for the equilibrium prices and discounts, take into account
not only the pricing behavior of the manufacturers, but also the equilibrium passthrough behavior
of retailers. The same marketing mix variables for features and displays as in the estimation data
are used in this simulation.
Step 4: Given the optimal prices and discounts computed based on Step 3, evaluate manufacturer
profits based on consumer choices, at the optimal prices and discounts. Note that optimal prices
and discounts will vary depending on the available purchase history and which firms do
targeting. However consumer behavior should be based on the same “true” preferences
irrespective of what data firms have. Hence in predicting consumer choice, given the chosen
prices and discounts, it is critical to always use the household level estimates obtained using the
full purchase history data, because these are our best estimates of the “true” household behavior.
One should not use the estimates obtained with shorter purchase histories at this stage as this will
grossly overstate the profitability of targeting. On first glance, this issue may appear a “mere
detail”, but we find that the improvements in profits in earlier empirical papers (Rossi,
McCulloch and Allenby 1996; Besanko, Dube and Gupta 2003) can be overstated if we do not
assume a “true” stable consumer behavior based on the full purchase history.
Step 5: Given the profits obtained under alternative targeting scenarios of history length (full
purchase history, only last purchase, only last visit, no targeting) and client choice (exclusive,

19
non-exclusive), solve for the optimal customer and product strategy for the customer data
intermediary.
Empirical Illustration
Data
We use the AC Nielsen scanner panel data on the ketchup category from the largest retailer
in the Springfield, MO market for the empirical illustration. We restrict attention to the four
largest brand-sizes which collectively account for 64% of the sales in this category: Heinz 32 oz,
Hunt’s 32 oz, Heinz 28 oz, and the Store Brand 32 oz and use 100 weeks of purchase history
data during 1986 to 1988. We use a sample of 143 households based on whether they made at
least five purchases of the chosen brand-sizes during the 100 weeks of analysis. The 143
households bought ketchup in 1073 visits out of the total 11660 store visits.
The summary of brand shares (conditional on purchase) and prices are given in Table 2.
*** Insert Table 2***
We use the price of tomatoes as a cost factor. The price data was obtained from the Bureau
of Labor Statistics (BLS). Part of the data was obtained from the website and the rest through
email from BLS officials.
Estimation Results
Based on the Bayesian Information Criterion (BIC), we found that a three segment latent
class model is the best model.15 The identification of the latent class logit model with exogenous
variables is standard. However, price is endogenous, and as discussed earlier, we use a two step
control function approach to obtain unbiased estimates of the price coefficient. 16A first stage
regression of ketchup prices with brand intercepts and factor costs (cost of tomatoes) was used.
The key identifying assumption is that the factor costs are independent of the demand shocks.
The F-statistic for the tomato cost is 7.8, which is significant at the 5% level. Interacting tomato
cost with the brand dummies, as in Villas-Boas and Zhao (2005), caused the F-statistics to
15 Since the AIC and BIC criterion were worse for the model that included demographic and seasonality variables, we report only results of the best fitting model without demographic and seasonality variables. We also considered serial correlation in the effects of marketing variables and the error terms using the geometric decay approach outlined in Seetharaman (2004), but these did not improve model fit. 16 We tested for possible endogeneity of features and displays by using the Hausman test (Hausman 1978) to test for endogeneity, and found that we cannot reject the null hypothesis that feature and display are exogenous even at the 10% level of significance. The test statistic is 14.2 and the critical value at the 5% (10%) significance level of the chi-square distribution with 27 degrees of freedom is 40.1 (36.7).

20
become insignificant. Hence we use a common slope coefficient across brands in the first stage
regression. We also considered other cost factors such as wages and cost of packaging materials
(glass and plastic) as instruments, but did not find these to be effective instruments.
We use the residuals of the first stage regression as an additional variable in the utility
equation to estimate the demand model. The demand estimates are presented in Table 3 below.
Segment 2 is the least price sensitive, but also purchases least in the category based on the
negative coefficients associated with the intercept. It is 24% of the market. Segments 1 and 3 are
more price sensitive than segment 2 and together constitute 76% of the market. However
Segment 1 is relatively more loyal to Heinz 32 oz. Segment 3’s preferences are more diffused
across all brands and is the most price sensitive segment in the market, suggesting the least
amount of loyalty. They were also relatively insensitive to inventory levels. This suggests that
this segment does not purchase ketchup at regular intervals, but opportunistically buy any brand
when it is on sale.
*** Insert Table 3***
The price elasticities for the three segment latent class demand model are reported in
Table 4. The own and cross price effects are as expected. Hunt’s 32 and the Store Brand 32 have
higher own elasticities than the two Heinz brand-sizes. Heinz 28, the most expensive brand, has
the lowest own elasticity. Hunt’s 32 and Store 32 have higher cross-elasticities, which indicate
that switching would be higher between these brand-sizes. Increase in the price of the largest
brand-size Heinz 32, will result in more substantial substitution to Hunt’s 32 and Store 32 rather
than Heinz 28.
*** Insert Table 4***
Given the estimates of the demand model, we now estimate the supply model. We test for
the appropriate manufacturer-retailer interaction (Manufacturer Stackelberg; Vertical Nash) and
manufacturer-manufacturer interaction (Bertrand and Collusion). The best fitting model (p<
0.01) is the Manufacturer-Stackelberg model with manufacturers in Bertrand Competition. For
this supply model, we report the estimates of the cost factors in the cost equation in Table 5. The
estimates suggest that Heinz and the store brand have lower marginal costs than Hunt’s (though
the differences are not significant). Not surprisingly, tomato prices have a significant effect on
marginal cost of ketchup.
21
*** Insert Table 5***
Analysis of the Customer Data Intermediary’s Decisions
Given the demand and cost estimates from the previous section, we now evaluate the
profitability of the alternative decision scenarios from the 1:1 service provider’s perspective
using simulations. We simulate the market for 100 weeks, which is a sufficiently long period to
obtain stable estimates of profits under alternative decision scenarios.17 From the household level
demand model, we get the market share of the sample customers. We then scale this sample
market share by the chain’s volume of sales in the week to arrive at chain profits.
We first demonstrate how length of purchase history affects the ability to use 1:1
promotions. We then evaluate the profits of manufacturers (Heinz and Hunt’s) from the sale of
goods as a function of whether they use 1:1 coupons either on an exclusive or syndicated basis,
i.e., we compute the payoffs ( 10 01 10 01 11 111 1 2 2 1 2, , , , ,Π Π Π Π Π Π ) for different lengths of purchase history.
Using these payoffs, we infer what price the customer data intermediary can charge under
different scenarios and thus arrive at the optimal customer and product decisions of the 1:1
services vendor.
How Length of Consumer Purchase History affects 1:1 Targeting
Figures 3a, 3b and 3c show the distribution of posterior probabilities of households
belonging to segment 1 when using “last visit,” “last purchase” and “full history” data
respectively for targeting. Figure 3a clearly shows that the marketer achieves very little
discrimination across consumers by using only information about the last visit, as the vast
majority of consumers are classified in the same quintile as the aggregate probability ( kf in
Equation 7), i.e., 0.47 for Segment 1. The last purchase information enables more discrimination
to be achieved between consumers, as seen in Figure 3b. We achieve much better discrimination
among consumers by using 100 weeks of consumer purchase information, as shown in the
polarized probabilities in Figure 3c. With 100 weeks of information, almost 40% of consumers
are assigned with a high degree of probability (posterior probability in the highest quintile) to
segment 1, while more than 40% of consumers are not assigned to segment 1 with a high degree
of probability (posterior probability in the lowest quintile). 17 Average profits per week were very stable with consumer choices simulated over one hundred weeks. Increasing the period of simulation further had no effect on the results, but simply increased computation time.

22
*** Insert Figures 3a, 3b and 3c***
The Effect of 1:1 Coupons on Manufacturer Client Profits
We now assess the profitability of 1:1 targeting for manufacturer clients (Heinz and
Hunt’s). An important factor in estimating the profits of manufacturers is the assumption about
retailer behavior. We compare results using two assumptions about the retailer (1) the retailer is a
category profit maximizer and (2) the retailer charges a simple constant markup over wholesale
prices (e.g., Silva-Risso, Bucklin and Morrison 1999); we illustrate with a markup of 25%. The
improvement in profits from targeting for Heinz is much greater when the retailer uses a constant
markup strategy (9%), compared to when the retailer uses an optimal category profit
maximization strategy (2%). However for Hunt’s, the increase in profits from targeting is low
(under 1%) under both retailer strategies. In practice, retailers are expected to be somewhere in
between the two extremes in their pricing sophistication; we can therefore expect the true
benefits of targeting for manufacturers to lie between these bounds.
In the rest of the analysis, we assume that the retailer follows the optimal category profit
maximization strategy. The profits under the different scenarios are reported in Table 6. Several
insights emerge.
*** Insert Table 6***
First, 1:1 promotions by both firms increase profits relative to no-targeting for all levels
of data length (last visit, last purchase and full purchase history). As the reported t-statistics
show, these increases are statistically significant. Further, increasing accuracy (from last visit to
last purchase and from last purchase to full history) improves profits. The increases are also
statistically significant.18 Thus, the positive price discrimination effect of targeting dominates the
negative competitive effect of targeting in this market. Even with the full purchase history of 100
weeks and competitive targeting, we have not reached the peak of the inverted U relationship
between targeting accuracy and profitability (described in Chen, Narasimhan and Zhang 2001). 18 We use bootstrapping to compute the standard errors and t-statistics. We take 30 draws from the distribution of the demand estimates and compute the difference in profits under targeting and no-targeting scenarios for each draw. We perform a paired t-test based on the difference in profits for each draw under the targeting and non-targeting scenarios. Since for most draws, the profits from targeting are better than profits from not targeting, the t-statistics are relatively high even when the profit increases are small. We also find that the profits for both Heinz and Hunt’s using 100 weeks of data are higher (and the difference is statistically significant at p<0.01) than the profits using 65 weeks history (which Catalina currently uses in Checkout Direct®). It should be noted that longer purchase histories can be better for 1:1 marketing provided consumer preferences do not change over time. Non-stationary consumer preferences could actually make longer purchase histories a liability, an extreme example of which could be consumer preferences in the fashion industry.

23
Second, we compare the case where only one firm exclusively targets versus the case
where both firms target. Under 1:1 targeting using full purchase history, both Heinz and Hunt’s
make more profits when both firms target than when either of them targets alone. Thus there is a
positive externality from the use of 1:1 targeting for both Heinz and Hunt’s in this market.
Finally, we examine the magnitudes of the improvements in profits from the use of
targeting. The maximum profit gain that any firm obtains by using targeted pricing in the
ketchup category is about 2%. An improvement of gross margins by 2% can be a substantive
increase in net profits. For example, Heinz had a gross margin of 40% and a net margin of 10%
in 2003 (Hoover Online). A 2% increase in gross margin can then translate to an increase of
about 8% in net margins. As discussed earlier, the 2% increase is a conservative lower bound in
the presence of a sophisticated retailer maximizing category profits. The profits can be greater if
the retailers are less sophisticated in its pricing.
1:1 Targeting Profits – Measurement Issues
The profits increases from targeting we report are smaller than the profit increases
reported in Rossi, McCulloch and Allenby (1996) and Besanko, Dube and Gupta (2003). Using
full purchase history data (without demographics), the Rossi, McCulloch and Allenby (1996)
study finds an increase of 5% for one item in the tuna category. The Besanko, Dube and Gupta
(2003) study finds improvements of 4% for Heinz and 37% for Hunt’s in the ketchup category,
merely with the last visit data. We detail below three key modeling issues that can explain these
differences.
First, we include inventory in the demand model while the Besanko et al. and Rossi et al
models do not. Even though they do not have inventory data, Besanko et al. find suggestive
evidence that inclusion of inventories can reduce the potential incremental gain in profits
significantly. Category purchase will be overestimated when the effect of inventory is not
included in the demand model. Said differently, the absence of inventory in their model implies
that consumers who purchase last period are still likely to purchase at the same level in the
current period. This overestimates the benefits of accurate price targeting. Rossi et al. use a
conditional choice model, so they do not model inventory issues.
Second, the assumption about retailer pricing behavior has an impact on profitability of
targeting. Rossi, McCulloch and Allenby (1996) do not consider competitive manufacturer or
24
retailer reaction to targeting. As discussed earlier, the retailer reaction does have an effect on the
benefits of targeting: when the retailer charges a constant markup we found that Heinz profits
increase by about 9%, a magnitude comparable to the Rossi et al. paper. Therefore this issue
needs to be explored further.
Finally, one should maintain a consistent standard of consumer purchase behavior when
computing targeting profits. Besanko, Dube and Gupta (2003) compare profits with no targeting
using aggregate data and targeting using last visit data. However when computing profits under
the two scenarios, they assume different consumer behavior that is consistent with the level of
detail of data available for targeting. But since consumer behavior should be invariant to the
level of data used to estimate preferences, we use the estimates obtained using full history data as
our best approximation of the “true” consumer behavior for targeting with different levels of
purchase history.
Table 7 illustrates the magnitude of the bias in the estimates of targeting profits when a
consistent standard is not adopted. The first two rows illustrate that using just the information
about consumers in characterizing consumer response can result in an ‘increase’ in profit
estimates by 10.02% for Heinz and 0.56% for Hunt’s19. These two rows are for situations where
neither firm targets. The difference is purely a bias introduced due to posterior allocations based
on consumer history leading to different shares being estimated for the brands. We note that the
‘profit increases from targeting’ in Table 7 are much higher than the figures we reported in Table
6 and similar to the profit increases reported by Rossi, McCulloch and Allenby (1996) and some
of the estimates of Besanko, Dube and Gupta (2003). Future research on targeting needs to take
cognizance of this potential oversight when computing profits from targeting.
*** Insert Table 7***
Profile of Consumers Targeted
Figures 4a and 4b show the posterior segment probabilities of households targeted by
Heinz 32 oz and Hunt’s 32 oz respectively.20 In equilibrium, since Heinz targets almost entirely
through coupons for the popular Heinz 32 oz, we profile only households receiving coupons for
Heinz 32 oz. Heinz 32 oz targets the price sensitive households. Segment 3 (price sensitive, 19 This is consistent with the finding of Shaffer and Zhang (2002) that the benefits of price discrimination are greater for the larger market share firm 20 For the sake of exposition in Figures 4a and 4b we label the segments based on some striking characteristics of each segment. Segment 1 is labeled ‘price sensitive Heinz 32 loyals’, segment 2 is labeled ‘light user, Heinz 28 loyals’ and segment 3 is labeled ‘price sensitive heavy users’.

25
heavy users) receives the most coupons from Heinz; households receiving a Heinz 32 coupon
have a 67% probability of being in Segment 3 and 32% probability of being in Segment 1. Heinz
thus increase the profit margins from Segment 1 likely households (47% of market size), but
competes aggressively with lower prices for Segment 3 likely households (29% of market size).
Overall, Heinz offers targeted coupons to about 32% of households in the market.
*** Insert Figures 4a and 4b***
Consumers targeted by Hunt’s 32 are predominantly from segment 3 (the most price
sensitive segment, that marginally favors the cheaper Hunt’s brand). Given the lack of strong
loyalty, Hunt’s uses coupons to defend market shares in this segment. Hunt’s 32 oz offers
coupons relatively infrequently to households belonging to other two segments. Overall, Hunt’s
offers targeted coupons to only about 9% of households in the market.
Identifying Sources of Targeting Profits
The increase in profits from 1:1 targeting arises from three sources: higher margins,
higher brand shares and consumption expansion. Ketchup consumption is unlikely to expand
much merely due to couponing; indeed category purchase expansion due to targeting is only
0.2%. We report the effect of targeting on each brand’s shares and profit margins (in the full
purchase history case) in Table 8 below. The average margins across all households are
calculated by appropriately weighting the margins using household level brand shares.
*** Insert Table 8***
The gain in profits for Heinz 32 oz is essentially from price discrimination. Its average
margins increase by about 2.8%, while brand share increased by about 0.3%. In contrast, Hunt’s
share goes up by 2.9%, margins increase by 0.7%. As the smaller brand, Hunt’s takes advantage
of the increase in prices by Heinz to increase its share (on its smaller base), even with a price
increase. Thus Heinz prices less aggressively than Hunt’s, because as the larger brand it is able to
gain more from 1:1 pricing.
Targeting by Heinz 32 is more extensive, with about 32% of consumers being targeted
compared to only 9% of consumers targeted by Hunt’s 32. The depth of discounts issued by

26
Heinz is also greater than that of Hunt’s 32 oz, but the aggregate prices of Heinz 32 increases
due to this selective discounting.
Evaluating Strategic Options for the Customer Data Intermediary
We next evaluate the optimal strategies for the customer data intermediary (CDI). Since
the CDI always gains by selling to either Heinz or Hunt’s, the price it can charge from a given
client is the difference in profits of the client in the particular scenario being evaluated, relative
to the scenario when only one of the other clients will receive the targeting service. For example,
the price that the CDI can charge from selling to Heinz (denoted as firm 1) exclusively when
selling the full purchase history is 10 011 1 1
fP = Π −Π 74534 73260 1,274= − = . Table 9 shows the
price that Catalina will charge and its profits (assuming zero costs) in each of the targeting
scenarios.
*** Insert Table 9***
It is clear from the table that the profit for the CDI is greatest when both Heinz and
Hunt’s target using the full purchase history ($1475). Therefore the firm will sell the targeting
service to both firms (“whom to sell to?” or the optimal customer strategy), using the full
purchase history of 100 weeks available (“what to sell?” or the optimal product strategy) at a
price of $1,440 to Heinz and $35 to Hunts (“for how much to sell?” or the optimal pricing
strategy).
The results suggest that the total profits for the customer data intermediary using merely
last visit/last purchase based 1:1 targeting is small compared to the profits obtained from using
the full history. For example with both firms targeting, the 1:1 vendor makes only $21 in profits
from last visit based targeting, whereas it makes $1475 from full visit history based targeting.
Another interesting aspect of the results is that while most of the profits for the customer data
intermediary comes from Heinz, offering the service to Hunt’s (even for free) can increase the
price that can be obtained from Heinz. This is because of the positive externality for Heinz when
Hunt’s uses the service. Heinz profits increase by $1274 when it alone uses the service, but if
Hunt’s also uses the service, Heinz profits increase by $1440.
Thus in this category, Catalina would maximize profits by selling its service on a non-
exclusive basis to both vendors. It should reevaluate its current strategy of offering the service to
only one firm. Further, as we increase the length of purchase data even up to 100 weeks, the
27
profitability of downstream clients continues to increase. Thus restricting the data used for
targeting to 65 weeks is sub-optimal. Specifically, Catalina can improve its profits by increasing
the data used from 65 weeks to 100 weeks by 16%. The main reason is that in infrequently
purchased categories such as ketchup, the information obtained from purchases over 65 weeks of
data is not that large (the median number of purchases in 65 weeks is five). Catalina can improve
its profitability by increasing the length of purchase history used in targeting. As data storage
continues to become cheaper, this should be technologically feasible.
The Retailer’s Perspective on Customer Data Intermediation
The retailer is the point of purchase, the place where the consumer purchase data are
collected, where customized coupons are printed and delivered and where the coupons are
redeemed. The retail loyalty card is most often the means of identifying the consumer and the
coupons are usually redeemable only in the same retail chain where purchases are made. Hence a
plausible scenario is one where a retailer dis-intermediates the intermediary. A second question
of interest is what the value of targeting services will be to a retailer who does not have the
targeting infrastructure and whether a firm like Catalina can benefit from providing the service to
retailers. We therefore examine the roles of the retailer as both a 1:1 service provider and as a
client of a 1:1 service provider.
Retailer as a Customer Data Intermediary
The retailer has two sources of increased profits as a customer data intermediary; first
from the sales of the 1:1 service, but second from the more efficient sales of goods (ketchup) at
the retail store. Table 10 reports these two sources of profits. The profit increase from both
sources is greatest when both manufacturers target using full history. Retailer profits from sales
of ketchup increase by $1,13321 while profits from sales of 1:1 services increases by $1,475.
*** Insert Table 10***
21 In this respect our result varies from that in the theoretical analysis of Liu and Zhang (2006). Liu and Zhang (2006) find that retailer profits fall in the presence of personalized pricing. There could be several reasons for this: (1) They do not consider vertical differentiation in their model of consumer preferences (2) they do not model the store brand, which the retailer owns directly and (3) they assume consumer preferences are fixed, whereas empirically, we use a logit model where consumer preferences are stochastic. Shin and Sudhir (2006) show analytically that vertical heterogeneity in quantities purchased (similar to the heavy user/light user segment in this paper) and stochastic consumer preferences over time are required for firm profits to increase by using personalized pricing.
28
Since the retailer profits from sales of ketchup also go up when manufacturers target, the
retailer could forgo some proportion of its profits from the 1:1 services business in order to
benefit from increase in ketchup profits due to targeting. This provides a compelling economic
rationale for why retailers cooperate with Catalina, especially when they do not have the
technological infrastructure for targeting. The analysis also implies that retailers could be
formidable competitors to a company like Catalina, not only because such retailers may
withdraw themselves from the customer data intermediary network (such as the ‘Catalina
Marketing Network’) but also because they can price their targeting services more aggressively
than a ‘pure’ CDI such as Catalina.22 However, there are two main disadvantages for retailers in
entering the customer data intermediary business. First, Catalina has patented several aspects of
the personalization technology. Second, while a firm like Catalina can provide manufacturers
with one-stop shopping for 1:1 coupon services across the country, retailers can provide the 1:1
service only at their chain. Hence manufacturers will have to negotiate for the targeting services
with multiple retailers if the retailer provided the services. In fact, in the retail industry, there is
other evidence that manufacturers appreciate the benefits of one-stop shopping. For example,
News America, a division of News Corp. currently owns the rights to contract out in-store
feature and display advertising at about 35,000 food, drug and mass merchandisers nationwide
with revenues estimated around $300 million (Neff 2006).
Retailer as a Client of a Customer Data Intermediary
If Catalina provides the 1:1 targeting service to retailers, then retailer profits with full
history increases by about 1.88%, suggesting that targeting services to retailers can be an
important source of revenue for Catalina. Yet, Catalina’s revenues from retail targeting services
is currently only about 9% of its revenues, compared to manufacturer targeting services which
account for 53% of revenues.
At first sight, it is surprising that Catalina has not taken advantage of this potential
revenue stream. A plausible reason for why Catalina has not aggressively marketed the service to
retailers is that, given that retailers are the source of the data, it may be hard for Catalina to
extract the surplus created by targeting from retailers. Therefore the prices that Catalina can
22 In personal conversations with an official at leading retailer who wishes to remain anonymous, we learnt that the retailer provides targeting services informally (for free) to manufacturers.

29
charge from retailers cannot be as high as those from manufacturers. It also raises broad
interesting questions about the property rights with respect to the data and how profits from the
use of data should be shared. These issues require more detailed examination in future work.
6. Conclusion
The potential for customer data intermediaries has been growing due to advances in data
collection and analysis technologies as well as advertising and promotion delivery technologies.
In contrast to extant research on this topic that has an “engineering” orientation, this paper
develops an empirical approach to answer strategic questions of interest to customer data
intermediaries.
Our analysis enabled us to obtain interesting substantive insights of interest to a customer
data intermediary such as Catalina. First, as discussed in the introduction, Catalina is currently
re-evaluating its policy of offering targeting services on an exclusive basis to manufacturers.
Given the reservations expressed in the theoretical literature about the negative externalities
induced by competitive targeting, Catalina indeed needs to be careful in shifting from its extant
policy of selling its targeted couponing services only on an exclusive basis. Our analysis shows
that in the category we analyze, Catalina can increase its profits by selling to multiple
manufacturers. By performing such an analysis on a category-by-category basis, Catalina can
identify categories in which it can improve profits by changing its exclusive selling policy.
Second, we offer the insight that the retailer is likely to be a potent competitor to
Catalina. Ginocchio, Chesler and Clark (2005) suggest that a major threat to Catalina’s growth is
the growing market share of Wal-Mart in groceries. Since Wal-Mart does not offer targeted
coupons and is not part of Catalina’s network, this can hamper Catalina’s growth. According to
the report, a second major threat is from Valassis Communications (currently in the business of
offering coupons in free standing inserts) which is considering entry into Catalina’s targeted
couponing business. The report however suggests that Valassis will find it difficult to replicate
Catalina’s success given Catalina’s strong relationship with retailers.
Our analysis suggests that that the major threat to Catalina may not be from Wal-Mart or
Valassis, but large retailers themselves, because they can effectively subsidize the price of the
customer data intermediary service because it makes considerable increases in its retail profits
due to 1:1 marketing. This threat should be salient given that many retailers (e.g., Tesco in U.K.,

30
Kroger in U.S.) are developing their own technologies for offering 1:1 coupons to customers.23
Indeed the retailer might be the most powerful potential competitor to Catalina in the future.
What would happen if there is competition among customer data intermediaries either
because the retailer entered the market or if the retailer supplied the data to multiple CDIs? In
such a scenario, a syndication strategy by both 1:1 service providers would not be optimal
because neither firm would make any profit given that they would sell homogeneous goods. An
exclusive strategy where they sell to different downstream clients is likely to be optimal, since it
would create product differentiation.
Finally, we find that Catalina can benefit from increasing the length of purchase history it
uses in its targeting services, from the current self-imposed limit of 65 weeks. Even if storage
costs are a reason for the current limit of length of purchase history used, the declining costs of
storage and computing speeds should make it possible for Catalina to increase the length of
history used for 1:1 marketing in the future profitably.
There are a number of ways in which this research can be extended. First, it would be
useful to investigate the robustness of our results across multiple categories. We chose the
ketchup category to compare our results against Besanko, Dube and Gupta (2003). While the
gains from targeting in the ketchup category are low, a Catalina executive told us that they
expect substantially higher gains in categories such as snack foods where there is also potential
for category expansion in profits due to targeting. It is quite possible that alternative channel
structures may exist in other product categories / other retail chains, and it would be useful to
study customer data intermediaries in product categories/retail chains where channel structures
such as the Retailer Stackelberg or the Vertical Nash are more appropriate.
We can expand upon the nature of personalization data used for targeting. Since we did
not find demographics to be useful, we treat “purchase history length” as the proxy for data
quality. As discussed, quality may be increased through greater “breadth” of the data by
integrating purchase behavior from other categories. Though estimation and optimization is
computationally much harder across categories, we believe this is an important area for future
work. In general, this approach can identify the potential profitability of cross-selling services.
23 Senior managers at certain leading supermarket chains have stated in discussions with us that they offer targeted coupon services for free to all their manufacturers, while some other retailers charge for the service.

31
Future research should investigate the impact of greater flexibility in couponing and
pricing approaches offered by the 1:1 service provider. In this paper, we follow previous research
(Rossi, McCulloch and Allenby 1996, Besanko, Dube and Gupta 2003) in assuming that coupons
are valid only for the week of issue. In practice, coupons are valid for multiple weeks and
consumers can time when they would use the coupon; firms would then have to account for such
dynamic behavior by consumer in issuing the coupon. Modeling timing of coupon redemption
therefore requires empirically modeling dynamics and forward looking behavior on both the
consumer side (e.g., Gonul and Srinivasan 1996) and firm side (e.g., Gonul and Shi 1998). We
leave this as an interesting area for future research. Also we model the upper threshold of the fee
that Catalina can charge manufacturers, given our objective of identifying the best strategy for a
1:1 service provider. This is also consistent with the two part-pricing which Catalina currently
uses where the fixed price for the service varies considerably across categories. Nevertheless, a
systematic investigation of alternative pricing schemes based on the number and value of
coupons issued or redeemed would be an interesting problem for future research.
We have assumed in this paper that retailers use the same level of information as that
purchased by the manufacturer from the customer data intermediary.24 We make this assumption
because of the need for “common knowledge” between the manufacturer and retailer in order to
solve the manufacturer-retailer pricing game. The implications of relaxing this common
knowledge assumption needs to be studied in future research, but this requires methodological
advances in the game theory literature.
Finally, we hope that that the approach used in this paper will inspire additional research
to facilitate decision making in other customer data intermediary contexts such as in durable
goods markets, financial services, catalog marketing and targeted advertising. In the contexts of
durable goods or financial services, there will be shorter purchase histories, but greater
information across categories that can be used for 1:1 marketing. In the context of targeted
advertising services, the empirical model needs to calibrate the impact of advertising (rather than
couponing) on consumer purchasing decisions. One can also use the analytical approach used in
this paper to domains other than 1:1 marketing. For example one could analyze the optimal
licensing/selling of a patented innovation (e.g., Katz and Shapiro 1985). Licensing of an
24 This is the same assumption as in Besanko, Dube and Gupta (2003). We thank an anonymous reviewer for raising this issue.

32
innovation to multiple downstream firms may create greater competition downstream and thus
reduce the total value of the innovation relative to the strategy of exclusively selling the patent to
one firm. In short, while appropriate changes are needed for the model to deal with institutional
details appropriate for each context, the general framework of understanding the tradeoffs
involved in improving quality and selling to exclusive/multiple clients will continue to be
relevant. More broadly, we hope that this approach will spawn similar complementary research
to game theoretic analysis on other marketing institutions to help decision makers and managers
obtain empirically driven answers to their business strategy questions.

33
References
Adomavicius,G., R. Sankaranarayanan, S. Sen and A. Tuzhilin (2005), “Incorporating
Contextual Information in Recommender Systems Using a Multidimensional Approach,”
ACM Transactions on Information Systems, 23(1), 103- 144.
Ainslie, Andrew and Peter E. Rossi (1998) "Similarities in Choice Behavior across Product
Categories", Marketing Science, 1998, 17(2), pp. 91-106.
Allenby, A. and P.E. Rossi (1998), “Similarities in Choice Behavior Across Product Categories”,
Marketing Science, 17(2), 91-105.
Allenby, G.M., N. Arora and J.L. Ginter (1998), “On the Heterogeneity of Demand”, Journal of
Marketing Research (August 1998), 35(3), 384-389.
Andrews, R.L., A. Ainslie and I.S. Currim (2002), “An Empirical Comparison of Logit Choice
Models with Discrete Versus Continuous Representations of Heterogeneity”, Journal of
Marketing Research (November 2002), 39(4), 479-487.
Ansari, Asim M. and Carl Mela (2003), “E-Customization”, Journal of Marketing Research, 40
(2), 2003, 131–46.
Berto Villas-Boas, S. (2004), “Vertical Contracts Between Manufacturers and Retailers:
Inferences with Limited Data”, Working Paper, University of California at Berkeley.
Berto Villas-Boas, S. and Rebecca Hellerstein (2006), “Identification of Supply Models of
Manufacturer and Retailer Oligopoly Pricing”, Economics Letters, 90(1), 132-140.
Besanko,D., S. Gupta and D. Jain (1998), “Logit Demand Estimation Under Competitive Pricing
Behavior: An Equilibrium Framework,” Management Science (November), 1533-47.
Besanko, D., J.P. Dube and S. Gupta (2003), “Competitive Price Discrimination Strategies in a
Vertical Channel using Aggregate Retail Data,” Management Science (September), 49
(9), 1121-1137.
Blattberg, R.C. and S.A. Neslin (1990), “Sales Promotion: Concepts, Methods and Strategies”,
Prentice Hall, Englewood Cliffs, New Jersey.
Chen, Yongmin (1997), “Paying Customers to Switch”, Journal of Economics and Management
Strategy, Vol. 6, 877–897.
Chen, Yuxin and Ganesh Iyer (2002), "Consumer Addressibility and Customized Pricing,"
Marketing Science, 21(2), 197-208.

34
Chen, Y., C. Narasimhan and Z.J. Zhang (2001), “Individual Marketing with Imperfect
Targetability”, Marketing Science, 20, 23-43.
Chen, Y. and Z.J. Zhang (2004), “The Benefit of Behavior-Based Targeted Pricing with Strategic
Consumers”, working paper, New York University and University of Pennsylvania.
Chintagunta, Pradeep K. (2002), “Investigating category pricing behavior at a retail chain”,
Journal of Marketing Research, 39(2), 141-155.
Feinberg, F.M., A. Krishna and Z. J. Zhang (2002), “Do We Care What Others Get? A
Behaviorist Approach to Targeted Promotions”, Journal of Marketing Research, 39(3),
277-281.
Fudenberg, D. and J. Tirole (2000), “Customer Poaching and Brand Switching,” Rand Journal of
Economics, 31(4), 634-657.
Ginocchio, P., Chesler,M., and Clark, D.T. (2005), “Catalina Marketing: No Coupons at Wal-
Mart”, Deutsche Bank Global Equity Research Report, March 2005.
Gonul, F. and M. Shi (1998), “Optimal Mailing of Catalogs: A New Methodology Using
Estimable Structural Dynamic Programming Models”, Management Science, 44(9),
1249-1262.
Gonul, F. and K. Srinivasan (1993), “Modeling Multiple Sources of Heterogeneity in
Multinomial Logit Models: Methodological and Managerial Issues”, Marketing Science,
12(3), 213-229.
Gonul, F. and K. Srinivasan (1996), “Estimating the Impact of Consumer Expectations of
Coupons on Purchase Behavior: A Dynamic Structural Model”, Marketing Science,
15(3), 262-279.
Gupta, Sunil (1988), “Impact of Sales Promotions on When, What, and How Much to Buy”,
Journal of Marketing Research, 25(4), 342-355.
Hausman, J. A. (1978), “Specification Tests in Econometrics”, Econometrica, Vol. 46, No. 6,
Nov., 1978, pp. 1251-1271.
Humby, C. (2004), “The Future of Communications: Is Consumer Marketing Irrevocably
Broken?” Admap, Issue 454, 2-4.
Humby, C., T. Hunt, and T. Phillips (2003), “Scoring Points: How Tesco is Winning Customer
Loyalty,” Kogan Page, London.
35
Iyengar, Raghuram, Asim Ansari and Sunil Gupta (2003), "Leveraging Information Across
Categories," Quantitative Marketing and Economics, 1(4), 425-465.
Iyer, G. and D. Soberman (2000), “Markets for Product Modification Information,” Marketing
Science, 19(3), 203-225.
Iyer, G., M. Villas-Boas and D. Soberman (2005) “The Targeting of Advertising” Marketing
Science, 2005, 24, 461-476.
Kamakura, W.A. and G.J. Russell (1989), “A Probabilistic Choice Model for Market
Segmentation and Elasticity Structure”, Journal of Marketing Research, 26, 379-390.
Katz, M.L. and K. Shapiro (1985), “On the Licensing of Innovations,” Rand Journal of
Economics, 16(4), 504-520.
Liu, Duen-Ren and Ya-Yueh Shih (2005), “Hybrid Approaches to Product Recommendation
Based on Customer Lifetime Value and Purchase Preferences”, The Journal of Systems
and Software, 77(2), 181-191.
Liu, Y. and Z. Zhang (2006). The Benefits of Personalized Pricing in a Channel. Marketing
Science, 25(1), 97-105.
McFadden, D. (1981), “Econometric Models of Probabilistic Choice,” in Structural Analysis of
Discrete Data with Econometric Applications, ed. By C. Manski and D. McFadden, MIT
Press, Cambridge, MA.
Miller, Paul (2003), “Lists and Prospecting: Who's Who among the Consumer Co-op
Databases”, Multichannel Merchant, Dec 1.
(http://multichannelmerchant.com/catalogage/database/marketing_cheat_sheet_whos/).
Murthi, B.P.S. and S. Sarkar (2003), “The Role of the Management Sciences in Research on
Personalization”, Management Science, 49(10), pp. 1344-1362.
Neff, Jack (2006), “Murdoch Plan Locks Up the Store,” Advertising Age, 77(5), January 30, p1-
2.
Petrin, A. and K.E. Train (2003), “Omitted Product Attributes in Discrete Choice Models,”
NBER Working Paper No.W9452, National Bureau of Economic Research, Cambridge,
MA.
Peppers, D., and M. Rogers (1997), “Enterprise One to One: Tools for Competing in the
Interactive Age,” Double Day, New York.

36
Rossi, P.E., R.E. McCulloch and G.M. Allenby (1996), “The Value of Purchase History Data in
Target Marketing,” Marketing Science, 15, 321-340.
Seetharaman, P.B., (2004), "Modeling Multiple Sources of State Dependence in Random Utility
Models: A Distributed Lag Approach." Marketing Science, 23 (2), 263-271.
Shaffer, G. and Z.J. Zhang (1995), “Competitive Coupon Targeting”, Marketing Science, 14(4),
395-417.
Shaffer, G. and Z.J. Zhang (2002), “Competitive One-to-one Promotions”, Management
Science, 48(9), 1143-1160.
Shin, J. and K. Sudhir (2006), “Competitive CRM: Should We Punish or Reward Our Current
Customers?” Working Paper, Yale University.
Silva-Risso, J. M, Randolph E. Bucklin; Donald G. Morrison (1999), "A Decision Support
System for Planning Manufacturers' Sales Promotion Calendars", Marketing Science,
Vol. 18, No. 3, pp. 274-300.
Sudhir, K. (2001), “Structural Analysis of Manufacturer Pricing in the Presence of a Strategic
Retailer”, Marketing Science, 20(3), 244-264.
Taylor, Curtis R. (2003), “Supplier Surfing: Price-Discrimination in Markets with Repeat
Purchases,” RAND Journal of Economics, 34, 223-246.
Thisse, Jacques-Francois and Xavier Vives (1988), “On the Strategic Choice of Spatial Price
Policy”, The American Economic Review, 78(1), 122-137.
Villas-Boas, M. and R. Winer (1999), “Endogeneity in Brand Choice Models,” Management
Science, 45(10), 1324-1338.
Villas-Boas, M. (1999), “Dynamic Competition with Customer Recognition,” Rand Journal of
Economics, 30(4), 604-631.
Villas-Boas J, M. (2004), "Price Cycles in Markets with Customer Recognition", RAND Journal
of Economics, 2004, 35(3), 486-501.
Villas-Boas, M. and Ying Zhao (2005), “Retailer, Manufacturers, and Individual Consumers:
Modeling the Supply Side in the Ketchup Marketplace”, Journal of Marketing Research,
2005, 42, 83-95.
Wedel, M. and W.A. Kamakura (2000), Market Segmentation: Conceptual and Methodological
Foundations, 2d ed. Boston: Kluwer Academic Publishers.
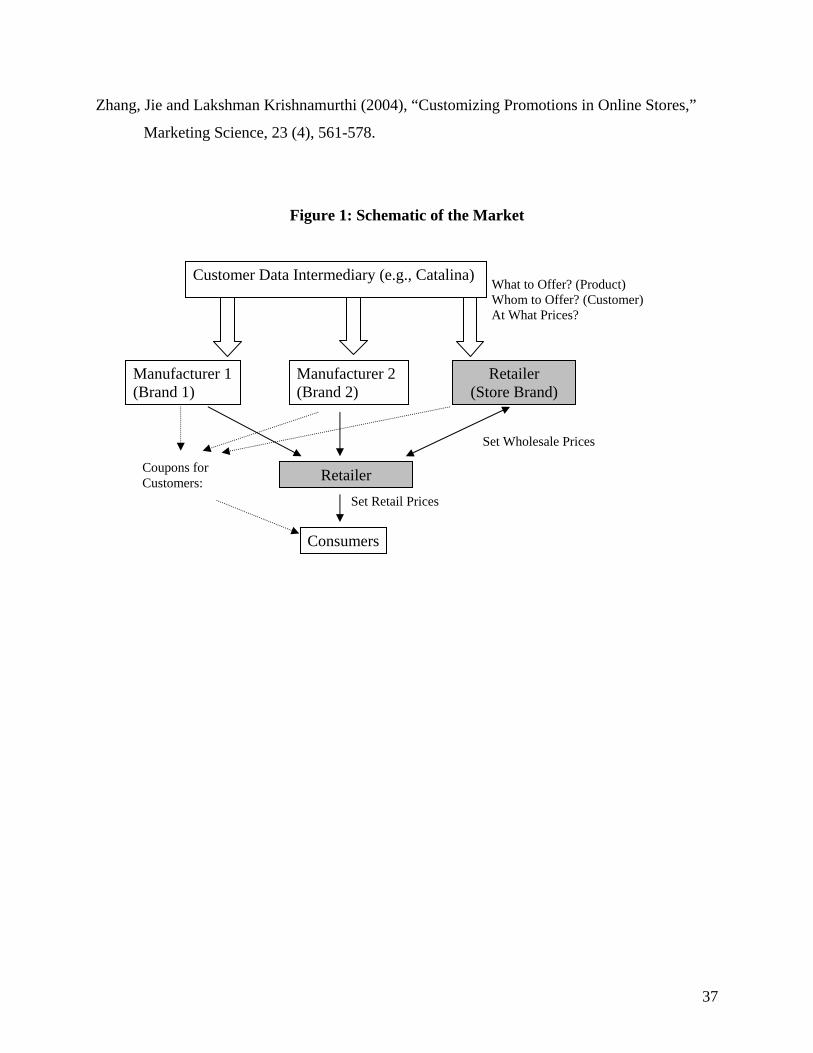
37
Zhang, Jie and Lakshman Krishnamurthi (2004), “Customizing Promotions in Online Stores,”
Marketing Science, 23 (4), 561-578.
Figure 1: Schematic of the Market
Customer Data Intermediary (e.g., Catalina)
Manufacturer 1 (Brand 1)
Manufacturer 2 (Brand 2)
Retailer (Store Brand)
Retailer
Consumers
Coupons for Customers:
What to Offer? (Product) Whom to Offer? (Customer) At What Prices?
Set Retail Prices
Set Wholesale Prices

38
Figure 2: Decision Tree and Payoffs
Both Mfrs Accept
Offer Mfr 1 at 1
fP Offer Mfr 2 at 2
fP Offer Both Mfrs at 1
bP , 2
bP
Full HistoryLast PurchaseLast Visit
CDI: “What” to Sell?
CDI: “Whom” to Offer? At What Price?
Mfr 1 Rejects
Mfr 2 Rejects
Mfr 2 Accepts Mfr 2 Rejects
CDI: Offer Other Mfr; At What Price?
Neither Mfr Accepts
Mfr 1 Rejects Mfr 1 Accepts
Phase II Payoffs
1
fP 10
1 1
fPΠ − 10
2Π
Phase II Payoffs
2
sP 01
1Π 01
2 2
sPΠ −
Phase II Payoffs
0
00
1Π 00
2Π
Phase II Payoffs
2
fP 01
1Π 01
2 2
fPΠ −
Phase II Payoffs
1
sP 10
1 1
sPΠ − 10
2Π
Phase II Payoffs
0 00
1Π 00
2Π
Phase II Payoffs
1 2
b bP P+ 11
1 1
bPΠ − 11
2 2
bPΠ −
Phase II Payoffs
1
bP 10
1 1
bPΠ − 10
2Π
Phase II Payoffs
0 00
1Π 00
2Π
Only Mfr 2 Accepts
Only Mfr 1 Accepts Phase II
Payoffs
2
bP 01
1Π 01
2 2
bPΠ −
… …
Mfr 2 Accepts
Mfr 1: Accept/Reject Mfr 2: Accept/Reject Mfr 1 and 2: Accept/Reject
Mfr 1 Accepts
Mfr 2: Accept/Reject
Offer Mfr 2 at 2
sP Offer Mfr 1 at 1
sP
Mfr 1: Accept/Reject
CDI: Offer Other Mfr; At What Price?
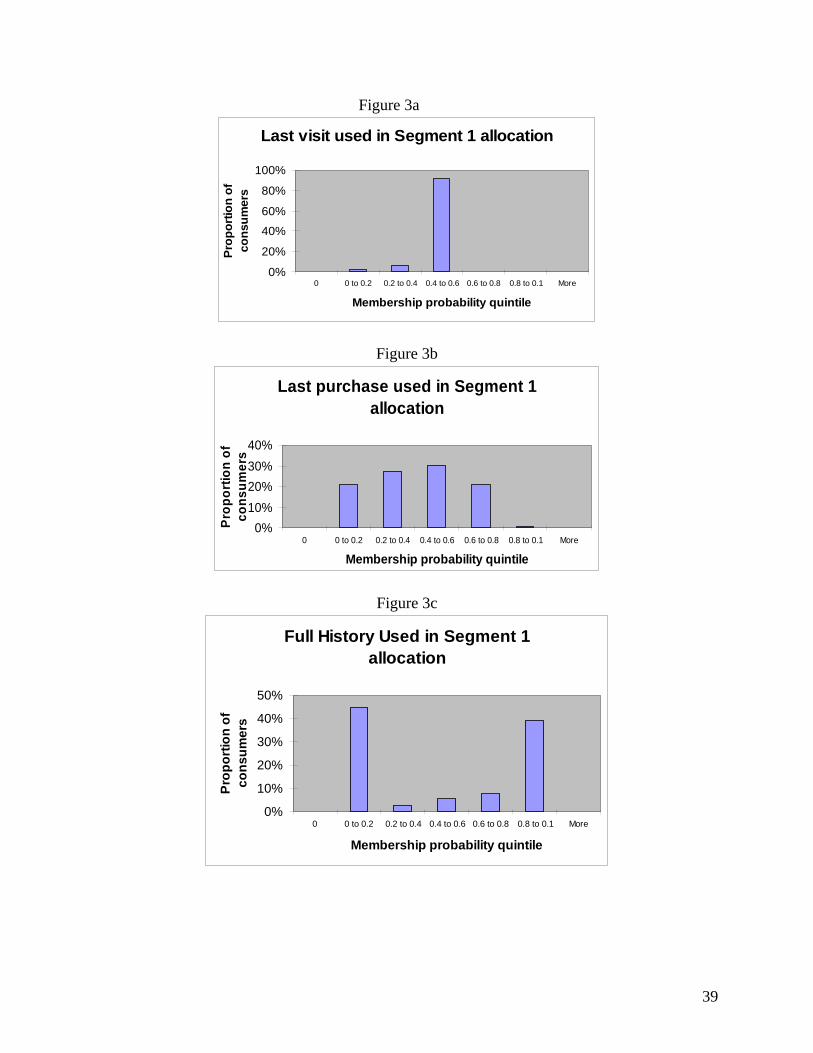
39
Figure 3a
Last visit used in Segment 1 allocation
0%
20%
40%
60%
80%
100%
0 0 to 0.2 0.2 to 0.4 0.4 to 0.6 0.6 to 0.8 0.8 to 0.1 More
Membership probability quintile
Prop
ortio
n of
co
nsum
ers
Figure 3b
Last purchase used in Segment 1 allocation
0%10%20%30%40%
0 0 to 0.2 0.2 to 0.4 0.4 to 0.6 0.6 to 0.8 0.8 to 0.1 More
Membership probability quintile
Prop
ortio
n of
co
nsum
ers
Figure 3c
Full History Used in Segment 1 allocation
0%
10%
20%
30%
40%
50%
0 0 to 0.2 0.2 to 0.4 0.4 to 0.6 0.6 to 0.8 0.8 to 0.1 More
Membership probability quintile
Prop
ortio
n of
co
nsum
ers

40
Figure 4a
Posterior Segment Probabilities of Heinz Targeted/Non Targeted Households
0.32
0.01
0.67
0.35
0.1
0.55
00.10.20.30.40.50.60.70.8
Price sensitiveHeinz 32
loyals(0.47)
Light users,Heinz 28 loyals
(0.24)
Price sensitiveheavy users
(0.29)Segments
Aver
age
Post
erio
r P
roba
bilit
yHeinz 32 targets (32%)Heinz 32 does not targets(68%)
Figure 4b
Posterior Segment Probabilities of Hunt's Targeted/Non Targeted Households
0.120
0.88
0.51
0.27 0.22
00.10.20.30.40.50.60.70.80.9
1
Price sensitiveHeinz 32
loyals(0.47)
Light users,Heinz 28 loyals
(0.24)
Price sensitiveheavy users
(0.29)Segments
Ave
rage
Pos
terio
r Pr
obab
ility
Hunt’s 32 targets (9%)Hunt’s 32 does not target (91%)

41
Table 1: Illustrative Set of Customer Data Intermediaries (latest available figures) Company/ Division
Revenue ($ mil.)
% of total company revenue
Market Cap ($ mil.)
Client profile, Client examples
Revenue Growth rate
Description
Catalina Marketing, Inc@
431 100% 1320 Manufacturers of packaged goods, grocery retailers e.g. Nestle, Safeway
8% p.a. over 2000-2004, non-core divestments reduced revenue in 2005
Proprietary technology at point of purchase in grocery and pharma retailers to track customer transactions and deliver customized coupons. Tracks over 250 million transactions per week across more than 21,000 supermarkets worldwide, tracks purchase history of over 100 million households in U.S. Delivers more than 4.5 billion customized promotional messages.
Doubleclick, Inc (Abacus B2C division)#
105 35% 984 Catalog merchants, e.g., LL Bean, Sharper Image
10%(2004), 15.1% (2003)
Consolidates the input from 1,550 catalog, online, and retail merchants into a single database. Data on over 4.4 billion transactions from catalog call-centers, websites, and retail stores, made by over 90 million households, with household purchase data stretching back 5 years. Doubleclick was acquired by Hellman and Friedman LLC (a private company) in Q3 2005.
Experian’s z-24 Division@
520 23% NA Catalog companies, e.g., Boston Proper, JJill, Retailers, non-profits
4% in 2005, 6% p.a. over 2001-2004
The Z-24 database is similar to Abacus. Data from over 755 catalogs with 38 million households that have purchased over the last two months. Experian is also a player in B2B targeting with BizInsight’s database of more than 15 million U.S. based businesses.
VT &NH’s Direct Marketing Group’s I-Behavior
NA 100% NA Catalog companies, e.g., Gardener’s Supply, Vermont Country Store
NA
Competitor to Abacus and Z-24, but uses transactional data at the SKU level (in contrast to Abacus and Z-24 which uses catalog level data). 1000+ contributors, mostly medium sized catalog companies, data on 103 million consumers, 89 million households.
Harte Hanks’ Direct Marketing Division#
695 61% 2060 Retailers, finance sector, pharmaceuticals, telecom & high-tech
8.4% (2005), 9% (2004), 2% (2003)
Specializes in providing targeting solutions in automotive, consumer products, financial services, insurance, high tech, pharma, retail and telecom. Provides suite of services from constructing the database (Trillium Software System), accessing the data (Allink® suite, inTouch), in-house data analytics, application and execution of campaigns.
Q Interactive (Owns Cool Savings, Inc) #
17.3 in Q3 NA NA Retailers, packaged goods manufacturers,e.g. Unilever, Land O’ Lakes, Best Buy
20% p.a. over 2001-2004, 92% increase in Q3 2005 compared to Q3 2004
Cool Savings maintains a network of Web sites featuring online coupons, targeted marketing (from 20 million online consumers), lead generation, e-mail marketing, and loyalty programs for more than 1,000 companies in retail, packaged goods, and media industries. Cool Savings was taken over in Jan 2006 by privately owned Q Interactive, an online targeted marketing services provider for advertisers and publishers which uses demographic, behavioral and transactional data.
@ 2005 figures # 2004 figures
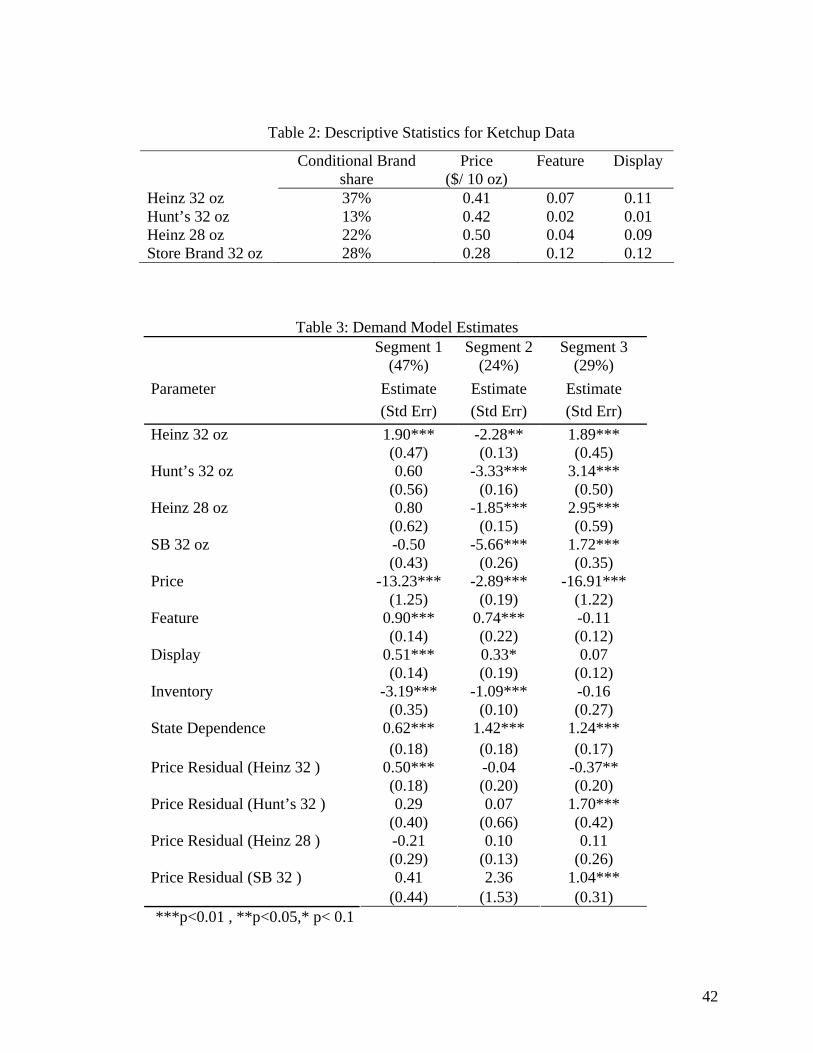
42
Table 2: Descriptive Statistics for Ketchup Data
Conditional Brand share
Price ($/ 10 oz)
Feature Display
Heinz 32 oz 37% 0.41 0.07 0.11 Hunt’s 32 oz 13% 0.42 0.02 0.01 Heinz 28 oz 22% 0.50 0.04 0.09 Store Brand 32 oz 28% 0.28 0.12 0.12
Table 3: Demand Model Estimates Segment 1
(47%) Segment 2
(24%) Segment 3
(29%) Estimate Estimate Estimate Parameter (Std Err) (Std Err) (Std Err) 1.90*** -2.28** 1.89*** Heinz 32 oz (0.47) (0.13) (0.45) 0.60 -3.33*** 3.14*** Hunt’s 32 oz
(0.56) (0.16) (0.50) 0.80 -1.85*** 2.95*** Heinz 28 oz
(0.62) (0.15) (0.59) -0.50 -5.66*** 1.72*** SB 32 oz (0.43) (0.26) (0.35)
-13.23*** -2.89*** -16.91*** Price (1.25) (0.19) (1.22)
0.90*** 0.74*** -0.11 Feature (0.14) (0.22) (0.12)
0.51*** 0.33* 0.07 Display (0.14) (0.19) (0.12)
-3.19*** -1.09*** -0.16 Inventory (0.35) (0.10) (0.27)
0.62*** 1.42*** 1.24*** State Dependence (0.18) (0.18) (0.17)
0.50*** -0.04 -0.37** Price Residual (Heinz 32 ) (0.18) (0.20) (0.20) 0.29 0.07 1.70*** Price Residual (Hunt’s 32 )
(0.40) (0.66) (0.42) -0.21 0.10 0.11 Price Residual (Heinz 28 ) (0.29) (0.13) (0.26) 0.41 2.36 1.04*** Price Residual (SB 32 )
(0.44) (1.53) (0.31) ***p<0.01 , **p<0.05,* p< 0.1

43
Table 4: Mean Price Elasticities for the 3 Segment Model
Change in Share
Change in Price Heinz 32 Hunt’s 32 Heinz 28 SB 32
Heinz 32 -3.52 0.06 0.04 0.05 Hunt’s 32 0.03 -5.18 0.02 0.09 Heinz 28 0.03 0.03 -2.20 0.03 Store Brand 32 0.03 0.11 0.02 -4.14
Table 5: Cost Equation Estimates Parameter Estimate (Std Err) Heinz 32 oz 0.036 (0.072) Hunt’s 32 oz 0.088 (0.072) Heinz 28 oz 0.038 (0.073) SB 32 oz -0.041 (0.072) Tomatoes 0.152* (0.063)
* p <0.01

44
Table 6: Incremental Profits from 1:1 Coupons
Last Visit Last Purchase Full History
Targeting by
Heinz Hunt’s Heinz t-stat relative to Last Visit
Hunt’s t-stat relative to Last Visit
Heinz t-stat relative to Last Purchase
Hunt’s t-stat relative to Last Purchase
Neither Profits 73,301 4,139 73,301 4,139 73,301 4,139
Hunts only
Profits 73,317 4,139 73,301 -7.80* 4,139 -0.99n.s 73,260 -2.92* 4,154 8.22*
% Increase relative to No Targeting
0.02% 0.00% 0.00% 0.00% -0.06% 0.36%
t-stat relative to No Targeting
8.06* -0.74ns 20.52* -1.79 ns -2.84* 8.13*
Heinz only
Profits 73,304 4,139 73,620 38.41* 4,145 15.09* 74,534 27.64* 4,139 -7.27*
% Increase relative to No Targeting
0.00% 0.01% 0.43% 0.16% 1.68% 0.00%
t-stat relative to No Targeting
3.43* 8.82* 37.36* 16.19* 35.84* 1.39ns
Heinz & Hunts
Profits 73,338 4,139 73,620 47.15* 4,145 13.53* 74,700 34.92* 4,174 13.02*
% Increase relative to No Targeting
0.05% 0.01% 0.44% 0.15% 1.91% 0.84%
t-stat relative to No Targeting
10.94* 5.35* 37.39* 16.81* 40.79* 16.45*
ns: not significant *: p < 0.01

45
Table 7: Accuracy in Computing Targeting Profits Heinz profits ($) Hunt’s profits ($)
No firm targets (aggregate behavior) 66,628 4,116
73,301 4,139 No firm targets (true individual behavior) (10.02%) (0.56%)
73,338 4,139 Both firms target with last visit data (10.07%) (0.56%)
73,620 4,145 Both firms target with last purchase data (10.49%) (0.70%)
74,700 4,174 Both firms target with full history data (12.12%) (1.41%)
Table 8: Effect of 1:1 Coupons on Shares, Margins and Category Purchase
Both target using full history
Heinz Hunt’s Hz 32: +0.3% Average increase in share Hz 28: +0.4%
Ht 32: +2.9%
Hz 32: +2.8% Increase in (share weighted) margins Hz 28: +0.6%
Ht 32: +0.7%
Average increase in category purchase +0.2%

46
Table 9: Price and Customer Data Intermediary Profits under Alternative 1:1 Marketing
Scenarios
Table 10: Incremental Retailer Profits from Customer Data Intermediation
Last Visit Based Targeting Full History Based Targeting $ $
Price for Heinz
Price for Hunt’s
Total Profits
Price for Heinz
Price for Hunt’s
Total Profits
No firm targets 0 0 0 0 0 0
Hunt’s only targets 0 0 0 0 15 15
Heinz only targets 0 0 0 1,274 0 1,274
Both firms target 21 0 21 1,440 35 1,475
Full History Based Targeting $
Profits from Ketchup Profits
Profits from CDI Total Retailer Profits
No firm targets 0 0 0
Hunt’s only targets 1,040 15 1,055
Heinz only targets 0 1,274 1,274
Both firms target 1,133 1,475 2,608


