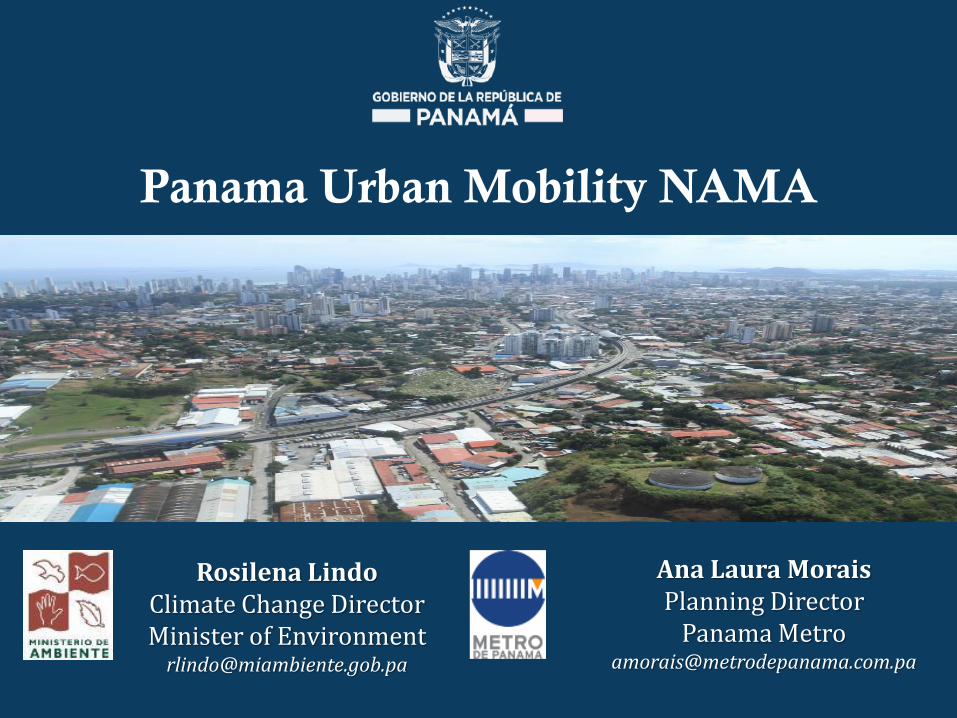
Panama Urban Mobility NAMA
Ana Laura Morais Planning Director
Panama Metro [email protected]
Rosilena Lindo Climate Change Director Minister of Environment

Panama
Population 3,929,141
GDP (nominal) $47.473 billion
GDP (per capita) $11,849
NDC commitment
• 30% of electricity (installed capacity) to come from non conventional renewables in 2050
• 10% increase of carbon intake in LULUCF sector vs baseline scenario in 2050 (80% if supported)
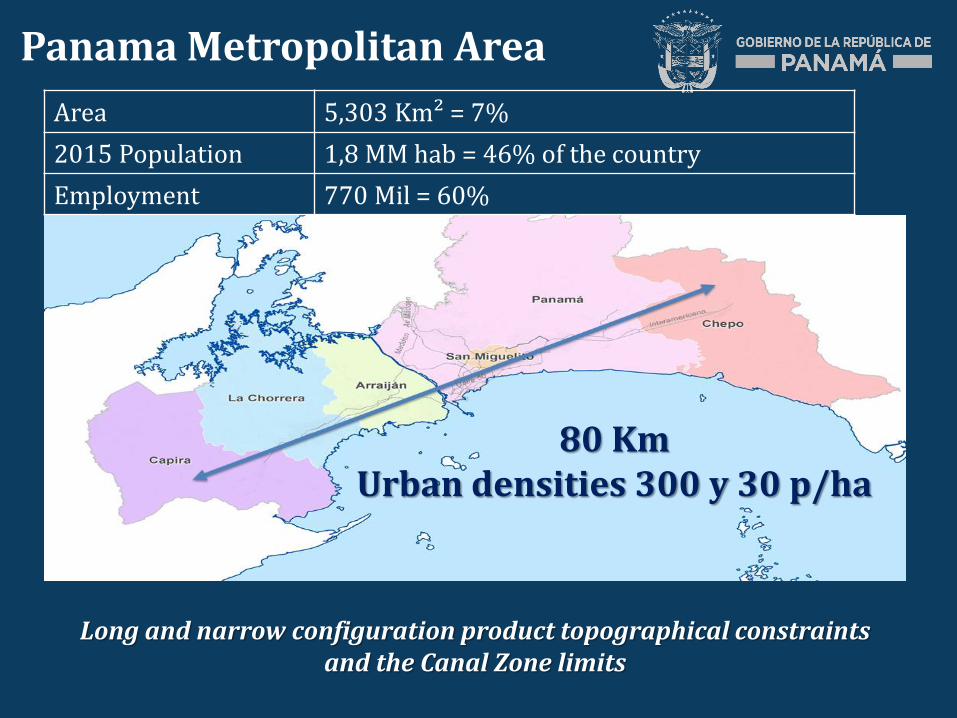
Panama Metropolitan Area
Long and narrow configuration product topographical constraints and the Canal Zone limits
80 Km Urban densities 300 y 30 p/ha
Area 5,303 Km² = 7%
2015 Population 1,8 MM hab = 46% of the country
Employment 770 Mil = 60%
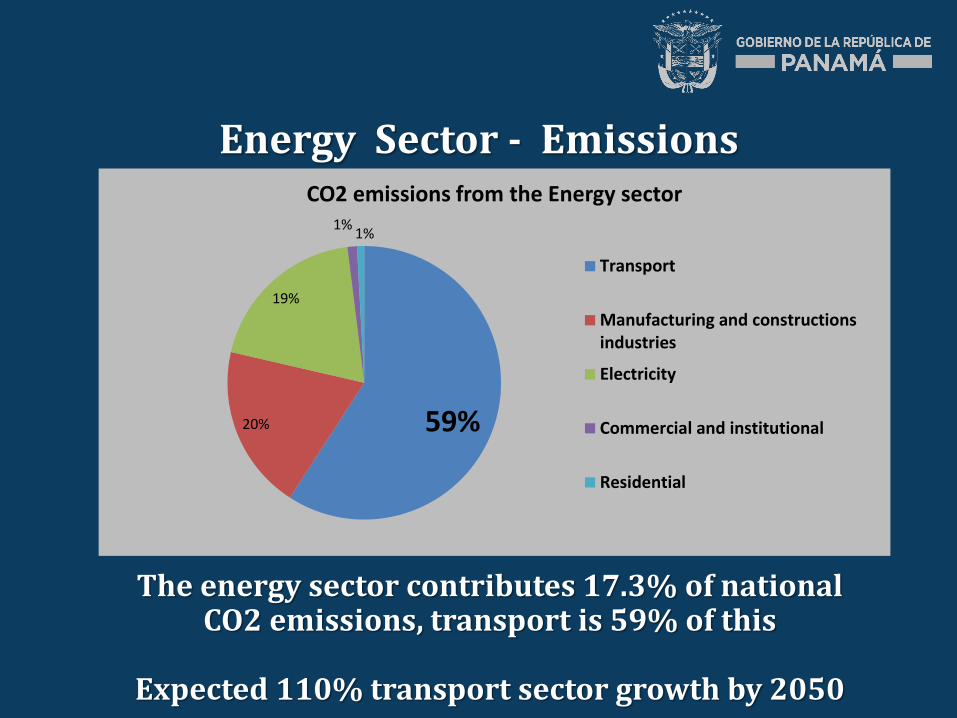
The energy sector contributes 17.3% of national CO2 emissions, transport is 59% of this
Expected 110% transport sector growth by 2050
Energy Sector - Emissions
59% 20%
19%
1% 1%
CO2 emissions from the Energy sector
Transport
Manufacturing and constructionsindustries
Electricity
Commercial and institutional
Residential

Travel Times
Bo
go
tá, C
olo
mb
ia, 6
9
Bo
go
tá, C
olo
mb
ia, 3
8
Sa
n J
osé
, Co
sta
Ric
a, 5
7
Sa
n J
osé
, Co
sta
Ric
a, 3
1
Ca
raca
s, V
en
ezu
ela
, 56
Ca
raca
s, V
en
ezu
ela
, 32
Lim
a, P
erú
, 52
Lim
a, P
erú
, 18
Le
ón
, Mé
xic
o, 5
2
Le
ón
, Mé
xic
o, 2
8
Gu
ad
ala
jara
, Mé
xic
o, 4
8
Gu
ad
ala
jara
, Mé
xic
o, 2
8
Sa
nti
ag
o, C
hil
e, 3
9
Sa
nti
ag
o, C
hil
e, 2
4
AM
P, 6
7
AM
P, 5
6
0
10
20
30
40
50
60
70
80
Transporte público colectivo Transporte particular
TR
AV
EL
TIM
ES
IN
MIN
UT
ES
Travel times for transit and private vehicle are
among the longest in Latin America

• Fragmented institutional structure for mobility infrastructure investment and management.
• Un-integrated public transit with uncontrolled growth of informal sector
• Concentration of activity in center generating one hour average commute time
• Sub-optimal multi-modal transport infrastructure
Barriers to transport GHG mitigation
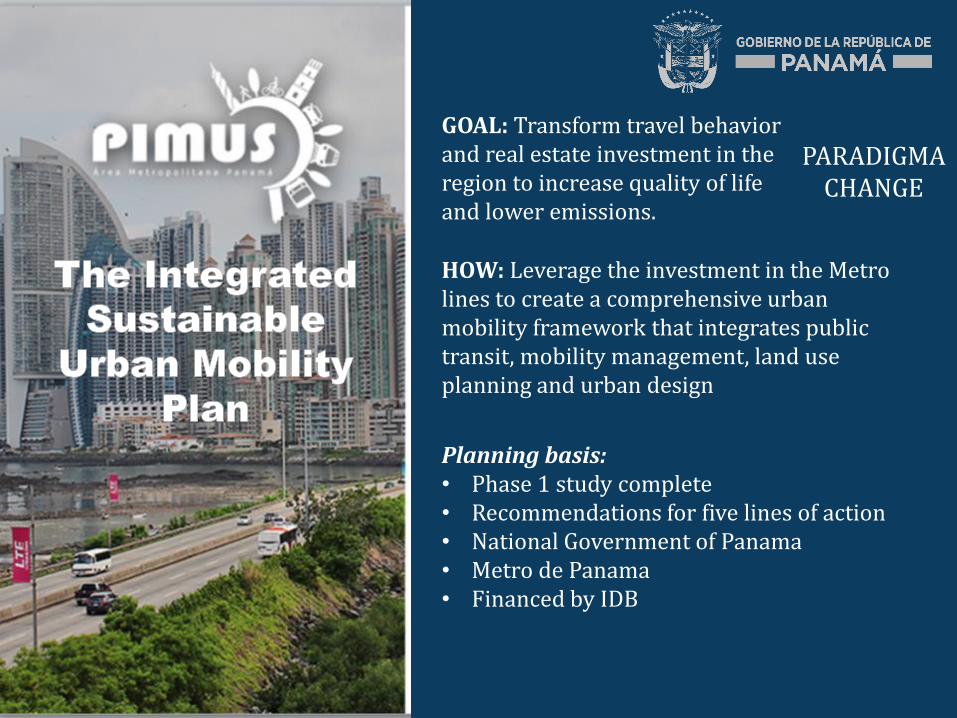
GOAL: Transform travel behavior and real estate investment in the region to increase quality of life and lower emissions.
HOW: Leverage the investment in the Metro lines to create a comprehensive urban mobility framework that integrates public transit, mobility management, land use planning and urban design
Planning basis: • Phase 1 study complete • Recommendations for five lines of action • National Government of Panama • Metro de Panama • Financed by IDB
PARADIGMA CHANGE

Panama Urban Mobility NAMA Proposal
PIMUS (Integral Plan of Sustainable Urban
Mobility)
Institutional restructuration
Integrated public transport pasanjger system (SIT)
Transport demandadministration
Invesment in Urban MobilityInfrastructure
Citizen involvement in UrbanMobility
EmissionReductions
Urban Mobility NAMA(Ministry of Environment)
Aditional FinancialSource
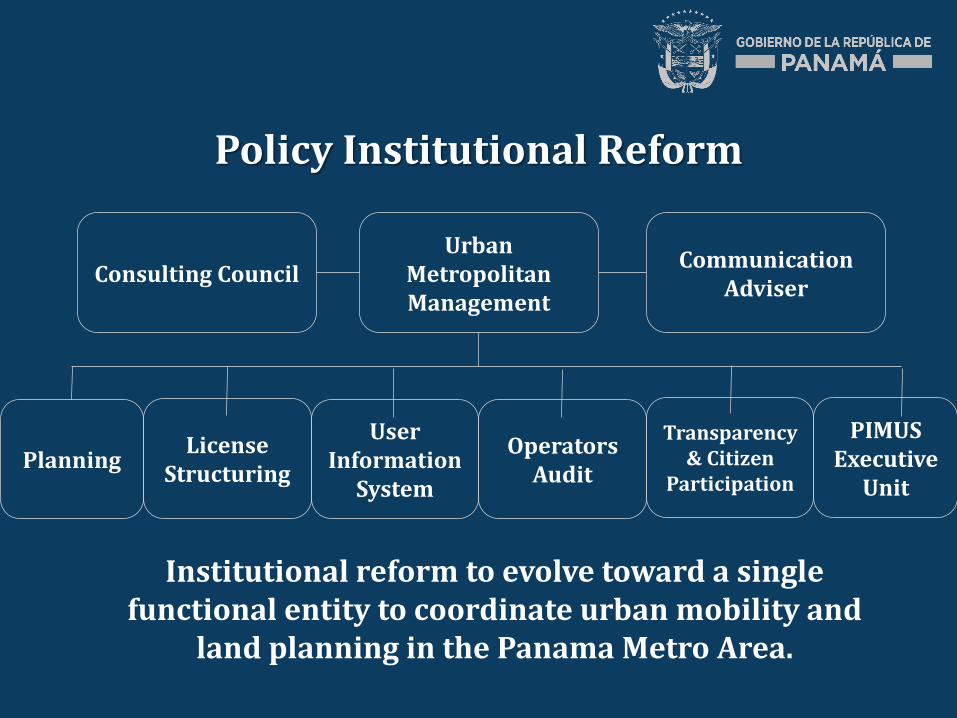
Institutional reform to evolve toward a single functional entity to coordinate urban mobility and
land planning in the Panama Metro Area.
Policy Institutional Reform
Consulting Council Urban
Metropolitan Management
Communication Adviser
Planning License
Structuring
User Information
System
Operators Audit
Transparency& Citizen
Participation
PIMUS Executive
Unit

The elements
• 2025 Metro system 3 lines:
L1 Albrook – Villa Zaita L2 San Miguelito – 24 de Diciembre L3 Albrook – Ciudad del Futuro
• MetroBus
• Central Area (actual)
• North , East and West areas
• Integrated Fare
• Preferential transit lanes
• Improved sidewalks and Complete Streets
• Improved interchanged modal facilities

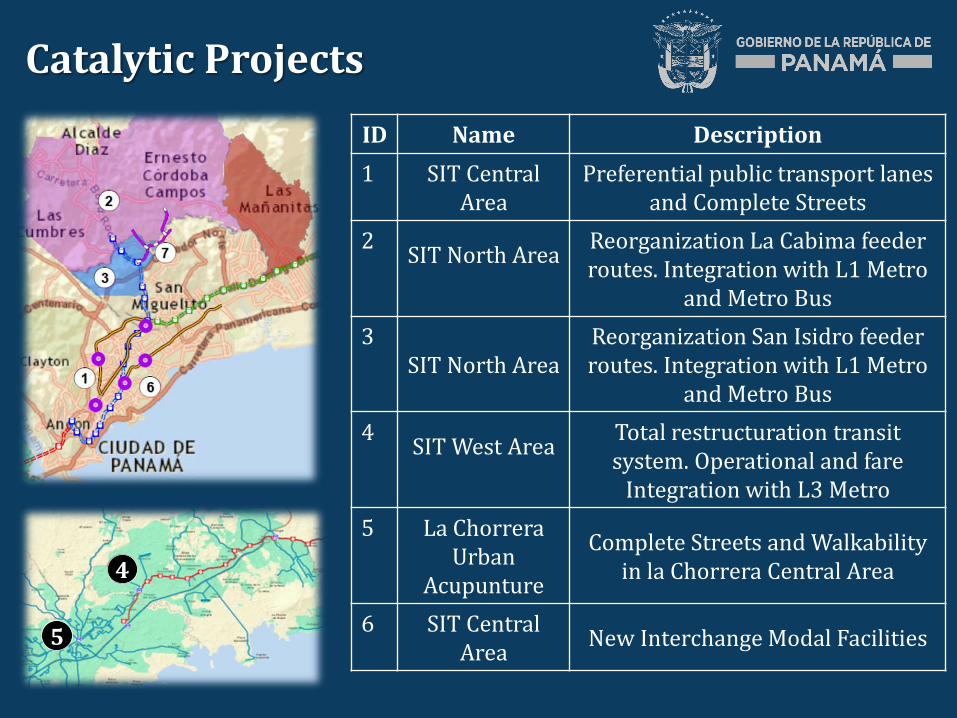
Catalytic projects
Six regionally strategic projects would start to catalyze the transit and demand management programs
North Area
Central Area
West Area
4
5
Catalytic Projects
ID Name Description
1 SIT Central Area
Preferential public transport lanes and Complete Streets
2 SIT North Area
Reorganization La Cabima feeder routes. Integration with L1 Metro
and Metro Bus
3 SIT North Area
Reorganization San Isidro feeder routes. Integration with L1 Metro
and Metro Bus
4 SIT West Area
Total restructuration transit system. Operational and fare
Integration with L3 Metro
5 La Chorrera Urban
Acupunture
Complete Streets and Walkability in la Chorrera Central Area
6 SIT Central Area
New Interchange Modal Facilities

Coordinated implementation:
• Metro de Panama
• Ministry of Public Works
• ATTT
• Municipality of Panama
• Municipality of La Chorrera
Financial coordination:
• Ministry of Finance an Economy
• Secretary of Goals
• CAF
NAMA Implementation

Overall NAMA would reduce metropolitan transport emissions by 13% and result in $14 m in fuel savings annually
Year 2030*
Base Scenery (BAU) 1,403,724
Scenery: PIMUS Implemented
1,235,710
Emission Reduction 168,014
Percentage of Reduction
13%
Annual Savings in Fuel
14 Millones USD
*Annual emissions tCO2e
Expected Social Outcomes

• Decreased travel times
• Better balance of jobs and housing,
• Higher quality transit and pedestrian environment
• Enhanced access to jobs and services
Expected Social Outcomes
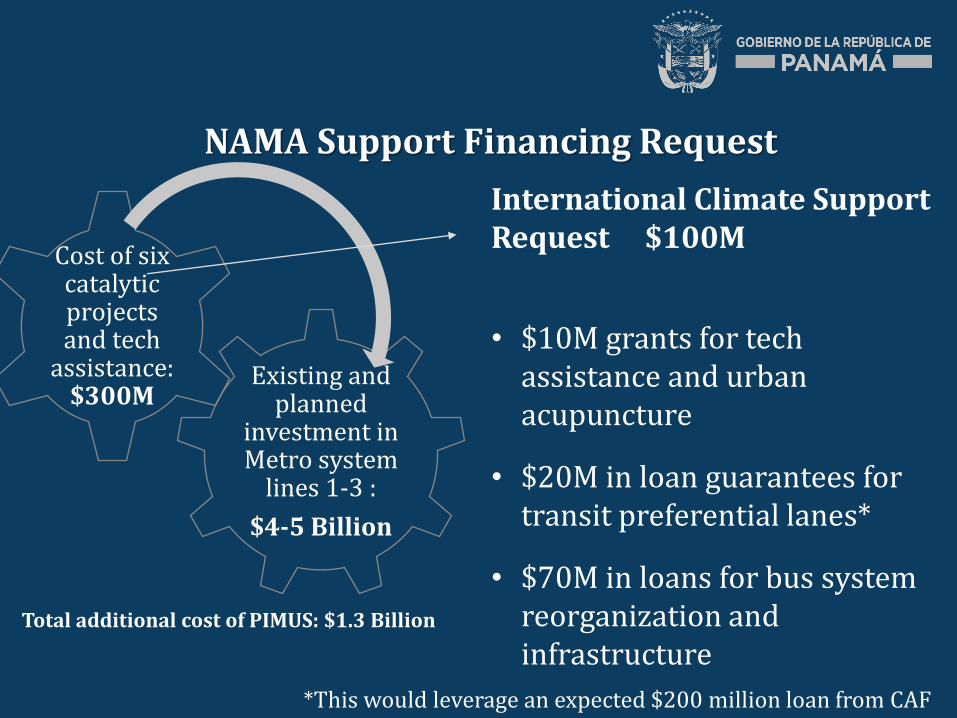
International Climate Support Request $100M
• $10M grants for tech assistance and urban acupuncture
• $20M in loan guarantees for transit preferential lanes*
• $70M in loans for bus system reorganization and infrastructure
NAMA Support Financing Request
Existing and planned
investment in Metro system
lines 1-3 :
$4-5 Billion
Cost of six catalytic projects and tech
assistance: $300M
Total additional cost of PIMUS: $1.3 Billion
*This would leverage an expected $200 million loan from CAF

• Addresses passenger transport sector
comprehensively.
• Advances ongoing paradigm shift in region.
• Provides replicable example for the rest of the nation.
• Improves economic competiveness and quality of life.
• Leverages existing commitment to transit reform.
International support will accelerate the transformation and demonstrate the advantage of a comprehensive approach to
transport sector reform.
Panama Sustainable Urban Mobility NAMA

THANK YOU
Rosilena Lindo Climate Change Director Minister of Environment [email protected]
Ana Laura Morais Planning Director
Panama Metro [email protected]


