
Prediction-Based Admission Control for IaaS Clouds with Multiple Service Classes
Marcus Carvalho
Computing and Systems DepartmentUniversidade Federal de Campina Grande
Campina Grande, PB, [email protected]
Daniel Menasce
Computer Science DepartmentGeorge Mason University
Fairfax, VA, [email protected]
Francisco Brasileiro
Computing and Systems DepartmentUniversidade Federal de Campina Grande
Campina Grande, PB, [email protected]
Abstract—There is a growing adoption of cloud computingservices, attracting users with different requirements andbudgets to run their applications in cloud infrastructures.In order to match users’ needs, cloud providers can offermultiple service classes with different pricing and Service LevelObjective (SLO) guarantees. Admission control mechanismscan help providers to meet target SLOs by limiting thedemand at peak periods. This paper proposes a prediction-based admission control model for IaaS clouds with multipleservice classes, aiming to maximize request admission rateswhile fulfilling availability SLOs defined for each class. Weevaluate our approach with trace-driven simulations fed withdata from production systems. Our results show that admissioncontrol can reduce SLO violations significantly, specially inunderprovisioned scenarios. Moreover, our predictive heuristicsare less sensitive to different capacity planning and SLOdecisions, as they fulfill availability SLOs for more than 91%of requests even in the worst case scenario, for which only 56%of SLOs are fulfilled by a simpler greedy heuristic and as littleas 0.2% when admission control is not used.
I. INTRODUCTION
Infrastructure-as-a-Service (IaaS) is a cloud computing
model that enables users to access computational resources
when needed, typically bundled as virtual machines (VMs).
Users pay for what they use, instead of acquiring and
maintaining their own hardware. A large variety of users are
migrating to this model, typically having different budgets
and Quality of Service (QoS) requirements for applications.
IaaS providers can offer multiple service classes (referred
just as “classes” herefrom) to match a variety of user
needs, with different pricing and Service Level Objectives
(SLOs) defined for each class. Unfortunately, current cloud
Service Level Agreements (SLAs) are very limited and
usually contain only generic and simple SLOs. For example,
Amazon EC2 [1] and Google Compute Engine [2] SLAs
currently define a service uptime of 99.95% or higher
as the only SLO, with a penalty for the provider (as a
financial credit for affected users) if this SLO is violated.
As the cloud market becomes more competitive, providers
differentiate themselves by offering a wider range of classes,
with combinations of pricing and SLOs that can attract more
users and increase profits.
A challenge for providers is how to make efficient re-
source management decisions and meet SLOs for different
classes. Appropriate capacity planning, admission control
and scheduling of VMs are required for this task; capacity
planning decides on the minimum capacity needed to accom-
modate the future demand, admission control decides on the
minimum set of requests to reject so that SLOs of admitted
requests are met, while scheduling decides in which physical
machines should VMs be allocated [3]. The inherently high
variation of cloud workloads and machine availability (e.g.
due to failures and maintenance) makes these decisions even
more challenging [4]. If resources are not overprovisioned,
there may not be enough capacity available to allocate all
VM requests at some periods; this would cause VMs to wait,
resulting in lower availability and potential SLO violations.
In this paper we focus our attention on admission control
mechanisms. These mechanisms can reduce availability SLO
violations by rejecting incoming requests during peak peri-
ods. It is assumed that the rejection of incoming requests is
less harmful than the violation of SLOs for requests already
admitted – which is reasonable because SLO violations
usually incur in penalties and affect the provider’s reputation.
An additional challenge is posed when multiple classes are
offered, as admission decisions may have different conse-
quences depending on the classes affected.
In this context, an important problem for IaaS providers
is how to make efficient admission control decisions for
multiple classes. In this paper we propose a prediction-
based model to address this problem, aiming to maximize
request admission rates while meeting VM availability SLOs
for each class. We use forecasting methods to predict the
future capacity available for each class by using historical
observations. Based on the predictions, we dynamically
define quotas for each class to limit the amount of resources
that can be requested, such that new requests are rejected if
the quota is exceeded.
The main contributions of this paper are: (1) A formal
definition of part of the cloud resource management prob-
lem. (2) A novel prediction-based admission control model
for IaaS clouds with multiple classes. (3) An evaluation
of the proposed model by instantiating it with different
forecasting methods, and trace-based simulations using data
from production systems. (4) A demonstration that predictive
admission control heuristics are less sensitive to diverse
2015 IEEE 7th International Conference on Cloud Computing Technology and Science
978-1-4673-9560-1/15 $31.00 © 2015 IEEE
DOI 10.1109/CloudCom.2015.16
82

cloud environments, and achieve high SLO fulfillment rates
even in high-contention scenarios in which simple greedy
heuristics presented significantly more SLO violations.
This paper is organized as follows. Section II describes
our system model and formulates the problem. Section
III presents the prediction-based admission control model.
Section IV describes how we instantiate it and defines
the evaluated simulation scenarios. Section V evaluates our
model comparing to other heuristics. Section VI discusses
related work. Finally, Section VII presents our conclusions.
II. PROBLEM STATEMENT
This section describes the system model and formulates
the multiclass admission control problem.
A. System Model
We consider an IaaS cloud provider that owns a set of
physical machines. Each machine has a certain capacity for
each type of resource, such as CPU, memory and disk. The
nominal cloud capacity is the total amount of resources
aggregated over all machines owned by the provider. The
available cloud capacity accounts only for machines that
are available for users, and may vary over time (e.g., due to
machine failures). Different instance types are offered, which
represent a combination of the capacities to be allocated for
each resource type (e.g., 2 CPU-cores, 8GB memory, and
32GB disk), typically bundled as VMs.
Users request VMs and their associated instance types to
the provider. Figure 1 shows the possible states of a VM
request and the transitions between them. New requests are
either admitted or rejected in the admission control phase.
An admitted request moves to the scheduling phase, where
it can be either in the running or in the pending state.
A pending request changes to the running state when its
associated VM is allocated in one of the available machines;
this can only happen if the requested instance type fits
in the machine capacity remaining from other allocations.
A VM whose associated request is in the running state
can be interrupted due to machine failures or preemption
by higher-priority requests, taking the request back to the
pending state. A request moves to the released state when
the required service demand (i.e., execution time) of its
associated VM is satisfied.
Figure 1. VM request state diagram in our IaaS cloud model.
For the sake of simplicity, we only consider CPU capacity
(in number of cores) when allocating VMs to available
machines, as CPU was shown to be the bottleneck resource
in cloud workload analysis [4], [5]. Nevertheless, other
resource types (e.g., memory and disk) could be easily
considered by allocating a VM iff there is enough capacity
for all of its required resource types.The provider offers multiple classes, with different pricing
and expected QoS. Each class has an SLA, which is a
contract that defines SLOs the provider promises to meet,
and penalties the provider pays in case an SLO is violated
(i.e., the promise is not fulfilled). An important QoS metric
in our model is the VM availability, defined as the percentage
of time a VM request was running, since its submission until
its release. We consider that the SLA of each class contains
a VM availability SLO – i.e., the minimum VM availability
accepted for VM requests admitted in a class, such that lower
values result in SLO violations.The assessment of cloud resource management decisions
is made during an observation period, which is divided into
time slots of finite duration called epochs [6]. The beginning
of a new epoch occurs when at least one of these events
happens: (1) the arrival of new VM requests; (2) the release
of running requests; or (3) the change on the available cloud
capacity. Let E1, · · · , Ei, · · · , EN denote the epochs in an
observation period, where N is the number of epochs in that
period. Let b(Ei) and e(Ei) be the begin and end times of
epoch Ei, respectively. Therefore, we define the observation
period as the time interval [b(E1), e(EN )]. Let Δi = e(Ei)−b(Ei) be the duration of epoch Ei, and Δ = e(EN )−b(E1)be the duration of the observation period in time units.
We also use the following notation throughout the paper:
• M : number of machines owned by the provider. Let mdenote the m-th machine (1 ≤ m ≤M, m ∈ N).
• K: number of classes offered by the provider. Let kdenote the k-th class (1 ≤ k ≤ K, k ∈ N).
• Wk = {V1k, · · · , Vjk, · · · , V|Wk|k}: workload stream
for class k during the observation period, where Vjk
denotes the j-th VM request for class k.
• Sjk: resource capacity in CPU-cores requested for the
j-th VM request of class k.
• Djk: service demand in time units (i.e., required exe-
cution time) for the j-th VM request of class k.
• s(Vjk): submission time of the j-th VM request of class
k.
• r(Vjk): release time of the j-th VM request of class k.
• Cm: capacity of machine m in CPU-cores.
• Aim ∈ {0, 1}: availability of machine m at epoch i;indicates whether it is available (1) or unavailable (0).
• xjk ∈ {0, 1}: admission of the j-th VM request of class
k; indicates whether it is admitted (1) or rejected (0).
• yijkm ∈ {0, 1} : allocation of the j-th VM request of
class k in machine m at epoch i; indicates whether it
is allocated in the machine (1) or not (0).
83

• gjk: revenue (economic gain) per time unit obtained by
the provider for running the j-th VM request of class
k.
• pjk: penalty (economic loss) to the provider incurred
in violating SLOs for the j-th VM request of class k.
• αjk: VM availability observed for the j-th request of
class k. Let αmink be the the VM availability SLO for
class k – i.e., the minimum VM availability accepted
for class k.
• θk: SLO fulfillment rate for class k, defined as the
percentage of requests of class k for which the VM
availability SLO was not violated (i.e., αjk ≥ αmink ).
Let θmink be the minimum SLO fulfillment rate accepted
for class k.
B. Problem Formulation
This paper addresses the admission control problem,
which is part of the cloud resource management process.
Figure 2 illustrates how admission control interacts with the
capacity planning and scheduling phases in this process.
Figure 2. Cloud resource management process.
In the capacity planning phase, the provider defines which
nominal cloud capacity is needed to execute an expected
workload; in the admission control, it decides which requests
to reject in order to meet SLOs of admitted ones; and in the
scheduling, it chooses the VMs that will be running at each
epoch, and in which machines they will be allocated.
We define the admission control and scheduling problems
as an optimization model. We assume the capacity planning
is performed separately, giving the set of M machines that
comprise the cloud, where each machine m (1 ≤ m ≤ M )
has a resource capacity Cm and an availability Aim for
each epoch i (1 ≤ i ≤ N ). The objective is to maximize
the provider’s profit, subject to VM availability SLOs for
each class and the available cloud capacity. The decision
variables for the admission control phase are the admission
variables xjk for each j-th VM request of class k; and for
the scheduling phase are the allocation variables yijkm for
each j-th VM request of class k in machine m at epoch i.A decision scenario represents the set of input data used
to assess a cloud resource management solution, given as:
Φ = 〈N,M,K,Wk, Sjk, Djk, Cm, Aim〉Therefore, we formulate the optimization problem as:
Given Φ,
maximize
P =K∑
k=1
|Wk|∑j=1
(M∑
m=1
N∑i=1
xjk · yijkm · gjk ·Δi − pjk
)(1)
s.t.K∑
k=1
|Wk|∑j=1
yijkm · Sjk ≤ Cm ·Aim, ∀i,m (2)
yijkm ≤ xjk, ∀i, j, k,m (3)
θk ≥ θmink , ∀k (4)
The objective function (Equation 1) to be maximized is
the provider’s profit P , calculated as the revenue obtained
by running VMs in each epoch, subtracted by the penalties
for violating VM availability SLOs during the observation
period.
The capacity constraint (Equation 2) states that the capac-
ity allocated for all VMs in a machine must not be higher
than the machine capacity, and that unavailable machines
must not have allocations. The admission constraint (Equa-
tion 3) means that a VM request can be allocated iff it
has been admitted. Finally, the SLA constraint (Equation
4) states that SLO fulfillment rates must not be lower than
the minimum accepted rate defined for each class.
Unfortunately, this optimization problem is an example
of a 0-1 integer linear programming problem and is known
to be NP-complete. Additionally, its solution would re-
quire knowledge of future demands and machine availability
values by the provider, which is unrealistic. Therefore,
we propose predictive heuristics to address the multiclass
admission control problem, and use this optimization model
in our evaluation.
III. PREDICTION-BASED ADMISSION CONTROL
We adopt a quota-based approach in our admission control
model, in which the provider dynamically defines a quota to
limit the amount of resources that can be allocated to a class.
New requests are rejected if the total capacity requested by
VMs in a class exceeds its quota. A similar strategy is used
by Google’s Borg system [7] and by Amazon EC2 cloud [8].
Priorities are assigned to classes with k = 1 being the high-
est priority and k = K the lowest. A provider can explicitly
define priorities or they can be defined proportionally to VM
availability SLOs. Our admission control model assumes a
preemptive priority scheduling policy that allocates VMs of
higher-priority classes first, similarly to Borg [7].
We assign quotas for a class based on the capacity avail-
able for the class and its VM availability SLO. The capacity
available for a class depends not only on the available cloud
capacity, but also on the demand from higher priority classes
– the highest priority class is the only one for which the
available capacity depends solely on the available machines.
84
Thus, the available class capacity for class k at epoch iis defined as
cik =M∑
m=1
Aim · Cm −k−1∑k′=1
|Wk′ |∑j=1
xjk′ · yijk′m · Sjk′ . (5)
Let the VM availability for the j-th VM of class k be
αjk =
∑Ni=1
∑Mm=1 yijkm ·Δi
r(Vjk)− s(Vjk)· 100%. (6)
where r(Vjk) is the release time of the j-th VM request of
class k – if the request is not released before the observation
period finishes, we assume r(Vjk) to be the observation
period end time e(EN ).According to Little’s law [3], we can define the mean
number of VM requests in a system as
L = R · λ =S
α· cS
=c
α(7)
where R is the mean VM sojourn time, λ the mean
throughput in finished VMs per unit time, S the mean
service demand, α the mean VM availability, and c the
mean available class capacity. Equation (7) tells us that a
higher number L of admitted requests implies in lower VM
availability. Thus, we consider L to be a good estimator
of the maximum number of requests that can be admitted
aiming at a VM availability α, given an estimated available
class capacity c.Therefore, we define the quota lik at epoch i for class k
aiming at achieving a VM availability αk as
lik =F(b(Ei), k, h)
αk(8)
where F(.) is a prediction function applied at the begin-
ning of epoch Ei to estimate the minimum available class
capacity for class k in the following h time units.
The available class capacity can be overestimated due to
its variation over time, which may cause SLO violations.
To deal with this, we calculate confidence intervals for
predictions, and make conservative estimates by using the
lower-bounds of prediction intervals as the predicted values.
Let f(�ctk, h) denote a forecasting method that uses as
input the data vector �ctk of available capacities for class kobserved until time t to make a prediction for h time units
ahead. Thus, we calculate the lower bound for the one-sided
prediction interval with unknown variance [9] as
F(t, k, h) = f(�ctk, h)− zγ · σ ·√1 +
1
n(9)
where zγ is the γ-percentile of the Student t-distribution
with n − 1 degrees of freedom; γ is the confidence level;
σ is the standard deviation and n the size of the historical
data sample.
By applying this prediction-based model, a cloud provider
can define quotas for each class over time. Any forecasting
method (or a combination of methods [10]) can be used. In
the next section, we instantiate the model with two different
forecasting techniques to evaluate its efficacy.
IV. EVALUATION METHODOLOGY
This section describes the specifics of the admission
control heuristics, the metrics used to evaluate them, and
the scenarios used in the trace-based simulations.
A. Admission Control Heuristics
We instantiate our model with two predictive heuristics
and a greedy one. We also compare them with a heuristic
oblivious to admission control. The heuristics evaluated are:
• pred-cmean: predictive heuristic that uses our model
to assign a quota to each class using the Conservative
Mean forecasting method.
• pred-ets: predictive heuristic that uses our model to
assign a quota to each class using the Exponential
Smoothing (ETS) forecasting method.
• greedy-quota: greedy heuristic that uses our model to
assign a quota to each class based only on the current
available capacity for a class – i.e., the estimated avail-
able class capacity is equal to the last value observed.
• no-adm-control: simple heuristic that does not use ad-
mission control, admitting all requests for every class.
The forecasting methods used by pred-cmean and pred-etsheuristics are described as follows:
• Conservative Mean: we compute simple arithmetic
means for three different input data samples: the lasthour mean uses data from the previous hour to capture
short-term changes; the last day mean uses data from
the previous 24 hours to capture mid-term changes; and
the seasonal daily mean uses historical values from the
same clock-time as the time being predicted (e.g., every
9am), but for previous days to capture daily patterns.
The minimum value of the three means is used as a
conservative prediction; this way, it quickly reacts to
sudden observed capacity decays, but slowly increases
predictions for capacity growth spikes.
• Exponential Smoothing (ETS): a forecasting method
that combines models based on the weighted aver-
ages of input values, with the weights exponentially
decaying for older values. The ETS model has three
components: Error correction (E), Trend (T), and Sea-
sonal (S). Each component can be of a certain type:
None, Additive, Multiplicative, and other variations.
The different combinations of component types result
in different ETS methods, where each method has
a set of parameters to be estimated [11]. We used
Akaike’s Information Criterion (AIC) [12] to pick a
good ETS model: it estimates the probability of the
data arising from each model by using a maximum
likelihood estimator, and penalizes models with a large
number of parameters [13]. Similarly to our previous
85
work [5], we used the ETS implementation from the R
forecasting package [14].
We used a confidence level of γ = 95% to calculate
prediction confidence intervals – this can be adjusted by
providers for more/less conservative predictions [5]. The
historical data used as input for predictions accumulates
over time, so the sample size n grows over the simulation.
This presented no problem for the observation periods we
evaluate (29 days); but, for longer periods it would be
preferable to adopt a sliding window approach to avoid
performance problems.
At the beginning of an observation period, the sample size
for the first predictions will be very small, which affects the
predictive strategies. To overcome this problem, we adopted
a conservative approach during the first simulated hour by
defining the quota for a class equal to the available class
capacity at the moment – it means that no VM request will
be pending at the time of admission, although they can be
interrupted later on due to machine failures or preemption.
B. Simulation Scenarios
The evaluation was performed through trace-based simu-
lations. We used workloads from Google’s cluster data pub-
licly available [15]. The traces were collected during 29 days
in May 2011 from a cluster with over 12k physical machines
and over 25M task submissions recorded. (Analysis of these
traces can be found in [4] and [16].)
The resource capacity data in the trace is normalized by
the size of the largest machine in the cluster, which was
not published; although we do not have absolute resource
capacity values, we are still able to calculate relative values
of requested capacity over the machines’ capacities, as they
are normalized by the same constant factor. This relative
resource capacity information is enough for our simulations.
We consider each task submitted in the traces as a VM
request. This is how we map traces’ attributes to simulations:
• VM request submission time (s(Vjk)): submission time
of each task.
• VM class (k): priority range associated to each task.
Based on the trace description [15], we assign three
priority groups: “prod” to tasks with high priorities
(9 ≤ priority ≤ 11); “batch” to tasks with middle
priorities (2 ≤ priority ≤ 8); and “free” to tasks with
low priorities (0 ≤ priority ≤ 1).
• VM requested capacity (Sjk): requested CPU capacity
for each task. For tasks that update this value over
time, we consider the maximum observed during the
task lifetime.
• VM service demand (Djk): total time each task was in
the “running” state in time units.
• Machine capacity (Cm): CPU capacity of each physical
machine in CPU-cores.
• Machine availability (Aim): actual time periods that
each physical machine was available.
Because task and machine availability events occur very
frequently in the traces, we aggregate events in fixed 5-
minute intervals. This was done to reduce simulation time
and make it feasible to evaluate the complete trace in many
different scenarios. Thus, admission control and scheduling
decisions are made at this time granularity, which makes
every epoch Ei to have the same size (Δi = 5 minutes,
∀i). If a machine became unavailable at any time within an
epoch, we consider this machine was unavailable during the
whole epoch period. VM request submission events within
an epoch are anticipated to the beginning of the same epoch,
and VM request release events are delayed to the beginning
of the following epoch.
At each new epoch, the admission control mechanism can
adjust the quotas defined for classes and reject incoming
requests if a quota is exceeded. As we focus on admission
control, VM placement is not simulated (i.e., VMs are not
assigned to particular machines). The scheduler allocates
requests based on their priorities, such that the total capacity
allocated for VMs is not greater than the available cloud
capacity. We use a preemptive priority scheduling policy
(described in Section III). VM requests within the same
priority are allocated in a First-Come-First-Served basis. We
also use an aggressive backfilling approach [17], on which
requests are skipped in the scheduling queue if they do
not fit in the current available capacity; although skipped
requests will become unavailable, they are reconsidered by
the scheduler every next epoch, being able to preempt lower-
priority requests.
We use simple linear functions to calculate the revenue
and penalty, which are proportional to the VM requested
capacity and availability SLO. The revenue per unit time
obtained for running the j-th VM request of class k is
defined as
gjk = Sjk · αmink . (10)
We consider the penalty paid by the provider is also pro-
portional to the total time the VM was running or pending.
Therefore, we define the penalty incurred in violating the
VM availability SLO for the j-th VM request of class k as
pjk =
{0, if αjk ≥ αmin
k
Sjk · αmink · (r(Vjk)− s(Vjk)) , otherwise.
(11)
The admission control heuristics are assessed for different
metrics, which are defined as follows:
• Admission rate – percentage of class-k requests admit-
ted: ∑|Wk|j=1 xjk
|Wk| · 100%. (12)
• SLO fulfillment – percentage of class-k admitted VM
requests for which the observed VM availability was at
least equal to the VM availability SLO defined for that
86
class:
θk =|{Vjk ∈Wk : αjk ≥ αmin
k ∧ xjk = 1}||{Vjk ∈Wk : xjk = 1}| · 100%
(13)
• Mean cloud utilization – percentage of the available
cloud capacity that is allocated for VMs, averaged for
each epoch:
N∑i=1
(∑Kk=1
∑|Wk|j=1
∑Mm=1 yijkm∑M
m=1 Cm ·Aim
· Δi
Δ
)·100%. (14)
• Profit efficiency – profit obtained for heuristic h nor-
malized by the highest profit of all heuristics in the
same scenario:
Ph
max (P1, · · · ,PH)· 100% (15)
where H is the number of heuristics evaluated and Ph
is the profit achieved by heuristic h. The best heuristic
in a scenario will have profit efficiency equal to 100%.
Different cloud scenarios are evaluated by changing the
following simulation parameters:
• Capacity size factor: a multiplicative factor applied to
the capacity of each machine extracted from the original
trace – e.g., a capacity size factor of 1.1 means that
each machine has 10% more capacity than the original
values in the traces.
• SLO strength: represent the quality level of VM avail-
ability SLOs offered in the scenario, as the combination
of SLO values defined for each class – e.g., a medium-
quality strength having (100%, 90%, 50%) SLOs de-
fined for prod, batch and free classes, respectively.
V. RESULTS
This section presents the evaluation results; first for a base
scenario and then for sensitivity analysis that explores dif-
ferent capacity planning and VM availability SLO scenarios.
A. Base Scenario
The base scenario uses the demand and capacity data
extracted from the traces without any modification (i.e.,
capacity size factor = 1) and the following base VM avail-
ability SLOs: prod = 100%, batch = 90%, free = 50%.
Figure 3 shows the SLO fulfillment (top) and admission
rate (bottom) of VM requests for each class for different
admission control heuristics in the base scenario. The SLO
fulfillments for the prod class was 100% under all heuristics,
because there was enough capacity to allocate all requests
even with no admission control. For the batch class, the
predictive heuristics had the highest SLO fulfillments, while
greedy-quota and no-adm-ctrl had slightly lower values.
The difference was more significant for the free class; the
predictive heuristics had more than twice the fulfillments of
greedy-quota while no-adm-ctrl had almost no fulfillments.
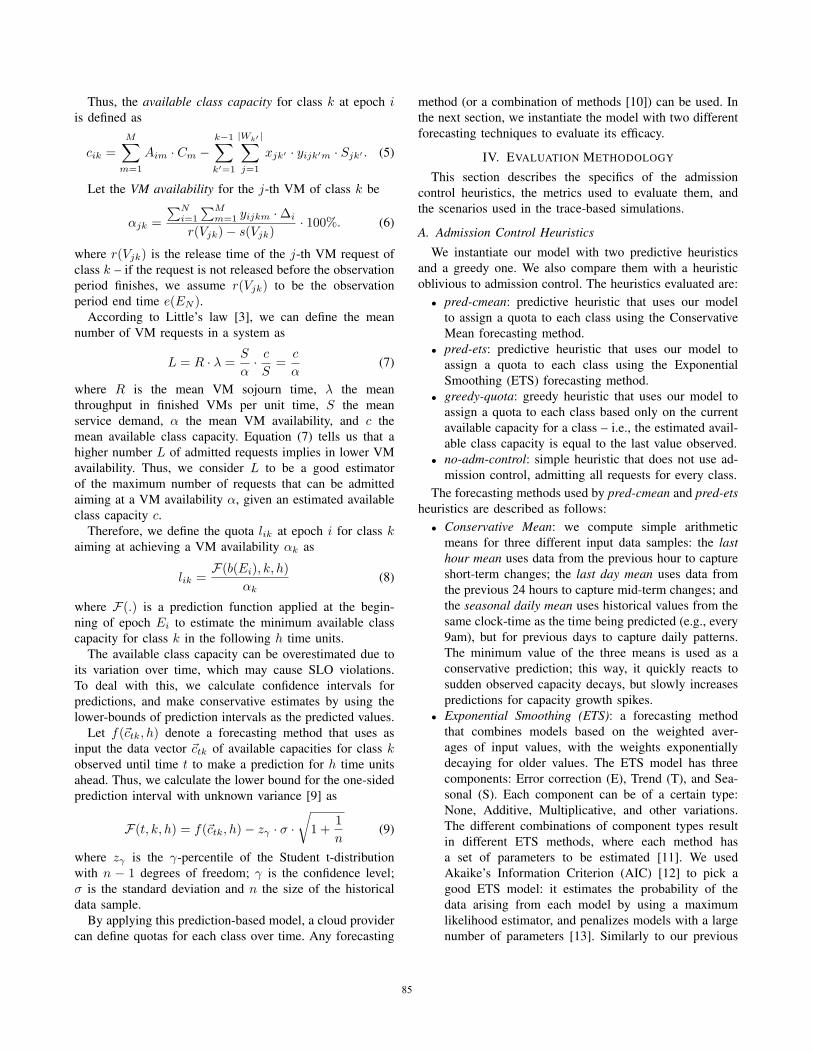
Figure 3. Percentage of requests with VM availability SLOs fulfilled (topgraphs) and admitted (bottom graphs) per class in the base scenario.
Admission rates for no-adm-ctrl is always 100% as it is
oblivious to admission control. For prod class, all heuristics
admitted all requests because no rejection was needed to
fulfill all SLOs. For batch, greedy-quota had slightly more
admissions than predictive heuristics. For the free class,
greedy-quota had more than twice the admissions of pred-etsand more than five times the admissions of pred-cmean.
The lower admission rates of prediction-based methods
are required to achieve higher SLO fulfillments, our most
important metric. Predictive heuristics had higher SLO ful-
fillments than greedy-quota because the greedy approach
relies only on the current available class capacity, which can
decrease in the future and cause SLO violations. The fore-
casting methods not only give better predictions on future
available class capacities, but also handle high variations by
calculating lower bounds for prediction intervals to reduce
violations. Although both predictive approaches had similar
SLO fulfillments, pred-ets had higher admission rates than
pred-cmean because the latter is typically more conservative,
as it uses the minimum value of arithmetic mean calculations
for three different samples.
The results highlight the importance of admission control
to meet VM availability SLOs, showing that SLO fulfill-
ments can be very low when admission control is not used.
The base scenario exhibits low resource contention for prodand batch classes, which presents high SLO fulfillments
and high admission rates. On the other hand, the free class
requires lower admission rates in order to achieve high SLO
fulfillments. More contention scenarios are explored in the
next section.
B. Capacity Planning Sensitivity Analysis
We now analyze the sensitivity of the heuristics to dif-
ferent capacity planning decisions by using these different
capacity size factor values: 0.7, 0.8, 0.9, 1.0, 1.1, 1.2, 1.3.
87
The base SLO strength values were used.
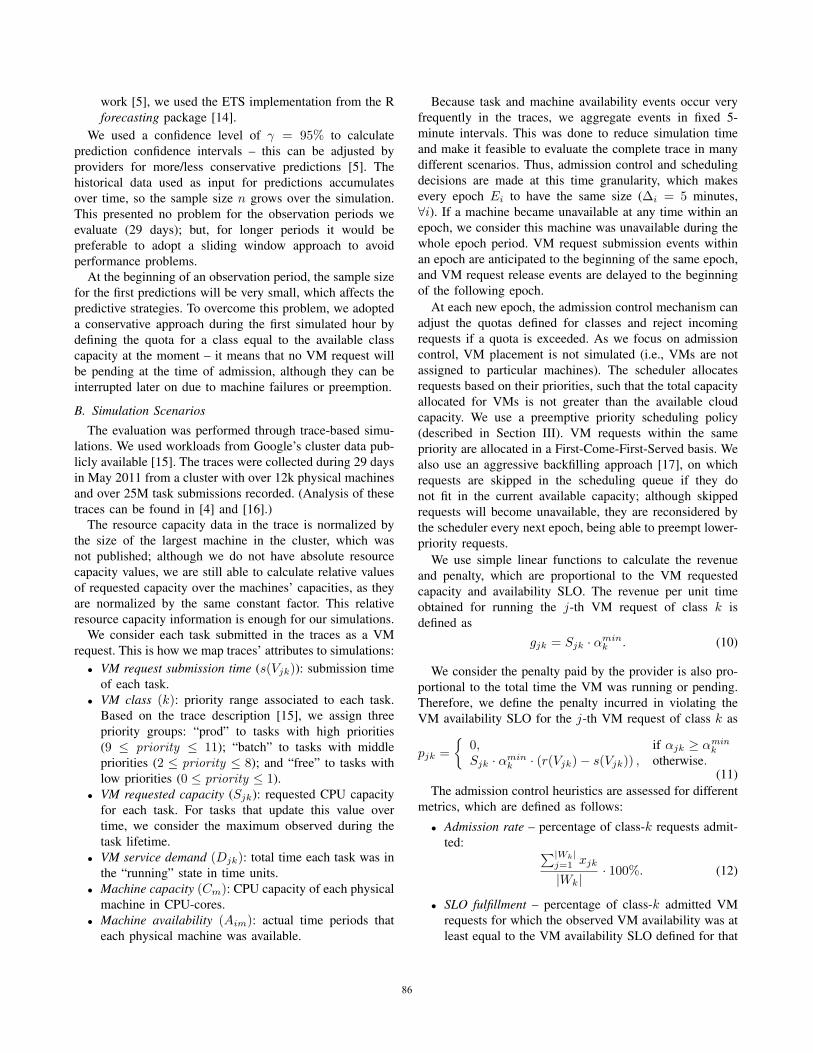
Figure 4 shows the SLO fulfillment (left) and the ad-
mission rate (right) aggregated for all service classes as a
function of the capacity size factor. The SLO fulfillment
is lower for smaller capacities for no-adm-ctrl and greedy-quota, which exhibit 0.2% and 56% SLO fulfillments in the
worst case, respectively. On the other hand, the predictive
heuristics are not significantly affected by capacity size
variations, having in the worst case 91% of SLOs fulfilled.
Figure 4. Percentage of requests with VM availability SLOs fulfilled (left),and admitted (right) when varying the cloud capacity size factor.
Again, the admission rate for no-adm-ctrl is always 100%,
while for the other heuristics it tends to decrease as the
capacity shrinks. Note that for quota-based heuristics the
admission rate is lower for capacity factor 0.8 than for
0.7. This happened because in the former scenario, all
prod requests are admitted while in the latter, ≈ 25% of
prod requests are rejected to meet SLOs. Since prod VMs
require more capacity and have higher service demands than
other classes on average, the rejection of a few prod VM
requests generates enough spare capacity to allocate many
low-demanding VMs from batch and free classes, which
increases overall admission rates.
Although the greedy heuristic had higher admission rates
than predictive ones, it had lower SLO fulfillment and higher
sensitivity (variation) to different capacity planning scenar-
ios. As explained, predictive heuristics can better estimate
future available class capacity and handle high variations.
SLO fulfillments for both predictive methods were very
similar, although pred-ets had higher admission rates than
pred-cmean, as the latter tends to be more conservative.
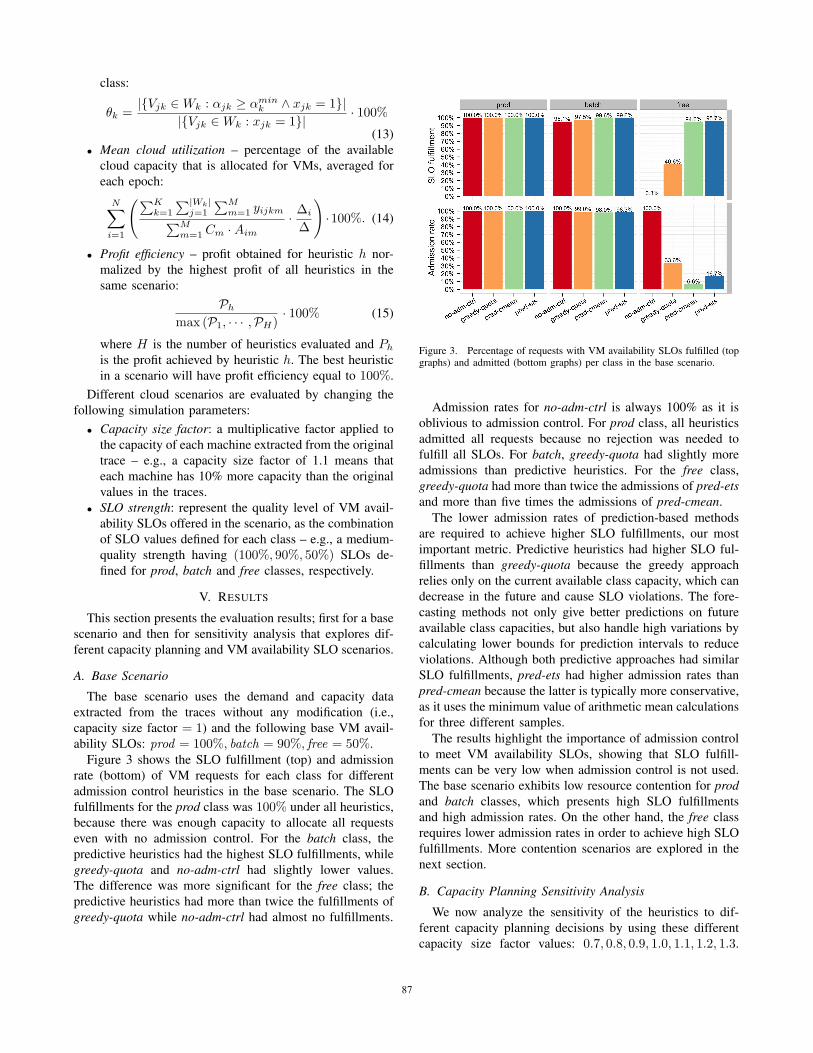
Figure 5a shows the mean cloud utilization for different
capacity size factors. As expected, the cloud utilization
decreases when the cloud capacity is increased. Predictive
heuristics had lower utilizations in most scenarios due to
the lower admission rates needed to achieve high SLO
fulfillments. Note that the utilization, admission rates and
SLO fulfillments were the same for all heuristics at a
capacity size factor of 1.3, which is an overprovisioned
scenario with low cloud utilization.
(a)
(b)
Figure 5. Results for (a) mean cloud utilization and (b) profit efficiencywhen varying the cloud capacity size factor.
Figure 5b shows the profit efficiency for different capacity
size factors. For capacity factors lower than 1.1 the profits
for no-adm-ctrl (only shown partially in the graph) are nega-
tive. All heuristics had similarly high profits when resources
are overprovisioned (capacity factors 1.2 and 1.3). Predictive
heuristics had the best profits overall, very similar to each
other with a difference not higher than 1.3%. The greedy-quota also had high profits and a maximum difference with
predictive heuristics of 5.5%.
Note that the profit mostly comes from prod-class VMs
because they usually request more capacity, have higher
service demands and generate more revenue. Because in
most scenarios evaluated the cloud capacity is enough to
allocate all prod VMs, all heuristics obtained high revenues
from this class. Thus, we believe the difference in the profits
of the various heuristics would be larger for scenarios where
the prod class also experienced high resource contention.
C. Availability SLOs Sensitivity Analysis
We now examine the sensitivity of the heuristics to
different VM availability SLOs. We vary SLO strengths
by keeping the prod-class SLO at 100% and using the
following SLO combinations for batch and free classes:
very-low (50%, 10%), low (70%, 30%), middle (90%, 50%),high (99%, 70%), and very-high (99.9%, 90%).
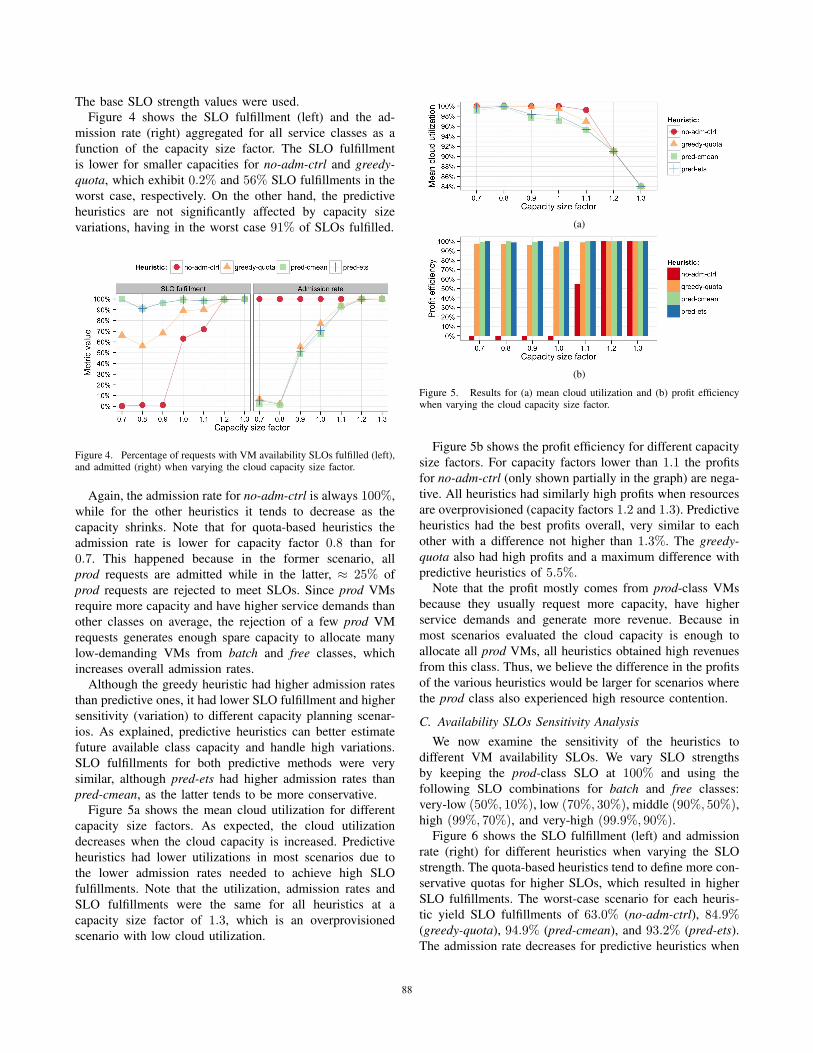
Figure 6 shows the SLO fulfillment (left) and admission
rate (right) for different heuristics when varying the SLO
strength. The quota-based heuristics tend to define more con-
servative quotas for higher SLOs, which resulted in higher
SLO fulfillments. The worst-case scenario for each heuris-
tic yield SLO fulfillments of 63.0% (no-adm-ctrl), 84.9%(greedy-quota), 94.9% (pred-cmean), and 93.2% (pred-ets).
The admission rate decreases for predictive heuristics when
88

SLOs are stronger, because more rejections are required to
fulfill them.
Figure 6. Percentage of requests with VM availability SLOs fulfilled (left),and admitted (right) when varying the SLO strength.
Figure 7 shows the mean cloud utilization when varying
the SLO strength. The utilization decreases when the SLO
strength increases for quota-based heuristics, caused by
lower admission rates. Profit efficiency graphs are omitted on
this analysis due to space limitation; nevertheless, predictive
heuristics also had the best profits for all SLO strength
scenarios.
Figure 7. Mean cloud utilization when varying the SLO strength.
The predictive heuristics were not significantly affected
when defining different VM availability SLOs for each class.
Additionally, setting strict SLOs for all classes results in
lower utilization, which suggests that instead of offering all
classes with high SLO targets, it is preferable to have a wider
range of SLOs to utilize the cloud capacity more efficiently.
VI. RELATED WORK
Resource management in cloud environments has been
extensively studied [18]. Most of previous work has covered
problems from the cloud user’s point of view [19]–[21].
This paper addresses the admission control problem from
the perspective of an IaaS cloud provider.
From the provider’s side, strategies have been proposed
for the allocation and migration of VMs, aiming to im-
prove cloud utilization and reduce SLO violations [22]–
[24]. Although we have similar goals, we tackle a different
problem in this paper. Thus, our admission control approach
complements VM allocation and migration methods and
could be combined to develop a complete cloud resource
management solution.
In our previous work, we reclaim unused cloud capacity
to offer a new Economy class with long-term availability
SLOs, by predicting the minimum capacity to be available
for this class in 6-month periods [5]. We extend this work
by proposing an admission control model that handles short-
term demand variation, in order to maximize admission rates
while meeting VM availability SLOs for multiple classes.
Marshall et al. consider opportunistic leases (with no
SLOs) to be combined with high-quality VM allocations to
improve cloud utilization [25]. Similar best-effort services
offered by public clouds are Amazon EC2 spot instances [1]
and Google Cloud preemptible instances [26]. Our work not
only combines multiple classes to achieve higher utilization,
but also defines VM availability SLOs for each class and
shows how to achieve high SLO fulfillments for them.
Unuvar et al. propose a stochastic admission control
model with overbooking of cloud resources [27]. They fit
observed VM usage data to a Beta distribution, and reject
requests based on the probability of exceeding an utilization
threshold. Cherkasova and Phaal propose a predictive ad-
mission control for e-commerce applications that adjusts an
admission threshold based on average observed load [28].
Similarly, our prediction-based model defines admission
quotas based on the estimated probability of violating SLOs.
However, we use more sophisticated forecasting techniques
that can capture seasonal patterns and short-term demand
spikes observed in cloud workloads. Moreover, differently
from these studies, our model considers multiple classes
and SLOs. Although overbooking was not investigated in
our evaluation, this could be easily considered in our quota-
based model by predicting resource usage instead of allo-
cated VM capacity.
VII. CONCLUSION
IaaS cloud providers can offer a wide range of service
classes to increase their profits, by attracting users with
different QoS requirements and budgets. Therefore, an im-
portant problem for providers is how to maximize their
profits while meeting SLOs defined for the different classes.
This paper proposed a prediction-based admission control
model that addresses this problem. We dynamically define
quotas to limit the admission of VM requests for different
classes, by forecasting the expected capacity to be available
for each class.
Our results show that admission control mechanisms are
necessary to fulfill availability SLOs when the cloud capac-
ity is not overprovisioned. Our prediction-based approach
was not significantly affected by different capacity planning
and SLO decisions, exhibiting consistently high SLO ful-
fillments and the highest profits for the different scenarios
analyzed when compared to other heuristics. Moreover, the
results suggest that it is important to offer a wide range of
89
SLOs in order to achieve high utilization, which could also
attract more users.
ACKNOWLEDGMENT
The experiments were run on ARGO, a research comput-
ing cluster provided by the Office of Research Computing
at George Mason University (http://orc.gmu.edu). Marcus
Carvalho thanks Mason’s Computer Science department and
its C4I center for hosting him as a visiting scholar, and
the support from CNPq/Brazil. Francisco Brasileiro is a
CNPq/Brazil researcher (grant 311297/2014-5).
REFERENCES
[1] “Amazon EC2 - Instance Purchasing Options,” ”https://aws.amazon.com/ec2/purchasing-options”, Jun. 2015.
[2] “Google Compute Engine - Service Level Agreement (SLA),””https://cloud.google.com/compute/sla”, Jun. 2015.
[3] D. A. Menasce, L. Dowdy, and V. A. Almeida, Performanceby Design: Computer Capacity Planning By Example. Pren-tice Hall PTR, 2004.
[4] C. Reiss, A. Tumanov, G. R. Ganger, R. H. Katz, and M. A.Kozuch, “Heterogeneity and dynamicity of clouds at scale:Google trace analysis,” in ACM Symp. Cloud Computing,2012.
[5] M. Carvalho, W. Cirne, F. Brasileiro, and J. Wilkes, “Long-term SLOs for reclaimed cloud computing resources,” in ACMSymp. Cloud Computing, 2014.
[6] D. Menasce and S. Bardhan, “Epochs: Trace-driven analyticalmodeling of job execution times,” George Mason University,Tech. Rep., 2014.
[7] A. Verma, L. Pedrosa, M. R. Korupolu, D. Oppenheimer,E. Tune, and J. Wilkes, “Large-scale cluster management atGoogle with Borg,” in European Conf. Computer Systems,2015.
[8] “Amazon EC2 FAQs,” ”http://aws.amazon.com/ec2/faqs”,Jun. 2015.
[9] R. E. Walpole, R. H. Myers, S. L. Myers, and K. Ye,Probability & statistics for engineers and scientists, 9th ed.Pearson Education, 2012.
[10] F. J. A. Morais, F. V. Brasileiro, R. V. Lopes, R. A. Santos,W. Satterfield, and L. Rosa, “Autoflex: Service agnosticauto-scaling framework for IaaS deployment models,” inIEEE/ACM Int. Symp. Cluster, Cloud and Grid Computing,2013.
[11] R. J. Hyndman and G. Athanasopoulos, “7. exponentialsmoothing,” in Forecast: principles and practice. OTexts,2013.
[12] K. P. Burnham and D. R. Anderson, Model selection and mul-timodel inference: a practical information-theoretic approach.Springer, 2002.
[13] C. Chatfield, “5. forecasting,” in The analysis of time series:an introduction, 6th ed. CRC Press, 2004.
[14] R. J. Hyndman and Y. Khandakar, “Automatic time seriesforecasting: the forecast package for R,” J. Statistical Soft-ware, Jul. 2008.
[15] C. Reiss, J. Wilkes, and J. L. Hellerstein, “Google cluster-usage traces: format + schema,” Google Inc., Technical Re-port, Nov. 2011, posted at URL http://code.google.com/p/googleclusterdata/wiki/TraceVersion2.
[16] O. A. Abdul-Rahman and K. Aida, “Towards understandingthe usage behavior of Google cloud users: the mice andelephants phenomenon,” in IEEE Int. Conf. Cloud ComputingTechnology and Science, 2014.
[17] D. Feitelson and A. Weil, “Utilization and predictability inscheduling the ibm sp2 with backfilling,” in Merged Int.Parallel Processing Symp. and Symp. Parallel and DistributedProcessing, 1998.
[18] B. Jennings and R. Stadler, “Resource management in clouds:Survey and research challenges,” J. Network and SystemsManagement, 2015.
[19] P. D. Maciel, F. Brasileiro, R. A. Santos, D. Candeia,R. Lopes, M. Carvalho, R. Miceli, N. Andrade, and M. Mow-bray, “Business-driven short-term management of a hybrid itinfrastructure,” J. Parallel and Distributed Computing, 2012.
[20] Z. Shen, S. Subbiah, X. Gu, and J. Wilkes, “CloudScale:elastic resource scaling for multi-tenant cloud systems,” inACM Symp. Cloud Computing, 2011.
[21] Z. Gong, X. Gu, and J. Wilkes, “PRESS: PRedictive ElasticReSource Scaling for cloud systems,” in Int. Conf. Networkand Service Management, 2010.
[22] D. Gmach, J. Rolia, L. Cherkasova, and A. Kemper, “Capacitymanagement and demand prediction for next generation datacenters,” in IEEE Int. Conf. Web Services, 2007.
[23] M. Kesavan, I. Ahmad, O. Krieger, R. Soundararajan,A. Gavrilovska, and K. Schwan, “Practical compute capacitymanagement for virtualized datacenters,” IEEE Tr. CloudComputing, 2013.
[24] E. Casalicchio, D. A. Menasce, and A. Aldhalaan, “Auto-nomic resource provisioning in cloud systems with availabil-ity goals,” in ACM Cloud and Autonomic Computing Conf.,2013.
[25] P. Marshall, K. Keahey, and T. Freeman, “Improving uti-lization of infrastructure clouds,” in IEEE/ACM Int. Symp.Cluster, Cloud and Grid Computing, 2011.
[26] “Google Compute Engine - Preemptible Instances,” ”https://cloud.google.com/compute/docs/instances/preemptible”, Jun.2015.
[27] M. Unuvar, Y. Doganata, A. Tantawi, and M. Steinder, “Cloudoverbooking through stochastic admission controller,” in Int.Conf. Network and Service Management, 2014.
[28] L. Cherkasova and P. Phaal, “Session-based admission con-trol: a mechanism for peak load management of commercialweb sites,” IEEE Tr. Computers, 2002.
90


