
Presentation to Analyst
Unaudited Consolidated Result for the
1Q FY2018Ended 31st March 2018
25th May 2018

2
EBITDA
RM1.71bn
REVENUE
RM12.27bn
EBITDA
RM4.22bn
PAT
RM2.12bn
FINANCIAL DETAILSKEY HIGHLIGHTS
Encouraging Outlook for 2018
NORMALIZED PAT

3.79
3.49
4.30
3.89 3.86
4.22
1QFY'17
2QFY'17
3QFY'17
4QFY'17
PENov'17
1QFY'18
EBITDA (RM bn)
34.2% 31.2% 33.7% 31.2% 34.4%
11.24 11.16
12.55 12.46 11.61
12.27
1Q FY'17
2QFY'17
3QFY'17
4QFY'17
PE Nov'17
1QFY'18
Revenue (RM bn)
33.3%
FINANCIAL DETAILSKEY HIGHLIGHTS
Encouraging Outlook for 2018
*
*Period Sept-Nov 2017
*
3

Normalized PAT (RM bn)
1.69
1.22
1.51
1.65
1.47
1.71
1QFY'17
2QFY'17
3QFY'17
4QFY'17
PENov'17
1QFY'18
1.79
1.44
1.95
1.75
2.16 2.12
1QFY'17
2QFY'17
3QFY'17
4QFY'17
PENov'17
1QFY'18
PAT (RM bn)
FINANCIAL DETAILSKEY HIGHLIGHTS
Encouraging Outlook for 2018
* *
4
*Period Sept-Nov 2017

Major Generation Projects
1,440MWCOD:
1st July 2020
28%
Southern Power
Generation (SPG)
2,000MWCOD:
U1: 15th Jun 2019
U2: 15th Dec 2019
87%
Jimah East Power
50MW
COD:
1st Nov 2018
75%TNB Sepang Solar
171 136 148 104 2 2
308 393 585
858
375 401
547 584
776
1,136
499 591
101 209
188
378
203 295
939
1,420 1,035
2,046
1,539 993
1QFY '17 2QFY '17 3QFY '17 4QFY '17 Per iod Ended Nov '17
1QFY '18
4,522.12,732.02,742.32,066.1 2,282.42,617.1
Major Generation Projects
Others
Recurring Distribution
Recurring Transmission
Recurring Generation
FINANCIAL DETAILSKEY HIGHLIGHTS
Substantial Investment in Project Capex
Major
Generation
Projects
43.5%
Recurring
Capex
56.5%
5

Distribution
SAIDI
11.7 mins0.04 mins
Transmission
System Minutes
92.9%
Equivalent
Plant Availability
Factor (EAF)
Technical Indicators
FINANCIAL DETAILSKEY HIGHLIGHTS
6
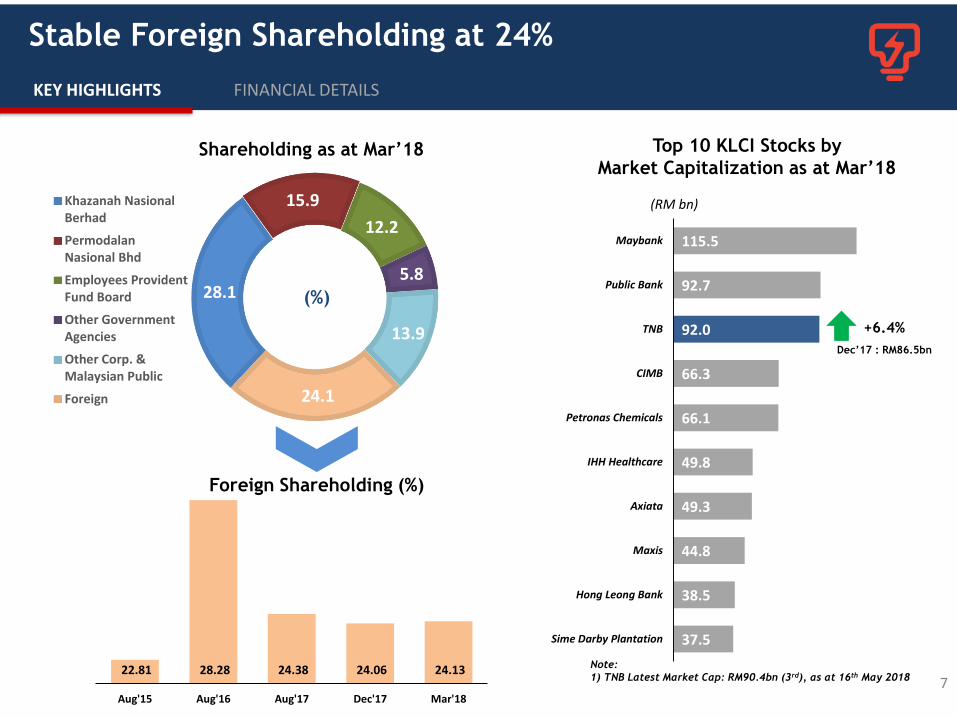
28.1
15.9
12.2
5.8
13.9
24.1
Khazanah NasionalBerhad
PermodalanNasional Bhd
Employees ProvidentFund Board
Other GovernmentAgencies
Other Corp. &Malaysian Public
Foreign
(%)
Shareholding as at Mar’18
22.81 28.28 24.38 24.06 24.13
Aug'15 Aug'16 Aug'17 Dec'17 Mar'18
Foreign Shareholding (%)
Top 10 KLCI Stocks by
Market Capitalization as at Mar’18
37.5
38.5
44.8
49.3
49.8
66.1
66.3
92.0
92.7
115.5
Sime Darby Plantation
Hong Leong Bank
Maxis
Axiata
IHH Healthcare
Petronas Chemicals
CIMB
TNB
Public Bank
Maybank
Dec’17 : RM86.5bn
+6.4%
(RM bn)
Note:
1) TNB Latest Market Cap: RM90.4bn (3rd), as at 16th May 2018
Stable Foreign Shareholding at 24%
FINANCIAL DETAILSKEY HIGHLIGHTS
7

Revenue (RMbn) 1QFY’18
Sen/KWh
TNB * 10,712.5 39.6
EGAT (Export) 1.3 25.0
SESB 543.5 43.0
TENAGA WIND VENTURES 10.3 122.6
LPL 13.8 -
Sales of Electricity (RM) 11,281.4 39.8
LPL Operating Lease (MFRS117) 6.6
Unbilled Revenue 144.2
Imbalance Cost Pass-Through 634.1
Goods & Services 125.3
Deferred Income 82.4
Total Revenue 12,274.0
* Without ICPT
Revenue Includes Under-Recovery of RM0.6bn
FINANCIAL DETAILSKEY HIGHLIGHTS
Units Sold (GWh) 1QFY’18
TNB 27,069.5
EGAT (Export) 5.2
SESB 1,264.0
TENAGA WIND VENTURES 8.4
LPL -
Total Units Sold (GWh) 28,347.1
Zero production due to unavailability of gas from 16 Dec’17 to 31 Mar’18.
1
1
8

9
Average demand growth for FY2016 & FY2017. This is to
eliminate the one-off El-Nino phenomenon during 3QFY’16
1
PeriodGDP
(%)
DemandGrowth
(%)
JAN’17-MAR’17 5.6 (0.8)
JAN’18-MAR’18 5.4 2.3
Y-o-Y Growth Registered At 2.3%
FINANCIAL DETAILSKEY HIGHLIGHTS
%
3.1
4.33.8
2.52.2
2.5 2.5
5.3 5.5
4.7
6.0
5.0
4.2
5.9
0
1
2
3
4
5
6
7
8
F Y ' 1 1 F Y ' 1 2 F Y ' 1 3 F Y ' 1 4 F Y ' 1 5 F Y ' 1 6 F Y ' 1 7
Demand Growth GDP
1
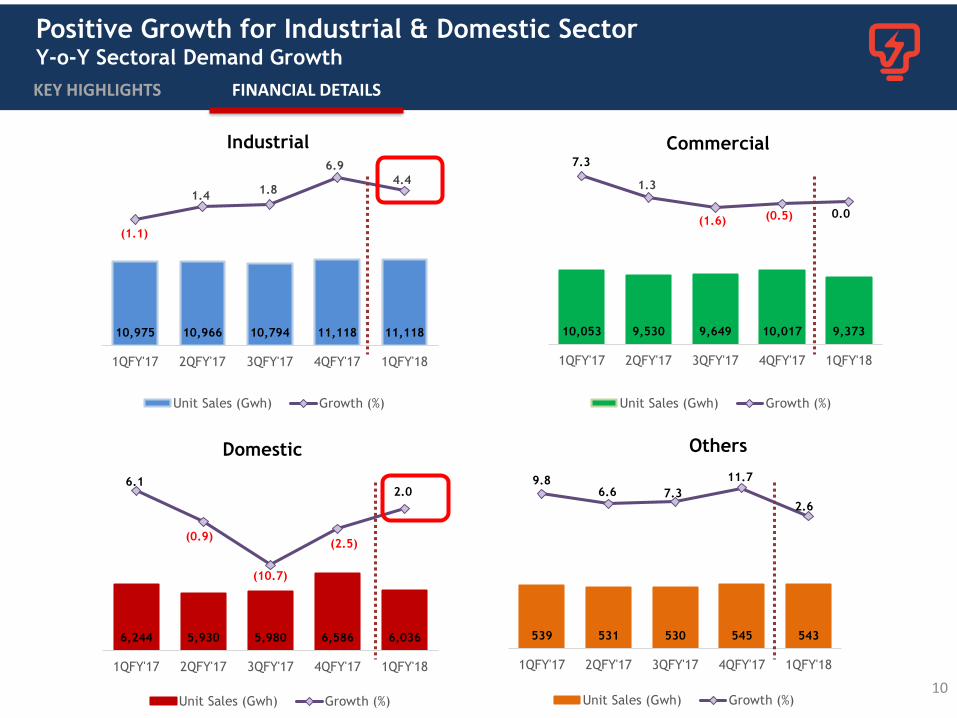
10,975 10,966 10,794 11,118 11,118
(1.1)
1.4 1.8
6.9
4.4
(25.0)(24.0)(23.0)(22.0)(21.0)(20.0)(19.0)(18.0)(17.0)(16.0)(15.0)(14.0)(13.0)(12.0)(11.0)(10.0)(9.0)(8.0)(7.0)(6.0)(5.0)(4.0)(3.0)(2.0)(1.0)0.01.02.03.04.05.06.07.08.09.0
3,000
5,000
7,000
9,000
11,000
13,000
15,000
17,000
19,000
1QFY'17 2QFY'17 3QFY'17 4QFY'17 1QFY'18
Unit Sales (Gwh) Growth (%)
Industrial
10,053 9,530 9,649 10,017 9,373
7.3
1.3
(1.6) (0.5) 0.0
(40.0)(39.0)(38.0)(37.0)(36.0)(35.0)(34.0)(33.0)(32.0)(31.0)(30.0)(29.0)(28.0)(27.0)(26.0)(25.0)(24.0)(23.0)(22.0)(21.0)(20.0)(19.0)(18.0)(17.0)(16.0)(15.0)(14.0)(13.0)(12.0)(11.0)(10.0)(9.0)(8.0)(7.0)(6.0)(5.0)(4.0)(3.0)(2.0)(1.0)0.01.02.03.04.05.06.07.08.09.010.0
3,000
5,000
7,000
9,000
11,000
13,000
15,000
17,000
19,000
1QFY'17 2QFY'17 3QFY'17 4QFY'17 1QFY'18
Unit Sales (Gwh) Growth (%)
Commercial
6,244 5,930 5,980 6,586 6,036
6.1
(0.9)
(10.7)
(2.5)
2.0
(30.0)(29.0)(28.0)(27.0)(26.0)(25.0)(24.0)(23.0)(22.0)(21.0)(20.0)(19.0)(18.0)(17.0)(16.0)(15.0)(14.0)(13.0)(12.0)(11.0)(10.0)(9.0)(8.0)(7.0)(6.0)(5.0)(4.0)(3.0)(2.0)(1.0)0.01.02.03.04.05.06.07.08.09.010.0
4,000
4,500
5,000
5,500
6,000
6,500
7,000
7,500
8,000
8,500
9,000
9,500
10,000
1QFY'17 2QFY'17 3QFY'17 4QFY'17 1QFY'18
Unit Sales (Gwh) Growth (%)
Domestic
539 531 530 545 543
9.8 6.6 7.3
11.7
2.6
(40.0)(39.0)(38.0)(37.0)(36.0)(35.0)(34.0)(33.0)(32.0)(31.0)(30.0)(29.0)(28.0)(27.0)(26.0)(25.0)(24.0)(23.0)(22.0)(21.0)(20.0)(19.0)(18.0)(17.0)(16.0)(15.0)(14.0)(13.0)(12.0)(11.0)(10.0)(9.0)(8.0)(7.0)(6.0)(5.0)(4.0)(3.0)(2.0)(1.0)0.01.02.03.04.05.06.07.08.09.010.011.012.013.014.015.0
300
400
500
600
700
800
900
1QFY'17 2QFY'17 3QFY'17 4QFY'17 1QFY'18
Unit Sales (Gwh) Growth (%)
Others
FINANCIAL DETAILSKEY HIGHLIGHTS
Positive Growth for Industrial & Domestic SectorY-o-Y Sectoral Demand Growth
10
12,500
13,000
13,500
14,000
14,500
15,000
15,500
16,000
16,500
17,000
17,500
18,000
18,500
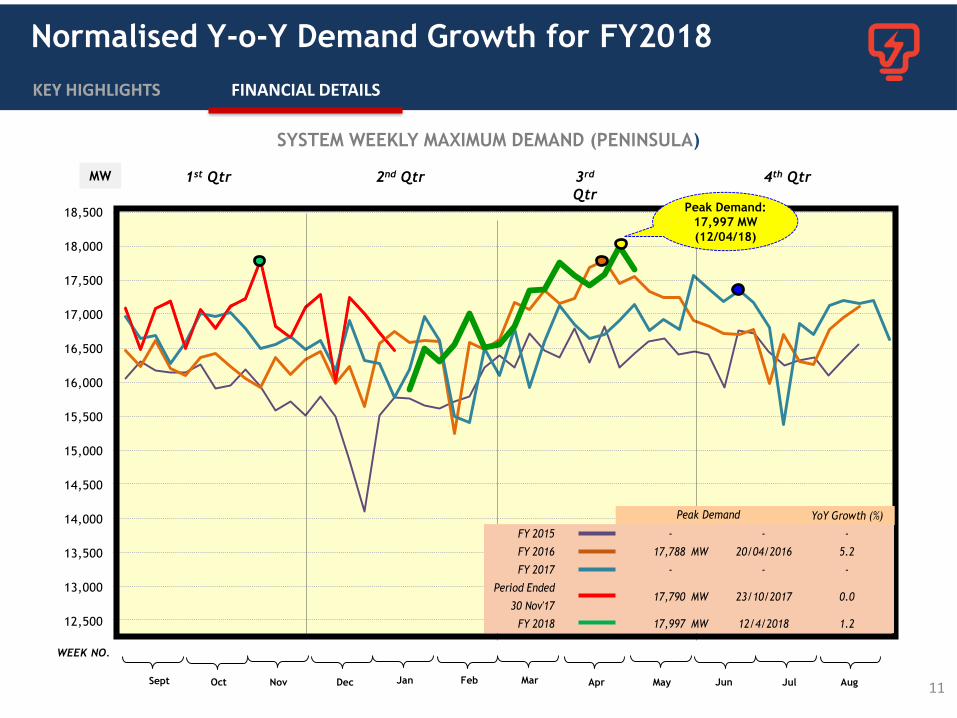
1st Qtr 2nd Qtr 3rd
Qtr
4th QtrMW
Oct Nov Dec Jan Feb Mar Apr May Jun Jul Aug
WEEK NO.
Sept
YoY Growth (%)
FY 2015 - -
FY 2016 17,788 MW 20/04/2016 5.2
FY 2017 - -
Period Ended
30 Nov'1717,790 MW 23/10/2017 0.0
FY 2018 17,997 MW 12/4/2018 1.2
Peak Demand
-
-
11
SYSTEM WEEKLY MAXIMUM DEMAND (PENINSULA)
Peak Demand:
17,997 MW
(12/04/18)
FINANCIAL DETAILSKEY HIGHLIGHTS
Normalised Y-o-Y Demand Growth for FY2018

12
1QFY’18 RM mn
Capacity payment 1,009.1
Energy Payment 2,655.5
Total IPPs Purchases/Costs 3,664.6
Fuel Costs 2,482.3
Total Generation Cost 6,146.9
Repair & Maintenance 433.3
Staff Costs 939.1
TNB General Expenses 469.9
Subs. Cost of Sales & Opex 245.6
Depreciation & Amortization 1,532.0
Total Non-Generation Cost 3,619.9
Total Operating Expenses 9,766.8
FINANCIAL DETAILSKEY HIGHLIGHTS
Generation Cost Constitute 63% of the Group Operating Expenses

13
FINANCIAL DETAILSKEY HIGHLIGHTS
Q-o-Q Trend of Group Operating Expenses
Increased mainly due to:
i. PPE written off for decommissioned plants
ii. Higher general R&M
1
29%30%
29%
30%31%
30%
20%21%
20%
18%
21%20%
13% 13%13% 13% 13%
12%
8%7% 7%
9%8%
7%
4% 4% 4%
5%
3% 3%
5% 5%
3%
9% 5%4%
1QFY'17
2QFY'17
3QFY'17
4QFY'17
PENov'17
1QFY'18
% of OPEX/Revenue
1
IPP Cost
TNB Fuel Cost
Depreciation &
Amortization
Staff Cost
General Expenses
Repair &
Maintenance

GENERATION MIX PENINSULA
Table 1:
14
Table 3:
FINANCIAL DETAILSKEY HIGHLIGHTS
Shift of Generation Mix to Gas
Fuel TypeFuel Cost
RM’mn
Unit Generated
Gwh
Gas 2,115.3
12,444.6
LNG 17.0
Coal 2,454.1 16,242.2
Distillate 11.8 4.8
Oil 7.3 14.0
Hydro - 1,493.9
Total 4,605.5 30,199.5
1QFY’18
Daily Average Gas Volume (mmscfd) 949
Average LNG Price (RM/mmbtu) 30.05
Average Piped Gas Price (RM/mmbtu) 24.20
Average Coal Price Consumed (USD/MT)(CIF) 92.1
Average Coal Price Consumed (RM/MT)(CIF) 361.7
Coal Consumption (mn MT) 7.1
42.145.6
41.4 40.2 36.9 41.2
54.4 50.252.8 53.5 56.9
53.8
0.5 0.10.3 0.4 0.0
0.1
3.0 4.15.5 5.9 6.2 4.9
1QFY'17
2QFY'17
3QFY'17
4QFY'17
PE Nov'17 1QFY'18
Gas Coal Oil & Distillate Hydro
%
Table 2:
Coal freight cost for 1QFY’18 : USD6.77/mt

Gas TNB19.4
Gas IPP17.5
Coal TNB29.6
Coal IPP27.3
Hydro6.2
Gas TNB20.4
Gas IPP20.8
Coal TNB33.2
Coal IPP20.6
Hydro5.0
%Gas TNB
20.1
Gas IPP21.6
LNG0.3
Coal TNB28.8
Coal IPP28.9
Dist. TNB, 0.2
Oil TNB, 0.1Gas TNB
23.1
Gas IPP22.8
LNG0.4
Coal TNB29.5
Coal IPP23.8
Dist. TNB, 0.2Dist. IPP, 0.1
Oil TNB, 0.1
%
15
Units GeneratedFuel Costs
Period Ended
Nov’17Period Ended
Nov’17
1QFY’18
% indicates generation market share
1QFY’18
FINANCIAL DETAILSKEY HIGHLIGHTS
Fuel Costs (TNB & IPPs – Peninsula)

17.818.9
20.8 20.819.3
22.2
25.4
27.4
9.7
31.4
0.0
5.0
10.0
15.0
20.0
25.0
30.0
35.0
FY'10 FY'11 FY'12 FY'13 FY'14 FY'15 FY'16 FY'17 Period Ended31 Dec' 17
FY'18
Tonne (mn)
Estimated Procurement
63%
24%
2%11%
Country Mix
Indonesia Australia
South Africa Russia
Coal Consumption
Average Coal Price (CIF) FY'10 FY'11 FY'12 FY'13 FY'14 FY'15 FY'16 FY'17 1QFY'18
USD/metric tonne 88.2 106.9 103.6 83.6 75.4 66.0 55.7 72.7 92.1
RM/metric tonne 293.8 325.9 321.9 259.5 244.6 236.0 231.1 314.7 361.7
FINANCIAL DETAILSKEY HIGHLIGHTS
Coal Requirement
16

33.4
5.7
2.50.7
32.8
6.0
2.50.1
RM USD YEN OTHERS
Mar-18 Dec-17Total Debt 42.3
Net Debt 27.1
Gearing 41.9
Net Gearing 26.9
Fixed : Floating 95:5
Final Exposure 96:4
Weighted Average Cost of Debt 4.97
Final Exposure 4.96
Statistics (%) 31st
Mar'18
Closing FOREX 31st Mar’18
USD/RM 3.86
100YEN/RM 3.64
USD/YEN 106.04
* Net Debt excludes deposits, bank and cash balances & investment in UTF
78.9%
13.5%
5.9%
1.7%
RM Billion
FINANCIAL DETAILSKEY HIGHLIGHTS
Gearing Level Registered at 42%
17

Question & Answer

DISCLAIMER
All information contained herein is meant strictly for the use of this presentation
only and should not be used or relied on by any party for any other purpose and
without the prior written approval of TNB. The information contained herein is
the property of TNB and it is privileged and confidential in nature. TNB has the
sole copyright to such information and you are prohibited from disseminating,
distributing, copying,
re-producing, using and/or disclosing this information.

CoE INVESTOR RELATONS
GROUP FINANCE DIVISION
Tenaga Nasional Berhad
4th Floor, TNB Headquarters
No.129, Jalan Bangsar,
59200 Kuala Lumpur, MALAYSIA
Tel : +603 2296 6748
Fax : +603 2284 0095
Email : [email protected]
Website : www.tnb.com.my
CONTACT DETAILS
IR OFFICERS:
Anis Ramli +603 2296 6821
Mimi Norliyana +603 2296 6698
Nizham Khan +603 2296 6951
THANK YOU


