
Data: The UnhiddenMystery of TurkishProperty Valuation System
Ümit Yıldız & Tuğba Güneş
Presented at th
e FIG Congress 2018,
May 6-11, 2018 in
Ista
nbul, Turkey

A Commercial Property in Bosphorous
April 2014 → 14.500.000 TL
May 2015 → 15.000.000 TL
June 2015 → 45.500.000 TL

An Office Building in Beylikdüzü/İstanbul
January 2014 → 7.500.000 TL
August 2015 → 4.000.000 TL
March 2016 → 12.350.000 TL
November 2016 → 25.000.000 TL

Unreliable Value Data…1

Property Valuation Activities
Property Valuations for Public PurposesProperty Valuations for Capital Market
Turkish Appraisers Association Various Public Institutions
Real Estate Information System Local Databases

Property Valuation Activities
Distribution of Turkish Appraisers Association’sMembers Queries
Distribution of Expropriated Properties

Non-Integrated Databases…2

“HOUSING SALES” STATISTICS IN TURKEY
Type of
Sales
2013 2014 2015 2016
TAKBIS Turkstat TAKBIS Turkstat TAKBIS Turkstat TAKBIS Turkstat
Other Sales 604 640 697 078 678 635 775 692 739 968 854 932 775 934 891 945
Mortgaged
Sales446 481 460 112 382 203 389 689 417 025 434 388 434 673 449 508

Lack of Data Standardization…3

Years Total Number of SalesTotal Number of Full Share
Sales
2012 1 915 673 1 639 843
2013 2 151 666 1 866 160
2014 2 211 382 1 922 118
2015 2 380 553 2 052 463
2016 2 446 966 2 117 645
A BRIEF LOOK AT THE PROPERTY MARKET IN TURKEY

A BRIEF LOOK AT THE PROPERTY MARKET IN TURKEY
Years
Number of Other Sales Number of Mortgaged Sales
TOTALLands*
Individual Units
Total Lands*Individual
UnitsTotal
2012 646 578 662 098 1308676 6622 324544 331166 1639843
2013 695 747 699 294 1395041 10785 460333 471118 1866160
2014 738 302 776 588 1514890 10866 396360 407226 1922118
2015 763 189 844 714 1607903 12445 432115 444560 2052463
2016 776 192 882 409 1658601 11009 448034 459043 2117645
Total 4 117 453 4 421 598 8539051 58882 2381406 2440288 10979344

A BRIEF LOOK AT THE PROPERTY MARKET IN TURKEY
Share of Other Sales
Lands*Individual
UnitsTotal
49% 51% 100%
Share of Mortgaged Sales
Lands*Individual
UnitsTotal
2% 98% 100%

A BRIEF LOOK AT THE PROPERTY MARKET IN TURKEY
Şahinbey district in Gaziantep 20132012

A BRIEF LOOK AT THE PROPERTY MARKET IN TURKEY
Beykoz district in İstanbul 20162012

A BRIEF LOOK AT THE PROPERTY MARKET IN TURKEY
Biga district in Çanakkale 20162012

A BRIEF LOOK AT THE PROPERTY MARKET IN TURKEY
Date Price (TL)
28.05.2012 700
19.12.2012 1.000
11.01.2013 1.100
16.04.2013 1.100
01.10.2013 1.000
18.03.2014 1.000
21.3.2014 1.000
04.11.2014 2.000
Date Price
06.11.2014 2.000
24.11.2014 2.100
26.11.2014 2.200
17.12.2014 1.000
12.01.2015 1.200
18.08.2015 1.500
20.08.2015 1.500
16.10.2015 2.000
20.10.2015 2.000

Inefficient Use of Data…. 4
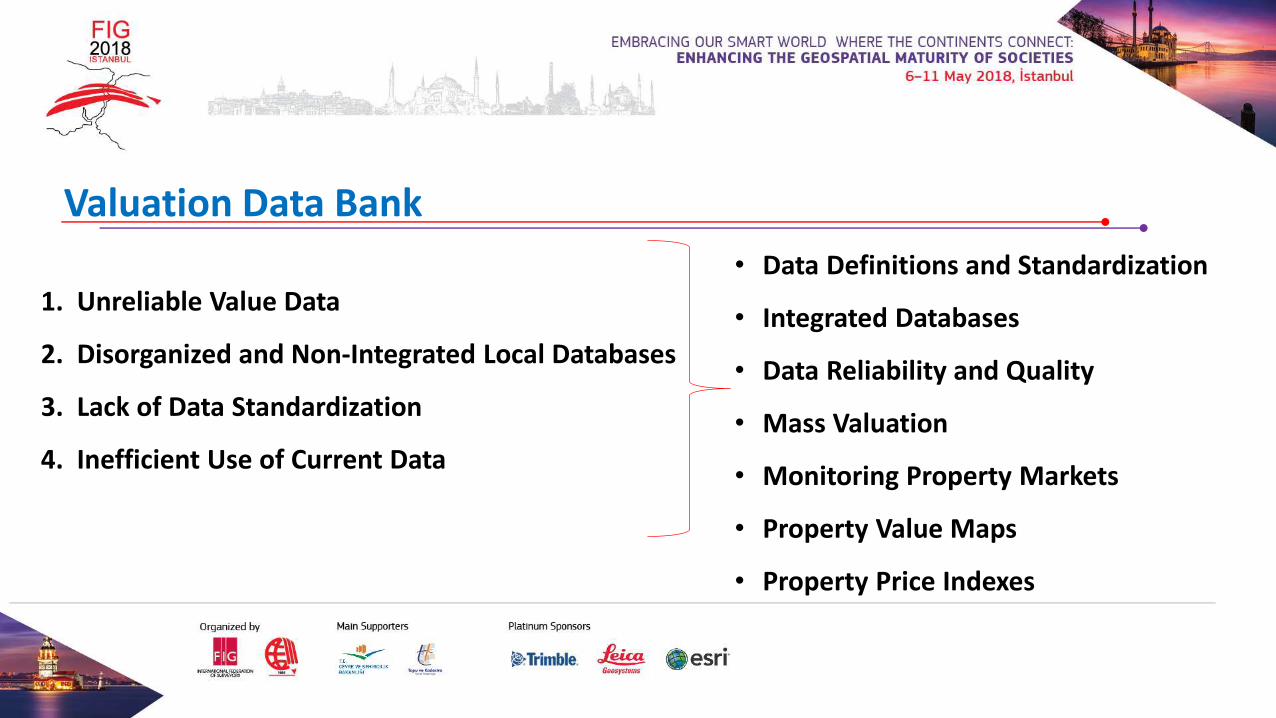
1. Unreliable Value Data
2. Disorganized and Non-Integrated Local Databases
3. Lack of Data Standardization
4. Inefficient Use of Current Data
Valuation Data Bank
• Data Definitions and Standardization
• Integrated Databases
• Data Reliability and Quality
• Mass Valuation
• Monitoring Property Markets
• Property Value Maps
• Property Price Indexes

Land Administration
for
SustainableDevelopment
Land Tenure
Land Value
Land Use
Land Development
0,00%
4,00%
8,00%
12,00%
16,00%
20,00%
2005 2007 2009 2011 2013 2015Construction Real Estate Activities Total
Thank you…
Ümit Yıldı[email protected]
Tuğba Güneş[email protected]
General Directorate of Land Registry and CadastreTurkey


