
Presented by
Robert Hurlston
UNTF Conference 2011
Characterisation of the Effect of Residual Stress on Brittle Fracture in Pressure Vessel Steel

Content
Introduction
– Residual Stress
– Constraint
Work Undertaken
– Finite Element Modelling
– Experimental
Results
– Finite Element Modelling
– Experimental
– Two-Parameter Analysis (J-Q)
Summary

Introduction
It is extremely important that the integrity of nuclear plant can be ensured
Failure assessment
– Fracture toughness of materials within the structure are commonly used in failure assessments
– This can be difficult to evaluate where weld residual stresses are present
Therefore,
– We need to understand the effects of residual stress on fracture toughness

Residual Stress
… is defined as:
– stress existing in a material when it is under no primary load
This can contribute to crack driving force
How else does it affect crack-tip conditions?
-600
-400
-200
0
200
400
600
800
0 5 10 15 20 25 30 35 40 45 50
Residual Stress (MPa)
Din
sta
nc
e f
rom
Pla
te S
urf
ac
e (
mm
)
Transverse A508
Longitudinal A508

Constraint
It is well known that geometry and loading affect crack-tip constraint

Effect of Residual Stress on Constraint?
Can residual stress affect constraint of crack-tip material?
Yes!
– It has been demonstrated by many authors
However, these effects are not well understood
– Problematic associated plastic strains
Can we characterise these effects?

Work Undertaken
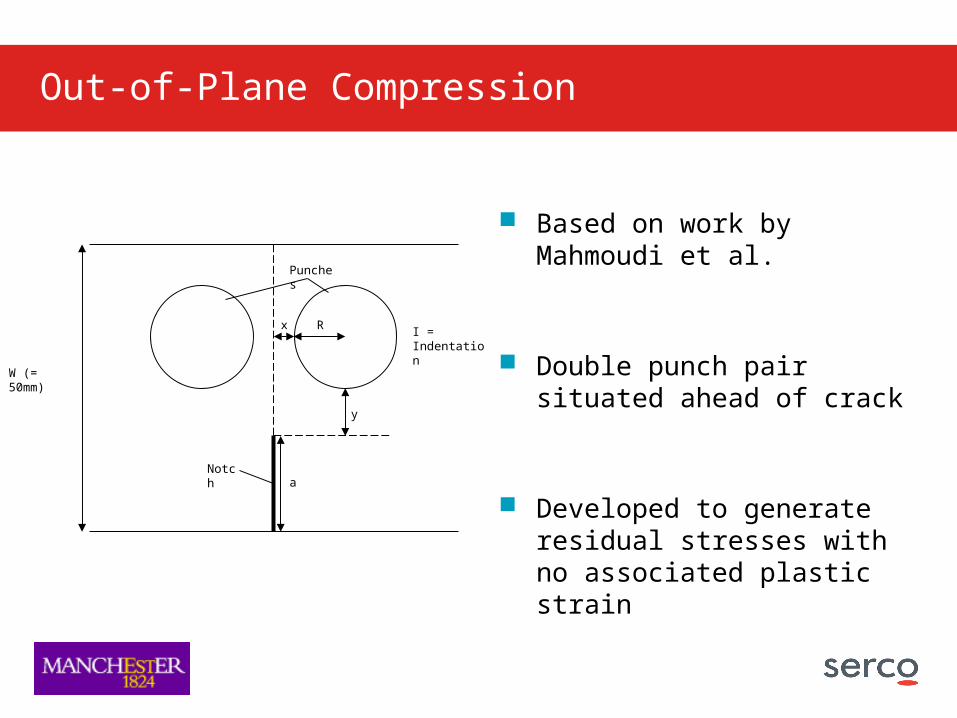
Out-of-Plane Compression
Based on work by Mahmoudi et al.
Double punch pair situated ahead of crack
Developed to generate residual stresses with no associated plastic strain
Rx
y
I = Indentation
W (= 50mm)
a
Punches
Notch

Finite Element Modelling (Models)
Single edge notched bend specimens modelled with cracks of a/W = 0.2 and a/W = 0.4 (where W = 50mm)
Circular features simulated punch contact with surface

Finite Element Modelling (Residual Stresses Generated)
Out-of-plane compression used double, 5mm radius ‘punches’
Stress was generated ahead of crack-like notch before crack was grown to final length (5mm growth)
-400
-200
0
200
400
600
800
0 5 10 15 20 25 30 35 40
x ahead of notch (mm)
Ope
ning
mod
e st
ress
(MPa
)
-400
-200
0
200
400
600
800
0 5 10 15 20 25 30 35 40
x ahead of notch (mm)
Ope
ning
mod
e st
ress
(MP
a)
a/W = 0.2 a/W = 0.4
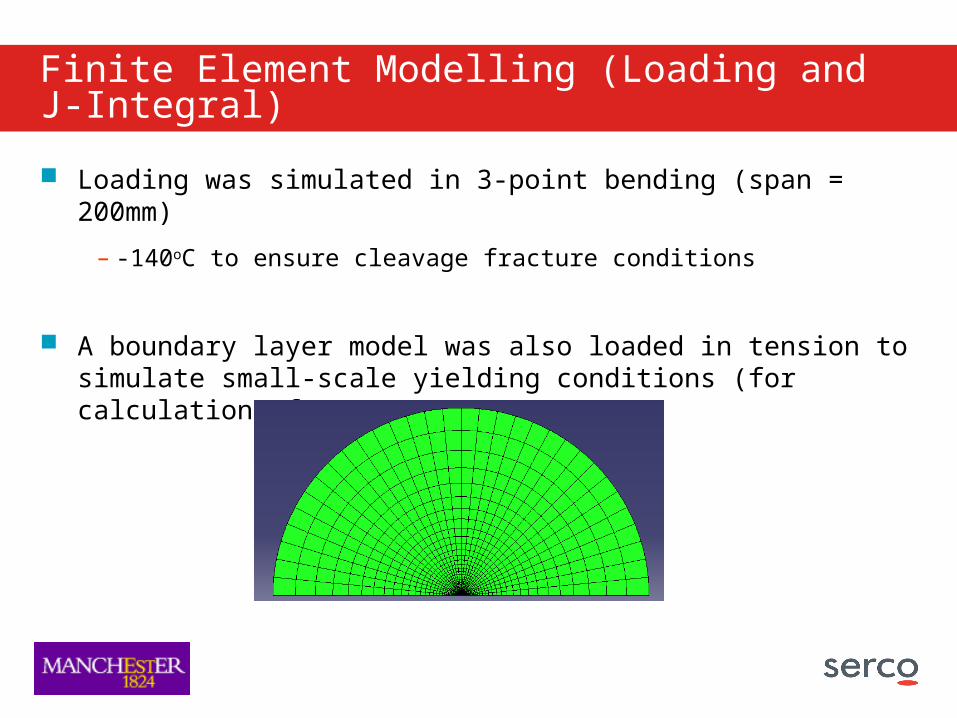
Finite Element Modelling (Loading and J-Integral)
Loading was simulated in 3-point bending (span = 200mm)
– -140oC to ensure cleavage fracture conditions
A boundary layer model was also loaded in tension to simulate small-scale yielding conditions (for calculation of Q)
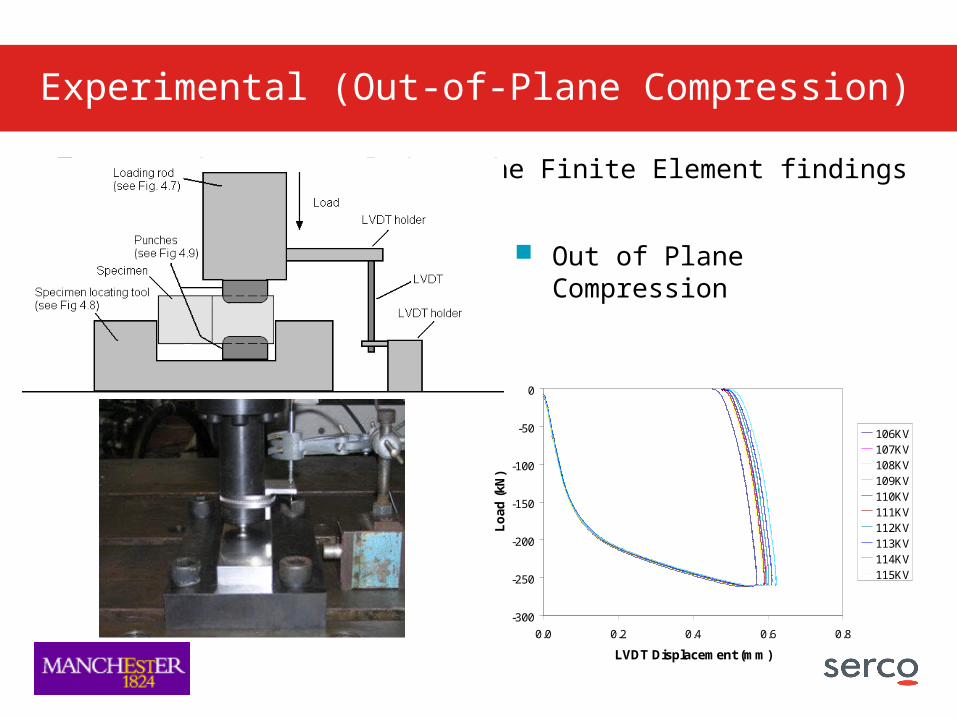
Experimental (Out-of-Plane Compression)
Carried out to validate the Finite Element findings
-300
-250
-200
-150
-100
-50
0
0.0 0.2 0.4 0.6 0.8
LVDT Displacement (mm)
Lo
ad (
kN)
106KV107KV108KV109KV110KV111KV112KV113KV114KV115KV
Out of Plane Compression
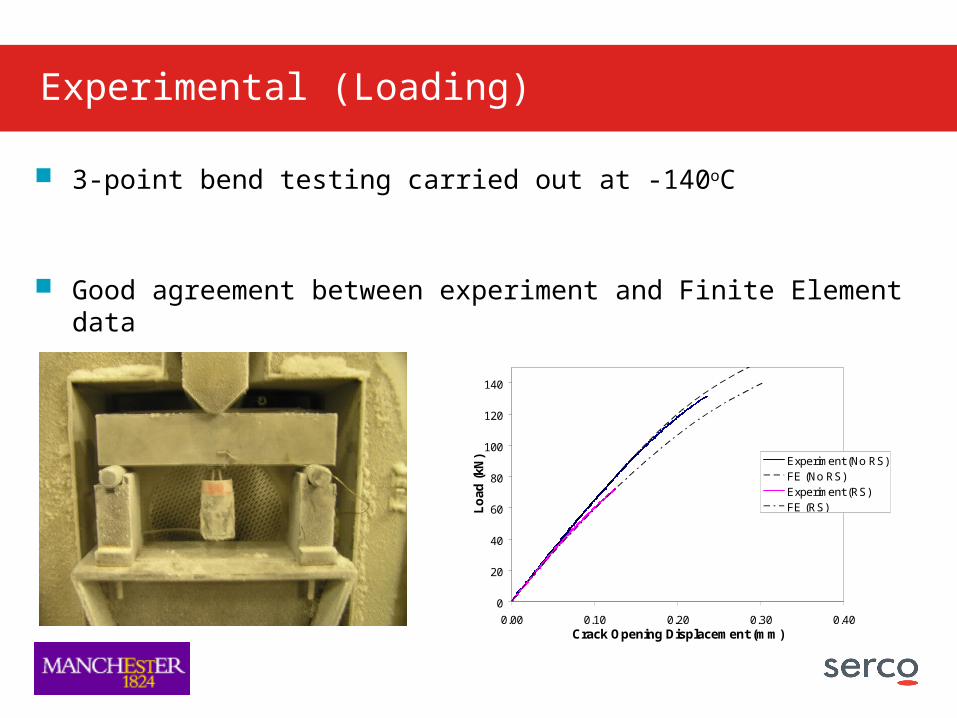
Experimental (Loading)
3-point bend testing carried out at -140oC
Good agreement between experiment and Finite Element data
0
20
40
60
80
100
120
140
0.00 0.10 0.20 0.30 0.40Crack Opening Displacement (mm)
Lo
ad (
kN) Experiment (No RS)
FE (No RS)Experiment (RS)FE (RS)
Results
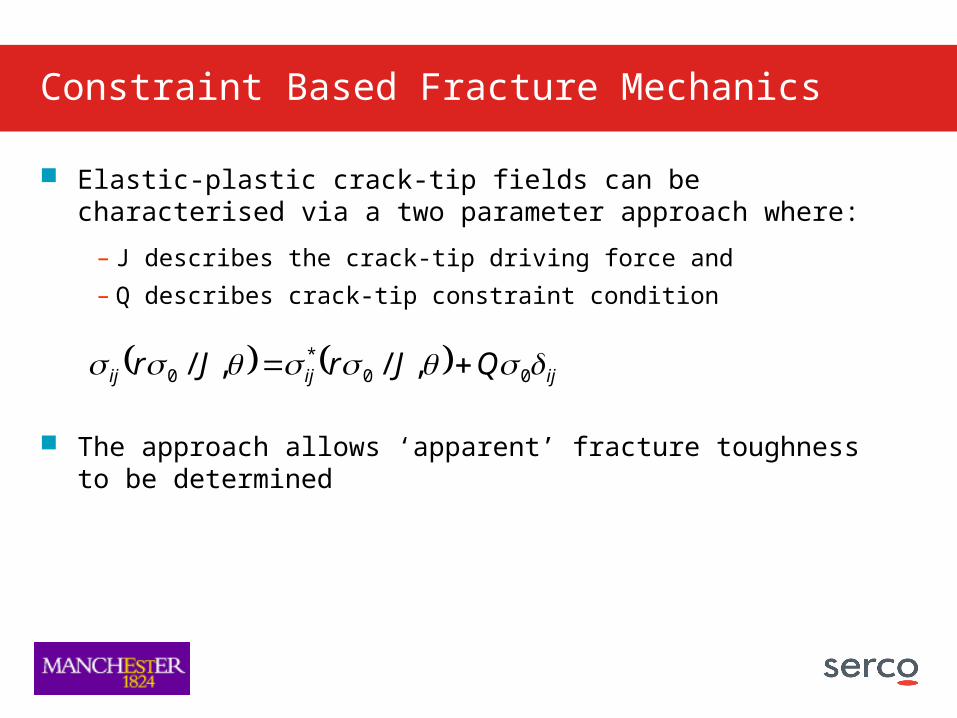
Constraint Based Fracture Mechanics
Elastic-plastic crack-tip fields can be characterised via a two parameter approach where:
– J describes the crack-tip driving force and
– Q describes crack-tip constraint condition
The approach allows ‘apparent’ fracture toughness to be determined
ijijij QJrJr 00*
0 ,/,/

J-Q Space
J-Q space
Loading line (evolution of constraint with increasing J)
Failure Line (J for failure increases as constraint is lost)
Failure deemed to occur where lines intersect
Constraint corrected J (Jc)
0
J
Q
J*c

2
2.5
3
3.5
4
1 2 3 4 5
rσ0/J
σθθ
/σ0
J = 10.3kN/mJ = 26.06kN/mJ = 49.0kN/mJ = 79.2kN/mJ = 116.5kN/m
2
2.5
3
3.5
4
1 2 3 4 5
rσ0/J
σθθ
/σ0
SSYJ = 26.7kN/mJ = 51.9kN/mJ = 73.9kN/mJ = 103.6kN/m
No Residual Stress
Crack-tip stress fields, generated during loading of the boundary layer model, are plotted at increasing J-integrals
Finite Element Results
a/W = 0.2 a/W = 0.4
Residual Stress
2
2.5
3
3.5
4
1 2 3 4 5
rσ0/J
σθθ
/σ0
SSYJ = 9.7kN/mJ = 25.1kN/mJ = 52.6kN/mJ = 76.8kN/mJ = 100.6kN/m
2
2.5
3
3.5
4
1 2 3 4 5
rσ0/J
σθθ
/σ0
SSYJ = 11.2kN/mJ = 25.3kN/mJ = 52.4kN/mJ = 76.3kN/mJ = 103.6kN/m
2
2.5
3
3.5
4
1 2 3 4 5
rσ0/J
σθθ
/σ0
SSYJ = 26.1kN/mJ = 51.9kN/mJ = 74.0kN/mJ = 99.5kN/m

0
10
20
30
40
50
60
70
80
90
100
-0.20 -0.15 -0.10 -0.05 0.00 0.05
Q
J (k
Nm
-1)
a/W = 0.22 No RS
a/W = 0.42 No RS
a/W = 0.22 RS
a/W = 0.42 RS
a/W = 0.22 No RS Jc
a/W = 0.42 No RS Jc
a/W = 0.22 RS Jc
a/W = 0.42 RS Jc
0
10
20
30
40
50
60
70
80
90
100
-0.20 -0.15 -0.10 -0.05 0.00 0.05
Q
J (k
Nm
-1)
a/W = 0.22 No RS
a/W = 0.42 No RS
a/W = 0.22 RS
a/W = 0.42 RS
0
10
20
30
40
50
60
70
80
90
100
-0.20 -0.15 -0.10 -0.05 0.00 0.05
Q
J (k
Nm
-1)
a/W = 0.22 No RS
a/W = 0.42 No RSa/W = 0.22 RS
a/W = 0.42 RSJc SSY
a/W = 0.22 No RS Jca/W = 0.42 No RS Jc
a/W = 0.22 RS Jca/W = 0.42 RS Jc
Closed Form Jc
J-Q Analysis
Using constraint based fracture mechanics:
– Loading lines can be plotted
– Their associated fracture toughness curves can be plotted using RKR
Closed form equation is in good agreement
10
* /1 nfcc QJJ

0
20
40
60
80
100
120
140
Specimen Type
Fai
lure
Lo
ad (
kN) a/W = 0.42 Residual
Stress
a/W = 0.42 As-received
a/W = 0.22 ResidualStress
a/W = 0.22 As-received
Experimental Results
Specimens with residual stress fail at lower loads
Large degree of scatter
– A533B laminate microstructure

Experimental Validation
Mean experimental results validate the use of unique toughness curve
– All within 7% of the closed form failure curve
0
10
20
30
40
50
60
70
80
90
100
-0.20 -0.15 -0.10 -0.05 0.00 0.05
Q
J (
Nm
m-1
)
a/W = 0.22 No RSa/W = 0.42 No RSa/W = 0.22 RSa/W = 0.42 RSClosed Form Jca/W = 0.22 No RS (Exp failure)a/W = 0.42 No RS (Exp failure)a/W = 0.22 RS (Exp failure)a/W = 0.42 RS (Exp failure)95% Pf5% Pf

Summary

Summary
It is known that residual stresses can affect crack-tip constraint
– How it does was not well understood
This work has validated the use of a unique failure curve in J-Q space when residual stresses affect crack-tip conditions
– Where no associated plastic strain is present
– Using novel adaptation of out-of-plane compression
Future work might consider the effect of plastic strain on constraint and the use of unique a material toughness curve
– Allowing inclusion into failure assessment guidance

Questions???
References:
• Hill M R and Panontin T L. Effect of residual stress on brittle fracture testing. Fatigue and Fracture Mechanics29, ASTM STP 1332. 1998
• Sumpter J. The effect of notch depth and orientation on the fracture toughness of multi-pass weldments. Int. J. Pres. Ves. and piping 10. 1982
• Mahmoudi A H, Truman C E and Smith D J. Using local out-of-plane compression (LOPC) to study the effects of residual stress on apparent fracture toughness. Engineering Fracture Mechanics 75 1516–1534. June 2007


