presented by robert hurlston untf conference 2011 characterisation of the effect of residual stress...
TRANSCRIPT

Presented by
Robert Hurlston
UNTF Conference 2011
Characterisation of the Effect of Residual Stress on Brittle Fracture in Pressure Vessel Steel

Content
Introduction
– Residual Stress
– Constraint
Work Undertaken
– Finite Element Modelling
– Experimental
Results
– Finite Element Modelling
– Experimental
– Two-Parameter Analysis (J-Q)
Summary

Introduction
It is extremely important that the integrity of nuclear plant can be ensured
Failure assessment
– Fracture toughness of materials within the structure are commonly used in failure assessments
– This can be difficult to evaluate where weld residual stresses are present
Therefore,
– We need to understand the effects of residual stress on fracture toughness

Residual Stress
… is defined as:
– stress existing in a material when it is under no primary load
This can contribute to crack driving force
How else does it affect crack-tip conditions?
-600
-400
-200
0
200
400
600
800
0 5 10 15 20 25 30 35 40 45 50
Residual Stress (MPa)
Din
sta
nc
e f
rom
Pla
te S
urf
ac
e (
mm
)
Transverse A508
Longitudinal A508

Constraint
It is well known that geometry and loading affect crack-tip constraint

Effect of Residual Stress on Constraint?
Can residual stress affect constraint of crack-tip material?
Yes!
– It has been demonstrated by many authors
However, these effects are not well understood
– Problematic associated plastic strains
Can we characterise these effects?

Work Undertaken
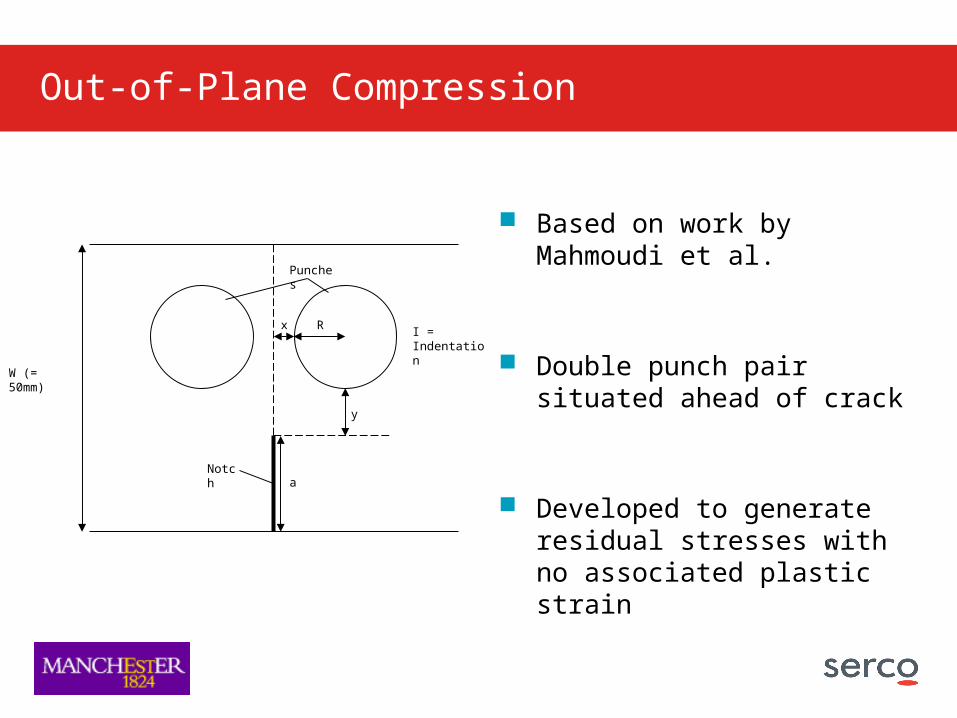
Out-of-Plane Compression
Based on work by Mahmoudi et al.
Double punch pair situated ahead of crack
Developed to generate residual stresses with no associated plastic strain
Rx
y
I = Indentation
W (= 50mm)
a
Punches
Notch

Finite Element Modelling (Models)
Single edge notched bend specimens modelled with cracks of a/W = 0.2 and a/W = 0.4 (where W = 50mm)
Circular features simulated punch contact with surface

Finite Element Modelling (Residual Stresses Generated)
Out-of-plane compression used double, 5mm radius ‘punches’
Stress was generated ahead of crack-like notch before crack was grown to final length (5mm growth)
-400
-200
0
200
400
600
800
0 5 10 15 20 25 30 35 40
x ahead of notch (mm)
Ope
ning
mod
e st
ress
(MPa
)
-400
-200
0
200
400
600
800
0 5 10 15 20 25 30 35 40
x ahead of notch (mm)
Ope
ning
mod
e st
ress
(MP
a)
a/W = 0.2 a/W = 0.4
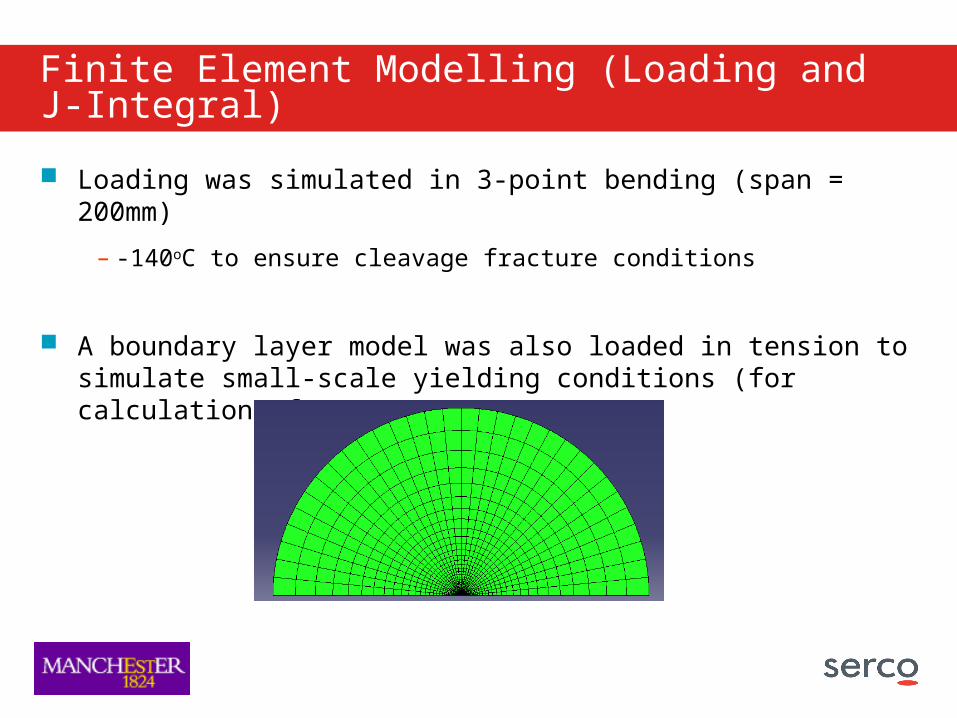
Finite Element Modelling (Loading and J-Integral)
Loading was simulated in 3-point bending (span = 200mm)
– -140oC to ensure cleavage fracture conditions
A boundary layer model was also loaded in tension to simulate small-scale yielding conditions (for calculation of Q)
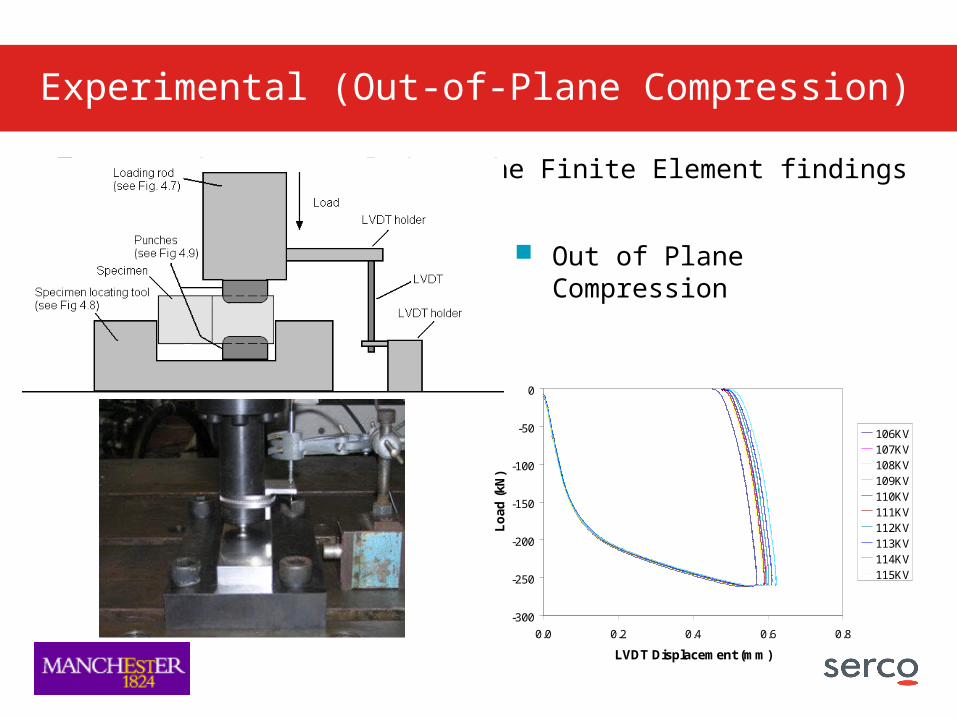
Experimental (Out-of-Plane Compression)
Carried out to validate the Finite Element findings
-300
-250
-200
-150
-100
-50
0
0.0 0.2 0.4 0.6 0.8
LVDT Displacement (mm)
Lo
ad (
kN)
106KV107KV108KV109KV110KV111KV112KV113KV114KV115KV
Out of Plane Compression
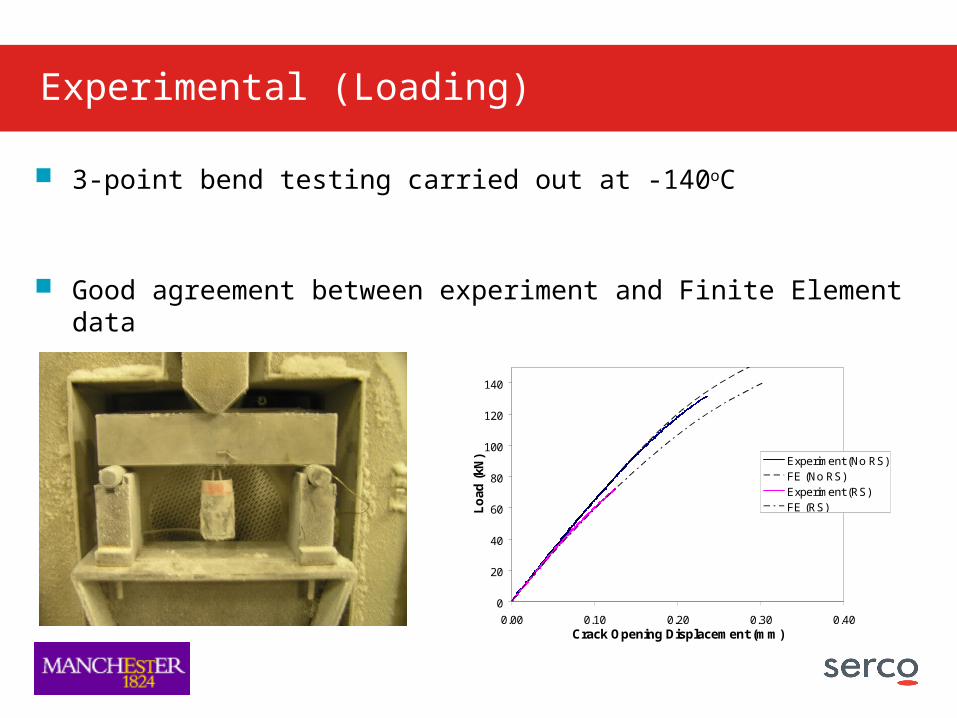
Experimental (Loading)
3-point bend testing carried out at -140oC
Good agreement between experiment and Finite Element data
0
20
40
60
80
100
120
140
0.00 0.10 0.20 0.30 0.40Crack Opening Displacement (mm)
Lo
ad (
kN) Experiment (No RS)
FE (No RS)Experiment (RS)FE (RS)
Results
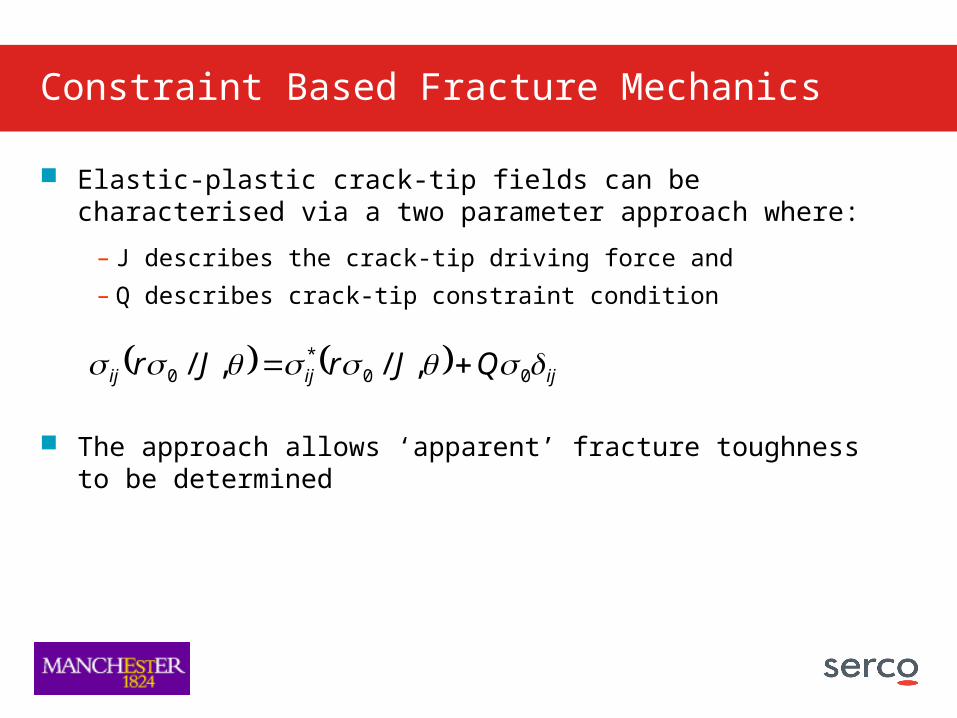
Constraint Based Fracture Mechanics
Elastic-plastic crack-tip fields can be characterised via a two parameter approach where:
– J describes the crack-tip driving force and
– Q describes crack-tip constraint condition
The approach allows ‘apparent’ fracture toughness to be determined
ijijij QJrJr 00*
0 ,/,/

J-Q Space
J-Q space
Loading line (evolution of constraint with increasing J)
Failure Line (J for failure increases as constraint is lost)
Failure deemed to occur where lines intersect
Constraint corrected J (Jc)
0
J
Q
J*c

2
2.5
3
3.5
4
1 2 3 4 5
rσ0/J
σθθ
/σ0
J = 10.3kN/mJ = 26.06kN/mJ = 49.0kN/mJ = 79.2kN/mJ = 116.5kN/m
2
2.5
3
3.5
4
1 2 3 4 5
rσ0/J
σθθ
/σ0
SSYJ = 26.7kN/mJ = 51.9kN/mJ = 73.9kN/mJ = 103.6kN/m
No Residual Stress
Crack-tip stress fields, generated during loading of the boundary layer model, are plotted at increasing J-integrals
Finite Element Results
a/W = 0.2 a/W = 0.4
Residual Stress
2
2.5
3
3.5
4
1 2 3 4 5
rσ0/J
σθθ
/σ0
SSYJ = 9.7kN/mJ = 25.1kN/mJ = 52.6kN/mJ = 76.8kN/mJ = 100.6kN/m
2
2.5
3
3.5
4
1 2 3 4 5
rσ0/J
σθθ
/σ0
SSYJ = 11.2kN/mJ = 25.3kN/mJ = 52.4kN/mJ = 76.3kN/mJ = 103.6kN/m
2
2.5
3
3.5
4
1 2 3 4 5
rσ0/J
σθθ
/σ0
SSYJ = 26.1kN/mJ = 51.9kN/mJ = 74.0kN/mJ = 99.5kN/m

0
10
20
30
40
50
60
70
80
90
100
-0.20 -0.15 -0.10 -0.05 0.00 0.05
Q
J (k
Nm
-1)
a/W = 0.22 No RS
a/W = 0.42 No RS
a/W = 0.22 RS
a/W = 0.42 RS
a/W = 0.22 No RS Jc
a/W = 0.42 No RS Jc
a/W = 0.22 RS Jc
a/W = 0.42 RS Jc
0
10
20
30
40
50
60
70
80
90
100
-0.20 -0.15 -0.10 -0.05 0.00 0.05
Q
J (k
Nm
-1)
a/W = 0.22 No RS
a/W = 0.42 No RS
a/W = 0.22 RS
a/W = 0.42 RS
0
10
20
30
40
50
60
70
80
90
100
-0.20 -0.15 -0.10 -0.05 0.00 0.05
Q
J (k
Nm
-1)
a/W = 0.22 No RS
a/W = 0.42 No RSa/W = 0.22 RS
a/W = 0.42 RSJc SSY
a/W = 0.22 No RS Jca/W = 0.42 No RS Jc
a/W = 0.22 RS Jca/W = 0.42 RS Jc
Closed Form Jc
J-Q Analysis
Using constraint based fracture mechanics:
– Loading lines can be plotted
– Their associated fracture toughness curves can be plotted using RKR
Closed form equation is in good agreement
10
* /1 nfcc QJJ

0
20
40
60
80
100
120
140
Specimen Type
Fai
lure
Lo
ad (
kN) a/W = 0.42 Residual
Stress
a/W = 0.42 As-received
a/W = 0.22 ResidualStress
a/W = 0.22 As-received
Experimental Results
Specimens with residual stress fail at lower loads
Large degree of scatter
– A533B laminate microstructure

Experimental Validation
Mean experimental results validate the use of unique toughness curve
– All within 7% of the closed form failure curve
0
10
20
30
40
50
60
70
80
90
100
-0.20 -0.15 -0.10 -0.05 0.00 0.05
Q
J (
Nm
m-1
)
a/W = 0.22 No RSa/W = 0.42 No RSa/W = 0.22 RSa/W = 0.42 RSClosed Form Jca/W = 0.22 No RS (Exp failure)a/W = 0.42 No RS (Exp failure)a/W = 0.22 RS (Exp failure)a/W = 0.42 RS (Exp failure)95% Pf5% Pf

Summary

Summary
It is known that residual stresses can affect crack-tip constraint
– How it does was not well understood
This work has validated the use of a unique failure curve in J-Q space when residual stresses affect crack-tip conditions
– Where no associated plastic strain is present
– Using novel adaptation of out-of-plane compression
Future work might consider the effect of plastic strain on constraint and the use of unique a material toughness curve
– Allowing inclusion into failure assessment guidance

Questions???
References:
• Hill M R and Panontin T L. Effect of residual stress on brittle fracture testing. Fatigue and Fracture Mechanics29, ASTM STP 1332. 1998
• Sumpter J. The effect of notch depth and orientation on the fracture toughness of multi-pass weldments. Int. J. Pres. Ves. and piping 10. 1982
• Mahmoudi A H, Truman C E and Smith D J. Using local out-of-plane compression (LOPC) to study the effects of residual stress on apparent fracture toughness. Engineering Fracture Mechanics 75 1516–1534. June 2007