
CITY UNIVERSITY OF HONG KONG
Psychosocial Factors and Depression:
The Mediating Role of Sleep
A Report Submitted to
Department of Applied Social Studies
in Partial Fulfillment of the Requirements for
the Bachelor of Social Sciences in Psychology
by
SING Cheuk Yan
April, 2009

ii
Abstract
Objectives. The purpose of the present study was to determine, if any, the
mediating role of sleep in the relationship between psychosocial factors and
depression.
Methods. A sample of 529 Chinese college students participants were recruited
from 4 Universities in Hong Kong, they completed a self-report questionnaire
measuring their level of optimism, social support, stress, sleep problems and
depression.
Results. The mediating effect of sleep was first tested with the three
psychosocial factors (Optimism, Social Support and Stress) were first test
independently. Then, to test the three psychosocial factors simultaneously with
sleep and depression, multiple regressions and Sobel tests were computed.
Results showed optimism, social support and stress all predicted sleep problems
and depression independently. But, when these variables were combined, only
the interaction between optimism and social support significantly predicted
depression and was mediated by sleep.
Conclusions. Results of the present study illustrated that sleep was a
significant mediator between psychosocial factors and depression. Some of these
variables might interact to produce an effect on mental health of an individual.
What’s more, this study, consistent with previous findings, illustrated that

iii
optimism, social support, stress all affect sleep quality and mental health of
college students. This study does shed light to sleep problem intervention and
schools intended to promote sleep hygiene among college students can also
target on these factors to help reduce the sleep problems that college student
encountered.

iv
Acknowledgements
I am heartily thankful to my supervisor Dr. Wing S. Wong. This thesis
would not have been possible without her guidance and support. I would also
like to show my gratitude to Mr. Barry, K.H. Tam for his valuable advice. Thank
you.

v
City University of Hong Kong
Department of Applied Social Studies
Thesis Submission Declaration Form
Student Name: SING Cheuk Yan
Student No.:
Title of Thesis/Dissertation:
Psychosocial Factors and Depression: The mediating role of sleep
Course Code: *SS4708 / SS5790
Programme: *BSSPSY / PGDP
Supervisor’s Name: Dr. Wing. S. Wong
I have read and understood the following
Section 2.3 of the City University Code of Student Conduct
(http://www.cityu.edu.hk/arro/arro_new/frame_student_discip.htm):
“Students must pursue their studies with academic honesty. Academic honesty is central to the
conduct of academic work. Students are expected to present their own work, give proper
acknowledgement of other's work, and honestly report findings obtained.“
Department’s Statement on Plagiarism.
Thesis/Dissertation Checklist (please tick):
( √ ) This paper is my own individual work.
( √ ) This paper has not been submitted to any other courses.
( √ ) All sources consulted have been acknowledged in the text and are listed in the
reference list, with sufficient documentation to allow their accurate identification.
( √ ) All quotations are enclosed in quotation marks and that the source for each
quotation has an accurate citation.
Signature: Date: 30/ 04/ 2009
*Delete as appropriate.

vi
Table of Contents
Abstract..................................................................................................................... ii
Acknowledgements……………………………………….……………………….
iii
Thesis Submission Declaration Form……………………………………………
iv
Table of Contents………………………………………………………………….
v
List of Tables………………………………………………………………………
vi
List of Figures……………………………………………………………………..
vii
Chapter 1. Introduction and Literature Review……………………………. 1
1.1 Introduction…………………………………………………………….. 1
1.2 Literature Review……………………………………………………….. 2
1.3 Objectives and Hypothesis……………………………………………… 13
Chapter 2. Methodology……………………………………………………… 15
2.1 Research Design…………………………………………………………. 15
2.2 Participants………………………………………………………………. 15
2.3 Instruments………………………………………………………………. 15
2.4 Procedures……………………………………………………………….. 20
2.5 Statistical Analyses………………………………………………………. 21
Chapter 3. Results…………………………………………………………….. 23
3.1 Sample Characteristics………………………………………………… 23
3.2 Reliability, Means and Standard Deviations of Scales…………………. 28
3.3 Scales Scores……………………………………………………………. 30
3.4 Correlations among Study Variables……………………………………. 31
3.5 Sleep Quality and Pattern………………………………………………. 32
3.6 Multicollinearity of Predicting Variables……………………………….. 37
3.7 Univariate Regression of Rick Factors for Depression…………………. 37
3.8 The Mediation Pathways………………………………………………… 38
Chapter 4. Discussion and Conclusions……………………………………… 47
4.1 Discussion……………………………………………………………… 47
4.2 Limitations and Recommendations…………………………………….. 56
4.3 Conclusions……………………………………………………………… 58
References…………………………………………………………………………
59
Appendices…………………………………………………………………………
72
Appendix A The Pittsburgh Sleep Quality Index – Chinese version.............. 72
Appendix B The Perceived Stress Scale – Chinese version............................ 74
Appendix C Life Orientation Test – Chinese version..................................... 76
Appendix D Multidimensional Scale of Perceived Social Support –
Chinese version...........................................................................
77
Appendix E Beck Depression Inventory II – Chinese version....................... 78
Appendix F Questionnaire............................................................................. 82

vii
List of Tables
Table 1. Socio-demographic, Lifestyle Characteristics and Gender differences…… 26 55
Table 2. Scale Scores of PSQI, CLOT, PSS, MSPSS and BDI-II…………………… 28 24
Table 3. Correlation Matrix of PSQI, CLOT, PSS, MSPSS and BDI-II……………. 32
Table 4. Sleep Quality and Pattern of Participants………………………………….. 35
Table 5. Multicollinearity statistics for independent variables……………………… 37
Table 6. Univariate Regression of Risk Factors for Depression……………………. 38
Table 7. Multiple Regressions for the Mediation Pathway…………………………. 41
Table 8. Mediation Analysis for Interaction Effects................................................... 45

viii
List of Figures
Figure 1. The Mediation analysis for Stress, Sleep and Depression Triangle.......... 42
Figure 2. The Mediation analysis for Optimism,
Sleep and Depression Triangle...............................................................
43
Figure 3. The Mediation analysis for the Optimism x Social Support,
Sleep and Depression Triangle.....................................................................
46

1
Chapter 1: Introduction and Literature Review
1.1 Introduction
Sleep is state of rest, individual spend one third of his/ her life sleeping
(Bonn, 2004). The optimal hour of sleep is about seven to nine hours for adults.
Sufficient sleep benefits not only memory, alertness and problem solving but also
the overall health of an individual. However, some people may suffer from
sleeping problems that hinder their daily functioning. According to the World
Health Day (2001), “sleep problems, it means that, having difficulty in going off
to sleep, waking up repeatedly or having difficulty in falling off to sleep if it is
once interrupted.” Evidence showed that increased numbers of college students
encountered sleep problems and reported dissatisfaction in sleep (Jensen, 2003).
College is a critical period for personal growth and advancement. Many of the
college students have to strike a balance between academic demands and
part-time jobs. According to the research result reported by Murphy and Archer
(1996), the most prominent stressors experienced by college students was that
there were too many academic demands but too little time. To meet all the
demands from school and work, college students experience certain amount of
stress that may affect quality of sleep (Hawkins & Shaw, 1992).
Moreover, evidence showed that poor sleep was significantly correlated
with academic performance of college students. For example, in their study of

2
sleeping habits of medical students, Kelly, Kelly and Clanton (2001) revealed
that students who had longer sleep duration reported higher GPAs than those who
had shorter sleep duration.
Therefore, it was shown that poor sleep quality or shorter sleep duration
impaired cognitive functioning and overall health of an individual. With the
increasing numbers of college students being affected and the adverse
consequences it brings, it is worthwhile to investigate factors that affect sleep
quality of college students, so that school-based intervention can target on these
factors and raise the awareness of sleep problem and promote sleep hygiene in
school.
1.2 Literature Review
1.2.1 The Prevalence of Insomnia
Based on the Diagnostic and Statistical Manual of Mental Disorders, Fourth
Edition, people with primary insomnia frequently complain about having
difficulties of initiating or maintaining sleep or having a non-restorative sleep
that lasts for at least one month. The sleep problem should be severe enough to
cause distress which is clinically significant or result in impairment in important
areas of functioning. Also, it neither happens exclusively during the course of
another sleep disorders or mental disorders nor it is resulted from any other direct

3
physiological effects of the use of substance or from a general medical condition.
Insomnia has been studied across different populations. In a longitudinal
study of Finnish adult general population, Hublin et al (2001) found that, among
the 12,423 subjects, 19.3% reported insufficient sleep in 1981 but the figure
increased to 20.6% in 1991. Besides, shorter sleep duration was reported by
79.6% of the sample and 7.6% of them reported at least 1.5 hour less and women
were more likely to report having shorter sleep duration. Another study
conducted in Finland general population, Ohayon and Partinen (2002) found that
11.9% of the sample dissatisfied with their sleep and 37.6% of them reported
having at least one of the insomnia symptoms in which, compared with other
Nordic countries, the prevalence rates of insomnia was 1.5 higher. Groeger et. al.
(2004) carried out a study on the sleep quantity and sleep difficulties among
2,000 nationally representative British adults. It was reported that there were no
gender differences on the average reported sleep. However, 57% of the sample
reported having one or more sleep difficulties and women tended to report more
severe sleep difficulties.
In their cross-sectional study aimed at examining the age differences in
somatic and psychiatric comorbidity, Stewart et al. (2006) revealed that, among
the 8,580 subjects living in private household, 37% of them reported having
insomnia symptoms, 12% reported having a moderate to severe symptoms, 13%

4
reported having insomnia with fatigue and 5% of them fulfilled the DSM-IV
criteria of having primary insomnia. It was also found that, consistent with
previous researches, females were more likely to report having sleep difficulties
Stewart et al. (2006).
The prevalence rates of insomnia have also been investigated in Asian
countries. Li (2002), in his study on the gender differences in insomnia in the
Hong Kong Chinese population, revealed that 11.9% of the sample reported
having insomnia at least three times per week. Consistent with previous findings
in western countries, insomnia was more common in females than males with
14% and 9.3% respectively. In the same year, a study on the prevalence of
insomnia in the South Korea revealed 17% of the 3719 participants reported
having insomnia symptoms at least three nights per week. Also, women were
more vulnerable to insomnia symptoms.
It was believed that not only the adult population, but also the college
student populations suffer from insomnia. Jensen (2003) reviewed past literatures
on sleep problems among college students. It was shown that students
experienced sleep difficulties as well. Dramatic changes of sleep habits among
college students were found. The average sleep hours decreased from 7.3 hours
to 6.87 hours in the ten years within 1979-1989. Also, the number of students
reported having sleep problems increased from 26.7% to 68.3% in 1982-1992.
5
Similar studies have also been reported in 2001, Buboltz et al., (2001)
investigated sleep habits and patterns among college students. It was reported
that among 191 undergraduate students, 75% of them suffer sleep problems
occasionally and 15% of them reported having poor sleep quality. Also, females
significantly reported more sleep problems than males. 18% of males and 30% of
females reported suffering from some forms of insomnia within 3 months
preceding the study. Generally, females were more likely to report having greater
difficulties in falling asleep, disturbed night sleep, frequent nocturnal awakening
and on the whole, poorer sleep quality.
Besides, in their study on sleep patterns in college sample, Tsai and Li
(2004) reported sleep problems were more likely to happen in weekdays in
which students spent significantly less time in bed, slept shorter, had less total
sleep, longer sleep latency and lower sleep efficacy and reported significantly
lower sleep quality. Consistent with previous findings, females reported
significantly more sleep problems than males.
1.2.2 The Impact of Insomnia on mental health
Insomnia has been found to correlate with the development of physical and
mental health problems, as well as subjective satisfaction towards life. In their
study of the relationship between sleep disturbances and depression, Cukrowicz

6
et al. (2006) found that, people suffered from sleep problems showed a higher
depression rates compared to those who have no sleeping problems. Another
longitudinal study reported a similar result, revealing that, compared with others,
those who received a diagnosis of insomnia at the baseline level were in greater
risk of developing depression at the 1 year later follow-up study (Ford et al, 1989)
and the risk was even 40 times greater when insomnia was present at both
interviews. In their 12- month prospective study of their adolescent sample,
Robert et al. (2008) reported that chronic insomnia resulted in poor outcomes
across different aspects, including the interpersonal, somatic and psychological
functioning of an individual.
Furthermore, Goldstein, Bridge and Brent (2008) carried out a study
comparing adolescent suicide completers and the community control adolescents.
It was found that those who had committed suicide had a higher rate of sleep
disturbance than that of the control group both the week preceding death and in
the current depressive episode. They also reported higher scores in depressive
severity. Therefore, it was suggested that insomnia may increase suicide risk. In
their review article of the impact of insomnia on psychological and medical
health, Taylor et al. (2003) identified that insomniacs were more likely to
develop depression, anxiety disorders and psychiatric disorders or psychic
distress. Standing at the same point with Brent’s study, it was found that

7
insomniacs were three times more likely to have committed suicide.
Although some insomniacs may try medication to solve their sleep problems,
there were strong evidences suggesting that sleeping pill use was a significant
predictor of mortality (Taylor, 2003).
Besides, insomnia can impair immune functioning (Taylor, 2003). People
with disturbed sleep and depressed individual with disturbed sleep had a lower
level of natural killer cell (NK) activity and NK count, resulted in poorer
immune functioning.
1.2.3 Factors predicting Insomnia
As mentioned in the last paragraph, the impact of sleep on health can be
tremendous, leading to problems in physical health or even associated with
serious mental illnesses such as depression and suicide. Therefore, it is
worthwhile to study the factors predicting insomnia and how they interact to
affect sleep quality and mental status of an individual.
Optimism
Optimism is defined as an individual’s generalized expectancies about the
future, people who are optimistic often expect good things rather than bad things
happen on them (Scheier & Carver, 1985). Optimism has been reported to have

8
its predictive power to both psychological and physical well-being in human. For
example, in their study of examining the role of personality in predicting
psychological and physical health among grandmothers, Francine et al. (2008)
found that optimistic grandmothers reported fewer psychological health
problems such as depression and hostility and sleep disorders. On the other hand,
those who were less optimistic reported significantly more sleep problems and
had a higher rate of hypertension and obsessive compulsive symptoms. It was
suggested that less optimistic grandmothers were deficient in positive
expectations about the future and as a result they inclined to worry in which
leading to sleep problems.
In a similar study of affective personality, Norlander et al. (2005) revealed
that those who have higher positive affect and low negative affect reported the
better sleep quality, lower anxiety, lower depression and more optimistic.
Moreover, it was found that those who reported higher positive affectivity and
were more energetic also experienced less stress. Therefore, it was suggested that
sleep quality, energy and optimism are inter-correlated. Individuals exhibit high
positive affectivity, optimism and energy may develop coping strategies for
mastering stressful situations and therefore achieving a better sleep.
Although evidence above showed that optimism was consistently correlated
with sleep, the effects of optimism on sleep were not the fundamental aim of the

9
studies. Rather, they were the peripheral products. To my best knowledge, there
was no study explore the direct relationship between optimism and sleep. So, the
current study aimed at filling the gap.
Social Support
Social support is defined as an information from parents, friends or
significant others that one is loved, valued and cared for. It can be divided into
many forms such as tangible assistance, informational support and emotional
support (Taylor, 2008). There were just a few studies examined the direct
relationship between social support and insomnia. For example, Nordin and
Knutsson (2005) reported that people with lower social network and emotional
support were more likely to report poor sleep, indicating social support was a
buffer in sleep problems. Similarly, in a study of a sample of Japanese daytime
workers, Nakata et al. (2004) revealed that high intra-group conflicts, low
employment opportunities, low co-worker support and high job dissatisfaction
and high depressive symptoms were significantly correlated with insomnia,
showing that good human relationships might help preventing the development
of sleep problems in the workplace.
There was another study that pointed out the importance of social support
on health. Chandola et al. (2007), in their study of the effect of reciprocal
relationship on health, revealed that, failed reciprocity, that is, the imbalance

10
between the effort given and the reward return, was related to poorer health of an
individual. It was reported that the higher the levels of non-reciprocity, the higher
levels of sleep problems, depression and lower level of physical and mental
health. It was believed that the strong emotions and stress reaction that elicited
by failed reciprocity may affect individual’s health. Despite the fact that social
support was found to be correlated with sleep as indicated in the above studies,
there was evidence showing that social support has no direct effect on sleep
quality. In their study of the quality of sleep in caregiver population, Brummett et
al. (2006) revealed that social support was not directly related to sleep quality,
instead, it possessed a mediating role in which it interacts with negative affect to
influence on the caregiver’s sleep quality.
However, in a study of sleep disturbances among HIV-positive adults,
Vosvick et al. (2004) found that the relationship between social support and sleep
problem was rather complex. An increase social support did not guarantee a
decrease in sleep problems because both the types and sources of social support
were the important dimensions to be considered. So, it can be concluded that,
social support influenced sleep quality, but whether the effect is direct or indirect
was still unknown. Thus, this study aimed to find out the effect of social support
on sleep.
Stress

11
Stress is defined as a negative emotional experience. It is accompanied by
physiological, biological, cognitive and behavioral changes in an individual
(Baum, 1990). Stress has always been reported to be correlated with insomnia. In
his study of a sample of workers, Linton (2004) found that poor psychosocial
work environment is the risk factor of sleep problems. The possible reason for
this was that stress at work causes disruptions in an individual in which form a
vicious circle between work and sleep (Linton, 2004). Vela-Bueno et al. (2008)
also examined the relationship between sleep quality and burnout levels of
primary physicians. They found that burnout level was strongly related with all
the insomnia symptoms including difficulties falling asleep, early awakening, etc.
in which the high burnout group reported significantly higher prevalence of
insomnia. It was suggested that the high burnouts person have difficulties
relaxing after work, they may also extensively worry about their sleep and the
consequences for not getting enough sleep in which they are always in a
hyperactive state, result in the activation of the HPA axis, increasing the allostatic
load, again, forming a vicious circle between stress and insomnia. Another study
of a sample of clinical patients also reported that, work-school stress, family and
health were the precipitating factors of insomnia (Bastien et al., 2004).
1.2.4 Implications from the literature review
The above studies suggested that optimism, social support and stress

12
predicted sleep problem exclusively. However, a great deal of research showed
that the three variables were inter-correlated.
In a preliminary study within palliative setting, Hulbert and Morrison (2006)
surveyed 36 professional caregivers and volunteers. It was found that optimism
was strongly correlated with higher levels of social support and lower levels of
perceived stress. In their study of the role of personal and social resources in
preventing adverse health outcomes among 330 uniformed professions,
Oginska-bulik (2005) revealed that social support had a direct impact on
perceived stress in workplace. Also, it was found that people with high level of
optimism, self-efficacy and self-esteem reported significantly lower level of
perceived stress. Yali and Lobel (2002), in their study of stress-resistance
resources and coping among 163 pregnant women, also found that increased
level of optimism was associated with lower level of distress, optimists also
made less used of avoidance coping strategies. On the other hand, they found that
social support was associated with higher levels of distress and greater use of
avoidance and preparation coping.
It can be concluded that, optimism consistently predicted lower level of
stress and higher level of social support. But the effect of social support on stress
remained unclear. It was still unclear whether social support is exerting a
moderating or mediating effect on stress. Nevertheless, evidence showed that

13
these three variables were inter-correlated and they might interact to exert an
effect on health. Therefore, in this study, it was hypothesized that these three
variables may interact to affect sleep quality and mental health of an individual.
1.3 Objectives and Hypothesis
Studies consistently showed that optimism, social support and stress were
related to sleep. However, to my best knowledge, there were no studies examined
the impact of these three variables on sleep simultaneously among Chinese
college student samples. Thus, the first objective of this study was to investigate
the effects of psychosocial factors (optimism, social support and stress) on sleep.
Moreover, as sleep was always reported to have correlated with depression.
Therefore, it is believed variables that predicted sleep problems may also help in
predicting depression. So, the second objective of the current study was to
examine the relationship among the psychosocial factors, sleep and depression.
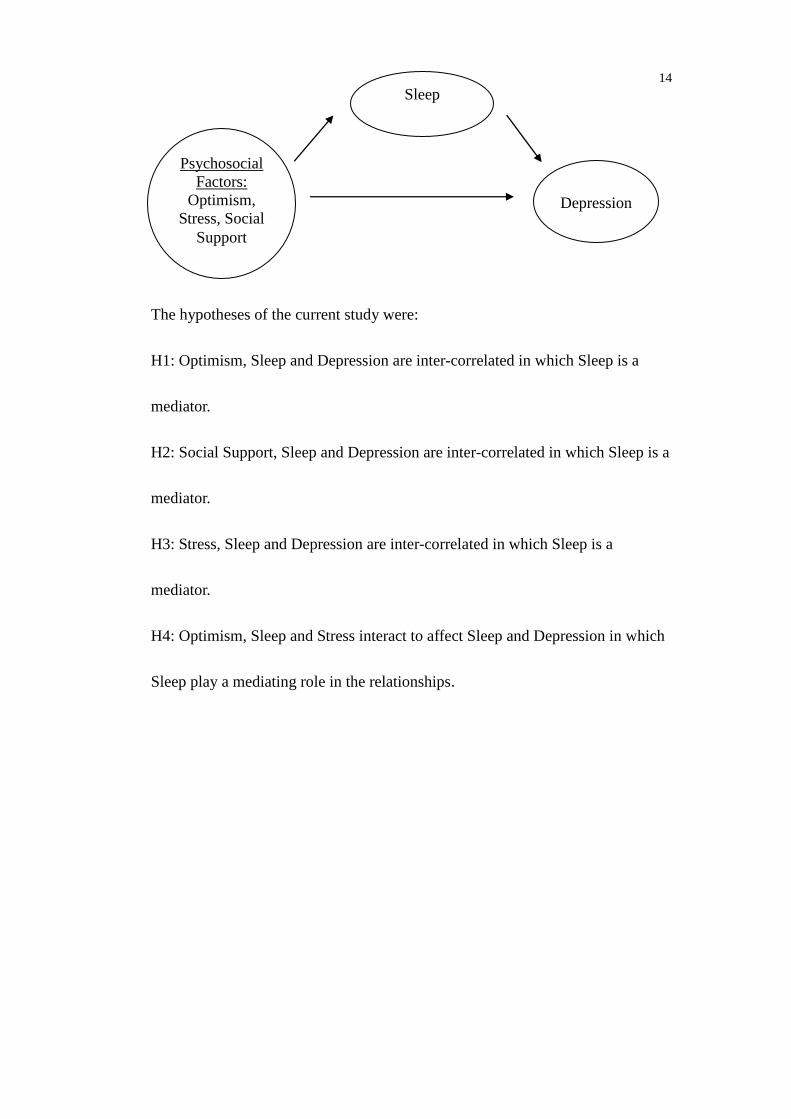
On the basis of the theoretical perspectives and previous findings, the
following model was proposed:
14
The hypotheses of the current study were:
H1: Optimism, Sleep and Depression are inter-correlated in which Sleep is a
mediator.
H2: Social Support, Sleep and Depression are inter-correlated in which Sleep is a
mediator.
H3: Stress, Sleep and Depression are inter-correlated in which Sleep is a
mediator.
H4: Optimism, Sleep and Stress interact to affect Sleep and Depression in which
Sleep play a mediating role in the relationships.
Psychosocial
Factors:
Optimism,
Stress, Social
Support
Depression
Sleep

15
Chapter 2: Methodology
2.1 Research Design
The research design in this study was a cross-sectional one. A
cross-sectional design was chosen because the aim of this study, as noted in the
last section, was to explore the mediating role of sleep among the psychosocial
factors and its relation to depression. Therefore, as an exploring study, a
cross-sectional, correlation design was adopted. Also, a cross-sectional reached a
relatively large sample within a short period of time in which it ensured the
sample size and the generalizability of the study.
2.2 Participants
Participants were a sample of 529 undergraduates aged 18 or above. They
were chosen because there were substantial evidence showing that increased
numbers of college students are suffering from sleep problems. So, I believed
that there was a need to address the problem.
2.3 Instruments
2.3.1 Independent variables
Insomnia.
Insomnia was measured by the Pittsburgh Sleep Quality Index (PSQI).

16
PSQI was a self-report instrument that measures the quality and patterns of sleep
of an individual. It measured an individual’s sleep on seven areas, the subjective
sleep quality, sleep latency, sleep duration, habitual sleep efficiency, sleep
disturbances, the use of sleeping medication and the daytime dysfunction, in the
previous month. Respondents scored on a 4-point Likert Scale (0=Not during the
past month; 3=Three or more times a week) to indicate how much they agreed on
the statement. The total PSQI score ranged from 0-21, with a global sum of 5 or
greater indicating poor sleep quality (Smyth, 2007). The PSQI has been
psychometrically validated, obtaining acceptable internal consistency, validity
and test-retest reliability among either sleep-disorder patients or healthy subjects
(Tsai, 2005). It was also translated into Chinese (CPSQI). The CPSQI also
obtained a reliability ranged from 0.82 to 0.83 for all subjects and 0.75 for those
who have primary insomnia. Moreover, it was found to be correlated with sleep
quality VAS and some other sleep parameters such as SOL and SE, indicating an
acceptable validity.
Stress.
The Perceived Stress Scale (PSS) was used to measure stress levels of an
individual. The PSS was a self-administered tool designed by Cohen et al. in
1983 and targeted at the community sample (Taylor-Piliae et al., 2006). It was a

17
5-point Likert Scale (0=Never; 4=Very Often) in which higher scores indicate
more perceived stress. The PSS obtained satisfactory reliability (α= 0.89),
test-retest reliability (α = 0.85) and validity. The Chinese version of PSS obtained
a high internal consistency with α = 0.90 in a nurses sample (Lee & Crockett,
1994). Chen et al. (2000) also reported high test-retest and construct validity of
the Chinese version of PSS among Chinese women.
Optimism.
The Life Orientation Test Revised (Scheier and Carver, 1985) was a
self-reported scale assessing dispositional optimism. It was used to assess the
levels of positive outcome expectancies of an individual. It was later revised in
1994, higher reliability and validity was obtained in the revised version of LOT
(LOT-R) (Scheier, Carver, & Bridges, 1994). The Chinese version of LOT
(CLOT-R) consisted of 6 items with a test response of 5-point Likert Scale
(1=Strongly Disagree; 5= Strongly Agree). Higher mean score indicates higher
level of optimism perceived. A Cronbach’s alpha of 0.76 and a test-retest
correlation of 0.79 over a 4-week period was reported (Scheier & Carver,1985) .
In his study of a Hong Kong Chinese Undergraduates and Working adult sample,
Lai (1997) also obtained a Cronbach’s alpha value of 0.69, indicating a
satisfactory reliability of the CLOT-R.

18
Social Support.
The Multidimensional Scale of Perceived Social Support (MSPSS) was a
self-administered, subjective assessment of an individual’s social support
adequacy. It was a 7-point Likert scale (1=strongly disagree; 7=strongly agree),
consisted of 12 items, measuring individual’s social support from three different
subscales, family, friends and significant others. MSPSS has been
psychometrically validated, obtaining high internal consistency (α = 0.88) and
validity. In a sample of Hong Kong Chinese, Chou (2000) found that the Chinese
version MSPSS (MSPSS-C) obtained an internal consistency reliability of 0.89.
Also, construct validity was established by an inverse correlation with depression
and anxiety subscales from the General Health Questionnaire (GHQ). Moreover,
it was found that the family and friends subscales of the MSPSS-C were
positively correlated with the Lubben Social Network Scale, indicating a high
validity of the scale.
2.3.2 Dependent variable
Depression.
The Beck Depression Inventory-II was a self-reported, 4-point Likert scale
measure composed of 21 items which was developed for assessing depressive
symptoms severity (Beck, Steer, & Garbin, 1988). The severity of the depressive

19
symptoms were classified into three categories based on three cut-off values: a
total scores of 0-12 indicated minimal depression; 13-18 indicated mild
depression; 19-28 indicated moderate depression and 29-63 indicated severe
depression. The English version of BDI-II has been psychometrically validated
with psychiatric and also healthy adults. It has also been translated into different
languages including the Chinese. The Chinese version of BDI (C-BDI) was
translated by Chan and Tsoi in 1984. It was found that the C-BDI has a high
internal consistency (α = 0.86). Similar result (α = 0.85) was found in Chan’s
study comparing the psychometric properties of the Chinese and the English
versions of the BDI. Correlations with other psychological measures were also
found to be significant, showing that the C-BDI has a high validity.
Shek (1987) revealed that the Chinese BDI was correlated with the Leeds
Scales for Self-Assessment of Depression (Leeds-D) and it was strongly
correlated with the subscales of depression of the Chinese General Health
Questionnaire (GHQ-30). Chan (1991) also validated the C-BDI with other
psychological measures such as CES-D scale and the SDS scale and their
correlation coefficient were 0.73 and 0.75 respectively. It can be seen that the
C-BDI have been satisfactorily validated.

20
2.4 Procedure
One third of the participants (31.8%) were recruited from a Psychology
course in a University in Hong Kong. Questionnaires were distributed during
lessons and collected immediately at the end of lessons. Classroom data
collection guaranteed the response rate and the major advantage of this method
was to ensure that all participants understand what was being asked in the
questionnaire since assistance was given by interviewer whenever needed.
The remaining 68.2% of participants were recruited through snowballing
method. A snowball sampling method was a research technique that used to
develop a research sample. As its name implied, this technique relies the existing
participants recruit future subjects and these future subjects are mainly their
acquaintances, thus, the sample group appears to grow like a rolling snowball
(Goodman, 1961). The snowballing method was adopted because it was cost
effective as it can reach a relatively large number of participants at the same time
and also it can ensure the diversity of the target group in which eliminating the
potential bias from recruiting participants from only one single psychology
course at the University. Also, the questionnaire was an anonymous one, in
which guaranteed confidentiality of participants.
21
2.5 Statistical Analyses
Descriptive statistics were computed to assess socio-demographic and
lifestyle characteristics of the sample. Reliabilities of scales were also calculated.
Besides, sleep quality and pattern of the current sample was also reported.
Chi-square tests and t-tests were used to examine gender differences.
Multicollinearity of the predicted variables (Optimism, Social Support, Stress
and Sleep) was also tested in order to ensure that the independence of the
predicting variables, otherwise, the estimate of the impact of the predicting
variables would be less precise. The dependent variable, Depression, was also
regressed independently on all the socio-demographic and lifestyle
characteristics of the sample in order to test whether it is necessary to be
controlled in later mediation analysis.
According to the four criteria of establishing mediation suggested by Baron
and Kenny (1986), firstly, the independent variable must influence the mediator;
secondly, the independent variable should also have an effect on the dependent
variable; thirdly, the mediator should have influences on the dependent variable
and finally, after controlling the mediator, the effect of the independent variable
on the dependent variable must have been changed.
To test the proposed mediation path, therefore, depression was first
regressed on each of the psychosocial factors, optimism, social support and stress,

22
separately. Secondly, it was regressed on sleep. Then, Sleep was regressed on
each of the three psychosocial factors respectively. For each of the mediation
path, the fourth regression equation was computed by controlling the mediator
and regress the dependent variable on the independent variable. In testing the
interaction effects, similar procedures were computed unless the psychosocial
factors were combined rather than in isolation.
After the four multiple regressions were computed, the Sobel tests were
carried out, if the four criteria for a mediation analysis were all fulfilled, to test
for the significances of the reduction in effect of the mediation pathways.
All of the analyses were computed using SPSS version 15.0.

23
Chapter 3: Results
3.1 Sample characteristics
3.1.1 Socio-demographic and lifestyle characteristic of the entire sample
Table 1 shows the socio-demographic characteristics of the sample in
current study. There were 529 participants in the study, composed of 240 (45.4%)
males and 287 (54.3%) females. The mean age of participants was 21.01 years
old, with a standard deviation of 1.77. The sample composed of 414 (78.3%)
undergraduates, while 112 (21.2%) of them were junior college students
including those who were studying Associate Degree and Higher Diploma.
In the entire sample, the majority of them (n= 453, 86%) have never smoked
while about one-fourth (n = 204, 38.6%) of them have never consumed alcohol
and a large proportion of them (n= 425, 79.6%) have engaged in exercise in the 3
months prior to the study.
3.1.2 Gender differences in socio-demographic and lifestyle characteristics
As shown in Table 1, females were significantly more educated (χ² = 18.35,
p< 0.05). Besides, gender differences were found significant (p <0.05) among all
lifestyle characteristics.
For the smoking habits, 190 (79.2%) males reported that they had never

24
smoked, 30 (12.5%) of them have quit smoking, 9 (3.8%) were now smoking but
tried to quit before, 3 (1.2%) were now smoking and trying to quit and finally, 8
(3.3%) reported they were currently smoking and had never tried to quit. In
contrast, a large majority of females reported not having smoking habits with 261
(90.9%) had never smoked, 18 (6.35) were now smoking but tried to quit before,
3 (1%) have quit smoking, 1 (0.3%) were now smoking and trying to quit and 4
(1.4%) were currently smoking and had never tried to quit. Gender differences
were found to be significant in which male reported significantly more smoking
habits (χ² = 15.44, p <0.05).
For alcohol consumptions, 40.4% of males reported having alcohol
consumptions on a regular basis which was nearly two fold of that of the females
as only 20.6% females have consumed alcohol on a regular basis. Gender
differences were, again, found to be significant in which male reported
significantly more alcohol consumption (χ² = 45.16, p <0.05).
Males were also found to be having more exercises than females. Only 25
(10.7%) of males reported not having any exercises within the 3 months prior to
the study, however, the figure for females was 79 (28.8%). Gender differences
were also found to be significant in which male reported significantly having
more exercise (χ² = 74.96, p <0.05).
In conclusion, compared with females, males were more likely to have

25
smoking habits, higher alcohol consumptions and having more exercises.

26
Table 1.
Socio-demographic, Lifestyle Characteristics and Gender differences
Socio-demographic characteristics Entire Sample Gender Test of
Difference
Male (n = 240) Female (n= 287)
n % n % n %
Sex
Male
Female
240
287
45.4
54.3
Age
Mean
SD
21.01
1.77
21.05
1.42
20.96
2.03
0.578
Education
Junior College
College
112
414
21.2
78.3
71
168
29.6
70
41
245
14.3
85.4
18.35*
Lifestyle Characteristics
Smoking habit
Never smoked
Quit smoking
Smoking, tried to quit
Smoking, trying to quit
Smoking, never quit
453
48
12
4
12
85.6
9.1
2.3
.8
2.3
190
30
9
3
8
79.2
12.5
3.8
1.2
3.3
261
18
3
1
4
90.9
6.3
1.0
0.3
1.4
15.44*
(Continue)

27
Note: Table was reported in percentage unless specified; n = no. of participants; % = percentage; SD = standard deviation; student’s t- test was used for comparison of age
by gender, others by chi-square. *P <.05.
Lifestyle Characteristics
Entire Sample
Gender
Test of
Difference
Male (n = 240) Female (n= 287)
n % n % n %
Alcohol consumption
Never
Less than once a month
1 – 3 times a month
Once a week
2 – 3 times a week
4 – 6 times a week
Daily
Others
204
169
101
21
20
4
4
6
38.6
31.9
19.1
4.0
3.8
.8
.8
1.1
60
83
63
11
12
4
4
3
25
34.6
26.2
4.6
5
1.7
1.7
1.2
143
85
38
10
8
0
0
3
49.8
29.6
13.2
3.5
2.8
0
0
1
45.16*
Exercising habit
Never
Less than once a month
1 – 3 times a month
1 – 2 times a week
3 – 5 times a week
Daily
104
129
136
89
39
12
20.4
25.3
26.7
17.5
7.7
2.4
25
44
61
62
31
11
10.7
18.8
26.1
26.5
13.2
4.7
79
84
75
27
8
1
28.8
30.7
27.4
9.9
2.9
0.4
74.96*

28
3.2 Reliability, means and standard deviations of scales
The reliabilities, means, standard deviations and gender differences of the
scales scores were shown in Table 2. The Chinese version of the Life Orientation
Test (CLOT), the Perceived Stress Scale (PSS), the Multidimensional Scale of
Perceived Social Support (MSPSS), and the Beck Depression Inventory – II
(BDI-II) showed relatively high reliability with Cronbach’s alpha of 0.78, 0.79,
0.91 and 0.90 respectively while the Pittsburgh Sleep Quality Index (PSQI)
showed acceptable reliability (α = 0.60).
Table 2.
Scale scores of PSQI, CLOT, PSS, MSPSS and BDI-II
Scales
α
Score
Range
Entire
Sample
(n= 529)
Gender
t
Male
(n= 240)
Female
(n= 287)
M SD M SD M SD
PSQI
global
score
0.60
0 – 21
6.01
2.78
5.85
2.79
6.13
2.76
-1.12
CLOT 0.78 0 – 24 13.41 3.78 13.10 3.70 13.72 3.79 -1.92
PSS 0.79 0 – 40 19.81 4.42 19.11 4.57 20.35 4.20 -3.24
MSPSS
SO
Family
Friends
Total
0.88
0.89
0.90
0.91
4 – 20
4 – 20
4 – 20
12 – 60
14.96
13.06
15.01
43.02
3.10
3.36
3.11
7.87
14.05
12.65
14.09
40.79
3.13
3.35
3.29
8.03
15.74
13.41
15.78
44.93
2.85
3.34
2.73
7.21
-6.47*
-2.59
-6.47*
-6.24
BDI – II 0.90 0 – 63 9.94 8.54 10.51 9.18 9.40 7.92 1.49
Note: PSQI = The Pittsburgh Sleep Quality Index; CLOT = Life Orientation Test-Chinese version;
PSS = Perceived Stress Scale; MSPSS = Multidimensional Scales of Perceived Social Support;
BDI-II = Beck Depression Inventory; M = mean; SD = standard deviation; SO = Significant
Others; α = Cronbach’s alpha; t = student’s t-test. *p <.05
The reliability coefficients of the Multidimensional Scale of Perceived

29
Social Support (MSPSS) and the Beck Depression Inventory (BDI) in the present
study were consistent with previous findings. However, the reliability of the Life
Orientation Test (LOT) in the current study was relatively higher compared with
previous study. The plausible reason was that the sample in Lai’s study (1997)
was composed of both undergraduates and working adults, but, the current study
composed of only college students which may account for the differences. The
reliability of the Perceived Stress Scale (PSS) was 0.79 in the current study,
which, compared with Lee and Crockett’s study (1994), was relatively lower.
However, as their study was based on a nurse sample, due to the differences
between the sample populations, it was possible that different reliability
coefficients might be obtained.
The reliability of the Pittsburgh Sleep Quality Index (PSQI) was 0.60 in the
current study, compared with previous studies, it was relatively lower. However,
as Tsai et al.’s study (2005) was based on those Chinese subjects who attended to
the general practitioner clinic and psychiatric clinic, there was a potential that the
subjects might experiencing mental disorder or physical problems that may
account for the differences.
Despite the differences in the reliability coefficients between the current and
the previous studies, the reliability coefficients of the measurements used in the
present study ranged from 0.60 to 0.91, indicated that the measurements used

30
were reliable within the context of Chinese college student population.
3.3 Scale scores
3.3.1 Scale scores of the entire sample
As shown in Table 2, participants in the current study were poor sleepers
(M= 6.01; SD= 2.78) according to the cut-off value of 5. Compared with Carney,
Edinger, Meyer and Lindman’s study (2006), the current sample reported
relatively more sleep problems. The mean score of the CLOT was 13.41 (SD=
3.78), revealing that participants had a moderate level of optimism. The current
sample also reported an average score of 19.81 (SD= 4.42) in the Perceived
Stress Scale which was relatively lower compared with the college student
sample in Cohen’s study (1983). However, Cohen’s study was based on a sample
of college students who were the freshman at the University, this difference in
the sample characteristic might account for the differences in mean scale score of
the PSS. The average score of the Multidimensional Scale of Perceived Social
Support (MSPSS) was 43.02 (SD= 7.87), indicating the sample had a satisfactory
level of perceived social support. Finally, the mean score of the Beck Depression
Inventory was 9.97 (SD= 8.54), according to the cut-off value, the current
sample reported minimal depression. Again, compared with Carney, Edinger,
Meyer and Lindman’s study (2006), the current sample revealed relatively fewer

31
depressive symptoms.
3.3.2 Gender differences in scale scores
Among all the scales, females reported higher mean scores on PSQI, C-LOT,
PSS, MSPSS and lower mean score in BDI-II than males, however, the
differences were not statistically significant. Only the Significant Others and the
Friends subscales of the MSPSS showed statistically significant gender
differences in which females reported significantly greater support from both
significant others and friends in which both have a t-value of -6.47 (p <0.05).
3.4 Correlations among study variables
Table 3 shows the correlation matrix of the five scales. It can be seen that
sleep was found to be positively correlated with both stress and depression (r =
0.32; r = 0.31) Furthermore, it was negatively correlated with optimism (r = -
0.22) and social support (r = -0.09). Besides, optimism was also positively
correlated with social support (r = 0.36) and negatively correlated with stress (r =
-0.55) and depression (r = -0.44). Both social support and depression were
reported to have correlation with stress, with r ranged from -0.22 to 0.53. Finally,
social support was found to be negatively correlated with depression where r =
-0.37.

32
All of the correlations above were statistically significant (p < 0.05).
Although sleep was found to be significantly correlated with the other scales, the
Pearson correlation coefficients were small indicating that the correlations were
week.
Table 3.
Correlation Matrix of PSQI, CLOT, PSS, MSPSS and BDI – II
Note: PSQI = The Pittsburgh Sleep Quality Index, C-LOT = Life Orientation Test-Chinese
version, PSS = Perceived Stress Scale, MSPSS = Multidimensional Scales of Perceived Social
Support, BDI-II = Beck Depression Inventory; *p< .05; ** p <.01.
3.5 Sleep quality and pattern
3.5.1 Sleep quality and pattern of the entire sample
As shown in Table 4, the mean global score was 6.01 with a standard
deviation of 2.78. According to the cut-off value of the PSQI, a global score
equal to or greater than 5 indicates poor sleep quality, therefore, revealing that
participants in the current study were generally bad sleepers. Descriptive
statistics of the PSQI components were also reported. As shown, 60.2% of the
Scales 1 2 3 4 5
1. PSQI _
2. C-LOT -0.22** _
3. PSS 0.32** -0.55** _
4. MSPSS -0.09** 0.36** -0.22** _
5. BDI – II 0.31** -0.44** 0.53** -0.37** _

33
participants reported having excellent to good subjective sleep quality while
39.8% of them had a bad or poor one.
For sleep latency, the majority of them (81.2%) reported having sleep
latency of less than 30 minutes, 14.6% have a sleep latency ranged from 31-60
minutes and 4.2% of them even had sleep latency over one hour. Results also
illustrated that, participants normally slept more than 6 hours with 21.9% of them
reported having 6-7 hours of sleep and 56% having sleep duration more than 7
hours. Some of the participants (12.5%) sleep only 5-6 hours a day and a small
portion of them (6.6%) sleep less than 5 hours. Sleep efficiency among
participants were fairly good in which 456 of them having a sleep efficiency over
75%, 71 reported having a moderate sleep efficiency ranged from 65-74% and
only 2 of them have sleep efficiency less than 65%.
About 86.2% of the sample revealed having no or less than once a week
difficulties in falling/ staying asleep whereas 13.8% 1-2 times or more than 3
times a week. Nearly all of the participants (97.5%) reported they had never or
less than once a week to use sleeping medication and only 2.5% of them had use
medication. Within those who had used medication, 1.7% of them used time 1-2
times a week and 0.8% of them used more than 3 times per week. Finally, 7.4%
of the sample reported having no daytime dysfunction at all. However, 92.6%
reported having at least one occasion of daytime dysfunction in which 47.3%

34
experienced a daytime dysfunction less than once per week, 36.5% experienced
1-2 times a week and 8.9% of them experienced more than 3 times a week.
3.5.2 Gender differences in sleep quality and pattern
Chi square tests were adopted to examine if there were any gender
differences. The differences of all the PSQI components were not statistically
significant except the use of sleeping pills. As shown in Table 4, males
significantly reported having more use of medication than females with a
χ²-value = -18.08 (p < 0.05).

35
Table 4.
Sleep Quality and Pattern of Participants
PSQI Components Entire Sample
(n= 529)
Gender Test of
difference
Male
(n = 240)
Female
(n= 287)
Subjective Sleep Quality M, (SD)
Excellent
Good
Bad
Poor
1.34 (0.75)
11.2
49
33.8
5.9
1.30 (0.79)
15.1
45.6
33.9
5.4
1.37 (0.71)
8
52.3
34.1
5.6
6.96
Sleep Latency M, (SD)
Less than 15 minutes
16 – 30 minutes
31 – 60 minutes
More than 60 minutes
0.93 (0.78)
30.2
51
14.6
4.2
0.87 (0.76)
32.1
52.5
11.7
3.8
0.97 (0.80)
28.6
50.2
16.7
4.5
3.18
Sleep Duration M, (SD)
More than 7 hours
6 – 7 hours
5 – 6 hours
Less than 5 hours
0.67 (0.93)
56
21.9
12.5
6.6
0.66 (0.95)
60
21.7
10.4
7.9
0.67 (0.92)
58.5
22
13.9
5.6
2.45
Sleep Efficiency M, (SD)
More than 85%
75 – 84%
65 – 74%
Less than 65%
0.40 (0.81)
9.3
76.9
13.4
0.4
0.34 (0.80)
81
8.9
5.1
5.1
0.44 (0.82)
72.8
14.5
8.5
4.2
6.93
(Continue)

36
PSQI Components Entire Sample
(n= 529)
Gender Test of
difference Male
(n = 240)
Female
(n= 287)
Difficulties falling/ Staying asleep M, (SD)
Never
<1 per week
1 – 2 times per week
>3 per week
1.05 (0.49)
9.3
76.9
13.4
0.4
1.0 (0.51)
12.1
75.8
11.7
0.4
1.08 (0.47)
7
78
14.6
0.3
4.64
Use of Sleeping Medication
Never
<1 per week
1 – 2 times per week
>3 per week
0.17 (0.47)
86.2
11.3
1.7
0.8
0.25 (0.54)
79.6
17.5
1.7
1.2
0.11 (0.39)
91.6
6.3
1.7
0.3
18.08*
Daytime Dysfunction M, (SD)
Never
<1 per week
1 – 2 times per week
>3 per week
1.47 (0.76)
7.4
47.3
36.5
8.9
1.44 (0.78)
7.9
50
32.1
10
1.49 (0.74)
7
45.3
39.7
8
3.45
Global Score M, (SD)
Good Sleepers
Bad Sleepers
6.01 (2.78)
31.4
68.6
5.85 (2.79)
32.5
67.5
6.13 (2.76)
30.7
69.3
-1.12
Note: Table was reported in percentage unless specified; Subjective sleep quality = item 9; Sleep latency = item2 (<15min=0; 16-30 min=1; 31-60 min=2, >60 min=3) +
item5a (Sum : 0=0; 1-2=1; 3-4=2; 5-6=3); Sleep duration = item 4 (>7=0; 6-7=1; 5-6=2; <5=3); Sleep efficiency = item 4 / (item 3- item 1) *100 (>85%=0, 75%-84%=1,
65%-74%=2, <65%=3); Difficulties falling asleep = sum of item 5b – 5j (0=0; 1-9=1; 10-18=2; 19-27=3); Use of sleeping medication = item 6; Daytime dysfunction = item 7
+ item 8 (0=0; 1-2=1; 3-4=2; 5-6=3); Global score = sum of all components; Good sleepers = global score < 5; Bad sleepers = global score ≥ 5; n = no. of participants; M =
mean; SD = standard deviation; Chi-square was used to test of differences; *p <.05.

37
3.6 Multcollinearity of predicting variables
Before examining the mediation effects, collinearity of the predicting
variables were tested. It was important to examine whether the predicting
variables were inter-correlated, it was because if the variables were highly
correlated, it would greatly affected the predicting value of an individual
predictor (Brien & Robert, 2007). The multicollinearity statistics were reported
in Table 5. As illustrated in the table, the tolerance value ranged from 0.64 – 0.89
while the Variance inflation factor (VIF) ranged from 1.12 – 1.57 in which all of
them were lower than the cut-off values suggested by Kutner et al. (2004),
indicating that the problem of collinearity was not a concern.
Table 5.
Multicollinearity statistics for independent variables
Variables Tolerance VIF
PSQI 0.89 1.12
C-LOT 0.64 1.57
PSS 0.65 1.53
MSPSS 0.87 1.15
Note: PSQI = The Pittsburgh Sleep Quality Index; CLOT = Life Orientation Test-Chinese version;
PSS = Perceived Stress Scale; MSPSS = Multidimensional Scales of Perceived Social Support;
BDI-II = Beck Depression Inventory – II. VIF = Variance Inflation Factor.
3.7 Univariate Regression of risk factor for Depression
To determine whether the socio-demographic and lifestyle characteristics

38
should be controlled in the mediation analysis, the univariate regressions were
computed. As illustrated in Table 6, only smoking habits (β = 0.125, p < 0.05)
and alcohol consumption (β = 0.190, p <0.01) could significantly predicted
depression. Therefore, in subsequent mediation analysis, smoking habits and
alcohol consumption would be controlled.
Table 6.
Univariate Regression of Risk Factors for Depression
Variables Std β SE 95 % CI p -
value
Socio-demographic
characteristics
Sex -0.065 0.745 -2.575, 0.353 ns
Age 0.022 0.212 -0.311, 0.524 ns
Education -0.066 0.892 -3.096, 0.409 ns
GPA 0.035 1.801 -2.812, 4.311 ns
Lifestyle characteristics
Smoking habit 0.125 0.497 0.462, 2.415 < 0.05
Alcohol
consumption
0.190 0.274 0.680, 1.756 < 0.01
Exercising habit -0.054 0.293 -0.931, 0.220 ns
Note: GPA = Grade Point Average; Std β = standardized beta coefficient; SE = standard error; ns
= non-significant; CI = confidence interval;
3.8 The mediation pathways
3.8.1 Model 1- The social support, sleep and depression triangle
As revealed in Table 7, in this triangle, social support significantly predicted
depression in which increased in social support predicted decreased in depression

39
(β = -0.351, p<0.01). Similar effect was found in sleep and depression. Result
indicated that increased in sleep problem significantly predicted increase in
depression (β = 0.291, p<0.01). However, the relationship between social support
and sleep was still unclear whereas the present study revealed that social support
failed to predict depression (β = -0.081, p>0.05).
Since social support failed to predict depression, this violated the rules for a
mediation analysis proposed by Baron and Kenny (1986). Therefore, the
mediation analysis of the relationship between social support, sleep and
depression was excluded in later analysis. The first hypothesis of this study was
rejected.
3.8.2 Model 2- The stress, sleep and depression triangle
As illustrated in Table 7, stress significantly predicted depression with β =
0.526 (p < 0.001) in which increased in stress signifies increased in depression.
Sleep, as a proposed mediator in the link, also significantly predicted depression
(β = 0.291, p < 0.001). Moreover, increased in stress predicted increased in sleep
problem (β = 0.322, p < 0.001). As the above regressions were all found to be
significant, therefore, a final multiple regression was computed. In this multiple
regression, socio-demographic variables, optimism and social support were all
controlled. It can be seen that the β- value decreased from 0.526 (without control)

40
to 0.370 (with control), see Figure 1, indicating that the predictive value of stress
on depression was still significant even after control.
The Sobel test was then computed to test for the significant difference
between the two β – values. The Sobel test revealed that sleep significantly
mediated the relationship between stress and depression with Z = 3.553 at 0.01
level, as shown in figure 1. Hence, the effect of stress on depression was
mediated by sleep in which 21% of the effect went through the mediator and
79% was direct effect. This result supported the second hypothesis of the current
study.

41
Table 7. Multiple Regressions for the Mediation Pathway
Test of mediation pathway Std β SE 95% CI p - value
Model 1. The Social Support – Depression pathway
Social Support (IV) Depression (DV) a -0.351 0.044 -0.467, -0.295 <0.001
Sleep (Mediator) Depression (DV) a 0.291 0.126 0.647, 1.144 <0.001
Social Support (IV) Sleep (Mediator) a -0.081 0.015 -0.059, 0.002 ns
Model 2. The Stress – Depression pathway
Stress (IV) Depression (DV) a 0.526 0.070 0.879, 1.152 <0.001
Sleep (Mediator) Depression (DV) a 0.291 0.126 0.647, 1.144 <0.001
Stress (IV) Sleep (Mediator) a 0.322 0.026 0.151, 0.253 <0.001
Stress (IV) Depression ac
(Sleep as mediator)
0.370 0.081 0.555, 0.874 <0.001
Sobel Test Z = 3.553**
Model 3. The Optimism – Depression pathway
Optimism (IV) Depression (DV) a -0.430 0.087 -1.142, -0.800 <0.001
Sleep (Mediator) Depression (DV) a
0.291 0.126 0.647, 1.144 <0.001
Optimism (IV) Sleep (Mediator) a -0.144 0.005 -0.028, -0.007 <0.001
Optimism (IV) Depression (DV) ad
(Sleep as mediator)
-.0123 0.096 -0.468, -0.090 <0.005
Sobel Test Z = -3.799** <0.001
Note: a Socio-demographic variables controlled;
b Stress and Optimism controlled;
C Social support and Optimism controlled;
d Social Support and Stress controlled; Std β =
standardized beta coefficient; SE = standard error; CI = confidence level; ns = non-significant; * <.05; **<.01.

42
Figure 1. The Mediation analysis for the Stress, Sleep and Depression Triangle
Note: Dotted-line rectangle represented the proposed mediator; * <.05; **<.01.
3.8.3 Model 3- The optimism, sleep and depression triangle
Table 7 also shows the results obtained in the third mediation pathway. As
shown, optimism significantly predicted depression with increased optimism
predicted decreased depression (β = -0.430, p < 0.001). As stated before, sleep
significantly predicted depression (β = 0.291, p < 0.001). Moreover, increased in
optimism also significantly predicted decreased in sleep problem (β = -0.144, p <
0.005). In the final multiple regression, as illustrated in Figure 2, the β – value
decreased by 0.307 from - 0.430 (without control) to - 0.123 (with control) in
which that the predicting value of optimism on depression was still significant
after controlling for stress, social support, smoking habits and alcohol
consumption.
Again, the Sobel test was computed to test if the difference in the two β –
values was significant. The Sobel test revealed a Z- value of -3.799 which was
Without mediation: 0.526**
0.291** 0.322**
Sleep
Stress Depression
With mediation: 0.370**

43
significant at 0.01 level, as shown in figure 2, indicated that some of the
variances of the relationship between optimism and depression were shared by
the proposed mediator. Hence, it was revealed that sleep mediated the
relationship between optimism and depression in which about 17.2% of the
variances were indirect effect which went through the mediator and 82.8% was
direct effect. The third hypothesis of the current study was proved to be correct.
Figure 2. The Mediation analysis for the Optimism, Sleep and Depression Triangle
Note: Dotted-line rectangle represented the proposed mediator; * <.05; **<.01.
3.8.4 Model 4- The interaction model
One of the objectives of this study was to simultaneously test how optimism,
social support and stress affect sleep quality and mental health of college
students. Therefore, the independent variable involved in the last mediation
analysis was the interaction of the psychosocial factors, that is, the interaction
effect of optimism, social support and stress. These three variables all together
formed four combinations of interaction effect, they were 1) Social Support x
0.291** -0.144**
With mediation: -0.123*
Without mediation: -0.430**
Optimism Depression
Sleep

44
Stress x Optimism; 2) Social Support x Stress; 3) Optimism x Stress; 4)
Optimism x Social Support. As shown in table 8, model 4.1, 4.2 and 4.3 had all
failed to fulfill the mediation analysis criteria suggested by Baron and Kenny
(1986), therefore, in later analysis, these models would be excluded. However, as
revealed in table 8, model 4.4 fulfilled all the criteria needed for a mediation
analysis. Optimism interacted with social support and significantly predicted
depression (β = -0.466, p < 0.001) and sleep (β = -0.177, p < 0.001). As stated
before, increased in sleep problem significantly predicted increase in depression
(β = 0.309, p < 0.001). Finally, the interaction effect was found to be
significantly predicted depression even after controlling for the
socio-demographic and other variables (β = -0.266, p < 0.001).

45
Table 8. Mediation analysis for interaction effects
Note: a Socio-demographic variables controlled;
b Sleep and Optimism controlled;
C Sleep and Social Support controlled;
d Sleep and Stress controlled; Std β = standardized
beta coefficient; SE = standard error; CI = confidence level; ns = non-significant; * <.05; **<.01.
Test of mediation pathway Std β SE 95% CI p - value
Model 4.1: Interaction effect – Social Support x Stress x Optimism
Social Support x Stress x Optimism Depression a -0.227 0.000 -0.001, 0.000 <0.001
Social Support x Stress x Optimism Sleep a -0.007 0.000 0.000, 0.000 ns
Sleep Depression a 0.309 0.127 0.701, 1.201 <0.001
Social Support x Stress x Optimism Depression a -0.225 0.000 -0.001, 0.000 <0.001
Model 4.2: Interaction effect – Social Support x Stress
Social Support x Stress Depression a 0.187 0.002 0.004, 0.010 <0.001
Social Support x Stress Sleep a 0.220 0.001 0.002, 0.004 <0.001
Sleep Depression a 0.309 0.127 0.701, 1.201 <0.001
Social Support x Stress Depression a b 0.061 0.002 -0.001, 0.005 ns
Model 4.3: Interaction effect – Optimism x Stress
Optimism x Stress Depression a -0.073 0.005 -0.019, 0.001 ns
Optimism x Stress Sleep
a 0.010 0.002 -0.003, 0.004 ns
Sleep Depression a 0.309 0.127 0.701, 1.201 <0.001
Optimism x Stress Depression a C -0.011 0.005 -0.011, 0.008 ns
Model 4.4: Interaction effect -Optimism x Social Support
Optimism x Social Support Depression a -0.466 0.001 -0.021, -0.015 <0.001
Optimism x Social Support Sleep a -0.177 0.001 -0.003, -0.001 <0.001
Sleep Depression a 0.309 0.127 0.701, 1.201 <0.001
Optimism x Social Support Depression a
d -0.266 0.002 -0.013, -0.007 <0.001
Sobel Test Z = -3.491 <0.001

46
As shown in figure 3, the β- value decreased by 0.2 from -0.466 to -0.266.
To test whether the difference was significant, again, the Sobel test was
computed. It was reported that the Z-value was -3.491 (p < 0.001), indicating that
sleep significantly mediated the relationship between the interaction effect of
optimism and social support and depression.
Although not all the interaction effects were found to be significant, it
partially confirmed the hypothesis of the current study that psychosocial factors
interacted to affect sleep quality and mental health of college students. Therefore,
the last hypothesis of the current study was found to be correct.
Figure 3. The Mediation analysis for the Optimism x Social Support x Sleep and Depression
Triangle
Note: Dotted-line rectangle represented the proposed mediator; * <.05; **<.01.
0.127** -0.177**
Sleep
Depression Optimism x Social Support
Without mediation: -0.466**
With mediation: -0.266**

47
Chapter 4: Discussion and Conclusions
4.1 Discussion
To my best knowledge, this was the first study which simultaneously
examined the impact of optimism, social support and stress on sleep and their
predicting abilities on depression among Chinese college students. The major
findings of the current study were that psychosocial factors (optimism, social
support and stress) significantly predicted depression independently. Also, the
effects of optimism and stress on depression were mediated by sleep. This study
also confirmed the third hypothesis of the current study that some of these
psychosocial factors (optimism and social support) interacted to affect depression
and its effect was also mediated by sleep.
This study revealed that Chinese college students in this sample were
generally poor sleepers (M= 6.01, SD= 2.78). No gender differences were found
in the sleep quality and pattern except in the aspect of the use of sleeping
medication in which males reported significantly more use of sleeping
medication.
The Pittsburgh Sleep Quality Index (PSQI) was weakly correlated with
other measurements as shown in Table 3 in which represented that the PSQI and
the other measurements were measuring different constructs and it has a
significant but inverse relationships with optimism and social support and

48
positive relationships with stress and depression. These results were all
consistent with previous findings (Bastien et al., 2004; Cukrowicz, 2006; Nordin
et al., 2005; Norlander et al., 2005; Taylor et al., 2003).
The current study tested a number of hypotheses focusing on the
relationship among optimism, social support, stress, sleep and depression.
The first model of the current study examined the role of sleep in the
relationship between social support and depression. It was hypothesized that
social support, sleep and depression were inter-correlated and sleep was a
mediator in the social support – depression link. The results indicated that
increased social support significantly predicted decreased depression which was
consistent with previous findings (Bouteyre, Maurel, & Bernaud, 2007;
Eldeleklioglu, 2006; Roberts & Gotlib, 1997). There were two possible reasons.
First of all, social support might have a direct effect on depression. People with
higher perceived social support had a stronger sense of being liked and cared for
in which provide a beneficial effect on individual’s psychological health (Frey &
Rothlisberger, 1996). Moreover, it might also have an indirect effect on stress
and hence reduce the probability that an individual might suffer from depressive
mood. For instance, individual’s perception of the availability of social support
might influence their choices of coping strategy. In this case, social support acted
as a coping resource that affects the appraisal of stress (Schreurs & de Ridder,

49
1997). It was maintained that when an individual confronted with stress, he/ she
undergoes primary and secondary appraisal and these appraisal processes were
the important determinant of whether the event is stressful (Lazarus & Folkman,
1984). The primary appraisal involved in defining the nature of the event while
secondary appraisal involved the individual’s assessment of their coping abilities
and resources. So, it is possible that the presence of social support affects the
secondary appraisal in which provides the individual a sense that he/ she posses
the ability and resource to cope with the event. Therefore, lower the level of
stress and indirectly prevent the individual from the risk of developing
depression.
Besides, results illustrated that there was no significant relationship found
between social support and sleep. As Vosvick et al. (2004) suggested that, social
support was a multi-faced construct. The Multidimensional Scale of Perceived
Social Support (MSPSS) used in the current study measured the quality of
perceived social support of an individual. However, the quantity of social support
might also play an important role in determining its effect on stress. As Major et
al. (1997) pointed out that, social relationships can be an important coping
resources but it can also be a source of problems and distress. It was believed
that, positivity and negativity coexist in most of the social relationships (Abbey
et al., 1985). Increased in social network may result in greater social support but

50
it can also result in higher chance of social conflicts, criticisms and disapprovals,
etc. Therefore, the quantity of social support might be an influential aspect that
affects the overall predictive ability of social support on sleep.
The second model of the current study was to test the relationship among
stress, sleep and depression. As hypothesized, stressed individual significantly
reported poorer sleep quality. Also, poor sleepers were more likely to report
having more depressive symptoms than good sleepers. The Sobel test revealed
that some of the variances went through the proposed mediator, sleep, suggesting
that sleep was a significant mediator between stress and depression which
confirmed the second hypothesis of this study.
Evidence showed that before the onset of insomnia, there was always
stressful life events happened (Healey, Kales, & Monroe, 1981). It was believed
there were two processes that can be used to explain the relationship between
stress and sleep. They were the sleep interfering process and the sleep
interpreting process (Lundh & Broman, 2000).
The sleep interfering process advocated that body arousal interferes with
the sleep of an individual. It was suggested that sleep was associated with an
individual’s physiological states (Monroe, 1967). In their study of primary
insomniacs, Bonnet and Arand (1995) found that, the insomniacs had an elevated
metabolic rate and suggested that they had a general hyperarousal disorder. It

51
was believed that this kind of hyperarousal disorder contributed to their sleep
problems.
There were also evidence showed that insomnia was correlated with
emotional (Waters, Adams, Binks, & Varnado, 1993) and cognitive arousal
(Fichten et al., 1998). Lichstein and Rosenthal (1980) reported that insomniacs
engaged in active thinking, worrying, planning and analyzing at bedtime. These
pre-sleep cognitions were found to be correlated with sleep problems (Fichten et
al., 1998). Emotional arousal might also play a role in sleep problems in an
indirect way in which pre-sleep cognitions may make the individual feels
anxious, remorse or dysphoric, producing an emotional arousal that interfere
with sleep (Lundh & Broman, 2000).
The sleep interpreting process, on the other hand, attributed sleep
problems to the different kinds of cognitions about sleep. Lundh and Broman
(2000) suggested that misperceptions about sleep, such as perceptions of total
sleep duration, sleep quality, thoughts about how much sleep is needed,
consequences of insufficient sleep, factors that lead to good or poor sleep and
cognitions about one’s daily functioning were all cognitive processes that may
affect sleep. It was believed that these misperceptions about sleep may interact
with various kinds of sleep interfering processes (cognitive and emotional
arousal) that causes sleep problems of an individual (Lundh & Broman, 2000).

52
Consistent with previous findings, this study also revealed increased sleep
problem significantly predicted more depressive symptoms and it also played a
mediating role between stress and depression. Although whether sleep problems
precede depression or vice versa was still unclear, Mayers and Baldwin (2006)
found that, individual’s perception on sleep was an important factor in insomnia
and depression. Insomniacs tend to have cognitive biases towards negativity.
Nolen-Hoeksema (1991) also proposed that individuals who prone to ruminate
when confronted to stress tended to focus on their negative emotional states.
“Rumination is a form of self-focused attention by its specific focus on emotional
content and its repetitive nature” (Skitch & Abela 2008). Studies also showed
that rumination constantly predicted increased in depressive symptoms (Abbe,
Lyubomirsky, & Tkach, 2003).
From the above studies, it can be concluded that the plausible reason for
the mediating role of sleep on the link between stress and depression was that,
when confronted with stress, some individuals might engage in rumination, he or
she would then experience increased negative affect. This negative affect may
increase individual’s emotional arousal which may affect sleep or this negative
affect influences the individual’s cognitive processing in which hinder he or she
to implement behaviors that are effective in solving the problem and hence
intensify depressive symptoms (Nolen-Hoeksema 1987, 1991). As it was shown

53
that sleep mediated the relationship between stress and depression, therefore, the
second hypothesis of the current study was proven correct.
Results showed that the third hypothesis of the present study was also
supported. Model 3 of the current study was to investigate the role of sleep in the
relationship between optimism and depression. As shown in the table, an inverse
correlation was found between optimism and depression. Also, increased in
optimism predicted significantly fewer sleep problems. The Sobel test also
confirmed that sleep was a significant mediator between optimism and
depression.
Previous findings also confirmed the effect of optimism on depression. For
example, in their longitudinal study of protective factors of depression in an
elderly sample, Giltay, Zitman and Kromhout (2006) reported that optimism was
related to lower incidence of depressive symptoms. It was believed that
pessimists might lack positive expectation about the future and therefore, were
prone to worry which aggravate depressive symptoms (Conway, 2008).
On the other hand, optimists had a positive expectation about the future,
and this positive expectation help them to avoid engaging in negative thinking
pattern (Giltay, Zitman, & Kromhout 2006). Also, as stated before, optimists
might cope with adversity better than pessimists (Scheier et al., 2001), and the
optimistic outlook might attract more potential partners in a social network

54
(Carver, Kus, & Scheier, 1994), therefore, increasing the availability of social
support when needed and the individual may also perceived that he/ she has the
resources to cope with the adverse situation and hence, lower the depressive
symptoms (Giltay, Zitman, & Kromhout 2006). These were all the plausible
reasons for the inverse relationship between optimism and depression found in
the current study.
Besides, results of the current study revealed that optimism might have an
indirect effect on depression through sleep. As mentioned in the literature review,
pessimists had a higher level of worry and this worry may affect an individual’s
sleep (Conway et al., 2008). So, it was believed that when a pessimist encounter
sleep problems, due to his or her propensity to engage in negative thinking
pattern, would prone to worry and ruminate about the negative consequences of
insufficient sleep and because of their less effective coping strategies(Scheier et
al., 2001), resulted in increased depressive symptoms.
The final mediation analysis of the current study involved the mediating
role of sleep in the relationship between the interaction of the psychosocial
factors and depression. Different combinations of interaction effects were put
into the mediation analysis. As reported in the result section, the only significant
mediation effect of sleep was found when optimism interacted with social
support to predict depression and sleep in which increased in the two variables

55
significantly predicted lower level of depression and sleep problems. Previous
findings also reported that optimists were liked more (Carver, Kus, & Scheier,
1994) and people were attracted to their optimistic outlook and therefore they
were more able to develop an extensive and supportive social network than
pessimistic individuals (Brissette, 2002). This supportive social network, in
addition to their propensity to expect the good in the future (Scheier & Carver,
1985) might interact to reduce the probability that an individual would suffer
sleep problems and depression by providing he/ she a coping strategy, a sense of
having coping resources or to protect the individual from engaging in rumination
as explained in the previous paragraph (Abbe, Lyubomirsky, & Tkach, 2003;
Giltay, Zitman, & Kromhout, 2006).
Nevertheless, the mediating role of sleep was found to be non significant in
model 4.1 (the interaction between social support, stress and optimism), model
4.2 (the interaction between social support and stress), model 4.3 (the interaction
between optimism and stress). It can be observed that stress, independently,
could significantly predicted sleep problem and depression, but when it comes to
combine with other variables, the resulting interaction effect has lost its
predictive value. Also, optimism was found to be a variable that consistently
predicted sleep problems and depression no matter it was examined
independently or was interacted with other variables. Moreover, social support

56
alone could not predicted sleep problems of an individual, but when it interacted
with optimism, the resulting interaction effect significantly predicted lower level
of sleep problems and depression. Therefore, it was suspected that the perceived
level of stress experienced by an individual would be moderated when it
combined with optimism or social support or both. The effect of optimism in the
addition of the effect of social support may result in lower level of stress. This
lowered level of stress may prevent an individual suffering from sleep problems
and depressive symptoms. In fact, optimism, social support and stress were
inter-correlated as suggested by previous findings (Hulbert & Morrison, 2006;
Oginska-Bulik, 2005; Yali & Lobel, 2002). Results of the current study also
suggested that the relationship between these three variables might also be a
mediation pathway in which social support mediate the relationship between
optimism and stress. However, this mediating relationship among the three
psychosocial factors was just a speculated one since the statistical methods used
in the current study did not enable a verifying test between this speculated
mediation pathway and its relationship with sleep and depression. Therefore, the
forth hypothesis of the current study was just partially supported.
4.2 Limitations and Recommendations
Despite the success to find out the mediating role of sleep in the

57
relationship between psychosocial factors and depression, there were limitations
in the current study. First of all, results of the present investigation warrant
caution for causal relationship as the current study was a cross-sectional design.
Secondly, the Multidimensional Scale of Perceived Social Support (MSPSS)
used in the current study did not provide information about the quantitative
aspect of social support which maybe a factor that affects the results. Moreover,
all the measures of the present study were based on self-report in which it might
have increased measurement errors. Furthermore, due to the statistical methods
adopted in the current study, the speculated mediation relationship among
optimism, social support and stress could not be verified, it was believed that if
the relationships among these variables could be confirmed, a more precise and
accurate relationship among these psychosocial factors, sleep and depression
would be obtained.
To overcome these shortcomings, further studies should employ a
longitudinal design so that a causal linkage between variables can be drawn. Also,
in order to give a more accurate result, different aspects of a variable should also
be measured, for example, in assessing social support of participants, a more
comprehensive instrument measuring both the quality and quantity of the
construct can be used. Moreover, objective instruments should be used to
measure the variables, so that both the reliability and generalizability of results

58
can be increased. Finally, future studies can make a greater effort in verifying the
relationship among optimism, social support and stress and how they interact to
predict sleep problems and depression in an individual.
4.3 Conclusions
Despite the limitations, the current study contributed in the investigation
of the relationship among optimism, social support, stress, sleep and depression.
It was concluded that, optimism, social support and stress were all significant
predictors on mental health of college students. Moreover, their predictive values
were mediated by sleep. Therefore, to alleviate the rising trend of sleep problems
among college students, school-based intervention can target on these factors to
raise the awareness of sleep problems and promote sleep hygiene in school.

59
References
Abbe, A., Tkach, C., & Lyubormirsky, S. (2003). The art of living by
dispositionally happy people. Journal of Happiness Studies, 4, 385-404.
Abbey, A., Abramis, D. J., & Caplan, R. D. (1985). Effects of different sources of
social support and social conflict on emotional well-being. Basic and
Applied Social Psychology, 6, 111-129.
American Psychiatric Association (APA). (2000). Diagnostic and statistical
manual of mental disorders (4th
ed.). Washington, DC: American
Psychiatric Association.
Baron, R.M., & Kenny, D.A. (1986). The moderator-mediator variable
distinction in social psychological research: Conceptual, strategic, and
statistical considerations. Journal of Personality and Social Psychology, 51,
1173-1182.
Bastien, C. H., Vallieres, A., & Morin, C. M. (2004). Precipitating factors of
insomnia. Behavioral Sleep Medicine, 2, 50–62.
Baum, M. (1990). Stress, intrusive imagery, and chronic distress. Health
Psychology, 9, 653-675.
Beck, A. T., Steer, R. A., & Garbin, M. G. (1988). Psychometric properties of the
Beck Depression Inventory: Twenty-five years of evaluation. Clinical
Psychology Review, 8, 77-100.
Beck, A. T., Steer, R. A., & Garbin, M. (1988). Psychometric properties of the

60
Beck Depression Inventory. Clinical Psychology Review, 8, 77–100.
Bonn, G. (2004). WHO technical meeting on sleep and health. Retrieved March,
20, 2009, from www.euro.who.int/document/E84683_1.pdf.
Bonnet, M. H., & Arand, D. L. (1995). 24-Hour metabolic rate in insomniacs and
matched normal sleepers. Sleep, 18, 581-588.
Bouteyre, E., Maurel, M., & Bernaud, J.L. (2007). Daily hassles and depressive
symptoms among first year psychology students in France: The role of
coping and social support. Stress and Health, 23, 93-99.
Brissette, I., Scheier, M. F., & Carver, C. S. (2002). The role of optimism in
social network development, coping, and psychological adjustment during a
life transition. Journal of Personality & Social Psychology, 82, 102-111.
Brummett, B. H., Babyak, M. A., & Siegler, I. C. (2006). Associations among
perceptions of social support, negative affect, and quality of sleep in
caregivers and non-caregivers. Health Psychology, 25, 220–225.
Buboltz, W. C., Brown, F. C., & Soper, B. (2001). Sleep habits and patterns of
college students. Journal of American College Health, 50, 131-135.
Carney, C., Edinger, J., Meyer, B., Lindman, L., & Istre, T. (2006). Symptom
focused rumination and sleep disturbance. Behavioral Sleep Medicine, 4,
228-41.
Carver, C. S., Kus, L. A., & Scheier, M. F. (1994). Effects of good versus bad

61
mood and optimistic versus pessimistic outlook on social acceptance versus
rejection. Journal of Social and Clinical Psychology, 13, 138-151.
Chan, C.M., & Tsoi, M.M. (1984). The BDI stimulus determinants of
cognitive-related depression among Chinese college students. Cognitive
Therapy and Research, 8, 501-507.
Chan, D. W. (1991). The Beck Depression Inventory: What difference does the
Chinese version makes. Psychological Assessment, 3, 616-622.
Chandola, T., Marmot, M., & Siegrist, J. (2007). Failed reciprocity in close social
relationships and health: findings from the Whitehall II study. Journal of
Psychosomatic Research, 63, 403-11.
Chen C.H., Tseng Y.F., Chou F.H., & Wang S.Y. (2000). Effects of support group
intervention in postnatally distressed women. A controlled study in Taiwan.
Journal of Psychosomatic Research, 49, 395–399.
Chou, K. L. (2000). Assessing Chinese adolescents' social support: the
multidimensional scale of perceived social support. Personality and
Individual Differenc, 28, 299-307.
Cohen, S., Kamarck, T., & Mermelstein, R. (1983). A global measure of
perceived stress. Journal of Health and Social Behavior, 24, 385-396.
Conway, F., Magai, C., Springer, C., & Jones, S.C. (2008). Optimism and
pessimism as predictors of physical and psychological health among

62
grandmothers raising their grandchildren. Journal of Research in
Personality, 42, 1352-1357.
Cukrowicz, K. C., Otamendi, A., Pinto, J. V., Bernert, R. A., Krakow, B., &
Joiner, T. E., Jr. (2006). The impact of insomnia and sleep disturbances on
depression and suicidality. Dreaming, 16, 1–10.
Eldeleklioglu, J. (2006). The relationship between the perceived social support
and the level of depression and anxiety in university students. Kuram ve
Uygulamada Egitim Bilimleri, 6, 742-752.
Fichten, C. S., Libman, E., Creti, L., Amsel, R., Tagalakis, V., & Brender, W.
(1998). Thoughts during awake times in older good and poor sleepers - the s
elf-statement test: 60+. Cognitive Therapy & Research, 22, 1-20.
Ford, D. E., Anthony, J. C., Nestadt, J. R,. & Romanoski, A. J. (1989). The
General Health Questionnaire by interview: Performance in relation to
recent use of health services. Medical Care, 27, 367-375.
Francine, C., Carol, M., Carolyn, S., & Samuel, J.C. (2008). Optimism and
pessimism as predictors of physical and psychological health among
grandmothers raising their grand children. Journal of Research in
Personality, 42, 1352-1357.
Frey, C. U., & Rothlisberger, C. (1996). Social support in healthy adolescents.
Journal of Youth and Adolescence, 25, 17-31.

63
Giltay, E. J., Zitman, F. G., & Kromhout, D. (2006). Dispositional optimism and
the risk of depressive symptoms during 15 years of follow-up: The Zuthpen
Elderly Study. Journal of Affective Disorder, 91, 45–52.
Goldtein, T. R., Bridge, J. A., & Brent, D. A. (2008). Sleep disturbance preceding
completed suicide in adolescents. Journal of Consulting and Clinical
Psychology, 76, 84–91.
Goodman, L.A. (1961). "Snowball sampling". Annals of Mathematical Statistics,
32, 148–170.
Govaerts, S., & Gregory, J. (2004). Stressful academic situations: Study on
appraisal variables in adolescence. Revue EuropÃcenne de Psychologie
AppliqueÃc, 54, 261–271.
Groeger, J. A., Zijlstra, F. R. H., & Dijk, D. J. (2004). Sleep quantity, sleep
difficulties and their perceived consequences in a representative sample of
some two thousand British adults. Journal of Sleep Research, 13, 359–71.
Hattar-Pollara, M., & Dawani, H. (2006). Cognitive appraisal of stress and health
status of wage working and nonwage working women in Jordan. Journal of
Transcultural Nursing, 17, 349–356.
Hawkins, J., & Shaw, P. (1992). Self reported sleep quality in college students: A
repeated measures analysis. Sleep: Journal of Sleep & Sleep Disorders
Research, 15, 545-549.

64
Healey, E. S., Kales, A., Monroe, L. J., Bixler, E. O., Chamberlin, K., & Soldatos,
C. R. (1981). Onset of insomnia: Role of life-stress events. Psychosomatic
Medicine, 43, 439-451.
Hojat, M., Gonnella, J. S., Erdmann, J. B., & Vogel, W. H. (2003). Medical
students’ cognitive appraisal of stressful life events as related to personality,
physical well-being, and academic performance: A longitudinal study.
Personality and Individual Differences, 35, 219–235.
Hublin, C., Kaprio, J., Partinen, M., & Koskenvuo, M. (2001). Insufficient sleep-
A population-based study in adults. Sleep, 24, 392-400.
Hulbert, N. (2006). A preliminary study into stress in palliative care: Optimism,
self- efficacy and social support. Psychology, Health & Medicine, 11,
246–254.
Jensen, D.R. (2003). Understanding sleep disorders in a college student
population. Journal of College Counseling, 6, 25-34.
Kelly, W. H., Kelly, K. E., & Chumm, R. C. (2001). The relationship between
sleep length and grade-point average among college students. College
Student Journal, 35, 84-86.
Kutner, N. N. (2004). Applied linear regression models (4th
ed.). New York:
McGraw-Hill.
Lai, J. C. L. (1997). Relative predictive power of the optimism versus the

65
pessimism index of a Chinese version of the Life Orientation Test.
Psychological Record, 47, 399-410.
Lee S., & Crockett M.S. (1994) Effect of assertiveness training on levels of stress
and assertiveness experienced by nurses in Taiwan, Republic of China.
Issues in Mental Health Nursing, 15, 419–432.
Li, R. H., Wing, Y. K., Ho, S. C., & Fong, S. Y. (2002). Gender differences in
insomnia - a study in the Hong Kong Chinese population. Journal of
Psychosomatic Research, 53, 601-609.
Lichstein, K. L., & Rosenthal, T. L. (1980). Insomniacs' perceptions of cognitive
versus somatic determinants of sleep disturbance. Journal of Abnormal
Psychology, 89, 105-107.
Linton, S. J. (2004). Does work stress predict insomnia? A prospective study.
British Journal of Health Psychology, 9, 127–136.
Lundh, L. S., & Broman, J. E. (2000). Insomnia as an interaction between sleep-
interfering and sleep-interpreting processes. Journal of Psychosomatic
Research, 49, 299-310.
Major, B., Zubek, J. M., Cooper, M. L., Cozzarelli, C., & Richards, C. (1997).
Mixed messages: Implications of social conflict and social support within
close relationships for adjustment to a stressful life event. Journal of
Personality & Social Psychology, 72, 1349-1363.

66
Mayers, A. G., & Baldwin, D. S. (2006). The relationship between sleep
disturbance and depression. International Journal of Psychiatry in Clinical
Practice, 10, 2–16.
Monroe, L. J. (1967). Psychological and physiological differences between good
and poor sleepers. Journal of Abnormal Psychology, 72, 255-264.
Morin, C., Rodrigue, S., & Ivers, H. (2003). Role of stress, arousal, and coping
skills in primary insomnia. Psychosomatic Medicine, 65, 259-267.
Murphy, M. C., & Archer, J. (1996). Stressors on the college campus: A
comparison of 1985 and 1993. Journal of College Student Development, 37,
20-28.
Nakata, A., Haratani, T., Takahashi, M., Kawakami, N., Arito, H., Kobayashi, F.,
& Araki, S. (2004). Job stress, social support, and prevalence of insomnia in
a population of Japanese daytime workers. Social Science and Medicine, 59,
1719-1730.
Nolen-Hoeksema, S. (1991). Responses to depression and their effects on the
duration of the depressive episode. Journal of Abnormal Psychology, 100,
569-582.
Nolen-Hoeksema, S. K. (1987). Developmental studies of explanatory style, and
learned helplessness in children. Dissertation Abstracts International, 47,
7-B, 3119.

67
Nordin, M., Knutsson, A., Sundbom, E., & Stegmayr, A. (2005). Psychosocial
factors, gender and sleep. Journal of Occupational Health Psychology, 10,
54-63.
Norlander, T., Johansson, A., & Bood, S. A. (2005). The affective personality: Its
relation to quality of sleep, well-being, and stress. Social Behavior and
Personality, 33, 709–722.
O'Brien, R. M. (2007). A caution regarding rules of thumb for variance
inflation factors. Quality and Quantity, 41, 673-690.
Oginska-Bulik, N. (2005). The role of personal and social resources in
preventing adverse health outcomes in employees of uniformed professions.
International Journal of Occupational Medicine & Environmental Health,
18, 233-240.
Ohayon, M. M., & Partinen, M. (2002). Insomnia and global sleep dissatisfaction
in Finland. Journal of Sleep Research, 11, 339-346.
Robert, R.E., Robert, C.R., & Duong, H.T. (2008). Chronic insomnia and its
negative consequences for health and functioning of adolescents: A
12-month prospective study. Journal of Adolescent Health, 42, 294-302.
Roberts, J.E., & Gotlib, I.H. (1997). Social support and personality in depression:
Implications from quantitative genetics. In G.. R. Pierce & B. Lakey (Eds.),
Sourcebook of social support and personality (pp. 187-214). New York:

68
Plenum Press.
Scheier, M. F., & Carver, C. S. (1985). Optimism, coping, and health: assessment
and implications of generalized outcome expectancies. Health Psychology,
4, 219-247.
Scheier, M. F., Carver, C. S., & Bridges, M. W. (2001). Optimism, pessimism,
and psychological well-being. Optimism and pessimism: Implications for
theory, research, and practice. Washington, DC: American Psychological
Association.
Scheier, M. F., Carver, S. C., & Bridges, M. W. (1994). Distinguishing optimism
from neuroticism (and trait anxiety, self-mastery, and self-esteem): A
reevaluation of the Life Orientation Test. Journal of Personality & Social
Psychology, 67, 1063-1078.
Schreurs, K. M., & de Ridder, D. T. (1997). Integration of coping and social
support perspectives: Implications for the study of adaptation to chronic
diseases. Clinical Psychology Review, 17, 89-112.
Shek, D. T. L. (1989). Validity of the Chinese version of the General Health
Questionnaire. Journal of Clinical Psychology, 45, 890-897.
Shinn, M., Lehmann, S., & Wong, N. W. (1984). Social interaction and social
support. Journal of Social Issues, 40, 55-76.
Skitch, S.A., & Abela, J.R.Z. (2008). Rumination in response to stress as a

69
common vulnerability factor to depression and substance misuse in adolescence.
Journal of Abnormal Child Psychology, 36, 1029-1045.
Smyth, J. (2007). Beyond self-selection in video game play: An experimental
examination of the consequences of massively multiplayer online
role-playing game play. Cyber Psychology & Behavior, 10, 717–721.
Stewart, R., Besset, A., & Bebbington, P. (2006). Insomnia comorbidity and
impact and hypnotic use by age group in a national survey population aged
16 to 74 years. Sleep, 29, 1391-1397.
Taylor, D. J., Lichstein, K. L., & Durrence, H. H. (2003). Insomnia as a Health
Risk Factor. Behavioral Sleep Medicine, 1, 227.
Taylor, S.E. (2008). Health psychology (7th ed.). New York: McGraw-Hill.
Taylor-Piliae, R. E., Haskell, W. L., Waters, C. M., & Froelicher, E. S. (2006).
Change in perceived psychosocial status following a 12 week Tai Chi
exercise programme. Journal of Advanced Nursing, 54, 313–329.
Thomsen, D. K., Mehlsen, M. Y., Hokland, M., Viidik, A., Olesen, F., Avlund, K.,
Munk, K., & Zachariae, R. (2004). Negative thoughts and health:
associations among rumination, immunity, and health care utilization in a
young and elderly sample. Psychosomatic Medicine, 66, 363-71.
Tsai, L. L., & Li, S. P. (2004). Sleep patterns in college students: gender and
grade differences. Journal of Psychosomatic Research, 56, 231-237.

70
Tsai, P. S., Wang, S. Y., Wang, M. Y., Su, C. T., Yang, T. T., Huang, C. J., & Fang,
S. C. (2005). Psychometric evaluation of the Chinese version of the
Pittsburgh Sleep quality Index (CPSQI) in primary insomnia and control
subjects. Quality Life Research, 14, 1943-52.
Utsey, S. O., Williams, O., III, Lanier, Y., Bolden, M. A., Lee, A., & Newsome, C.
(2006). Moderator effects of cognitive ability and social support on the
relation between race-related stress and quality of life in a community
sample of African Americans. Cultural Diversity and Ethnic Minority
Psychology, 12, 334–346.
Vela-Bueno, A., Moreno-Jimacnez, B., Rodraguez-Muaoz, A., Olavarrieta-
Bernardino, S., Fernajndez-Mendoza, J., De La Cruz-Troca, J. J., et al.
(2008). Insomnia and sleep quality among primary care physicians with low
and high burnout levels. Journal of Psychosomatic Research, 64, 435-442.
Vosvick, M., Gore-Felton, C., & Ashton, E. (2004). Sleep disturbances among
HIV positive adults: The role of pain, stress, and social support. Journal of
Psychosomatic Research, 57, 459-463.
Waters, W. F., Adams, S. G., Binks, P., & Varnardo, P. (1993). Attention, stress
and negative emotion in persistent sleep-onset and sleep-maintenance
insomnia. Sleep: Journal of Sleep & Sleep Disorders Research, 16, 128-136.
World Health Day (2001). Mental health and its problems. Retrieved March, 20,

71
2009, from
http://www.emro.who.int/MNH/WHD/PublicInformation-Part2.htm.
Yali, A., & Lobel, M. (2002). Stress-resistance resources and coping in
pregnancy. Anxiety, Stress Coping, 15, 289-309.

72
Appendix A
The Pittsburgh Sleep Quality Index – Chinese version
請你就過去一個月來的日常(大多數)的睡眠習慣回答下列問題:
1. 過去一個月來,你通常何時上床? _____時_____分
2. 過去一個月來,你通常多久才能入睡? _____分鐘
3. 過去一個月來,你早上通常何時起床? _____時_____分
4. 過去一個月來,你實際每晚可以入睡幾小時? _____時_____分
以下問題選擇一個適當的答案打勾,請全部作答?
5. 過去一個月來,你的睡眠出現下列困擾情形,每星期約有幾次?
從 不 約 三三
未 到 一 次次
發 一 兩 或以
生 次 次 上
(1)無法在 30 分鐘內入睡。 □ □ □ □
(2)半夜或凌晨便清醒。 □ □ □ □
(3)必須起來上廁所。 □ □ □ □
(4)覺得呼吸不順暢。 □ □ □ □
(5)大聲打鼾或咳嗽。 □ □ □ □
(6)會覺得冷。 □ □ □ □
(7)覺得躁熱。 □ □ □ □
(8)作惡夢。 □ □ □ □
(9)身上有疼痛。 □ □ □ □
(10)其他, □ □ □ □
請說明:____________________
6. 過去一個月, 您有多少次需要藉助藥物 (醫生處方或成藥)來幫助睡眠?
□未發生 □不到ㄧ次 □ㄧ兩次 □三次或三次以上
7. 過去一個月, 當你在開車、用餐、從事日常社交活動時, 有多少次覺得
難以保持清醒狀態?
□未發生 □不到ㄧ次 □ㄧ兩次 □三次或三次以上

73
8. 過去一個月, 要打起精神來完成您應該做的事情對您有多少困擾?
□完全沒有 □只有很少困擾 □有些困擾 □有很大的困擾
9. 過去一個月, 您對您自己的睡眠品質整體評價如何?
□非常好 □好 □不好 □非常不好
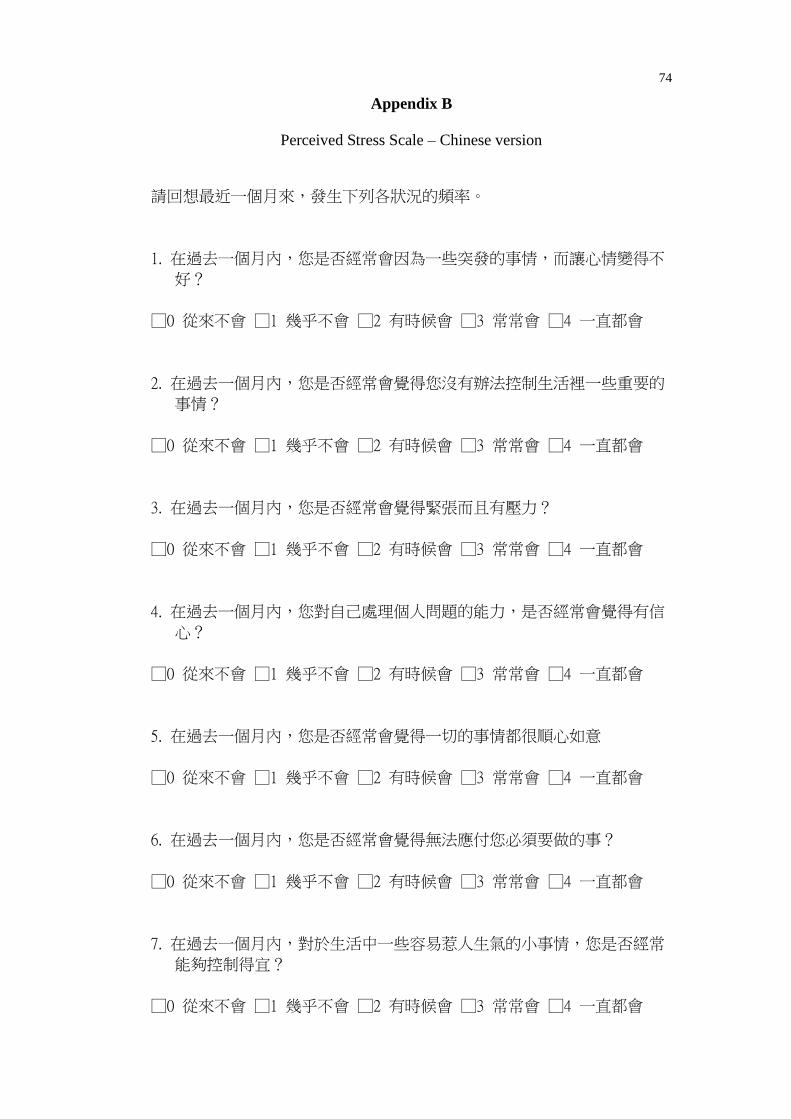
74
Appendix B
Perceived Stress Scale – Chinese version
請回想最近一個月來,發生下列各狀況的頻率。
1. 在過去一個月內,您是否經常會因為一些突發的事情,而讓心情變得不
好?
□0 從來不會 □1 幾乎不會 □2 有時候會 □3 常常會 □4 一直都會
2. 在過去一個月內,您是否經常會覺得您沒有辦法控制生活裡一些重要的
事情?
□0 從來不會 □1 幾乎不會 □2 有時候會 □3 常常會 □4 一直都會
3. 在過去一個月內,您是否經常會覺得緊張而且有壓力?
□0 從來不會 □1 幾乎不會 □2 有時候會 □3 常常會 □4 一直都會
4. 在過去一個月內,您對自己處理個人問題的能力,是否經常會覺得有信
心?
□0 從來不會 □1 幾乎不會 □2 有時候會 □3 常常會 □4 一直都會
5. 在過去一個月內,您是否經常會覺得一切的事情都很順心如意
□0 從來不會 □1 幾乎不會 □2 有時候會 □3 常常會 □4 一直都會
6. 在過去一個月內,您是否經常會覺得無法應付您必須要做的事?
□0 從來不會 □1 幾乎不會 □2 有時候會 □3 常常會 □4 一直都會
7. 在過去一個月內,對於生活中一些容易惹人生氣的小事情,您是否經常
能夠控制得宜?
□0 從來不會 □1 幾乎不會 □2 有時候會 □3 常常會 □4 一直都會

75
8. 在過去一個月內,您是否經常會覺得事情都在您可以控制的範圍內?
□0 從來不會 □1 幾乎不會 □2 有時候會 □3 常常會 □4 一直都會
9. 在過去一個月內,您是否經常會因為一些您無法控制的事情,而讓您感
到生氣?
□0 從來不會 □1 幾乎不會 □2 有時候會 □3 常常會 □4 一直都會
10. 在過去一個月內,您是否經常覺得困難已經堆積如山(太多),讓您無
法克服
□0 從來不會 □1 幾乎不會 □2 有時候會 □3 常常會 □4 一直都會

76
Appendix C
Life Orientation Test – Chinese version
請回想最近一個月來,發生下列各狀況的頻率。
1. 當前途未定的時候,我通常會預想好的結
果。 0 1 2 3 4
2. 展望將來,我看不到有令我開懷的境況。 0 1 2 3 4
3. 我對前景常感樂觀。 0 1 2 3 4
4. 我很少想過事情會盡如我意。 0 1 2 3 4
5. 我很少預計好事會發生在我身上。 0 1 2 3 4
6. 總的來說,我預期發生在我身上的好事會
多過壞事。 0 1 2 3 4
從來不會
幾乎不會
有時候會
常常會
一直都會

77
Appendix D
The Multidimensional Scale of Social Support
以下句子能反映我們與家人及朋友之間的關係, 請細心閱讀並選擇合
適的答案:
1. 當我有需要時, 總有一個重要的人
在我身邊支持著我。
2. 當我想與別人分享喜樂和憂愁時,
總有一個重要的人給我傾訴。
3. 我的家人真的嘗試去幫助我。
4. 我能夠在家庭中找到情緒上的支持。
5. 我能找到一個重要的人,
他/她是我感到安慰的來源。
6. 我的朋友真的嘗試去幫助我。
7. 當我感到事事不如意時,我能倚靠我的朋友。
8. 我可以將我的疑難向家人傾訴。
9. 我能夠找到合適的朋友分享我的喜樂和憂愁。
10. 在我的生命中有這樣一個重要的人,
他/她關心我的感受。
11. 我的家人樂於幫助我作決定。
12. 我可以將我的疑難向朋友傾訴。 1.□ 2.□ 3.□ 4.□ 5. □
1.□ 2.□ 3.□ 4.□ 5. □
1.□ 2.□ 3.□ 4.□ 5. □
1.□ 2.□ 3.□ 4.□ 5. □
1.□ 2.□ 3.□ 4.□ 5. □
1.□ 2.□ 3.□ 4.□ 5. □
1.□ 2.□ 3.□ 4.□ 5. □
1.□ 2.□ 3.□ 4.□ 5. □
1.□ 2.□ 3.□ 4.□ 5. □
1.□ 2.□ 3.□ 4.□ 5. □
1.□ 2.□ 3.□ 4.□ 5. □
1.□ 2.□ 3.□ 4.□ 5. □
極同意
同意
極同意
不同意
極不同意

78
Appendix E
Beck Depression Inventory II – Chinese version
請細心閱讀以下句子, 選出最能表達你上星期心情的一項, 並以「√」表示。
若沒有合適的句子, 請選擇最接近的一項。
1. 0 □ 我不感到憂愁
1 □ 我感到悲哀, 憂愁
2 □ 我時常感到悲哀, 憂愁, 又不能擺脫
3 □ 我愁苦, 不快樂, 以至無法忍受
2. 0 □ 我對未來不不怎麼悲觀失望
1 □ 我對未來感到失望
2 □ 我感到沒有什麼可以寄望將來
3 □ 我感到未來毫無希望, 而事情也不會好轉
3. 0 □ 我不覺得像失敗者
1 □ 我覺得比別人失敗的多
2 □ 當我回想生命時, 只見很多錯敗
3 □ 我覺得自己是個完全失敗的人 (如為人父母、丈夫、妻子、兒女等)
4. 0 □ 我像以往一般享受所作的事
1 □ 我不享受以往作的事
2 □ 我再不能從任何事取得滿足
3 □ 我對任何事都感到不滿、煩悶
5. 0 □ 我不感到怎樣內疚
1 □ 我很多時間感到內疚
2 □ 我大部份時間感到內疚
3 □ 我無時無刻感到內疚
6. 0 □ 我不感到自己被懲罰
1 □ 我感到自己也許會被懲罰
2 □ 我期望自己會被懲罰
3 □ 我覺得自己正在被懲罰

79
7. 0 □ 我對自己不感到失望
1 □ 我對自己失望
2 □ 我討厭自己
3 □ 我憎恨自己
8. 0 □ 我不感到自己比別人差
1 □ 我因自己的弱點及錯失而自責
2 □ 我無時無刻都怪責自己的錯失
3 □ 我為每件發生的不如意事怪責自己
9. 0 □ 我沒有任何自殺的念頭
1 □ 我有自殺的念頭, 但卻不會實行
2 □ 我希望自殺
3 □ 若有機會, 我會自殺
10. 0 □ 我沒有比平常哭得多
1 □ 我現在比以前哭得多
2 □ 我現在時常哭
3 □ 我以前是會哭的, 現在卻想哭也不能
11. 0 □ 我沒有比前多憤怒
1 □ 我比以前容易激動、生氣
2 □ 我現在時常感到憤怒
3 □ 我連以往令我氣惱的事也感麻木了
12. 0 □ 我沒有失去對別人的興趣
1 □ 我對別人的興趣比以前少了
2 □ 我對別人幾乎失了興趣
3 □ 我對別人完全失了興趣
13. 0 □ 我作決定的能力如以往一樣
1 □ 我放棄作決定比以前多
2 □ 我比以前更難作出決定
3 □ 我已不能作任何決定

80
14. 0 □ 我不感到外貌比以前差
1 □ 我擔心自己看來老了, 不吸引
2 □ 我感到自己外貌有永久性的改變, 令我看來不吸引
3 □ 我相信自己外貌醜陋
15. 0 □ 我能像以往一般的工作
1 □ 我要份外費神才能開始作事
2 □ 我要很辛苦迫自己才可作事
3 □ 我什麼事也做不來
16. 0 □ 我的睡眠如平常一樣
1 □ 我沒有睡得像以前那麼好
2 □ 我比往常早醒一兩小時, 而很難再入睡
3 □ 我比往常早醒數小時, 而不能再入睡
17. 0 □ 我不比以前多感疲倦
1 □ 我比以前容易疲倦
2 □ 我做任何事都感到疲
3 □ 我實在太累去做任何事
18. 0 □ 我胃口沒有比以前差
1 □ 我胃口沒有以往那麼好
2 □ 我胃口比以往差很多
3 □ 我完全沒有胃口
19. 0 □ 我近來沒有減輕體重
1 □ 我體重減了 5 磅以上
2 □ 我體重減了 10 磅以上
3 □ 我體重減了 15 磅以上
我正在嘗試以節食減輕體重 □ 是 □ 否
20. 0 □ 我沒有比以前多憂慮自己的健康
1 □ 我在擔心身體的問題, 如酸軟、疼痛、腸胃不適、便秘等
2 □ 我很擔心身體的問題, 以至很難理會其他事
3 □ 我非常擔心身體的問題, 以至完全無法去想其他事

81
21. 0 □ 我近來沒有發覺對性的興趣有改變
1 □ 我對性的興趣比以前減了
2 □ 我現在對性大大減了興趣
3 □ 我完全對性失去了興趣

82
每週三次或以上
每週一至兩次
每週少於一次
從未發生
Appendix F
Questionnaire
大學生睡眠健康問卷調查 香港城巿大學 應用社會科學學系
此問卷是要了解 閣下的睡眠習慣。問卷共有五個不同部份。以下資料只會作研究用途,所
有資料將會絕對保密,謝謝您的合作!
第一部份 下列問題是要調查您過去這一個月來的睡眠習慣, 請您以平均狀況回答以下問題。
A1.過去一個月, 您晚上通常幾點上床睡覺? __________ 點 __________分 ( 上午 / 下午 )
A2.過去一個月, 您在上床後, 通常躺多久才能入睡? __________分
A3.過去一個月, 您早上通常幾點起床? __________ 點 __________分 ( 上午 / 下午 )
A4.過去一個月, 您每天晚上真正睡著的時間約多少
(這可能和您躺在床上所花的時間不同)? ___________ 小時 ___________ 分
請選擇最適合您的答案, 在適合的選項內畫上「 O」, 並回答所有問題。
A5. 過去一個月,您的睡眠有多少次受到下列干擾:
a) 無法在 30 分鐘入睡 0 1 2 3
b) 半夜或清晨醒來 0 1 2 3
c) 需要起床上廁所 0 1 2 3
d) 呼吸不順暢 0 1 2 3
e) 咳嗽或大聲打鼾 0 1 2 3
f) 感覺很冷 0 1 2 3
g) 感覺很熱 0 1 2 3
h) 作惡夢 0 1 2 3
i) 疼痛 0 1 2 3
j) 其他情況請說明: _____________ 0 1 2 3

83
每週三次或以上
每週一至兩次
每週少於一次
從未發生
第二部份 請表示您對以下句子的同意及不同意程度:
B1.當前途未定的時候, 我通常會預想好的結果。 0 1 2 3 4
B2.展望將來, 我看不到有令我開懷我境況。 0 1 2 3 4
B3.我對前景常感樂觀。 0 1 2 3 4
B4.我很少想過事情會盡如我意。 0 1 2 3 4
B5.我很少預計好事會發生在我身上。 0 1 2 3 4
B6.總括來說, 我預期發生在我身上的好事會多過壞事。 0 1 2 3 4
A6. 過去一個月, 您有多少次需要藉助藥物
(醫生處方或成藥) 來幫助睡眠?
0 1 2 3
A7. 過去一個月, 當你在開車、用餐、從事日常社交活動時,
有多少次覺得難以保持清醒狀態?
0 1 2 3
完
全
沒
有
困
擾
只有
少
困擾
有
些
困
難
有很
大的
困擾
A8. 過去一個月, 要打起精神來完成您應該做的事情對您有
多少困擾?
0 1 2 3
非
常
好
好 不
好
非常
不好
A9. 過去一個月, 您對您自己的睡眠品質整體評價如何? 0 1 2 3
-------------------------
非常不同意
非常同意
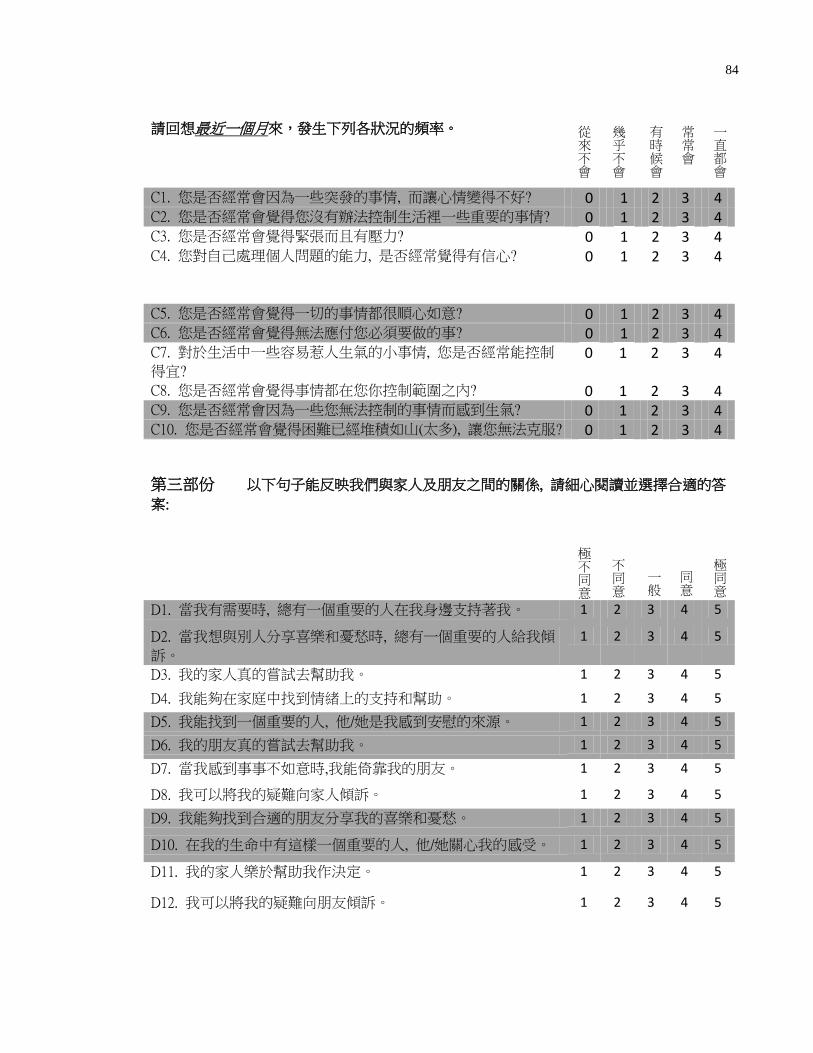
84
請回想最近一個月來,發生下列各狀況的頻率。
C1. 您是否經常會因為一些突發的事情, 而讓心情變得不好? 0 1 2 3 4 C2. 您是否經常會覺得您沒有辦法控制生活裡一些重要的事情? 0 1 2 3 4 C3. 您是否經常會覺得緊張而且有壓力? 0 1 2 3 4 C4. 您對自己處理個人問題的能力, 是否經常覺得有信心? 0 1 2 3 4
C5. 您是否經常會覺得一切的事情都很順心如意? 0 1 2 3 4 C6. 您是否經常會覺得無法應付您必須要做的事? 0 1 2 3 4 C7. 對於生活中一些容易惹人生氣的小事情, 您是否經常能控制
得宜? 0 1 2 3 4
C8. 您是否經常會覺得事情都在您你控制範圍之內? 0 1 2 3 4 C9. 您是否經常會因為一些您無法控制的事情而感到生氣? 0 1 2 3 4 C10. 您是否經常會覺得困難已經堆積如山(太多), 讓您無法克服? 0 1 2 3 4
第三部份 以下句子能反映我們與家人及朋友之間的關係, 請細心閱讀並選擇合適的答
案:
D1. 當我有需要時, 總有一個重要的人在我身邊支持著我。 1 2 3 4 5
D2. 當我想與別人分享喜樂和憂愁時, 總有一個重要的人給我傾
訴。
1 2 3 4 5
D3. 我的家人真的嘗試去幫助我。 1 2 3 4 5
D4. 我能夠在家庭中找到情緒上的支持和幫助。 1 2 3 4 5
D5. 我能找到一個重要的人, 他/她是我感到安慰的來源。 1 2 3 4 5
D6. 我的朋友真的嘗試去幫助我。 1 2 3 4 5
D7. 當我感到事事不如意時,我能倚靠我的朋友。 1 2 3 4 5
D8. 我可以將我的疑難向家人傾訴。 1 2 3 4 5
D9. 我能夠找到合適的朋友分享我的喜樂和憂愁。 1 2 3 4 5
D10. 在我的生命中有這樣一個重要的人, 他/她關心我的感受。 1 2 3 4 5
D11. 我的家人樂於幫助我作決定。 1 2 3 4 5
D12. 我可以將我的疑難向朋友傾訴。
1 2 3 4 5
一直都會
常常會
有時候會
幾乎不會
從來不會
極同意
同意
一般
不同意
極不同意
一直都會

85
第四部份 請細心閱讀以下句子, 選出最能表達你上星期心情的一項, 並以「√」表示。
若沒有合適的句子, 請選擇最接近的一項。
E1. 0 □ 我不感到憂愁
1 □ 我感到悲哀, 憂愁
2 □ 我時常感到悲哀, 憂愁, 又不能擺脫
3 □ 我愁苦, 不快樂, 以至無法忍受
E2.
0 □ 我對未來不怎麼悲觀失望
1 □ 我對未來感到失望
2 □ 我感到沒有什麼可以寄望將來
3 □ 我感到未來毫無希望, 而事情也不會好轉
E3. 0 □ 我不覺得像失敗者
1 □ 我覺得比別人失敗的多
2 □ 當我回想生命時, 只見很多錯敗
3 □ 我覺得自己是個完全失敗的人 (如為人父母、丈夫、妻子、兒女等)
E4. 0 □ 我像以往一般享受所作的事
1 □ 我不享受以往作的事
2 □ 我再不能從任何事取得滿足
3 □ 我對任何事都感到不滿、煩悶
E5. 0 □ 我不感到怎樣內疚
1 □ 我很多時間感到內疚
2 □ 我大部份時間感到內疚
3 □ 我無時無刻感到內疚
E6. 0 □ 我不感到自己被懲罰
1 □ 我感到自己也許會被懲罰
2 □ 我期望自己會被懲罰
3 □ 我覺得自己正在被懲罰
E7. 0 □ 我對自己不感到失望
1 □ 我對自己失望
2 □ 我討厭自己
3 □ 我憎恨自己
E8. 0 □ 我不感到自己比別人差
1 □ 我因自己的弱點及錯失而自責
2 □ 我無時無刻都怪責自己的錯失
3 □ 我為每件發生的不如意事怪責自己
E9.
0 □ 我沒有任何自殺的念頭
1 □ 我有自殺的念頭, 但卻不會實行
2 □ 我希望自殺

86
3 □ 若有機會, 我會自殺
E10. 0 □ 我沒有比平常哭得多
1 □ 我現在比以前哭得多
2 □ 我現在時常哭
3 □ 我以前是會哭的, 現在卻想哭也不能
E11. 0 □ 我沒有比前多憤怒
1 □ 我比以前容易激動、生氣
2 □ 我現在時常感到憤怒
3 □ 我連以往令我氣惱的事也感麻木了
E12. 0 □ 我沒有失去對別人的興趣
1 □ 我對別人的興趣比以前少了
2 □ 我對別人幾乎失了興趣
3 □ 我對別人完全失了興趣
E13. 0 □ 我作決定的能力如以往一樣
1 □ 我放棄作決定比以前多
2 □ 我比以前更難作出決定
3 □ 我已不能作任何決定
E14. 0 □ 我不感到外貌比以前差
1 □ 我擔心自己看來老了, 不吸引
2 □ 我感到自己外貌有永久性的改變, 令我看來不吸引
3 □ 我相信自己外貌醜陋
E15. 0 □ 我能像以往一般的工作
1 □ 我要份外費神才能開始作事
2 □ 我要很辛苦迫自己才可作事
3 □ 我什麼事也做不來
E16. 0 □ 我的睡眠如平常一樣
1 □ 我沒有睡得像以前那麼好
2 □ 我比往常早醒一兩小時, 而很難再入睡
3 □ 我比往常早醒數小時, 而不能再入睡
E17. 0 □ 我不比以前多感疲倦
1 □ 我比以前容易疲倦
2 □ 我做任何事都感到疲倦
3 □ 我實在太累去做任何事
E18. 0 □ 我胃口沒有比以前差
1 □ 我胃口沒有以往那麼好
2 □ 我胃口比以往差很多
3 □ 我完全沒有胃口

87
E19. 0□ 我近來沒有減輕體重
1□ 我體重減了 5 磅以上
2□ 我體重減了 10 磅以上
3□ 我體重減了 15 磅以上
E20. 我正在嘗試以節食減輕體重
0□ 是
1□ 否
E21. 0□ 我沒有比以前多憂慮自己的健康
1□ 我在擔心身體的問題, 如酸軟、疼痛、腸胃不適、便秘等
2□ 我很擔心身體的問題, 以至很難理會其他事
3□ 我非常擔心身體的問題, 以至完全無法去想其他事
E22. 0□ 我近來沒有發覺對性的興趣有改變
1□ 我對性的興趣比以前減了
2□ 我現在對性大大減了興趣
3□ 我完全對性失去了興趣
第五部份
F1. 您曾否吸煙? 1□ 從來沒有吸煙
2□ 曾經吸煙,但現已戒掉
3□ 現有吸煙的習慣,雖曾經戒煙
4□ 現有吸煙的習慣,但現正嘗試戒煙
5□ 現有吸煙的習慣,亦從未試過戒煙
F2. 過去 3 個月, 您飲用含酒精飲品的
習慣大概怎樣?
1□從來沒有飲用含酒精飲品
2□ 每月少於 1 次
3□ 每月 1-3 次
4□ 每星期 1 次
5□ 每星期 2-3 次
6□ 每星期 4-6 次
7□ 每日飲用含酒精飲品
8□ 其他, 請註明:________________
F3. 在過去 3 個月內,您有幾經常做康
樂運動超過三十分鐘?
1□ 沒有
2□ 差不多從沒有 / 每月少於 1 次
3□ 有,每月約 1-3 次
4□ 有,每星期約 1-2 次
5□ 有,每星期約 3-5 次
6□ 有,每天都有運動/差不多每天都運動

88
7□ 其他, 請註明:______________

89
個人資料
F4. 性別: 0 □ 男 1□ 女
F5. 最高學歷: 1□ 大專 (副學士, 高級文憑, IVE)
2□ 學位 年級: _________ GPA: _____________
( CGPA: ______________ )
3□ 碩士或以上
F5. 年齡: ______________________
<<全卷完>>


