Pursuing Global Insurance ProfitabilityAmid Tempered Economic Growth
Primary Credit Analysts:
Patricia A Kwan, New York (1) 212-438-6256; [email protected]
Jose M Perez-Gorozpe, Mexico City (52) 55-5081-4442; [email protected]
Mark Button, London (44) 20-7176-7045; [email protected]
Secondary Contacts:
Kevin T Ahern, New York (1) 212-438-7160; [email protected]
Matthew T Carroll, CFA, New York (1) 212-438-3112; [email protected]
Joseph N Marinucci, New York (1) 212-438-2012; [email protected]
Taoufik Gharib, New York (1) 212-438-7253; [email protected]
Amalia Bulacios, Buenos Aires (54) 11-4891-2156; [email protected]
Philip P Chung, CFA, Singapore (65) 6239-6343; [email protected]
Connie Wong, Singapore (65) 6239-6353; [email protected]
Ayako Nakajima, Tokyo (81) 3-4550-8750; [email protected]
Simon Ashworth, London (44) 20-7176-7243; [email protected]
Carmi Margalit, CFA, New York (1) 212-438-2281; [email protected]
Dennis P Sugrue, London (44) 20-7176-7056; [email protected]
Research Contributor:
Vinay Jonnakuti, CRISIL Global Analytical Center, an S&P affiliate, Mumbai
Research Assistant:
Michael L Forbes, London
Table Of Contents
A Quick Roundup of Global Ratings: 2014 Versus 2013
Where Do Insurers Get Their Profits?
Asia-Pacific: Despite China's Slowdown, Insurers' Premium Growth Should
Be Solid
Latin America: Colombia Just Might Lead The Pack
Western Europe And CEEMEA: Enough Headwinds To Form A Hurricane
WWW.STANDARDANDPOORS.COM/RATINGSDIRECT MARCH 30, 2015 1
1391435 | 301967406
Table Of Contents (cont.)
North America Capital And Earnings: Robust Capital, But Earnings... Not So
Much
Financial Flexibility Ratios: 2014-2016 Coverage And Leverage
A One-Way Relationship On The Downside
Related Criteria And Research
WWW.STANDARDANDPOORS.COM/RATINGSDIRECT MARCH 30, 2015 2
1391435 | 301967406
Pursuing Global Insurance Profitability AmidTempered Economic Growth
When it comes to finding earnings growth in 2015, the challenge facing the global insurance industry will be uneven
economic conditions in many parts of the world. The foremost obstacle insurers will confront is the widely varying
prospects for economic growth from region to region. Making profitability even more difficult are extraordinarily low
interest rates (negative, in some cases), which will likely stay lower for longer, particularly in the eurozone. In addition,
insurers in many regions must cope with tighter capital standards, weak pricing due to excess capital, or stricter
regulatory controls on product design and distribution in some markets. Standard & Poor's Ratings Services expects
sectors exposed to these elements--especially Western Europe life insurance and global property/casualty (P/C)
reinsurance--to see negative rating actions outnumbering positive ones (see Global Insurance Credit Outlook 2015:
Policymakers Prolong Pain For Developed Markets' Insurers , published Dec. 10, 2014, on RatingsDirect).
However, we believe that, all things are considered, our rated insurers will show steady earnings growth overall
despite the difficult economies in which many are operating. And when it comes to rates of earnings growth, insurers
in developing markets will likely fare better this year and next than those in developed markets.
Overview
• Global insurers face several obstacles to earnings growth, including slack economies and extraordinarily low
interest rates.
• Many insurers will have to contend with tighter capital standards, weak pricing, or stricter regulations on
product design and distribution.
• Earnings growth overall should rise, but developing market insurers (13% to 20% growth) are likely to outrun
those in more mature markets (about 5%).
• The relationship between earnings and ratings isn't simple: Rising earnings growth alone doesn't necessarily
lead to higher ratings, but weak earnings generally weigh on ratings.
Generally supporting many of our rated insurers globally is their prospective capital redundancy, which we view as
predominantly strong--redundant at the 'A' level--largely buffered by stable earnings, investment assets with high credit
quality, and strong liquidity.
On aggregate, we see global insurance earnings trending modestly higher, clipping at around 6%-7% year-over-year
through 2016. On a regional basis, we expect relatively robust earnings momentum from Asia-Pacific (APAC, 13%
year-over-year), Latin America (LatAm, 18%), and CEEMEA (20%), while North America and Western Europe are
likely to show moderate to soft earnings trajectories (both at about 5%). These regional variations reflect our view of
the fast- and-slow growth opportunities that differentiate the developing and developed markets.
WWW.STANDARDANDPOORS.COM/RATINGSDIRECT MARCH 30, 2015 3
1391435 | 301967406
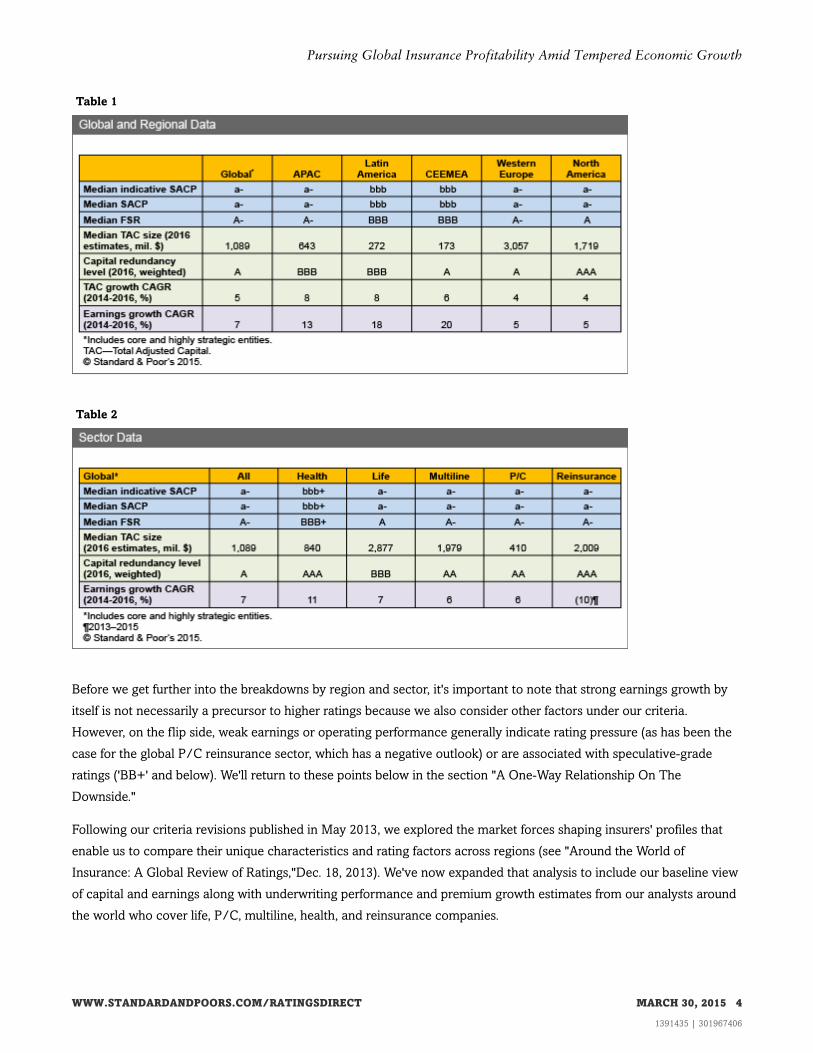
Table 1
Table 2
Before we get further into the breakdowns by region and sector, it's important to note that strong earnings growth by
itself is not necessarily a precursor to higher ratings because we also consider other factors under our criteria.
However, on the flip side, weak earnings or operating performance generally indicate rating pressure (as has been the
case for the global P/C reinsurance sector, which has a negative outlook) or are associated with speculative-grade
ratings ('BB+' and below). We'll return to these points below in the section "A One-Way Relationship On The
Downside."
Following our criteria revisions published in May 2013, we explored the market forces shaping insurers' profiles that
enable us to compare their unique characteristics and rating factors across regions (see "Around the World of
Insurance: A Global Review of Ratings,"Dec. 18, 2013). We've now expanded that analysis to include our baseline view
of capital and earnings along with underwriting performance and premium growth estimates from our analysts around
the world who cover life, P/C, multiline, health, and reinsurance companies.
WWW.STANDARDANDPOORS.COM/RATINGSDIRECT MARCH 30, 2015 4
1391435 | 301967406
Pursuing Global Insurance Profitability Amid Tempered Economic Growth
A Quick Roundup of Global Ratings: 2014 Versus 2013
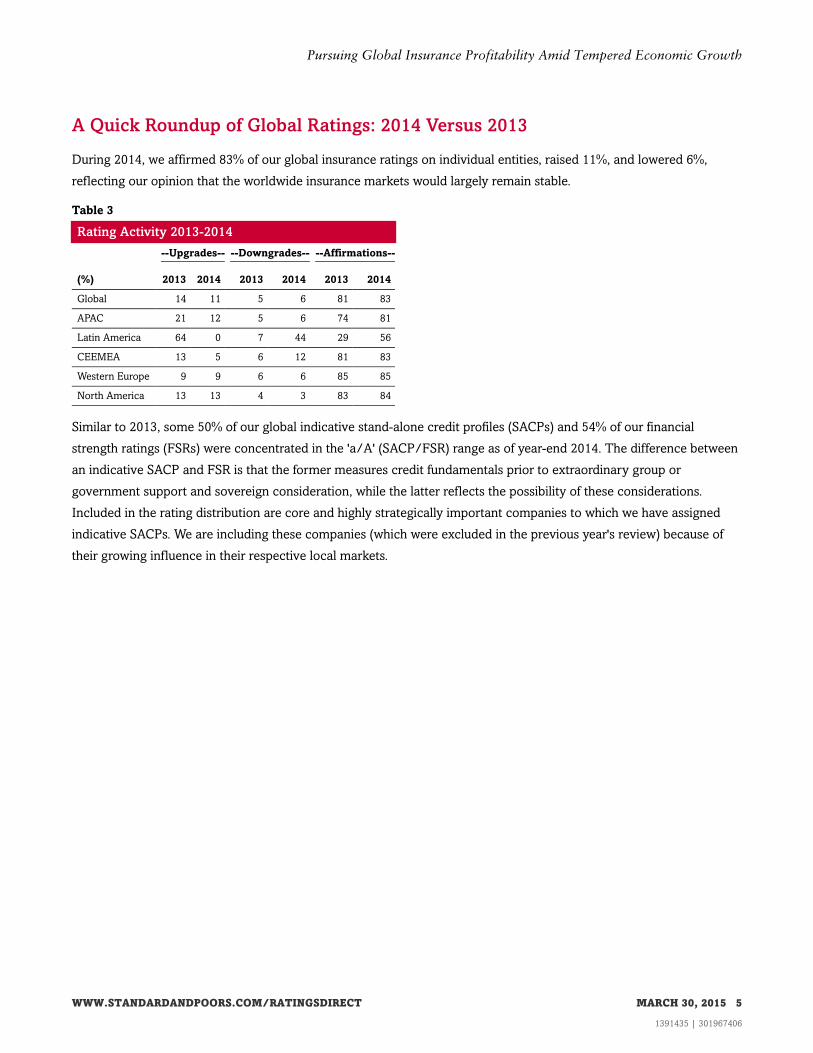
During 2014, we affirmed 83% of our global insurance ratings on individual entities, raised 11%, and lowered 6%,
reflecting our opinion that the worldwide insurance markets would largely remain stable.
Table 3
Rating Activity 2013-2014
--Upgrades-- --Downgrades-- --Affirmations--
(%) 2013 2014 2013 2014 2013 2014
Global 14 11 5 6 81 83
APAC 21 12 5 6 74 81
Latin America 64 0 7 44 29 56
CEEMEA 13 5 6 12 81 83
Western Europe 9 9 6 6 85 85
North America 13 13 4 3 83 84
Similar to 2013, some 50% of our global indicative stand-alone credit profiles (SACPs) and 54% of our financial
strength ratings (FSRs) were concentrated in the 'a/A' (SACP/FSR) range as of year-end 2014. The difference between
an indicative SACP and FSR is that the former measures credit fundamentals prior to extraordinary group or
government support and sovereign consideration, while the latter reflects the possibility of these considerations.
Included in the rating distribution are core and highly strategically important companies to which we have assigned
indicative SACPs. We are including these companies (which were excluded in the previous year's review) because of
their growing influence in their respective local markets.
WWW.STANDARDANDPOORS.COM/RATINGSDIRECT MARCH 30, 2015 5
1391435 | 301967406
Pursuing Global Insurance Profitability Amid Tempered Economic Growth
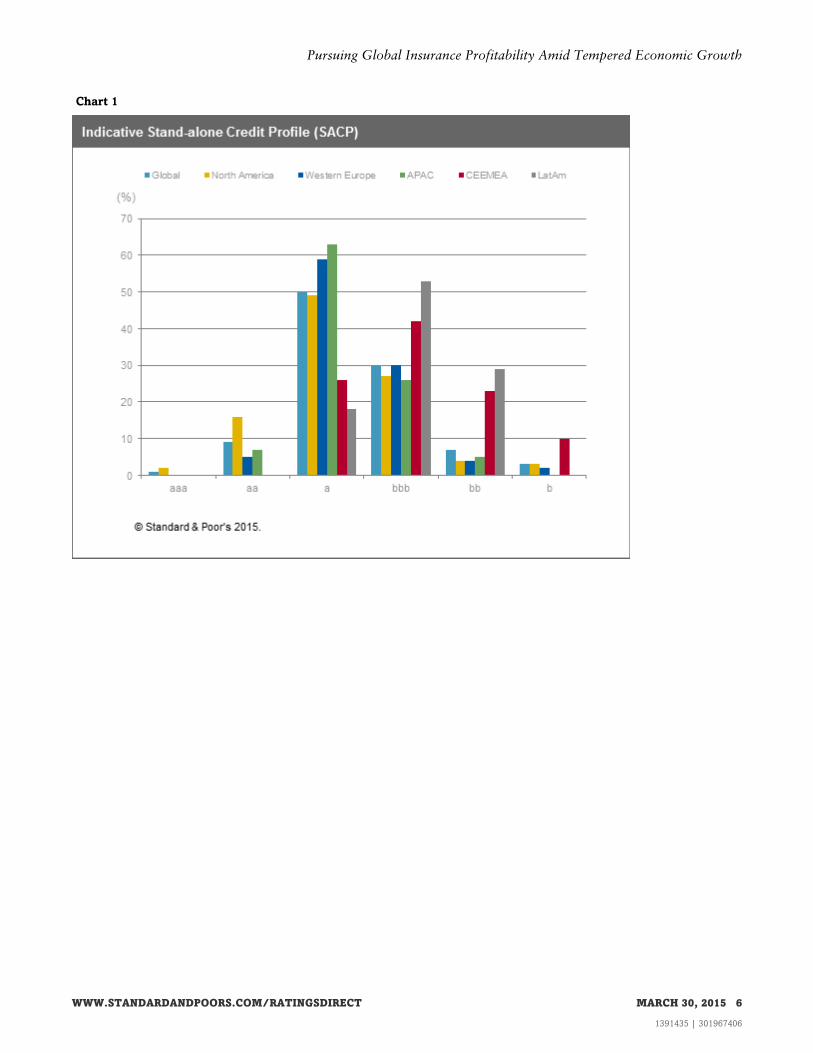
Chart 1
WWW.STANDARDANDPOORS.COM/RATINGSDIRECT MARCH 30, 2015 6
1391435 | 301967406
Pursuing Global Insurance Profitability Amid Tempered Economic Growth
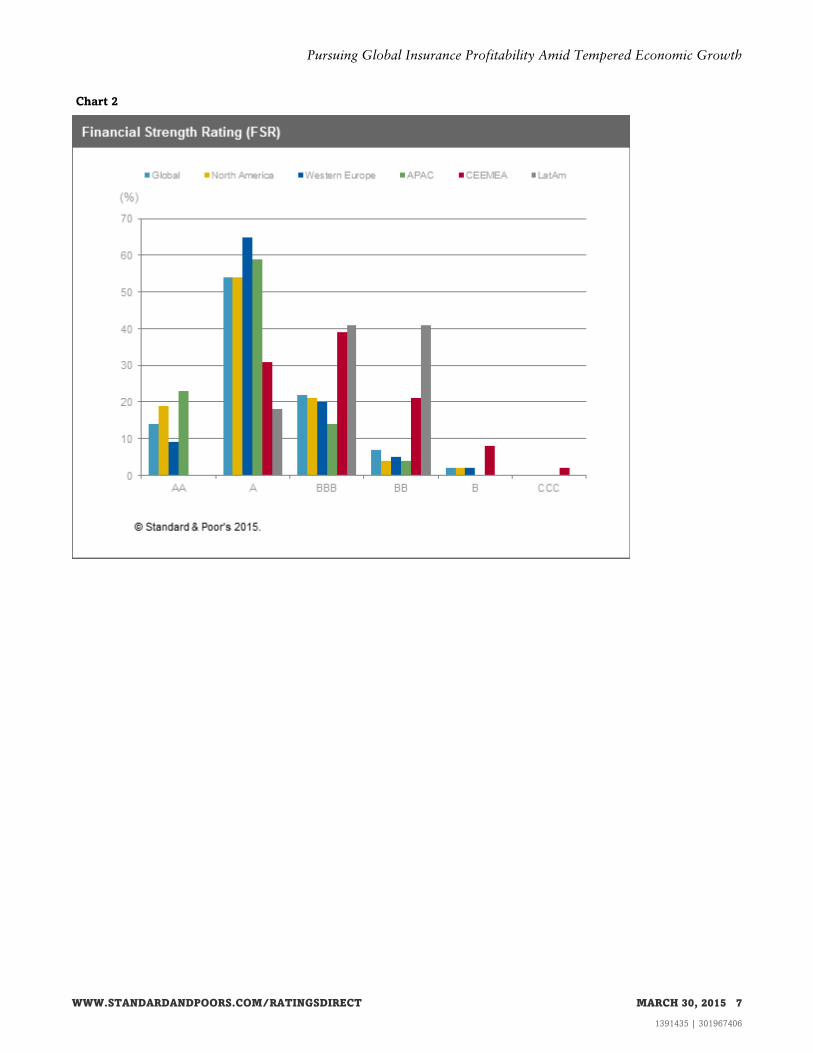
Chart 2
WWW.STANDARDANDPOORS.COM/RATINGSDIRECT MARCH 30, 2015 7
1391435 | 301967406
Pursuing Global Insurance Profitability Amid Tempered Economic Growth
Chart 3
WWW.STANDARDANDPOORS.COM/RATINGSDIRECT MARCH 30, 2015 8
1391435 | 301967406
Pursuing Global Insurance Profitability Amid Tempered Economic Growth
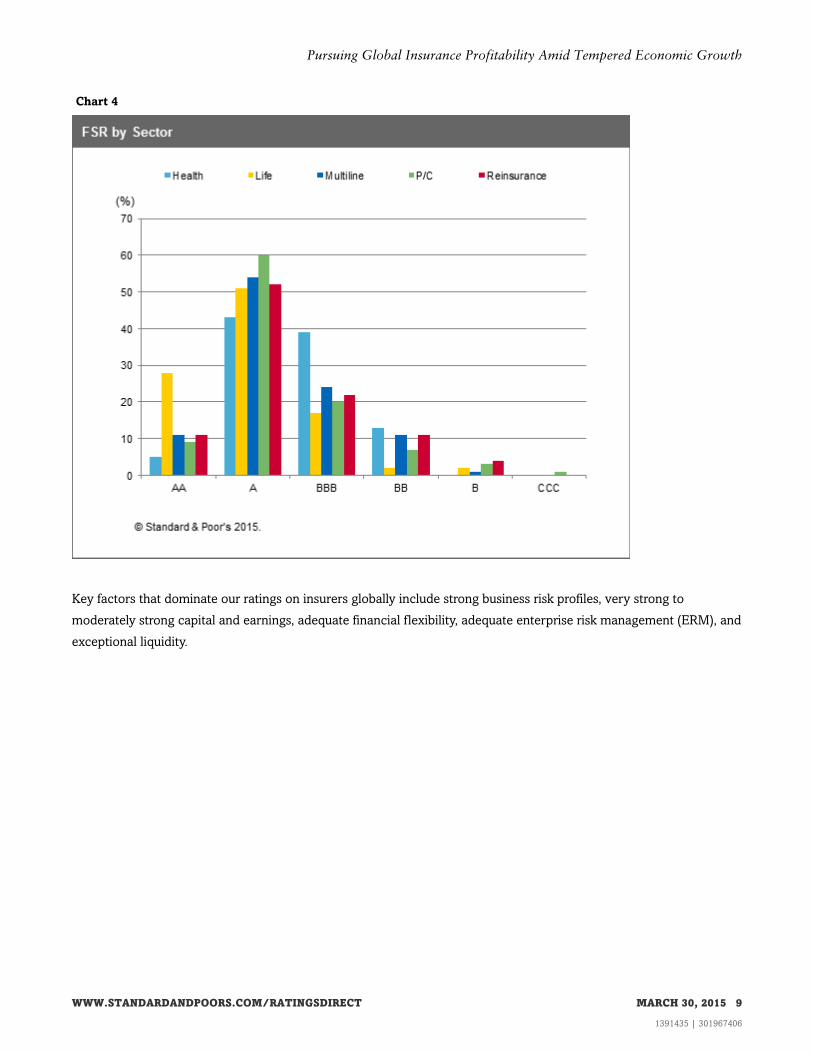
Chart 4
Key factors that dominate our ratings on insurers globally include strong business risk profiles, very strong to
moderately strong capital and earnings, adequate financial flexibility, adequate enterprise risk management (ERM), and
exceptional liquidity.
WWW.STANDARDANDPOORS.COM/RATINGSDIRECT MARCH 30, 2015 9
1391435 | 301967406
Pursuing Global Insurance Profitability Amid Tempered Economic Growth
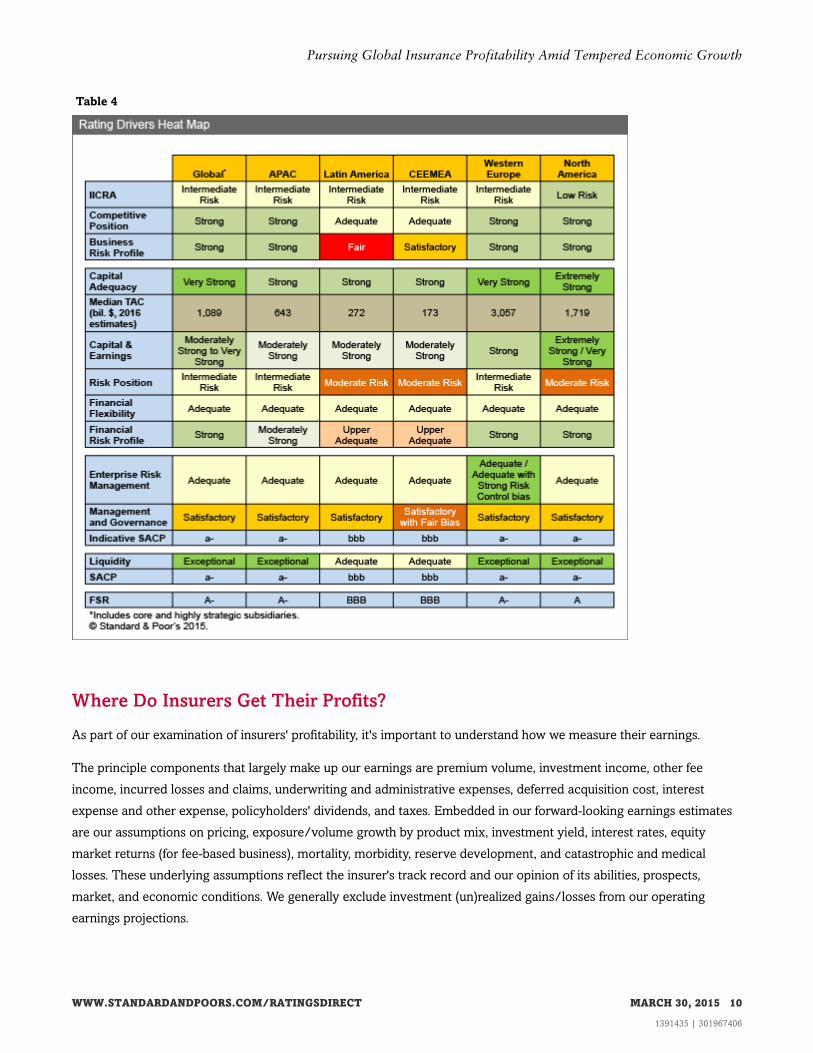
Table 4
Where Do Insurers Get Their Profits?
As part of our examination of insurers' profitability, it's important to understand how we measure their earnings.
The principle components that largely make up our earnings are premium volume, investment income, other fee
income, incurred losses and claims, underwriting and administrative expenses, deferred acquisition cost, interest
expense and other expense, policyholders' dividends, and taxes. Embedded in our forward-looking earnings estimates
are our assumptions on pricing, exposure/volume growth by product mix, investment yield, interest rates, equity
market returns (for fee-based business), mortality, morbidity, reserve development, and catastrophic and medical
losses. These underlying assumptions reflect the insurer's track record and our opinion of its abilities, prospects,
market, and economic conditions. We generally exclude investment (un)realized gains/losses from our operating
earnings projections.
WWW.STANDARDANDPOORS.COM/RATINGSDIRECT MARCH 30, 2015 10
1391435 | 301967406
Pursuing Global Insurance Profitability Amid Tempered Economic Growth
Many insurers operating in APAC, LatAm, and CEEMEA are experiencing double-digit premium and earnings growth,
exceeding those measures in comparison to companies operating in North America and Western Europe. The
common characteristics that differentiate our high-growth insurers are that they operate in countries that are typically
densely populated, with a strong or growing middle class (for example, China, Mexico, Brazil, and South Africa),
markets that are less fragmented (China, Japan, Colombia, and Korea) or where insurance penetration is low
(Colombia, China, Thailand, Mexico, Brazil, Bahrain, Kuwait, Russia, and United Arab Emirates).
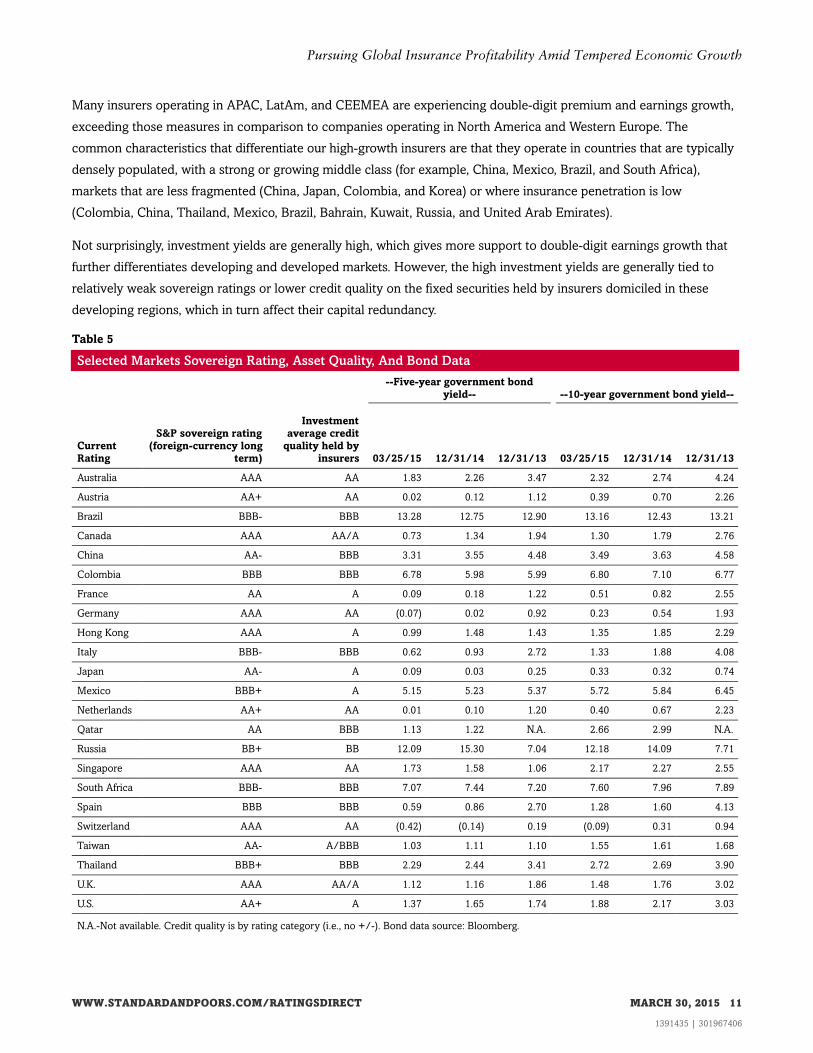
Not surprisingly, investment yields are generally high, which gives more support to double-digit earnings growth that
further differentiates developing and developed markets. However, the high investment yields are generally tied to
relatively weak sovereign ratings or lower credit quality on the fixed securities held by insurers domiciled in these
developing regions, which in turn affect their capital redundancy.
Table 5
Selected Markets Sovereign Rating, Asset Quality, And Bond Data
--Five-year government bond
yield-- --10-year government bond yield--
Current
Rating
S&P sovereign rating
(foreign-currency long
term)
Investment
average credit
quality held by
insurers 03/25/15 12/31/14 12/31/13 03/25/15 12/31/14 12/31/13
Australia AAA AA 1.83 2.26 3.47 2.32 2.74 4.24
Austria AA+ AA 0.02 0.12 1.12 0.39 0.70 2.26
Brazil BBB- BBB 13.28 12.75 12.90 13.16 12.43 13.21
Canada AAA AA/A 0.73 1.34 1.94 1.30 1.79 2.76
China AA- BBB 3.31 3.55 4.48 3.49 3.63 4.58
Colombia BBB BBB 6.78 5.98 5.99 6.80 7.10 6.77
France AA A 0.09 0.18 1.22 0.51 0.82 2.55
Germany AAA AA (0.07) 0.02 0.92 0.23 0.54 1.93
Hong Kong AAA A 0.99 1.48 1.43 1.35 1.85 2.29
Italy BBB- BBB 0.62 0.93 2.72 1.33 1.88 4.08
Japan AA- A 0.09 0.03 0.25 0.33 0.32 0.74
Mexico BBB+ A 5.15 5.23 5.37 5.72 5.84 6.45
Netherlands AA+ AA 0.01 0.10 1.20 0.40 0.67 2.23
Qatar AA BBB 1.13 1.22 N.A. 2.66 2.99 N.A.
Russia BB+ BB 12.09 15.30 7.04 12.18 14.09 7.71
Singapore AAA AA 1.73 1.58 1.06 2.17 2.27 2.55
South Africa BBB- BBB 7.07 7.44 7.20 7.60 7.96 7.89
Spain BBB BBB 0.59 0.86 2.70 1.28 1.60 4.13
Switzerland AAA AA (0.42) (0.14) 0.19 (0.09) 0.31 0.94
Taiwan AA- A/BBB 1.03 1.11 1.10 1.55 1.61 1.68
Thailand BBB+ BBB 2.29 2.44 3.41 2.72 2.69 3.90
U.K. AAA AA/A 1.12 1.16 1.86 1.48 1.76 3.02
U.S. AA+ A 1.37 1.65 1.74 1.88 2.17 3.03
N.A.-Not available. Credit quality is by rating category (i.e., no +/-). Bond data source: Bloomberg.
WWW.STANDARDANDPOORS.COM/RATINGSDIRECT MARCH 30, 2015 11
1391435 | 301967406
Pursuing Global Insurance Profitability Amid Tempered Economic Growth
Companies experiencing double-digit earnings growth are generally small, with a median capital size of less than $300
million, compared with the global median we estimate at $1.1 billion. Notwithstanding their strong earnings growth,
their annual median net income of $19 million (in absolute dollars) pales in comparison with insurers operating in
North America and Western Europe, where annual median net income exceeds $100 million.
Table 6
Median TAC And Income
--2016 estimates--
(Mil. $)
Median TAC Median income
Net income combined annual growth rate (CAGR)
(2014-16) (%)
TAC CAGR (2014-16)
(%)
Global 1,089 82 7 5
APAC 643 36 13 8
LatAm 272 14 18 8
CEEMEA 173 15 20 6
Western Europe 3,057 126 5 4
North America 1,719 133 5 4
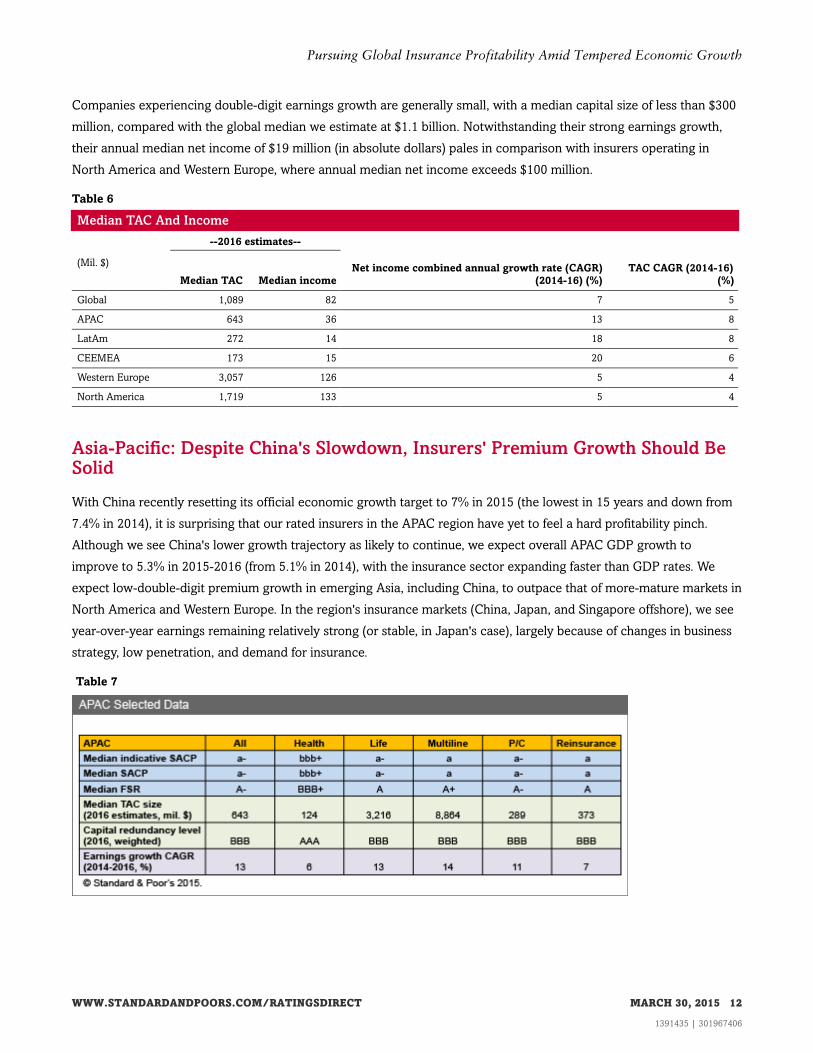
Asia-Pacific: Despite China's Slowdown, Insurers' Premium Growth Should BeSolid
With China recently resetting its official economic growth target to 7% in 2015 (the lowest in 15 years and down from
7.4% in 2014), it is surprising that our rated insurers in the APAC region have yet to feel a hard profitability pinch.
Although we see China's lower growth trajectory as likely to continue, we expect overall APAC GDP growth to
improve to 5.3% in 2015-2016 (from 5.1% in 2014), with the insurance sector expanding faster than GDP rates. We
expect low-double-digit premium growth in emerging Asia, including China, to outpace that of more-mature markets in
North America and Western Europe. In the region's insurance markets (China, Japan, and Singapore offshore), we see
year-over-year earnings remaining relatively strong (or stable, in Japan's case), largely because of changes in business
strategy, low penetration, and demand for insurance.
Table 7
WWW.STANDARDANDPOORS.COM/RATINGSDIRECT MARCH 30, 2015 12
1391435 | 301967406
Pursuing Global Insurance Profitability Amid Tempered Economic Growth
China: Pressure points build amid a growing market
China has the fastest-growing insurance market, and it still has room to expand, thanks to the macroeconomic
tailwinds propelled by a large population and a booming middle class. In addition, the Chinese government is
encouraging deeper insurance penetration during the next few years. But pressure points are building as regulators
push for stronger risk and capital management, which may further squeeze capital that is already tight as it supports
the increased risk exposure accompanying the ongoing premium expansion.
Our credit outlook on China's life insurance sector is stable, reflecting our confidence about growth prospects and
strategies, particularly compared with two to three years ago when many life products distributed through
bancassurance had shorter maturities with less emphasis on protection and lower margins. Premiums generated
through bancassurance dropped to 37% of total life insurance premiums in 2013 from 50% in 2010. We see more life
players emphasizing value creation, profitability, and agency productivity, which should help to stabilize earnings. The
life insurance sector should benefit from resumed strong growth in premium income and an increasing emphasis on
value creation during the next few years. We expect premiums to grow by about 10% annually during the next two
years, compared with 20% in the first nine months of 2014 and 8% in 2013.
Our outlook on the Chinese non-life sector is stable. We expect the industry to grow about 15% and the combined
ratio to stay close to 100% in 2015 and 2016, suggesting a thin underwriting profit due to soft pricing and steep
competition (the combined ratio is a key metric of insurers' profitability, with readings below 100% showing stronger
profitability). Pricing on both motor and property insurance is likely to remain soft through 2016, which may prompt
non-life insurers to diversify to other product lines.
For instance, growth in agricultural insurance has been particularly noticeable, with premiums more than doubling
during the past three years. But only a few insurers could benefit from the agricultural insurance business. We believe
it will be tough for new entrants to compete with the incumbents--PICC Property and Casualty Co. Ltd. and China
United Insurance Holding Co. Ltd.--due to the need for an extensive network and expertise in the agricultural sector.
However, we also see potential for material losses insuring agricultural business. Meaningful geographic diversity
would be important to mitigate this possible impact. China's agricultural insurance market, subsidized by the
government, is the second-largest following the U.S.
Japan: Modest improvements in 2015
Many of Japan's life and non-life insurers boosted their investment profits and capitalization in 2014, thanks to the
stock market recovery and weakness in the yen, which tend to benefit investment income for Japanese insurers who
have more foreign fixed-security investments. With the Nikkei continuing to trade higher, we believe many of our rated
large Japanese insurers will see modest improvements in their earnings and capital levels in 2015.
Declines in long-term interest rates will likely hamper the life insurance sector. The yield on 10-year Japanese
government bonds, which exceeded 0.7% as of the end of 2013, dipped to less than 0.4% in January 2015. We believe
it will remain low for the rest of the year. Major life insurers had seen their interest rate spreads improve gradually in
recent years due to declines in average guaranteed rates of interest, but we believe further declines will hamper future
earnings improvement. It is becoming even more difficult for insurers to lengthen asset duration by investing in
ultra-long bonds because the yields of such bonds are also dropping. Life insurers are likely to invest more in foreign
WWW.STANDARDANDPOORS.COM/RATINGSDIRECT MARCH 30, 2015 13
1391435 | 301967406
Pursuing Global Insurance Profitability Amid Tempered Economic Growth
bonds and seek new avenues such as infrastructure to maintain investment income. However, we believe it will be
difficult for them to improve investment yields significantly because they are unlikely to change their investment
portfolios drastically and worldwide interest rates are low.
For the non-life insurance sector, we expect underwriting performance either to remain flat in 2015 or slightly improve
from 2014, barring any large catastrophe losses. In fiscal 2013, the three major non-life insurance groups--Tokio
Marine Group, MS&AD Insurance Group, and Sompo Japan Nipponkoa Group--saw their underwriting performance
improve substantially, with the combined ratio of their non-life insurance segments falling to less than 100% (which
indicates underwriting profit). We don't believe underwriting performance will improve dramatically in 2015, because
each group has been achieving the combined ratio target its management has set, and they currently don't plan to
make any major revisions in premium rates. Given that consumption tax hikes hurt non-life insurers' profitability, the
postponement of the government's decision to delay the second increase in that tax to 10% from the current 8% would
benefit them in the short term. We expect to see the impact of the second consumption tax hike in fiscal 2017 (ending
March 31, 2018) and beyond, but we believe that insurers can mostly absorb this effect by cutting operating expenses
and raising premium rates.
Singapore: Regional growth should keep offshore business growing
Singapore's fast growth as an insurance and reinsurance center in Asia-Pacific is no accident. While the government
enhanced Singapore's competitiveness through tax exemptions and concessions on selected offshore insurance
businesses, the Monetary Authority of Singapore (MAS) liberalized entry into the direct insurance industry and lifted
restrictions on foreign ownership of local insurers in 2000. That catalyzed the industry's development and growth.
Offshore gross insurance premiums in Singapore have quadrupled during the past 13 years amid the country's
conducive business and regulatory environment for insurance and reinsurance business. We expect economic growth
in Asia-Pacific to continue to fuel regional insurance demand and development of the industry in Singapore.
Singapore's offshore insurance premiums rose to more than $4.8 billion in 2014 from $1.1 billion in 2000, representing
an average annual growth rate of about 11%. Offshore insurance and reinsurance premiums accounted for nearly
two-thirds of total market premiums in 2014, reflecting the magnitude and significance of the overseas business to the
overall Singapore insurance marketplace. The moderate 5.9% growth rate in 2012 gradually improved to 8.8% in 2013
and 10.6% in 2014. And we expect a similar strong premium growth trajectory in 2015 and 2016, though underwriting
profit is less predictable. Due to the regional catastrophe in 2011 (Thailand flood), the combined ratio for insurers and
reinsurers writing business to Singapore's offshore insurance fund rose sharply to 297% in that year. But during the
benign catastrophic years of 2012 and 2013, the combined ratios were 80.5% and 74.5%, respectively.
For the Singapore non-life sector (excluding offshore business), premium growth has been less robust, and we expect it
to remain that way. The Singapore insurance market is relatively mature and we continue to see margin pressure on
profitable lines of business. The premium growth rate slowed to about 2% in 2014 from 3.1% in 2013 and 5.9% in
2012. We expect non-life premium growth to remain less than 5% in 2015. Nevertheless, the sector will likely remain
highly profitable with a combined ratio of less than 90%, consistent with the average of 88.5% during the past five
years.
WWW.STANDARDANDPOORS.COM/RATINGSDIRECT MARCH 30, 2015 14
1391435 | 301967406
Pursuing Global Insurance Profitability Amid Tempered Economic Growth
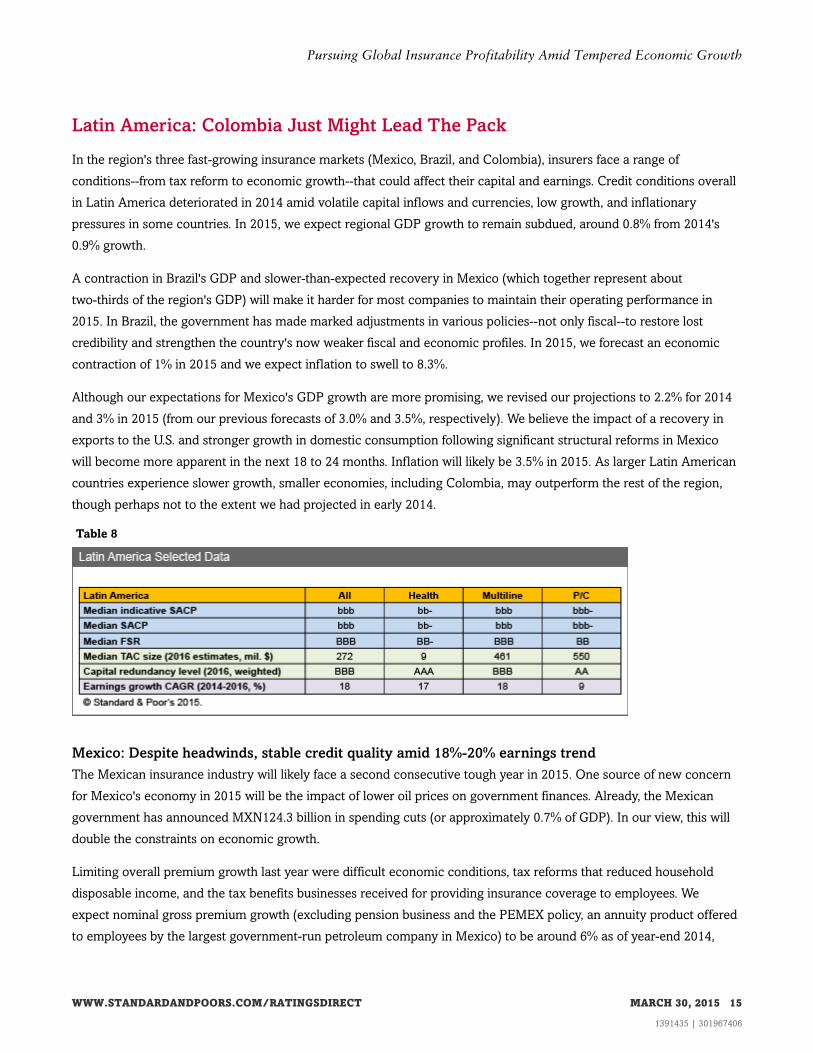
Latin America: Colombia Just Might Lead The Pack
In the region's three fast-growing insurance markets (Mexico, Brazil, and Colombia), insurers face a range of
conditions--from tax reform to economic growth--that could affect their capital and earnings. Credit conditions overall
in Latin America deteriorated in 2014 amid volatile capital inflows and currencies, low growth, and inflationary
pressures in some countries. In 2015, we expect regional GDP growth to remain subdued, around 0.8% from 2014's
0.9% growth.
A contraction in Brazil's GDP and slower-than-expected recovery in Mexico (which together represent about
two-thirds of the region's GDP) will make it harder for most companies to maintain their operating performance in
2015. In Brazil, the government has made marked adjustments in various policies--not only fiscal--to restore lost
credibility and strengthen the country's now weaker fiscal and economic profiles. In 2015, we forecast an economic
contraction of 1% in 2015 and we expect inflation to swell to 8.3%.
Although our expectations for Mexico's GDP growth are more promising, we revised our projections to 2.2% for 2014
and 3% in 2015 (from our previous forecasts of 3.0% and 3.5%, respectively). We believe the impact of a recovery in
exports to the U.S. and stronger growth in domestic consumption following significant structural reforms in Mexico
will become more apparent in the next 18 to 24 months. Inflation will likely be 3.5% in 2015. As larger Latin American
countries experience slower growth, smaller economies, including Colombia, may outperform the rest of the region,
though perhaps not to the extent we had projected in early 2014.
Table 8
Mexico: Despite headwinds, stable credit quality amid 18%-20% earnings trend
The Mexican insurance industry will likely face a second consecutive tough year in 2015. One source of new concern
for Mexico's economy in 2015 will be the impact of lower oil prices on government finances. Already, the Mexican
government has announced MXN124.3 billion in spending cuts (or approximately 0.7% of GDP). In our view, this will
double the constraints on economic growth.
Limiting overall premium growth last year were difficult economic conditions, tax reforms that reduced household
disposable income, and the tax benefits businesses received for providing insurance coverage to employees. We
expect nominal gross premium growth (excluding pension business and the PEMEX policy, an annuity product offered
to employees by the largest government-run petroleum company in Mexico) to be around 6% as of year-end 2014,
WWW.STANDARDANDPOORS.COM/RATINGSDIRECT MARCH 30, 2015 15
1391435 | 301967406
Pursuing Global Insurance Profitability Amid Tempered Economic Growth
down from 8.1% in 2013 and 13.6% in 2012. In 2015, we expect the nominal gross premium growth rate to remain
around 6%-7%. Given the continued difficult economic conditions, we believe insurance companies will focus on
controlling expenses and strengthening investment income amid a less-competitive market in some segments, which
will likely bolster overall earnings this year. We expect net operating earnings to grow about 18%-20% in 2015, down
from 22.1% in 2014.
Industry wide, insurers were able to improve expense controls and investment results, and reduce losses, which
bolstered overall earnings in 2014. Notably, primary non-life insurers were able to limit weather-related catastrophic
losses through a strong level of reinsurance. This helped nonlife insurers record a net combined ratio of about 98% in
2014, even though Hurricane Odile was one of Mexico's worst catastrophic events in recent history, incurring an
estimated insured loss of MXN16.6 billion. We expect the nonlife insurers to report improved underwriting results with
a combined ratio around 92%-93% for 2015, compared with an average combined ratio of 94% from 2010 to
third-quarter 2014.
The competitive environment historically has been fierce as medium-to-large insurers fought for additional market
shares in profitable businesses such as auto insurance and personal life products. However, we believe the competition
will likely be tempered in 2015 because companies will pull back from aggressive pricing because operating results
deteriorated in recent years. In a shift of strategy, we believe many life and nonlife insurers will focus on underwriting
discipline and adequate pricing, although auto writers will still have a hard time increasing rates.
On the regulatory front, authorities gave Mexican insurers a small break when they delayed the new Solvency II
capitalization rules to 2016 from April 2015. These rules might require Mexican insurers to hold higher levels of capital
than they would otherwise to remain in good standing with the regulators. The regulators are still running different sets
of calibrations for capitalization, so the impact on insurers' capital remains uncertain. We have been following this
issue closely, and we believe our rated insurers (mostly midsize to large companies) will have fewer problems
complying with the new capital standards. Overall, despite the headwinds, we expect strong capital adequacy and
relatively stable credit among our rated insurers in 2015.
Brazil: Investment income will continue to power earnings
Improved investment yields and satisfactory underwriting performance have partially mitigated the challenging
economic conditions the Brazilian insurance industry has faced in recent years. However, we expect premium growth
to decline in 2015 amid a sluggish economy in Brazil. Although we expect non-life insurers to maintain adequate
underwriting discipline, we anticipate moderately soft pricing offset by strong investment income as insurers fight for
share in a competitive market. For the industry, we expect combined ratios to stay largely unchanged at around 100%
and investment income to remain the primary contributor to earnings in 2015.
We expect nominal premium growth for life (including Vida gerador de beneficio livre, the largest savings product sold
in Brazil) and non-life insurers at about 12%-14% and 10%-12%, respectively, in 2015. High investment yields will
likely keep these products attractive to consumers. Earnings growth for the primary insurance industry in Brazil will
likely hover around 7% in 2015, compared with 11% in 2014.
Improved operating performance as business scale and expertise increases underpins our stable outlook on our rated
Brazilian startup reinsurers. We see similar characteristics for nonrated reinsurers in Brazil. Lowered barriers to entry
WWW.STANDARDANDPOORS.COM/RATINGSDIRECT MARCH 30, 2015 16
1391435 | 301967406
Pursuing Global Insurance Profitability Amid Tempered Economic Growth
since 2008 have kept competition intense in the Brazilian reinsurance market. The growing number of reinsurers
entering the market will continue to squeeze profit margins, thanks to an excess supply of capital that limits pricing
power. We expect combined ratios for the Brazilian reinsurers to stay largely unchanged at around 100% in 2015,
compared with 99.6% as of third-quarter 2014, 105.6% in 2013, and 107.5% in 2012. Overall operating performance
will likely improve because of reduced expenses and strong investment income.
Although 2014's underwriting results were fair, overall operating earnings have improved on strong investment income
due to a spike in Brazilian government bond yields in 2013 (investment losses weren't significant because of short asset
duration). For 2015, we expect to see similarly strong investment income as the Brazilian yield will likely stay at its
current level. We expect that, as rated startup reinsurers gain expertise and economies of scale, they will increase
retention, improve combined ratios, and boost overall bottom-line profitability in 2015 and beyond. However, excess
capital will also likely decline from extremely strong levels.
Colombia: Life insurers' earnings trending up
Colombian non-life insurers continued registering underwriting losses in 2014, in line with their historical performance.
Ending in third-quarter 2014, their combined ratio was about 104%, slightly worse than the 102% average from 2009 to
2013. Even with the backdrop of good economic growth prospects for Colombia, we do not expect the weak
underwriting earnings to turn around in 2015 amid an increasingly competitive non-life market that is being flooded
with fresh capital.
Similar to Mexico and Brazil, investment income continues to be strong in Colombia. With investment yields
exceeding 7% through the first nine months of 2014, we expect operating earnings to grow for Colombian insurers in
2015. However, although life insurers reap the benefits of high investment yields, the same cannot be said for non-life
companies. As of Nov. 30, 2014, net earnings for life insurers grew nearly two-fold (132%) but non-life insurers grew
only 2.6%. For the latter, weak underwriting results largely offset strong investment income. Stiff competition has
increased expense ratios while losses, especially in auto insurance, steepened due to inadequate pricing and
corrections on underestimated loss reserves. Higher commissions are also contributing to rising expenses. We expect
operating performance among nonlife insurers to stay largely status quo, while life insurers' earnings are likely to trend
up for 2015.
In our opinion, low insurance penetration (premium volume as a percentage of GDP) of about 2.9% combined with
sound economic growth prospects and improving employment levels will support overall insurance premium growth
of about 8%-10% through 2016. We expect overall industry-wide combined life and non-life earnings of around
10%-12% in 2015. Nevertheless, we believe capital adequacy will remain lower adequate (below the 'BBB' confidence
level).
Western Europe And CEEMEA: Enough Headwinds To Form A Hurricane
Unlike the U.S. and U.K. economies, the European Economic and Monetary Union (EMU, or eurozone) is entering
2015 with weak tailwinds. Long-term government bond yields in the eurozone have declined to--or near--historic lows
in recent months, contributing to our view that business conditions are weak. The most recent indicators suggest that
eurozone growth remained modest in the final months of 2014. Flash estimates for the fourth quarter show a slight
WWW.STANDARDANDPOORS.COM/RATINGSDIRECT MARCH 30, 2015 17
1391435 | 301967406
Pursuing Global Insurance Profitability Amid Tempered Economic Growth
GDP pickup overall (0.3%), led by Germany and Spain (0.7% each), and France (0.1%), with Greece (negative 0.4%),
Finland (negative 0.2%), and Austria (negative 0.2 %) remaining weak. Given our forecast that eurozone
unemployment will stay high (though improved from 11.5% in 2014) at 11.2% and 11.0% for 2015 and 2016,
respectively, earnings and capital for some insurers could, to some extent, come under pressure from the continued
sluggish macroeconomic backdrop.
Ongoing extraordinarily low interest rates are a particular problem for life insurers. In the reinsurance sector, capacity
is outstripping demand, and competition continues to intensify even as the sector is consolidating. We expect this to
weigh on reinsurers' returns during the next 12 to 24 months. Combined, these factors could weaken creditworthiness
in the sector as pricing and competition pressures may erode business and financial risk profiles.
We believe negative rating actions could slightly outweigh positive rating actions during the next year for Europe's life
insurers and reinsurers. In this part of the world (including Western Europe and CEEMEA), 14% of our ratings on
insurers have negative outlooks or CreditWatches versus 8% with positive outlooks or CreditWatches. Nevertheless,
78% of our insurer ratings continue to carry stable outlooks--better than the global average for all corporate sectors of
about 70%--partially reflecting our view that capital and earnings will likely support the ratings for many of our
insurers.
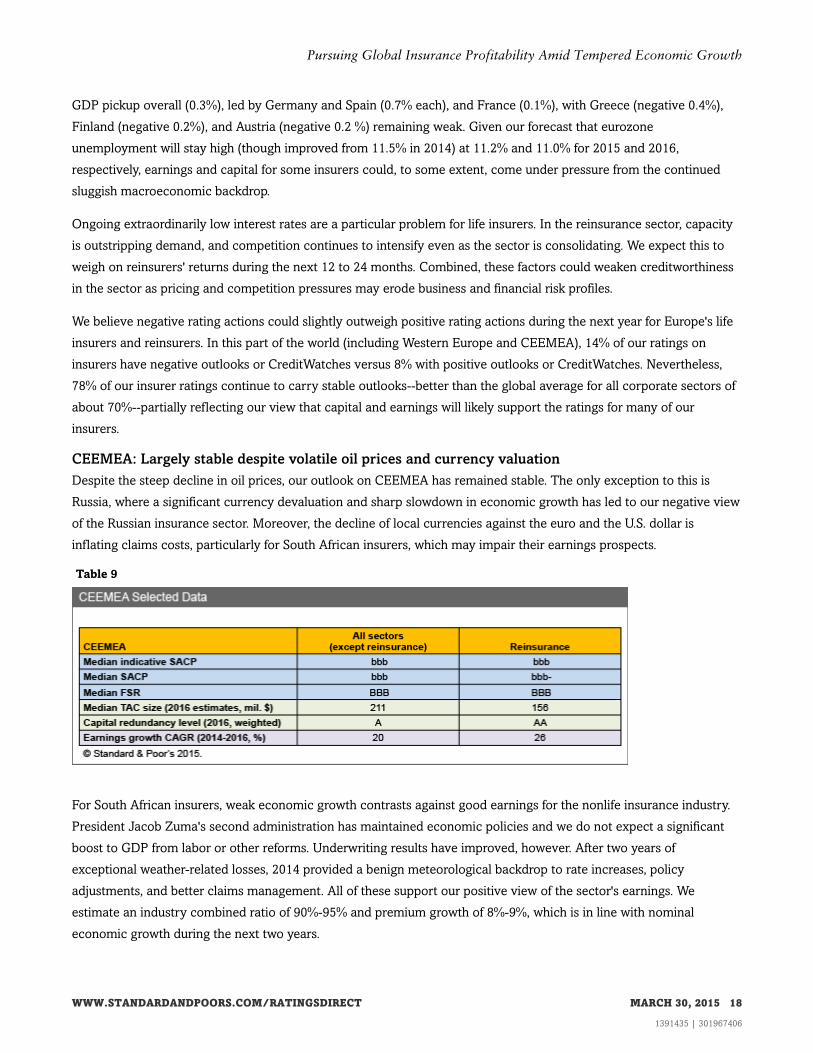
CEEMEA: Largely stable despite volatile oil prices and currency valuation
Despite the steep decline in oil prices, our outlook on CEEMEA has remained stable. The only exception to this is
Russia, where a significant currency devaluation and sharp slowdown in economic growth has led to our negative view
of the Russian insurance sector. Moreover, the decline of local currencies against the euro and the U.S. dollar is
inflating claims costs, particularly for South African insurers, which may impair their earnings prospects.
Table 9
For South African insurers, weak economic growth contrasts against good earnings for the nonlife insurance industry.
President Jacob Zuma's second administration has maintained economic policies and we do not expect a significant
boost to GDP from labor or other reforms. Underwriting results have improved, however. After two years of
exceptional weather-related losses, 2014 provided a benign meteorological backdrop to rate increases, policy
adjustments, and better claims management. All of these support our positive view of the sector's earnings. We
estimate an industry combined ratio of 90%-95% and premium growth of 8%-9%, which is in line with nominal
economic growth during the next two years.
WWW.STANDARDANDPOORS.COM/RATINGSDIRECT MARCH 30, 2015 18
1391435 | 301967406
Pursuing Global Insurance Profitability Amid Tempered Economic Growth
Historically, Russia's insurance market has been volatile and highly sensitivity to macroeconomic forces. Its situation
has been made more difficult by Western sanctions related to the conflict in Ukraine. Consequently, we expect
insurance sector growth to decelerate in 2014. Our premium growth projection was about 8%-10% in 2014, down from
13% in 2013 and 21% in 2012. We now believe premium growth could be very volatile in 2015, given the several
factors influencing premiums in different directions. But we believe growth in real terms will likely be flat at best
because of expected inflation and declining disposable income of the Russian population. We believe that Russian
insurers will try to increase rates in 2015 (particularly in motor vehicle physical damage) to cover foreign-exchange
volatility. Demand for insurance will consequently fall because retail clients' disposable income is not growing. We
already see that growth in corporate insurance, motor insurance--including obligatory motor third-party liability
(OMTPL) lines--motor vehicle physical damage, personal accident insurance, and retail property insurance is slowing
down.
The average combined ratio for the top-20 insurance companies in Russia is close to 100%, but deviation from this
average can be very high, with combined ratios varying from about 70% to almost 130%. Recent changes in the law on
OMTPL have increased limits of coverage and tariffs and introduced many technical changes in how claims are
settled. It is very hard to say what the effect on the loss ratio in this product line will be, given the magnitude of
changes, potential further changes under discussion, and areas that are still unregulated. In our base case, we believe
the OMTPL loss ratio will rise at least by one-to-two percentage points in 2015. This does not include an increase in
limits covering losses on life and health, which are likely to come into force in April 2015.
Competition is increasing as insurers chase fewer opportunities. Overall, we think Russian insurers will face another
tough year in 2015.
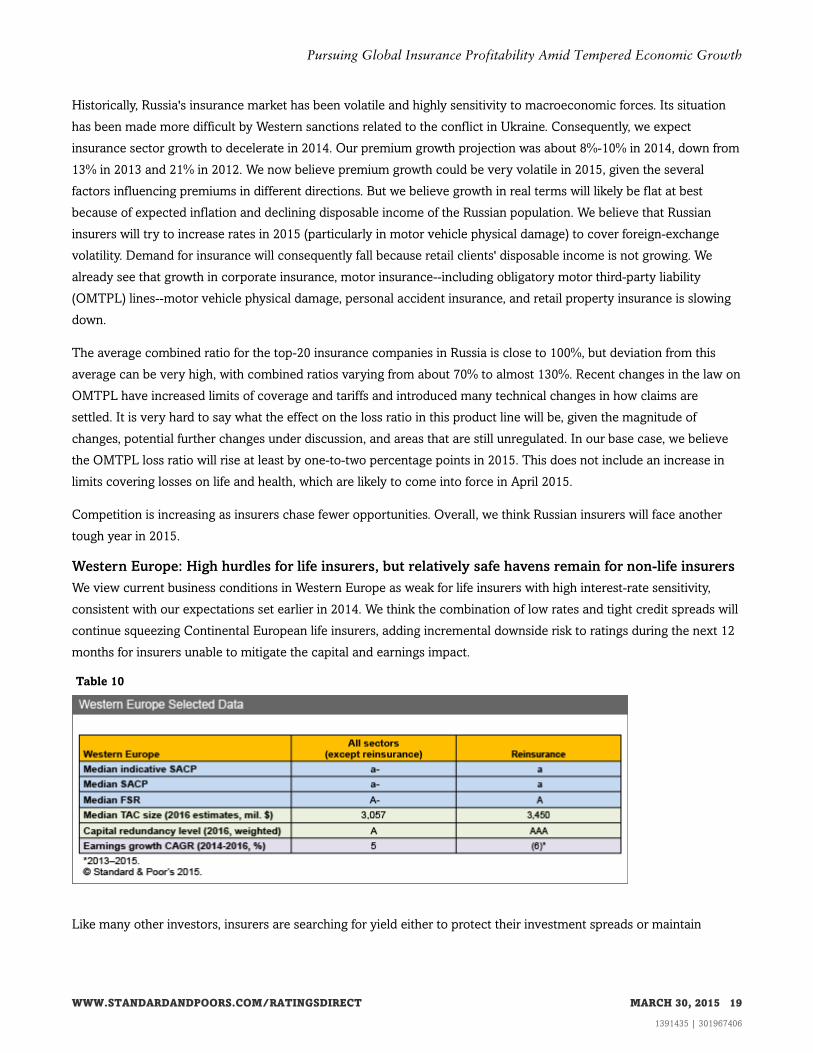
Western Europe: High hurdles for life insurers, but relatively safe havens remain for non-life insurers
We view current business conditions in Western Europe as weak for life insurers with high interest-rate sensitivity,
consistent with our expectations set earlier in 2014. We think the combination of low rates and tight credit spreads will
continue squeezing Continental European life insurers, adding incremental downside risk to ratings during the next 12
months for insurers unable to mitigate the capital and earnings impact.
Table 10
Like many other investors, insurers are searching for yield either to protect their investment spreads or maintain
WWW.STANDARDANDPOORS.COM/RATINGSDIRECT MARCH 30, 2015 19
1391435 | 301967406
Pursuing Global Insurance Profitability Amid Tempered Economic Growth
competitive policyholder returns. This is leading some insurers to assume additional credit, market, or liquidity risk.
Insurers that lack the capital to absorb these additional risks are more likely to see an erosion of credit quality. On the
other hand, diversification is one key differentiating factor. Insurers that have strategic options to deploy capital to
products, business lines, or geographies that are less sensitive to low interest rates are likely to exhibit greater stability
in their rating profile. We have seen ample evidence of life insurers shifting their strategic focus in response to these
external conditions.
Satisfactory operating earnings and limited asset risks continue to support our stable outlook on the non-life sector.
However, with relatively short asset durations, the impact attributed to the steep decline on the shorter end of the yield
curve was greater for non-life insurers. Given that underwriting results are at a favorable point in the cycle--and
unlikely to get much better--non-life insurers will need to maintain discipline in pricing, risk selection, and particularly
cost management to protect profitability.
This focus on expense efficiency is likely to affect distribution, with traditional networks increasingly concentrating on
value-added products and services, and with mass-market products trending toward digital strategies, such as selling
insurance products online. This, of course, will require up-front cost to develop new technological capabilities, but it
will become ever more important for insurers to succeed in a competitive market with low interest rates.
Reinsurance: Consolidation won't relieve competitive pressures
We changed our global P/C reinsurance outlook to negative from stable in January 2014. The tipping point came
when we saw increasing competition among reinsurers that we believe would weaken profitability. We believe
negative rating actions could slightly outweigh positive rating actions during the next year for global reinsurers.
Competitive pressures in the market are piling up as overcapacity continues to build on the back of historically strong
earnings and record inflows of alternative capital. This is manifesting in premium rate pressures across regions and
lines of business, as well as in saturation in many developed markets, limiting growth. Couple this top-line pressure
with historically low investment returns and it's clear why we expect reinsurers' profitability to suffer over the next
12-24 months.
The industry is turning to consolidation as a potential means of survival, with a handful of deals involving Bermuda
and London market participants announced in the past 12 months. We don't expect this recent spate of consolidation
to alleviate that competitive burden. If anything, it confirms the challenges that management teams at global reinsurers
face in the current soft market with regards to defending their competitive positions.
For the Western European reinsurers, talk of consolidation is more prevalent in London than on the continent as
buyers look to diversify their product offering and boost their scale. A Lloyd's platform provides buyers with a global
licensing network and access to a wide range of specialty lines of business. The large European reinsurers tend to have
the scale, diversification by product and geography, and capacity that we believe partially insulates them from some of
the competitive pressures we're seeing in the market.
WWW.STANDARDANDPOORS.COM/RATINGSDIRECT MARCH 30, 2015 20
1391435 | 301967406
Pursuing Global Insurance Profitability Amid Tempered Economic Growth
North America Capital And Earnings: Robust Capital, But Earnings... Not SoMuch
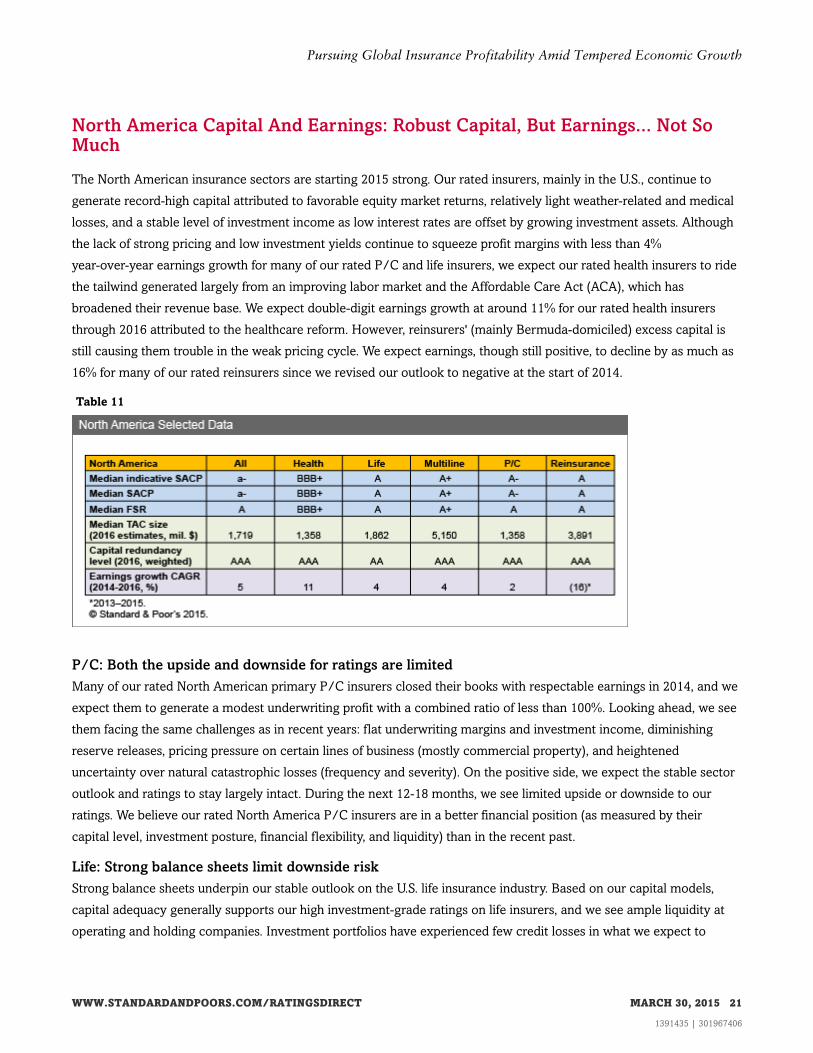
The North American insurance sectors are starting 2015 strong. Our rated insurers, mainly in the U.S., continue to
generate record-high capital attributed to favorable equity market returns, relatively light weather-related and medical
losses, and a stable level of investment income as low interest rates are offset by growing investment assets. Although
the lack of strong pricing and low investment yields continue to squeeze profit margins with less than 4%
year-over-year earnings growth for many of our rated P/C and life insurers, we expect our rated health insurers to ride
the tailwind generated largely from an improving labor market and the Affordable Care Act (ACA), which has
broadened their revenue base. We expect double-digit earnings growth at around 11% for our rated health insurers
through 2016 attributed to the healthcare reform. However, reinsurers' (mainly Bermuda-domiciled) excess capital is
still causing them trouble in the weak pricing cycle. We expect earnings, though still positive, to decline by as much as
16% for many of our rated reinsurers since we revised our outlook to negative at the start of 2014.
Table 11
P/C: Both the upside and downside for ratings are limited
Many of our rated North American primary P/C insurers closed their books with respectable earnings in 2014, and we
expect them to generate a modest underwriting profit with a combined ratio of less than 100%. Looking ahead, we see
them facing the same challenges as in recent years: flat underwriting margins and investment income, diminishing
reserve releases, pricing pressure on certain lines of business (mostly commercial property), and heightened
uncertainty over natural catastrophic losses (frequency and severity). On the positive side, we expect the stable sector
outlook and ratings to stay largely intact. During the next 12-18 months, we see limited upside or downside to our
ratings. We believe our rated North America P/C insurers are in a better financial position (as measured by their
capital level, investment posture, financial flexibility, and liquidity) than in the recent past.
Life: Strong balance sheets limit downside risk
Strong balance sheets underpin our stable outlook on the U.S. life insurance industry. Based on our capital models,
capital adequacy generally supports our high investment-grade ratings on life insurers, and we see ample liquidity at
operating and holding companies. Investment portfolios have experienced few credit losses in what we expect to
WWW.STANDARDANDPOORS.COM/RATINGSDIRECT MARCH 30, 2015 21
1391435 | 301967406
Pursuing Global Insurance Profitability Amid Tempered Economic Growth
remain a relatively benign credit environment, notwithstanding recent losses in the energy sector. Disciplined
matching of asset durations with liabilities has served the industry well amid ultra-low interest rates. Those interest
rates limit upside potential for the industry because portfolio yields continue to grind lower, increasing pressure on
spread-based earnings. In our view, a relatively fragmented industry with intense competition further limits room for
margin expansion because pricing, producer compensation, and product features are key determinants of new sales.
Overall, we believe the industry's strong balance sheets limit downside risk to our ratings, but interest rates would
likely have to rise before we could have a more positive outlook on the industry. We expect modest ratings changes,
likely balanced between upgrades and downgrades because we have positive outlooks on 10 groups and negative
outlooks on nine at the start of 2015.
Health: Credit quality should be strong as insurers adapt to the ACA
We consider credit quality to be strong for the U.S. health insurance sector as companies navigate through
unprecedented changes in the marketplace. Currently, about 85% of the ratings have a stable outlook, which reflects
our belief that health insurers will sustain their credit quality as they continue to adapt to the ACA. Earnings have
benefited from an expanding marketplace, improved employment, and the migration of government-sponsored
business to managed care, as well as a subdued rise in medical costs, which may have bottomed in 2013. We believe
our ratings reflect the sector's capacity to withstand a sustained period of moderate strain emerging in connection with
the ACA transition now underway. Overall, the ACA by itself has not resulted in any rating actions, a trend we expect
to persist through 2015. As more insurers become comfortable with the ACA and its implications for the marketplace,
we expect the pace of mergers and acquisitions to pick up (perhaps slowly for 2015) partly due to increased emphasis
on scale and diversity.
Reinsurance: A slew of challenges is raising risks
North American reinsurers face many of the same challenges as their European peers, but are arguably more exposed
to the competitive pressures. As a result, we observe that the consolidation wave is most active in Bermuda, with more
than one-third of the rated island-based reinsurers currently involved in a purchase or sale. These players have been
more directly affected by the competition from alternative capital since their relative concentration on property
catastrophe business has felt the sharpest impact from the inflow of cat bonds and other ILS structures.
As the remaining reinsurers look ready to adapt their business models to fit the current market conditions; the newly
merged reinsurance groups that fail to use their new size and scale profitably could see their ratings deteriorate.
We think companies without a defendable competitive position, or those that are more aggressive in maintaining
market share by competing on price or relaxing their underwriting discipline, are most at risk. If we see these forces at
work in a reinsurer's product mix or risk profile, we could revise our assessment of its business risk profile to reflect the
relatively higher risk. We also believe reinsurers that display diminished capital buffers, or those showing ongoing
constrained earnings capacity, will face a trying future.
Financial Flexibility Ratios: 2014-2016 Coverage And Leverage
Our 2014-2016 forward-looking estimates show a median of 7.4x EBITDA fixed-charge coverage and 20% financial
leverage for our rated insurers globally that have debt and/or hybrids outstanding. Comparing to the prior-year
WWW.STANDARDANDPOORS.COM/RATINGSDIRECT MARCH 30, 2015 22
1391435 | 301967406
Pursuing Global Insurance Profitability Amid Tempered Economic Growth
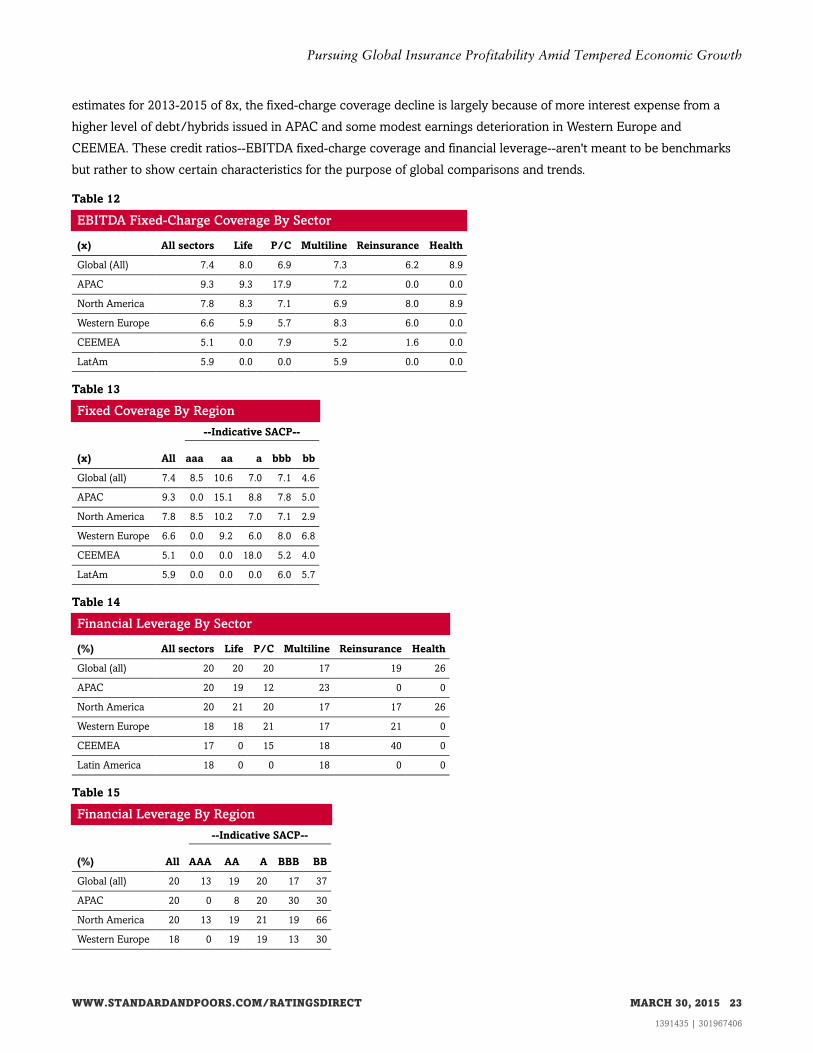
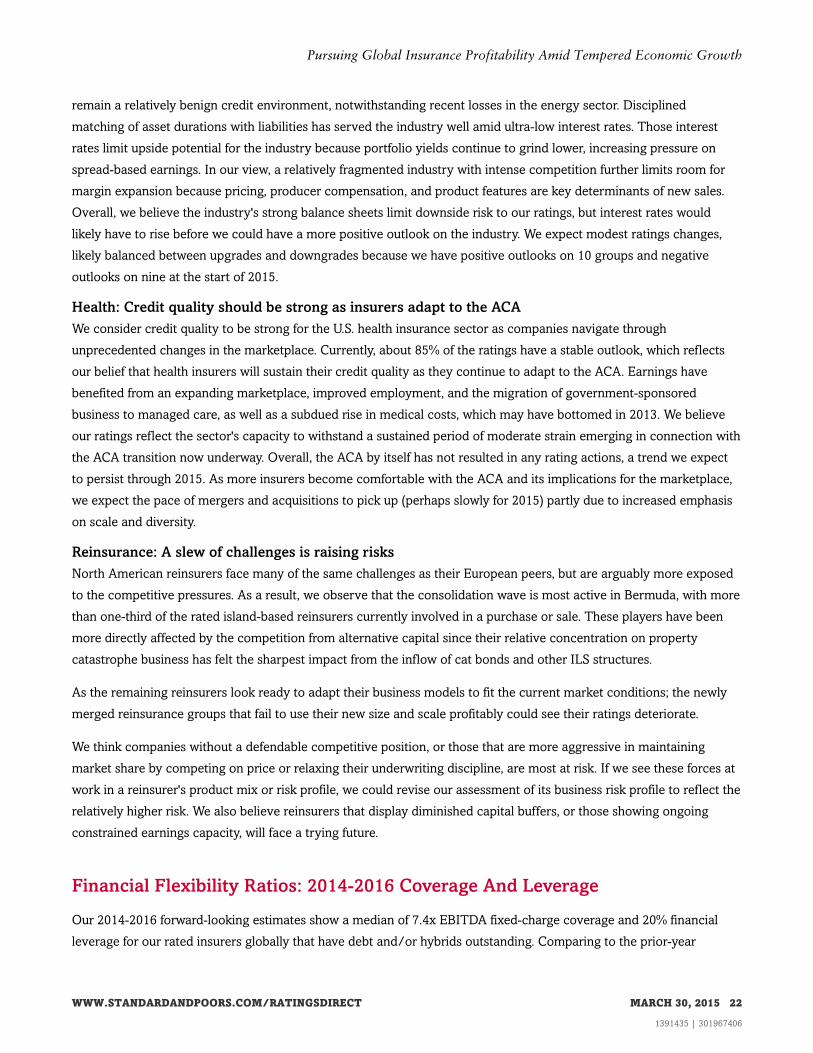
estimates for 2013-2015 of 8x, the fixed-charge coverage decline is largely because of more interest expense from a
higher level of debt/hybrids issued in APAC and some modest earnings deterioration in Western Europe and
CEEMEA. These credit ratios--EBITDA fixed-charge coverage and financial leverage--aren't meant to be benchmarks
but rather to show certain characteristics for the purpose of global comparisons and trends.
Table 12
EBITDA Fixed-Charge Coverage By Sector
(x) All sectors Life P/C Multiline Reinsurance Health
Global (All) 7.4 8.0 6.9 7.3 6.2 8.9
APAC 9.3 9.3 17.9 7.2 0.0 0.0
North America 7.8 8.3 7.1 6.9 8.0 8.9
Western Europe 6.6 5.9 5.7 8.3 6.0 0.0
CEEMEA 5.1 0.0 7.9 5.2 1.6 0.0
LatAm 5.9 0.0 0.0 5.9 0.0 0.0
Table 13
Fixed Coverage By Region
--Indicative SACP--
(x) All aaa aa a bbb bb
Global (all) 7.4 8.5 10.6 7.0 7.1 4.6
APAC 9.3 0.0 15.1 8.8 7.8 5.0
North America 7.8 8.5 10.2 7.0 7.1 2.9
Western Europe 6.6 0.0 9.2 6.0 8.0 6.8
CEEMEA 5.1 0.0 0.0 18.0 5.2 4.0
LatAm 5.9 0.0 0.0 0.0 6.0 5.7
Table 14
Financial Leverage By Sector
(%) All sectors Life P/C Multiline Reinsurance Health
Global (all) 20 20 20 17 19 26
APAC 20 19 12 23 0 0
North America 20 21 20 17 17 26
Western Europe 18 18 21 17 21 0
CEEMEA 17 0 15 18 40 0
Latin America 18 0 0 18 0 0
Table 15
Financial Leverage By Region
--Indicative SACP--
(%) All AAA AA A BBB BB
Global (all) 20 13 19 20 17 37
APAC 20 0 8 20 30 30
North America 20 13 19 21 19 66
Western Europe 18 0 19 19 13 30
WWW.STANDARDANDPOORS.COM/RATINGSDIRECT MARCH 30, 2015 23
1391435 | 301967406
Pursuing Global Insurance Profitability Amid Tempered Economic Growth
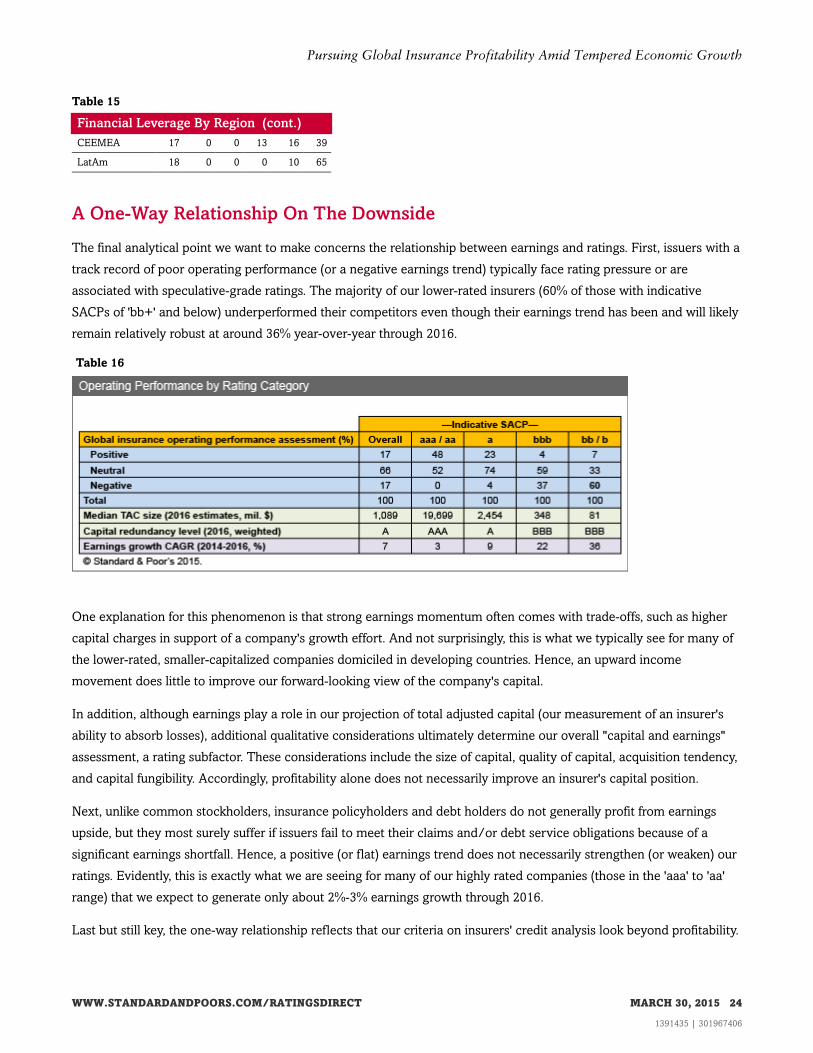
Table 15
Financial Leverage By Region (cont.)
CEEMEA 17 0 0 13 16 39
LatAm 18 0 0 0 10 65
A One-Way Relationship On The Downside
The final analytical point we want to make concerns the relationship between earnings and ratings. First, issuers with a
track record of poor operating performance (or a negative earnings trend) typically face rating pressure or are
associated with speculative-grade ratings. The majority of our lower-rated insurers (60% of those with indicative
SACPs of 'bb+' and below) underperformed their competitors even though their earnings trend has been and will likely
remain relatively robust at around 36% year-over-year through 2016.
Table 16
One explanation for this phenomenon is that strong earnings momentum often comes with trade-offs, such as higher
capital charges in support of a company's growth effort. And not surprisingly, this is what we typically see for many of
the lower-rated, smaller-capitalized companies domiciled in developing countries. Hence, an upward income
movement does little to improve our forward-looking view of the company's capital.
In addition, although earnings play a role in our projection of total adjusted capital (our measurement of an insurer's
ability to absorb losses), additional qualitative considerations ultimately determine our overall "capital and earnings"
assessment, a rating subfactor. These considerations include the size of capital, quality of capital, acquisition tendency,
and capital fungibility. Accordingly, profitability alone does not necessarily improve an insurer's capital position.
Next, unlike common stockholders, insurance policyholders and debt holders do not generally profit from earnings
upside, but they most surely suffer if issuers fail to meet their claims and/or debt service obligations because of a
significant earnings shortfall. Hence, a positive (or flat) earnings trend does not necessarily strengthen (or weaken) our
ratings. Evidently, this is exactly what we are seeing for many of our highly rated companies (those in the 'aaa' to 'aa'
range) that we expect to generate only about 2%-3% earnings growth through 2016.
Last but still key, the one-way relationship reflects that our criteria on insurers' credit analysis look beyond profitability.
WWW.STANDARDANDPOORS.COM/RATINGSDIRECT MARCH 30, 2015 24
1391435 | 301967406
Pursuing Global Insurance Profitability Amid Tempered Economic Growth
We consider a company's business prospects and whether they're supported by ample capital, prudent management
and governance, sound ERM capabilities, and sufficient financial flexibility and liquidity as more-comprehensive
measures for capturing risk characteristics. We believe these components provide a deeper purview on our issuers'
financial strength than what profitability alone could reveal. And so, before insurance investors get excited about the
highs and lows of profit growth, we believe it's important to understand what our ratings are saying about the rest of
these credit factors.
Related Criteria And Research
• Global Insurance Credit Outlook 2015: Policymakers Prolong Pain For Developed Markets' Insurers, Dec. 10, 2014
• Around The World Of Insurance: A Global Review of Ratings, Dec. 18, 2013
• Group Rating Methodology, Nov. 19, 2013
• Insurers: Rating Methodology, May 7, 2013
WWW.STANDARDANDPOORS.COM/RATINGSDIRECT MARCH 30, 2015 25
1391435 | 301967406
Pursuing Global Insurance Profitability Amid Tempered Economic Growth
S&P may receive compensation for its ratings and certain analyses, normally from issuers or underwriters of securities or from obligors. S&P
reserves the right to disseminate its opinions and analyses. S&P's public ratings and analyses are made available on its Web sites,
www.standardandpoors.com (free of charge), and www.ratingsdirect.com and www.globalcreditportal.com (subscription) and www.spcapitaliq.com
(subscription) and may be distributed through other means, including via S&P publications and third-party redistributors. Additional information
about our ratings fees is available at www.standardandpoors.com/usratingsfees.
S&P keeps certain activities of its business units separate from each other in order to preserve the independence and objectivity of their respective
activities. As a result, certain business units of S&P may have information that is not available to other S&P business units. S&P has established
policies and procedures to maintain the confidentiality of certain nonpublic information received in connection with each analytical process.
To the extent that regulatory authorities allow a rating agency to acknowledge in one jurisdiction a rating issued in another jurisdiction for certain
regulatory purposes, S&P reserves the right to assign, withdraw, or suspend such acknowledgement at any time and in its sole discretion. S&P
Parties disclaim any duty whatsoever arising out of the assignment, withdrawal, or suspension of an acknowledgment as well as any liability for any
damage alleged to have been suffered on account thereof.
Credit-related and other analyses, including ratings, and statements in the Content are statements of opinion as of the date they are expressed and
not statements of fact. S&P's opinions, analyses, and rating acknowledgment decisions (described below) are not recommendations to purchase,
hold, or sell any securities or to make any investment decisions, and do not address the suitability of any security. S&P assumes no obligation to
update the Content following publication in any form or format. The Content should not be relied on and is not a substitute for the skill, judgment
and experience of the user, its management, employees, advisors and/or clients when making investment and other business decisions. S&P does
not act as a fiduciary or an investment advisor except where registered as such. While S&P has obtained information from sources it believes to be
reliable, S&P does not perform an audit and undertakes no duty of due diligence or independent verification of any information it receives.
No content (including ratings, credit-related analyses and data, valuations, model, software or other application or output therefrom) or any part
thereof (Content) may be modified, reverse engineered, reproduced or distributed in any form by any means, or stored in a database or retrieval
system, without the prior written permission of Standard & Poor's Financial Services LLC or its affiliates (collectively, S&P). The Content shall not be
used for any unlawful or unauthorized purposes. S&P and any third-party providers, as well as their directors, officers, shareholders, employees or
agents (collectively S&P Parties) do not guarantee the accuracy, completeness, timeliness or availability of the Content. S&P Parties are not
responsible for any errors or omissions (negligent or otherwise), regardless of the cause, for the results obtained from the use of the Content, or for
the security or maintenance of any data input by the user. The Content is provided on an "as is" basis. S&P PARTIES DISCLAIM ANY AND ALL
EXPRESS OR IMPLIED WARRANTIES, INCLUDING, BUT NOT LIMITED TO, ANY WARRANTIES OF MERCHANTABILITY OR FITNESS FOR
A PARTICULAR PURPOSE OR USE, FREEDOM FROM BUGS, SOFTWARE ERRORS OR DEFECTS, THAT THE CONTENT'S FUNCTIONING
WILL BE UNINTERRUPTED, OR THAT THE CONTENT WILL OPERATE WITH ANY SOFTWARE OR HARDWARE CONFIGURATION. In no
event shall S&P Parties be liable to any party for any direct, indirect, incidental, exemplary, compensatory, punitive, special or consequential
damages, costs, expenses, legal fees, or losses (including, without limitation, lost income or lost profits and opportunity costs or losses caused by
negligence) in connection with any use of the Content even if advised of the possibility of such damages.
Copyright © 2015 Standard & Poor's Financial Services LLC, a part of McGraw Hill Financial. All rights reserved.
WWW.STANDARDANDPOORS.COM/RATINGSDIRECT MARCH 30, 2015 26
1391435 | 301967406


