Computers and Chemical Engineering 27 (2003) 1855�/1866
www.elsevier.com/locate/compchemeng
Reactive distillation for methyl acetate production
Robert S. Huss, Fengrong Chen, Michael F. Malone, Michael F. Doherty *
Department of Chemical Engineering, University of Massachusetts, Amherst, MA 01003, USA
Received 6 December 2002; accepted 12 June 2003
Abstract
We describe a hierarchy of methods, models, and calculation techniques that support the design of reactive distillation columns.
The models require increasingly sophisticated data needs as the hierarchy is implemented. The approach is illustrated for the
production of methyl acetate because of its commercial importance, and because of the availability of adequate published data for
comparison. In the limit of reaction and phase equilibrium, we show (1) the existence of both a minimum and a maximum reflux, (2)
there is a narrow range of reflux ratios that will produce high conversions and high purity methyl acetate, and (3) the existence of
multiple steady states throughout the entire range of feasible reflux ratios. For finite rates of reaction, we find (4) that the desired
product compositions are feasible over a wide range of reaction rates, up to and including reaction equilibrium, and (5) that multiple
steady states do not occur over the range of realistic reflux ratios, but they are found at high reflux ratios outside the range of normal
operation. Our calculations are in good agreement with experimental results reported by Bessling et al., [Chemical Engineering
Technology 21 (1998) 393].
# 2003 Elsevier Ltd. All rights reserved.
Keywords: Reactive distillation; Design; Simulation; Methyl acetate
1. Introduction
The production of methyl acetate is a classic example
of successful reactive distillation technology (Agreda &
Partin, 1984; Agreda, Partin, & Heise, 1990). Soon after
the invention and commercial application of this tech-
nology for methyl acetate synthesis it was used as a
model system for testing a new design and synthesis
framework that was developed for the limiting case of
equilibrium chemical reactions, i.e. fast reactions or
large holdups (Barbosa & Doherty, 1988a; Barbosa &
Doherty, 1988b). In recent years, the focus of research
has turned to kinetically controlled reactive distillations
and the kinetics of methyl acetate synthesis have been
studied extensively for both homogeneously and hetero-
geneously catalyzed reactions (Ronnback et al., 1997;
Xu & Chuang, 1997; Song, Venimadhavan, Manning,
Malone, & Doherty, 1998; Popken, Gotze, & Gmehling,
* Corresponding author. Present address: Department of Chemical
Engineering, University of California, Santa Barbara, CA 93106-5080,
USA. Tel.: �/1-805-893-5309; fax: �/1-805-893-4731.
E-mail address: [email protected] (M.F. Doherty).
0098-1354/03/$ - see front matter # 2003 Elsevier Ltd. All rights reserved.
doi:10.1016/S0098-1354(03)00156-X
2000). Methods have also been developed recently for
the design, synthesis, and feasibility analysis of kineti-
cally controlled reactive distillation, and methyl acetate
synthesis has commonly been used as a model system
(Ismail, Proios, & Pistikopoulos, 2001; Lee & Wester-
berg, 2001; Chadda, Malone, & Doherty, 2001; Chadda,
Doherty, & Malone, 2002). Extensive experimental data
have been reported for many different configurations of
reactive distillation devices for methyl acetate synthesis,
which provides a good database for testing design and
simulation models, e.g. Song et al., 1998; Bessling,
Loning, Ohligschlager, Schembecker, & Sundmacher,
1998; Popken, Steinigeweg, & Gmehling, 2001. These
studies also contain extensive literature reviews with
special reference to methyl acetate synthesis. For an
excellent general review of reactive distillation modeling,
see Taylor & Krishna (2000).
In this article, we describe a hierarchy of methods,
models, and calculation techniques that have been
developed to support the design of reactive distillation
columns. The models, which are hierarchical, require
increasingly sophisticated data needs as the hierarchy is
implemented. Methyl acetate synthesis is used as a
model system to demonstrate the approach. The results
Nomenclature
aj ,i activity of component i on stage j
D scaled Damkohler number (�/Da /(Da�/1))
Da Damkohler number for whole columnFj feed flow rate to stage j (zero for non-feed stages) (kmol/h)
Hj holdup of stage j (kmol)
HT total holdup for the entire column (kmol)/HR
T / total holdup with reaction(s) for the entire column (kmol)Keq thermodynamic reaction equilibrium constant for a single reactionKr thermodynamic reaction equilibrium constant of reaction r
kf,r forward rate constant of reaction r (h�1)
kf,ref forward rate constant evaluated at boiling point of a reference component (h�1)Lj liquid rate of stage j (kmol/h)
r reflux ratios reboil ratioVj vapor rate of stage j (kmol/h)xi liquid mole fraction of component i
xj ,i liquid mole fraction of component i on stage j
Xi transformed liquid mole fraction of component i
yj ,i vapor mole fraction of component i on stage j
zj ,i feed mole fraction of component i on stage j
Greek letters
oj ,r extent of reaction r on stage j (mole reacted/(mole of mixture�/time))
nr ,i stoichiometric coefficient of component i in reaction r
R.S. Huss et al. / Computers and Chemical Engineering 27 (2003) 1855�/18661856
show the effects of reflux ratio and kinetic parameterson the conversion in reactive distillation, in good
agreement with measurements reported for this system
by Bessling et al. (1998). This approach provides, we
believe for the first time, a comprehensive understanding
of the effect of kinetics in comparison to such experi-
ments, as well as a demonstration of solution multi-
plicity in a reactive distillation system for esterification.
Methyl acetate (MeOAc) can be made by the liquid-phase reaction of acetic acid (HOAc) and methanol
(MeOH) in the presence of an acid catalyst (e.g., sulfuric
acid, or a sulfonic acid ion exchange resin) at a pressure
of 1 atm. The reaction is
HOAc�MeOH l MeOAc�H2O (1)
An activity-based rate model for the reaction chem-
istry is
r�kf
�aHOAcaMeOH�
aMeOAcaH2O
Keq
�(2)
where the reaction equilibrium constant and the forward
rate constant are given by:
Keq�2:32 exp
�782:98
T
�(3)
kf �9:732�108 exp
��
6287:7
T
�h�1 (4)
where T is in K. The reaction equilibrium constant was
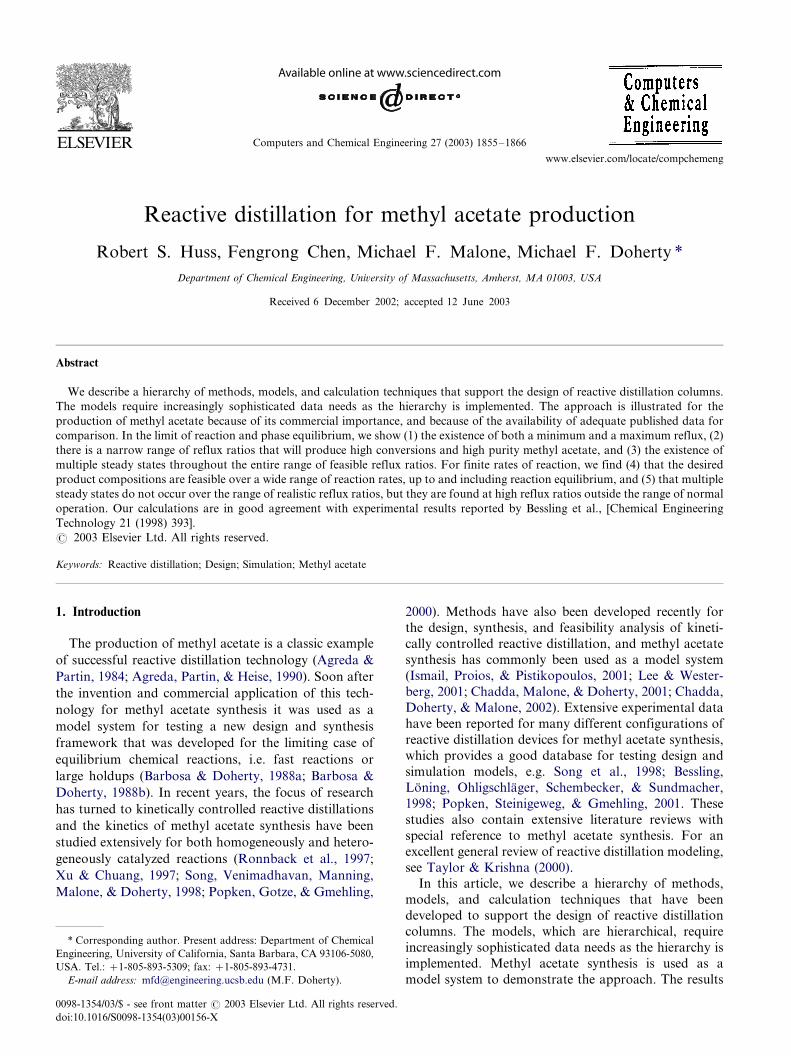
taken from Song et al. (1998) and the rate constant in
Eq. (4) was obtained by fitting the pseudo-homogeneousrate equation (2) to the heterogeneous rate data in Song
et al. (1998). A typical fit is shown in Fig. 1. The heat of
reaction used in this work is �/3.0165 kJ/mol, indicating
a slightly exothermic reaction, typical for acetate
esterifications.
The liquid-phase activity coefficients are well repre-
sented by the Wilson equation. The required thermo-
dynamic data for phase equilibrium in this system aregiven in Appendix A.
2. Equilibrium design
The first step in the procedure is to develop a
spectrum of designs at phase and reaction equilibrium
using the methods and reaction�/invariant compositions
developed by Barbosa and Doherty (1988a,b) and Ung
and Doherty (1995a); Ung and Doherty (1995b,c,d).The reaction�/invariant compositions exploit the reduc-
tion in degrees of freedom due to equilibrium reaction,
allowing visualization of this system in two dimensions.
The composition transformations for this system are:
XA�xHOAc�xMeOAc (5)
XB�xMeOH�xMeOAc (6)
where XA represents the fractional molar composition of
acetate groups (OAc), and XB represents the fractional
molar composition of alcohol groups (OH) in the
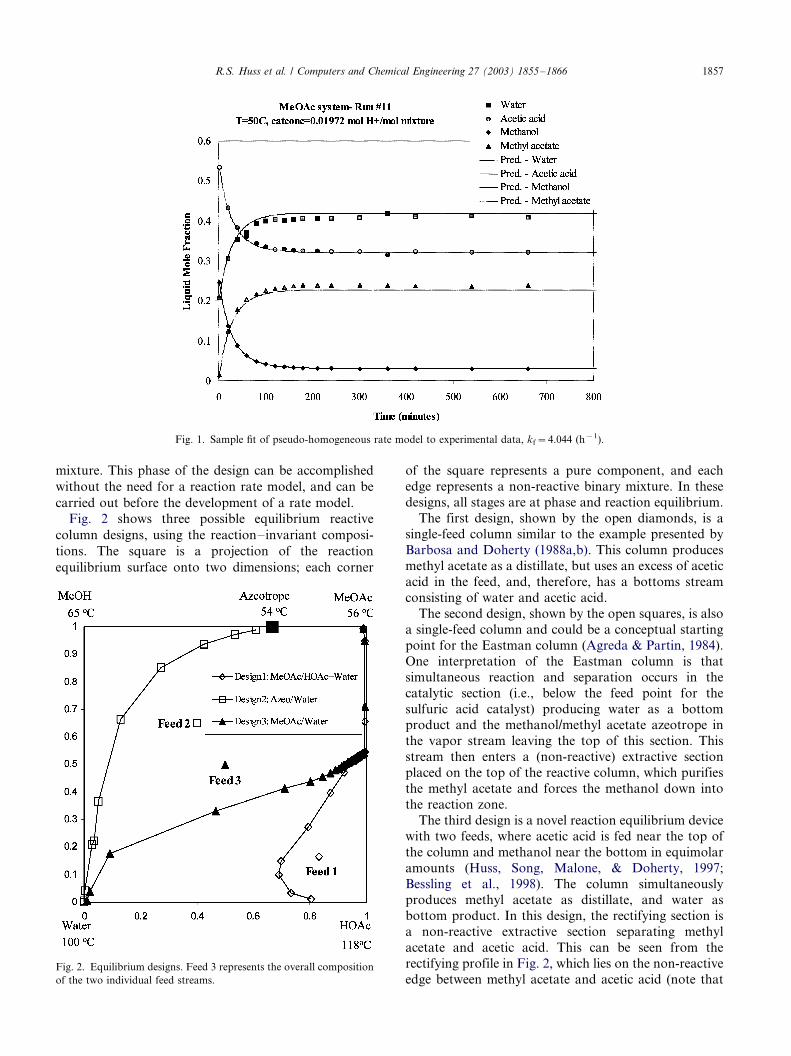
Fig. 1. Sample fit of pseudo-homogeneous rate model to experimental data, kf�/4.044 (h�1).
R.S. Huss et al. / Computers and Chemical Engineering 27 (2003) 1855�/1866 1857
mixture. This phase of the design can be accomplished
without the need for a reaction rate model, and can be
carried out before the development of a rate model.
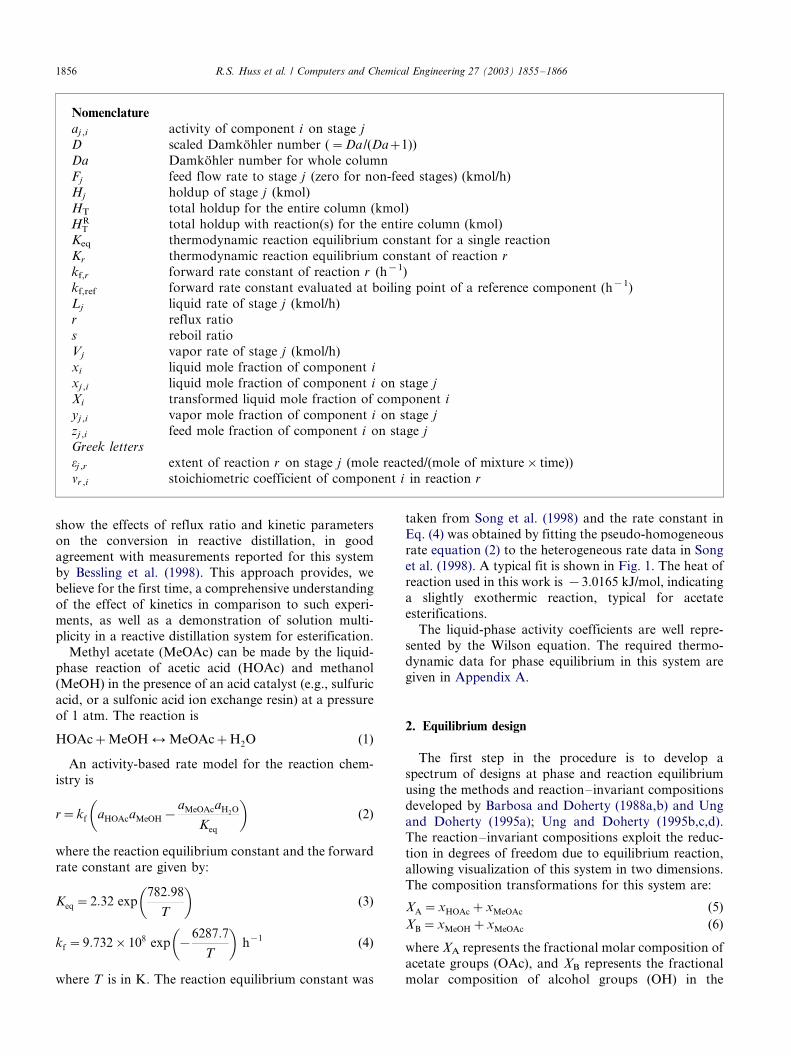
Fig. 2 shows three possible equilibrium reactive
column designs, using the reaction�/invariant composi-
tions. The square is a projection of the reaction
equilibrium surface onto two dimensions; each corner
Fig. 2. Equilibrium designs. Feed 3 represents the overall composition
of the two individual feed streams.
of the square represents a pure component, and each
edge represents a non-reactive binary mixture. In these
designs, all stages are at phase and reaction equilibrium.
The first design, shown by the open diamonds, is asingle-feed column similar to the example presented by
Barbosa and Doherty (1988a,b). This column produces
methyl acetate as a distillate, but uses an excess of acetic
acid in the feed, and, therefore, has a bottoms stream
consisting of water and acetic acid.
The second design, shown by the open squares, is also
a single-feed column and could be a conceptual starting
point for the Eastman column (Agreda & Partin, 1984).
One interpretation of the Eastman column is that
simultaneous reaction and separation occurs in the
catalytic section (i.e., below the feed point for the
sulfuric acid catalyst) producing water as a bottomproduct and the methanol/methyl acetate azeotrope in
the vapor stream leaving the top of this section. This
stream then enters a (non-reactive) extractive section
placed on the top of the reactive column, which purifies
the methyl acetate and forces the methanol down into
the reaction zone.
The third design is a novel reaction equilibrium device
with two feeds, where acetic acid is fed near the top of
the column and methanol near the bottom in equimolar
amounts (Huss, Song, Malone, & Doherty, 1997;
Bessling et al., 1998). The column simultaneouslyproduces methyl acetate as distillate, and water as
bottom product. In this design, the rectifying section is
a non-reactive extractive section separating methyl
acetate and acetic acid. This can be seen from the
rectifying profile in Fig. 2, which lies on the non-reactive
edge between methyl acetate and acetic acid (note that
R.S. Huss et al. / Computers and Chemical Engineering 27 (2003) 1855�/18661858
this is an output from the design model, not an input to
it). It became apparent that this design was possible
while we developed a two-feed version of design 2, and
found that the middle-section trajectories reached this
non-reactive edge.
Fig. 3 shows the effect of reflux ratio on the number
of equilibrium reactive stages in this column design at a
pressure of 1 atm. There is a minimum reflux at r �/1.3,
and a maximum reflux at r �/2.8. Outside this range of
reflux ratios, even an infinite number of equilibrium
reactive stages will not accomplish the desired separa-
tion. Fig. 3b show some of the possible middle-section
trajectories. Fig. 3b (top and bottom) show what occurs
when the reflux ratio is too low and too high,
respectively. There are an infinite number of stages at
rmin because of a saddle pinch in the middle profile, and
an infinite number of stages at rmax because of a node
pinch in the middle profile. Fig. 3b (middle) shows the
best middle profile to minimize the total number of
stages in the column. A similar effect has been shown
experimentally by Bessling et al. (1998).
Fig. 3a shows the effect of pressure on the range of
feasible reflux ratios and stage requirements. Increasing
the pressure increases the minimum number of stages
required and reduces the range of feasible reflux ratios.
Designs with a practical number of stages are not
possible at pressures greater than �/1 atm, and are
not even feasible at pressures greater than �/1.3 atm.
We will consider the effect of pressure again when we
include a side reaction in a later section.
In the final equilibrium design, we specified a methyl
acetate mole fraction of 0.985 in the distillate, a water
Fig. 3. Effect of reflux ratio on equilibrium design. Part (a) shows the numbe
(b) shows the column trajectories for three different values of the reflux rati
mole fraction of 0.985 in the bottoms, and a pressure of
1 atm. The reflux ratio that corresponds to the smallest
number of reactive stages is r�/1.7, which is chosen as
the base-case design value. The corresponding reboilratio is s�/2.7 and there are N�/38 stages, each with an
equilibrium chemical reaction (as noted earlier, the two
stages in the rectifying section have essentially no
reaction, so the effective number of chemical equili-
brium stages is 36). A schematic of this column and the
flow rates are shown in Fig. 4. The feed rates are based
on the published production rate of 400 million lb per
year of MeOAc (�/280.0 kmol/h; Agreda et al., 1990).
3. Feasibility of kinetically controlled column
Before attempting to design a column away from the
reaction equilibrium limit, we determine the feasibilityof kinetic column operation using the procedure devel-
oped by Chadda et al. (2001, 2002). This method tracks
fixed points of the rectifying and stripping sections
starting from the non-reactive pure components and
azeotropes, performing a bifurcation study with a
Damkohler number (Da ) as the continuation parameter.
The Damkohler number is the ratio of a characteristic
process time (/HRT =F ) to a characteristic reaction time (1/
kf,ref). The normal boiling point of MeOAc is chosen as
the reference temperature for the calculation of kf,ref,
giving a value of 5.1937 h�1 for a characteristic time of
approximately 12 min. Da is 0 at the non-reactive limit
and infinite at the reaction equilibrium limit. To avoid
dealing with very large numbers, we present the results
r of stages required as a function of reflux ratio for three pressures. Part
o at a pressure of 1 atm.
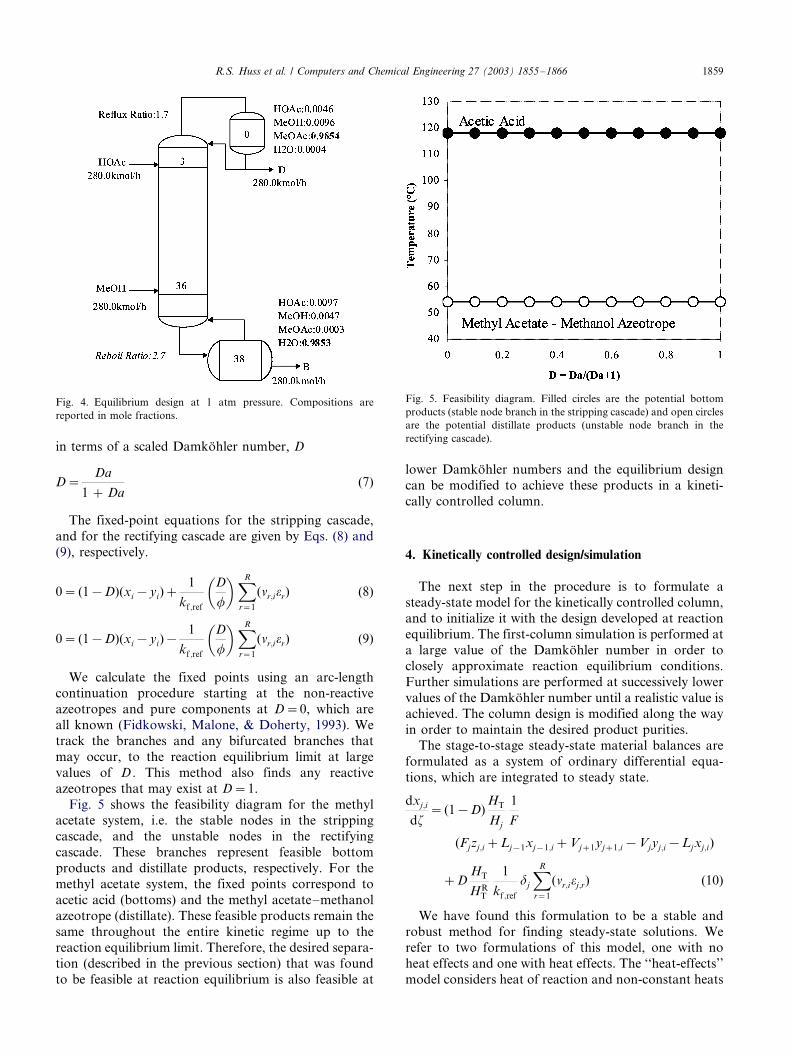
Fig. 5. Feasibility diagram. Filled circles are the potential bottom
products (stable node branch in the stripping cascade) and open circles
are the potential distillate products (unstable node branch in the
rectifying cascade).
Fig. 4. Equilibrium design at 1 atm pressure. Compositions are
reported in mole fractions.
R.S. Huss et al. / Computers and Chemical Engineering 27 (2003) 1855�/1866 1859
in terms of a scaled Damkohler number, D
D�Da
1 � Da(7)
The fixed-point equations for the stripping cascade,
and for the rectifying cascade are given by Eqs. (8) and
(9), respectively.
0� (1�D)(xi�yi)�1
kf;ref
�D
f
�XR
r�1
(nr;ior) (8)
0� (1�D)(xi�yi)�1
kf;ref
�D
f
�XR
r�1
(nr;ior) (9)
We calculate the fixed points using an arc-lengthcontinuation procedure starting at the non-reactive
azeotropes and pure components at D�/0, which are
all known (Fidkowski, Malone, & Doherty, 1993). We
track the branches and any bifurcated branches that
may occur, to the reaction equilibrium limit at large
values of D . This method also finds any reactive
azeotropes that may exist at D�/1.
Fig. 5 shows the feasibility diagram for the methylacetate system, i.e. the stable nodes in the stripping
cascade, and the unstable nodes in the rectifying
cascade. These branches represent feasible bottom
products and distillate products, respectively. For the
methyl acetate system, the fixed points correspond to
acetic acid (bottoms) and the methyl acetate�/methanol
azeotrope (distillate). These feasible products remain the
same throughout the entire kinetic regime up to thereaction equilibrium limit. Therefore, the desired separa-
tion (described in the previous section) that was found
to be feasible at reaction equilibrium is also feasible at
lower Damkohler numbers and the equilibrium design
can be modified to achieve these products in a kineti-
cally controlled column.
4. Kinetically controlled design/simulation
The next step in the procedure is to formulate a
steady-state model for the kinetically controlled column,and to initialize it with the design developed at reaction
equilibrium. The first-column simulation is performed at
a large value of the Damkohler number in order to
closely approximate reaction equilibrium conditions.
Further simulations are performed at successively lower
values of the Damkohler number until a realistic value is
achieved. The column design is modified along the way
in order to maintain the desired product purities.The stage-to-stage steady-state material balances are
formulated as a system of ordinary differential equa-
tions, which are integrated to steady state.
dxj;i
dz�(1�D)
HT
Hj
1
F
� (Fjzj;i�Lj�1xj�1;i�Vj�1yj�1;i�Vjyj;i�Ljxj;i)
�DHT
HRT
1
kf ;ref
dj
XR
r�1
(nr;ioj;r) (10)
We have found this formulation to be a stable and
robust method for finding steady-state solutions. Werefer to two formulations of this model, one with no
heat effects and one with heat effects. The ‘‘heat-effects’’
model considers heat of reaction and non-constant heats
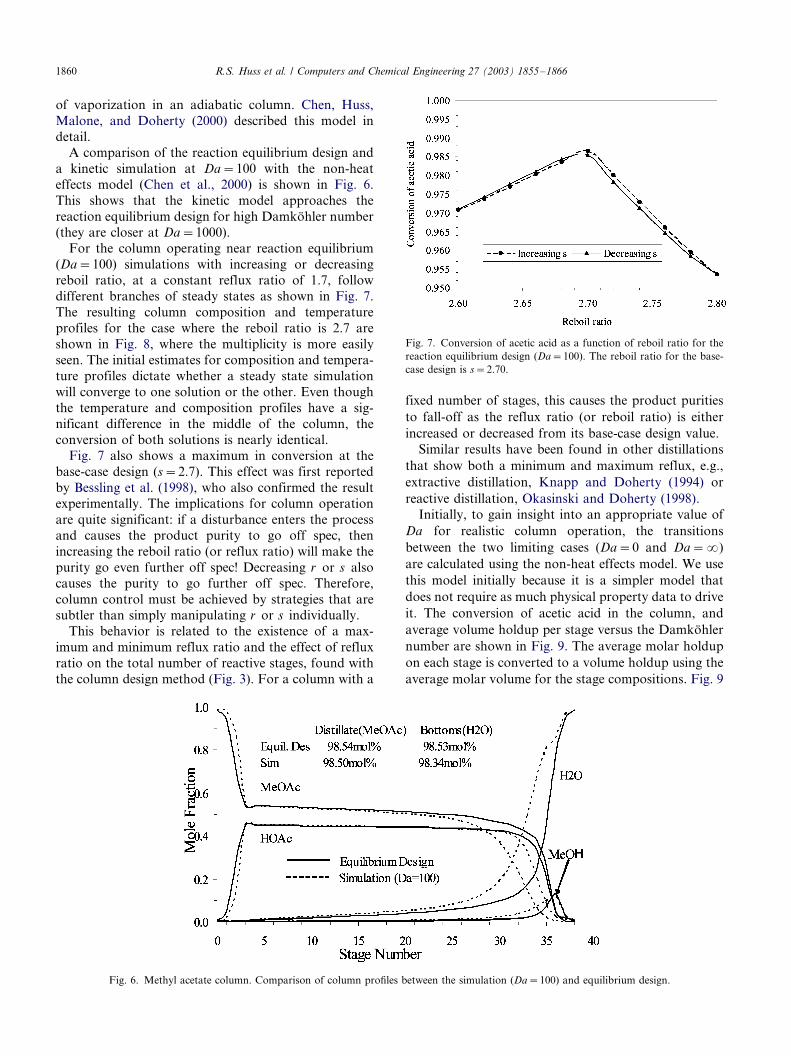
Fig. 7. Conversion of acetic acid as a function of reboil ratio for the
reaction equilibrium design (Da�/100). The reboil ratio for the base-
case design is s�/2.70.
R.S. Huss et al. / Computers and Chemical Engineering 27 (2003) 1855�/18661860
of vaporization in an adiabatic column. Chen, Huss,
Malone, and Doherty (2000) described this model in
detail.
A comparison of the reaction equilibrium design and
a kinetic simulation at Da�/100 with the non-heat
effects model (Chen et al., 2000) is shown in Fig. 6.
This shows that the kinetic model approaches the
reaction equilibrium design for high Damkohler number
(they are closer at Da�/1000).
For the column operating near reaction equilibrium
(Da�/100) simulations with increasing or decreasing
reboil ratio, at a constant reflux ratio of 1.7, follow
different branches of steady states as shown in Fig. 7.
The resulting column composition and temperature
profiles for the case where the reboil ratio is 2.7 are
shown in Fig. 8, where the multiplicity is more easily
seen. The initial estimates for composition and tempera-
ture profiles dictate whether a steady state simulation
will converge to one solution or the other. Even though
the temperature and composition profiles have a sig-
nificant difference in the middle of the column, the
conversion of both solutions is nearly identical.
Fig. 7 also shows a maximum in conversion at the
base-case design (s�/2.7). This effect was first reported
by Bessling et al. (1998), who also confirmed the result
experimentally. The implications for column operation
are quite significant: if a disturbance enters the process
and causes the product purity to go off spec, then
increasing the reboil ratio (or reflux ratio) will make the
purity go even further off spec! Decreasing r or s also
causes the purity to go further off spec. Therefore,
column control must be achieved by strategies that are
subtler than simply manipulating r or s individually.
This behavior is related to the existence of a max-
imum and minimum reflux ratio and the effect of reflux
ratio on the total number of reactive stages, found with
the column design method (Fig. 3). For a column with a
Fig. 6. Methyl acetate column. Comparison of column profiles b
fixed number of stages, this causes the product purities
to fall-off as the reflux ratio (or reboil ratio) is either
increased or decreased from its base-case design value.
Similar results have been found in other distillations
that show both a minimum and maximum reflux, e.g.,
extractive distillation, Knapp and Doherty (1994) or
reactive distillation, Okasinski and Doherty (1998).
Initially, to gain insight into an appropriate value of
Da for realistic column operation, the transitions
between the two limiting cases (Da�/0 and Da�/�)
are calculated using the non-heat effects model. We use
this model initially because it is a simpler model that
does not require as much physical property data to drive
it. The conversion of acetic acid in the column, and
average volume holdup per stage versus the Damkohler
number are shown in Fig. 9. The average molar holdup
on each stage is converted to a volume holdup using the
average molar volume for the stage compositions. Fig. 9
etween the simulation (Da�/100) and equilibrium design.
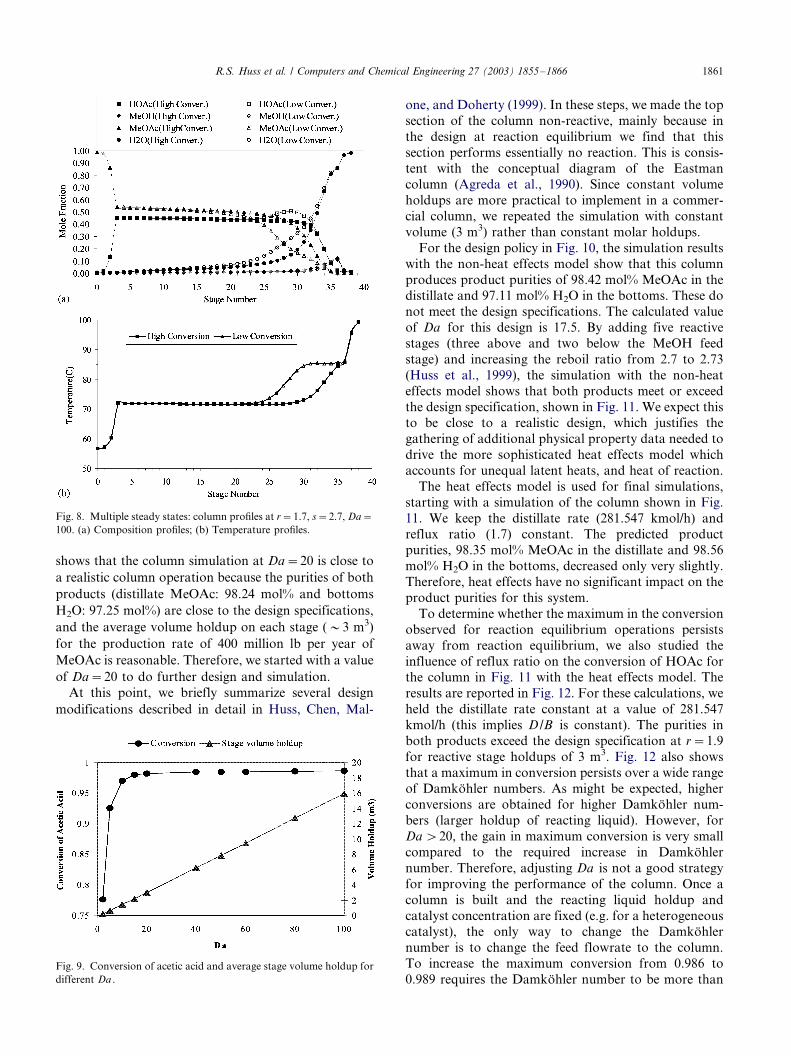
Fig. 8. Multiple steady states: column profiles at r�/1.7, s�/2.7, Da�/
100. (a) Composition profiles; (b) Temperature profiles.
R.S. Huss et al. / Computers and Chemical Engineering 27 (2003) 1855�/1866 1861
shows that the column simulation at Da�/20 is close to
a realistic column operation because the purities of both
products (distillate MeOAc: 98.24 mol% and bottoms
H2O: 97.25 mol%) are close to the design specifications,
and the average volume holdup on each stage (�/3 m3)
for the production rate of 400 million lb per year of
MeOAc is reasonable. Therefore, we started with a value
of Da�/20 to do further design and simulation.
At this point, we briefly summarize several design
modifications described in detail in Huss, Chen, Mal-
Fig. 9. Conversion of acetic acid and average stage volume holdup for
different Da .
one, and Doherty (1999). In these steps, we made the top
section of the column non-reactive, mainly because in
the design at reaction equilibrium we find that this
section performs essentially no reaction. This is consis-tent with the conceptual diagram of the Eastman
column (Agreda et al., 1990). Since constant volume
holdups are more practical to implement in a commer-
cial column, we repeated the simulation with constant
volume (3 m3) rather than constant molar holdups.
For the design policy in Fig. 10, the simulation results
with the non-heat effects model show that this column
produces product purities of 98.42 mol% MeOAc in thedistillate and 97.11 mol% H2O in the bottoms. These do
not meet the design specifications. The calculated value
of Da for this design is 17.5. By adding five reactive
stages (three above and two below the MeOH feed
stage) and increasing the reboil ratio from 2.7 to 2.73
(Huss et al., 1999), the simulation with the non-heat
effects model shows that both products meet or exceed
the design specification, shown in Fig. 11. We expect thisto be close to a realistic design, which justifies the
gathering of additional physical property data needed to
drive the more sophisticated heat effects model which
accounts for unequal latent heats, and heat of reaction.
The heat effects model is used for final simulations,
starting with a simulation of the column shown in Fig.
11. We keep the distillate rate (281.547 kmol/h) and
reflux ratio (1.7) constant. The predicted productpurities, 98.35 mol% MeOAc in the distillate and 98.56
mol% H2O in the bottoms, decreased only very slightly.
Therefore, heat effects have no significant impact on the
product purities for this system.
To determine whether the maximum in the conversion
observed for reaction equilibrium operations persists
away from reaction equilibrium, we also studied the
influence of reflux ratio on the conversion of HOAc forthe column in Fig. 11 with the heat effects model. The
results are reported in Fig. 12. For these calculations, we
held the distillate rate constant at a value of 281.547
kmol/h (this implies D /B is constant). The purities in
both products exceed the design specification at r�/1.9
for reactive stage holdups of 3 m3. Fig. 12 also shows
that a maximum in conversion persists over a wide range
of Damkohler numbers. As might be expected, higherconversions are obtained for higher Damkohler num-
bers (larger holdup of reacting liquid). However, for
Da �/20, the gain in maximum conversion is very small
compared to the required increase in Damkohler
number. Therefore, adjusting Da is not a good strategy
for improving the performance of the column. Once a
column is built and the reacting liquid holdup and
catalyst concentration are fixed (e.g. for a heterogeneouscatalyst), the only way to change the Damkohler
number is to change the feed flowrate to the column.
To increase the maximum conversion from 0.986 to
0.989 requires the Damkohler number to be more than
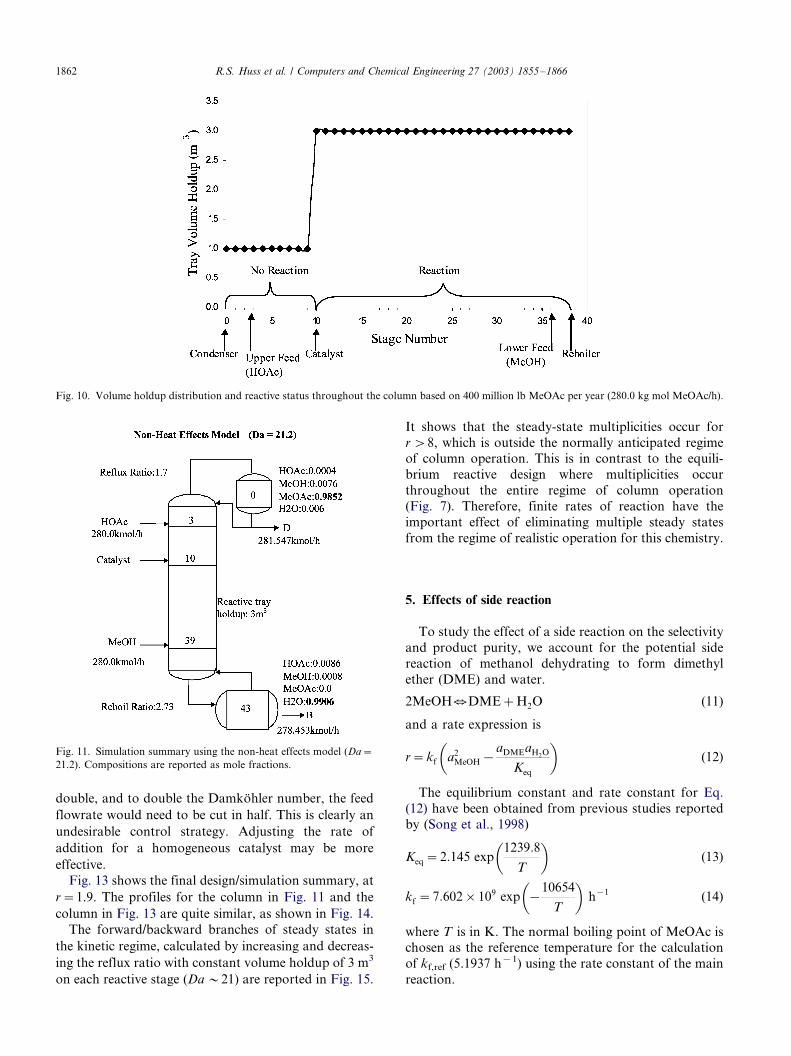
Fig. 10. Volume holdup distribution and reactive status throughout the column based on 400 million lb MeOAc per year (280.0 kg mol MeOAc/h).
Fig. 11. Simulation summary using the non-heat effects model (Da�/
21.2). Compositions are reported as mole fractions.
R.S. Huss et al. / Computers and Chemical Engineering 27 (2003) 1855�/18661862
double, and to double the Damkohler number, the feed
flowrate would need to be cut in half. This is clearly an
undesirable control strategy. Adjusting the rate of
addition for a homogeneous catalyst may be more
effective.
Fig. 13 shows the final design/simulation summary, at
r�/1.9. The profiles for the column in Fig. 11 and the
column in Fig. 13 are quite similar, as shown in Fig. 14.
The forward/backward branches of steady states in
the kinetic regime, calculated by increasing and decreas-
ing the reflux ratio with constant volume holdup of 3 m3
on each reactive stage (Da �/21) are reported in Fig. 15.
It shows that the steady-state multiplicities occur for
r �/8, which is outside the normally anticipated regimeof column operation. This is in contrast to the equili-
brium reactive design where multiplicities occur
throughout the entire regime of column operation
(Fig. 7). Therefore, finite rates of reaction have the
important effect of eliminating multiple steady states
from the regime of realistic operation for this chemistry.
5. Effects of side reaction
To study the effect of a side reaction on the selectivity
and product purity, we account for the potential side
reaction of methanol dehydrating to form dimethyl
ether (DME) and water.
2MeOHUDME�H2O (11)
and a rate expression is
r�kf
�a2
MeOH�aDMEaH2O
Keq
�(12)
The equilibrium constant and rate constant for Eq.
(12) have been obtained from previous studies reported
by (Song et al., 1998)
Keq�2:145 exp
�1239:8
T
�(13)
kf �7:602�109 exp
��
10654
T
�h�1 (14)
where T is in K. The normal boiling point of MeOAc ischosen as the reference temperature for the calculation
of kf,ref (5.1937 h�1) using the rate constant of the main
reaction.
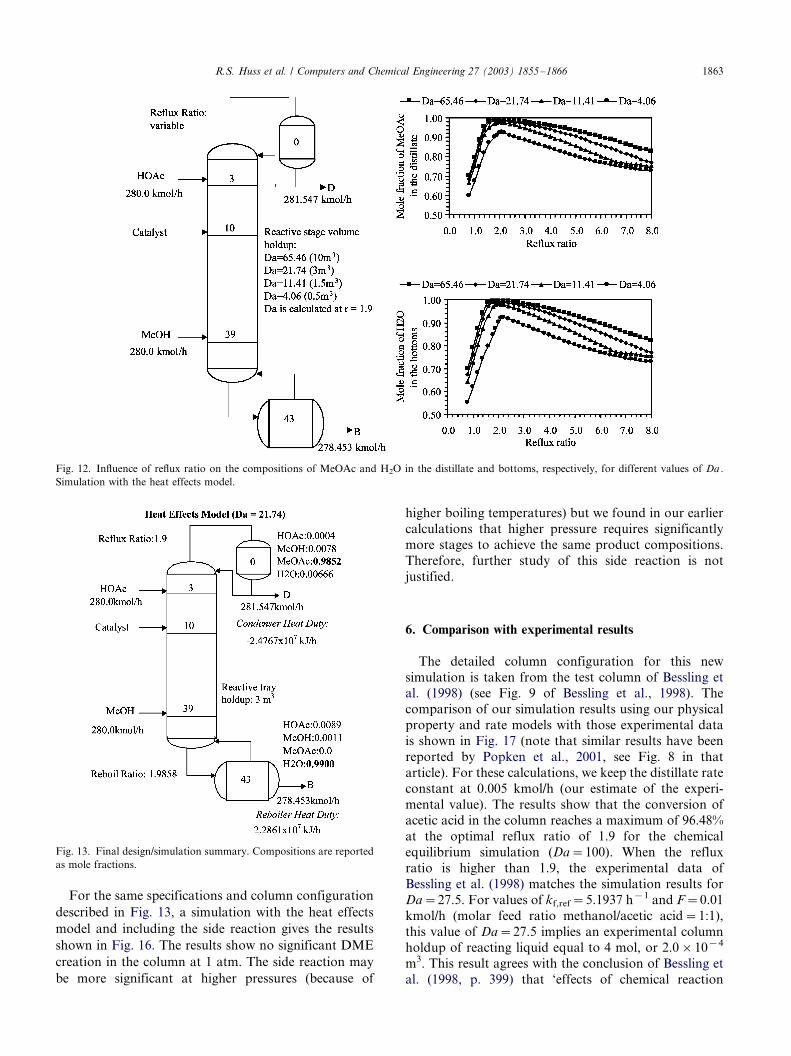
Fig. 12. Influence of reflux ratio on the compositions of MeOAc and H2O in the distillate and bottoms, respectively, for different values of Da .
Simulation with the heat effects model.
Fig. 13. Final design/simulation summary. Compositions are reported
as mole fractions.
R.S. Huss et al. / Computers and Chemical Engineering 27 (2003) 1855�/1866 1863
For the same specifications and column configuration
described in Fig. 13, a simulation with the heat effects
model and including the side reaction gives the results
shown in Fig. 16. The results show no significant DME
creation in the column at 1 atm. The side reaction may
be more significant at higher pressures (because of
higher boiling temperatures) but we found in our earlier
calculations that higher pressure requires significantly
more stages to achieve the same product compositions.
Therefore, further study of this side reaction is not
justified.
6. Comparison with experimental results
The detailed column configuration for this new
simulation is taken from the test column of Bessling etal. (1998) (see Fig. 9 of Bessling et al., 1998). The
comparison of our simulation results using our physical
property and rate models with those experimental data
is shown in Fig. 17 (note that similar results have been
reported by Popken et al., 2001, see Fig. 8 in that
article). For these calculations, we keep the distillate rate
constant at 0.005 kmol/h (our estimate of the experi-
mental value). The results show that the conversion ofacetic acid in the column reaches a maximum of 96.48%
at the optimal reflux ratio of 1.9 for the chemical
equilibrium simulation (Da�/100). When the reflux
ratio is higher than 1.9, the experimental data of
Bessling et al. (1998) matches the simulation results for
Da�/27.5. For values of kf,ref�/5.1937 h�1 and F�/0.01
kmol/h (molar feed ratio methanol/acetic acid�/1:1),
this value of Da�/27.5 implies an experimental columnholdup of reacting liquid equal to 4 mol, or 2.0�/10�4
m3. This result agrees with the conclusion of Bessling et
al. (1998, p. 399) that ‘effects of chemical reaction
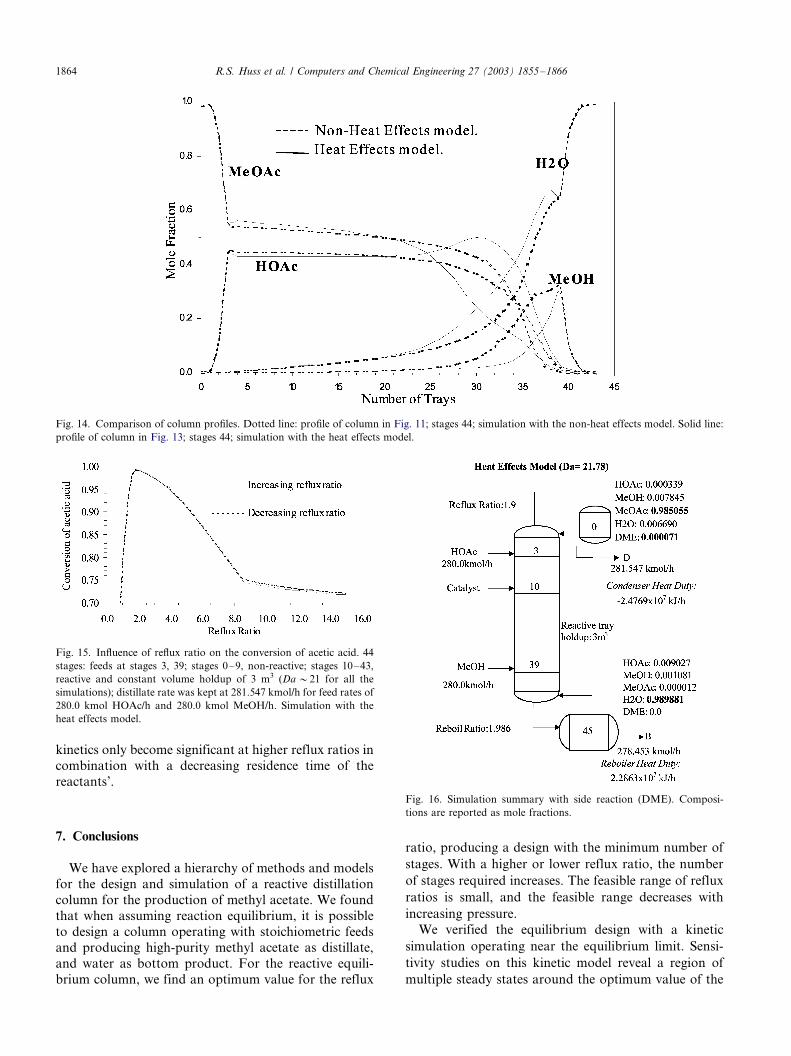
Fig. 14. Comparison of column profiles. Dotted line: profile of column in Fig. 11; stages 44; simulation with the non-heat effects model. Solid line:
profile of column in Fig. 13; stages 44; simulation with the heat effects model.
Fig. 15. Influence of reflux ratio on the conversion of acetic acid. 44
stages: feeds at stages 3, 39; stages 0�/9, non-reactive; stages 10�/43,
reactive and constant volume holdup of 3 m3 (Da �/21 for all the
simulations); distillate rate was kept at 281.547 kmol/h for feed rates of
280.0 kmol HOAc/h and 280.0 kmol MeOH/h. Simulation with the
heat effects model.
R.S. Huss et al. / Computers and Chemical Engineering 27 (2003) 1855�/18661864
kinetics only become significant at higher reflux ratios in
combination with a decreasing residence time of the
reactants’.
Fig. 16. Simulation summary with side reaction (DME). Composi-
tions are reported as mole fractions.
7. Conclusions
We have explored a hierarchy of methods and models
for the design and simulation of a reactive distillation
column for the production of methyl acetate. We found
that when assuming reaction equilibrium, it is possible
to design a column operating with stoichiometric feedsand producing high-purity methyl acetate as distillate,
and water as bottom product. For the reactive equili-
brium column, we find an optimum value for the reflux
ratio, producing a design with the minimum number of
stages. With a higher or lower reflux ratio, the number
of stages required increases. The feasible range of reflux
ratios is small, and the feasible range decreases with
increasing pressure.
We verified the equilibrium design with a kinetic
simulation operating near the equilibrium limit. Sensi-
tivity studies on this kinetic model reveal a region of
multiple steady states around the optimum value of the
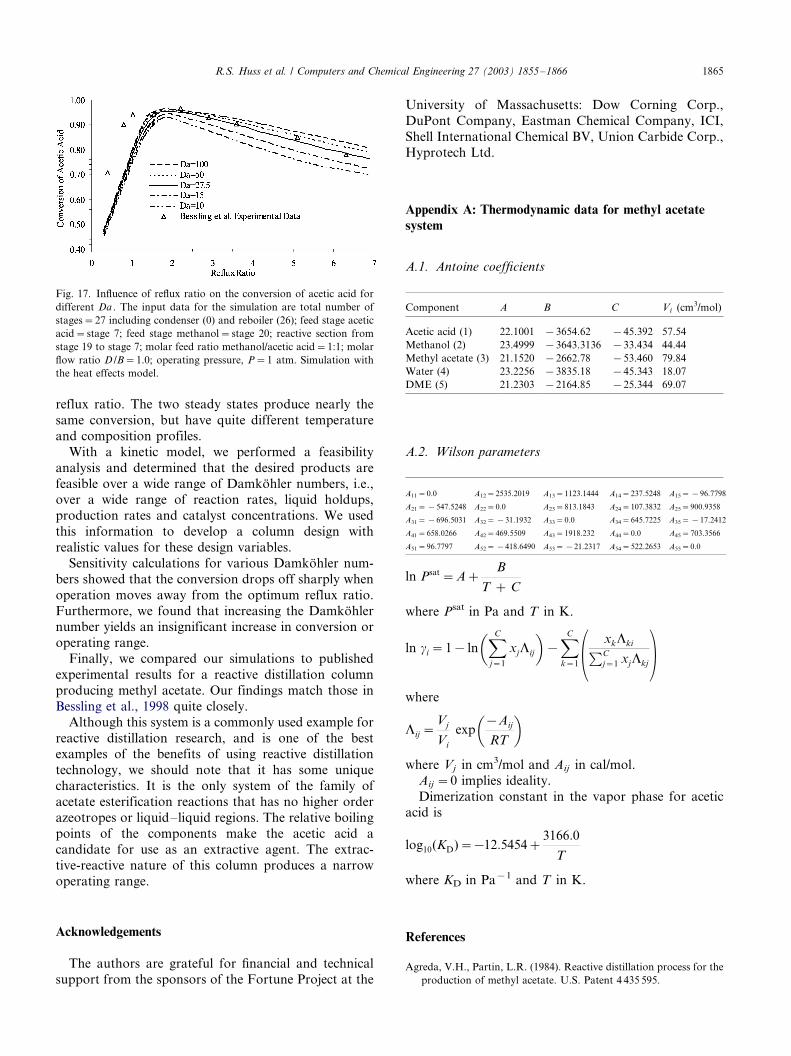
Fig. 17. Influence of reflux ratio on the conversion of acetic acid for
different Da . The input data for the simulation are total number of
stages�/27 including condenser (0) and reboiler (26); feed stage acetic
acid�/stage 7; feed stage methanol�/stage 20; reactive section from
stage 19 to stage 7; molar feed ratio methanol/acetic acid�/1:1; molar
flow ratio D /B�/1.0; operating pressure, P�/1 atm. Simulation with
the heat effects model.
R.S. Huss et al. / Computers and Chemical Engineering 27 (2003) 1855�/1866 1865
reflux ratio. The two steady states produce nearly the
same conversion, but have quite different temperature
and composition profiles.
With a kinetic model, we performed a feasibility
analysis and determined that the desired products are
feasible over a wide range of Damkohler numbers, i.e.,over a wide range of reaction rates, liquid holdups,
production rates and catalyst concentrations. We used
this information to develop a column design with
realistic values for these design variables.
Sensitivity calculations for various Damkohler num-
bers showed that the conversion drops off sharply when
operation moves away from the optimum reflux ratio.
Furthermore, we found that increasing the Damkohlernumber yields an insignificant increase in conversion or
operating range.
Finally, we compared our simulations to published
experimental results for a reactive distillation column
producing methyl acetate. Our findings match those in
Bessling et al., 1998 quite closely.
Although this system is a commonly used example for
reactive distillation research, and is one of the bestexamples of the benefits of using reactive distillation
technology, we should note that it has some unique
characteristics. It is the only system of the family of
acetate esterification reactions that has no higher order
azeotropes or liquid�/liquid regions. The relative boiling
points of the components make the acetic acid a
candidate for use as an extractive agent. The extrac-
tive-reactive nature of this column produces a narrowoperating range.
Acknowledgements
The authors are grateful for financial and technical
support from the sponsors of the Fortune Project at the
University of Massachusetts: Dow Corning Corp.,
DuPont Company, Eastman Chemical Company, ICI,
Shell International Chemical BV, Union Carbide Corp.,
Hyprotech Ltd.
Appendix A: Thermodynamic data for methyl acetate
system
A.1. Antoine coefficients
Component
A B C Vi (cm3/mol)Acetic acid (1)
22.1001 �/3654.62 �/45.392 57.54Methanol (2)
23.4999 �/3643.3136 �/33.434 44.44Methyl acetate (3)
21.1520 �/2662.78 �/53.460 79.84Water (4)
23.2256 �/3835.18 �/45.343 18.07DME (5)
21.2303 �/2164.85 �/25.344 69.07A.2. Wilson parameters
A11�/0.0
A12�/2535.2019 A13�/1123.1444 A14�/237.5248 A15�/�/96.7798A21�/�/547.5248
A22�/0.0 A23�/813.1843 A24�/107.3832 A25�/900.9358A31�/�/696.5031
A32�/�/31.1932 A33�/0.0 A34�/645.7225 A35�/�/17.2412A41�/658.0266
A42�/469.5509 A43�/1918.232 A44�/0.0 A45�/703.3566A51�/96.7797
A52�/�/418.6490 A53�/�/21.2317 A54�/522.2653 A55�/0.0ln Psat�A�B
T � C
where Psat in Pa and T in K.
ln gi�1� ln
�XC
j�1
xjLij
��
XC
k�1
�xkLkiPC
j�1 xjLkj
�
where
Lij �Vj
Vi
exp
��Aij
RT
�
where Vj in cm3/mol and Aij in cal/mol.
Aij �/0 implies ideality.
Dimerization constant in the vapor phase for aceticacid is
log10(KD)��12:5454�3166:0
T
where KD in Pa�1 and T in K.
References
Agreda, V.H., Partin, L.R. (1984). Reactive distillation process for the
production of methyl acetate. U.S. Patent 4 435 595.
R.S. Huss et al. / Computers and Chemical Engineering 27 (2003) 1855�/18661866
Agreda, V. H., Partin, L. R., & Heise, W. H. (1990). High-purity
methyl acetate via reactive distillation. Chemical Engineering
Progess 86 (2), 40.
Barbosa, D., & Doherty, M. F. (1988a). Design and minimum reflux
calculations for single-feed multicomponent reactive distillation
columns. Chemical Engineering Science 43 , 1523.
Barbosa, D., & Doherty, M. F. (1988b). Design and minimum reflux
calculations for double-feed multicomponent reactive distillation
columns. Chemical Engineering Science 43 , 2377.
Bessling, B., Loning, J., Ohligschlager, A., Schembecker, G., &
Sundmacher, K. (1998). Investigation on the synthesis of methyl
acetate in a heterogeneous reactive distillation process. Chemical
Engineering Technology 21 (5), 393.
Chadda, N., Malone, M. F., & Doherty, M. F. (2001). Effect of
chemical kinetics on feasible splits for reactive distillation. Amer-
ican Institute of Chemical Engineering Journal 47 , 590.
Chadda, N., Doherty, M. F., & Malone, M. F. (2002). Feasibility and
synthesis of hybrid reactive distillation systems. American Institute
of Chemical Engineering Journal 48 , 2754.
Chen, F., Huss, R. S., Malone, M. F., & Doherty, M. F. (2000).
Simulation of kinetic effects in reactive distillation. Computers and
Chemical Engineering 24 , 2457.
Fidkowski, Z. T., Malone, M. F., & Doherty, M. F. (1993).
Computing azeotropes in multicomponent mixtures. Computers
and Chemical Engineering 17 , 1141.
Huss, R.S., Song, W., Malone, M.F., Doherty, M.F. (1997) Computa-
tions and experiments for the feasibility of reactive distillation.
Paper 199a, American Institute of Chemical Engineering Annual
Meeting, Los Angeles, CA.
Huss, R. S., Chen, F., Malone, M. F., Doherty, M.F. (1999).
Computer-aided tools for the design of reactive distillation systems.
Computers and Chemical Engineering, S955.
Ismail, S. R., Proios, P., & Pistikopoulos, E. N. (2001). Modular
synthesis framework for combined separation/reaction systems.
American Institute of Chemical Engineering Journal 47 , 629.
Knapp, J. P., Doherty, M. F. (1994). Minimum entrainer flows for
extractive distillation. A bifurcation theoretic approach. American
Institute of Chemical Engineering Journal 40, 243.
Lee, J. W., & Westerberg, A. W. (2001). Graphical design applied to
MTBE and methyl acetate reactive distillation processes. American
Institute of Chemical Engineering Journal 47 , 1333.
Okasinski, M. J., & Doherty, M. F. (1998). Design method for
kinetically controlled staged reactive distillation columns. Indus-
trial Engineering and Chemical Research 37 , 2821.
Popken, T., Gotze, L., & Gmehling, J. (2000). Reaction kinetics and
chemical equilibrium of homogeneously and heterogeneously
catalyzed acetic acid esterification with methanol and methyl
acetate hydrolysis. Industrial Engineering and Chemical Research
39 , 2601.
Popken, T., Steinigeweg, S., & Gmehling, J. (2001). Synthesis and
hydrolysis of methyl acetate by reactive distillation using structured
catalytic packings: experiments and simulation. Industrial Engi-
neering and Chemical Research 40 , 156.
Ronnback, R., Salmi, T., Vuori, A., Haario, H., Lehtonen, J.,
Sundqvist, A., & Tirronen, E. (1997). Development of a kinetic
model for the esterification of acetic acid with methanol in the
presence of a homogeneous acid catalyst. Chemical Engineering
Science 52 , 3369.
Song, W., Venimadhavan, G., Manning, J. M., Malone, M. F., &
Doherty, M. F. (1998). Measurement of residue curve maps and
heterogeneous kinetics in methyl acetate synthesis. Industrial
Engineering and Chemical Research 37 , 1917.
Taylor, R., & Krishna, R. (2000). Modelling reactive distillation.
Chemical Engineering Science 55 , 5183.
Ung, S., & Doherty, M. F. (1995a). Synthesis of reactive distillation
systems with multiple equilibrium chemical reactions. Industrial
Engineering and Chemical Research 34 , 2555.
Ung, S., & Doherty, M. F. (1995b). Vapor�/liquid phase equilibrium in
systems with multiple chemical reactions. Chemical Engineering
Science 50 , 23.
Ung, S., & Doherty, M. F. (1995c). Theory of phase equilibrium in
multi-reaction systems. Chemical Engineering Science 50 , 3201.
Ung, S., & Doherty, M. F. (1995d). Calculation of residue curve maps
for mixtures with multiple equilibrium chemical reactions. Indus-
trial Engineering and Chemical Research 34 , 3195.
Xu, Z. P., & Chuang, K. T. (1997). Effect of internal diffusion on
heterogeneous catalytic esterification of acetic acid. Chemical
Engineering Science 52 , 3011.


