Download - Regional Operating Income Bridge 2001
®®
000000_1000000_11
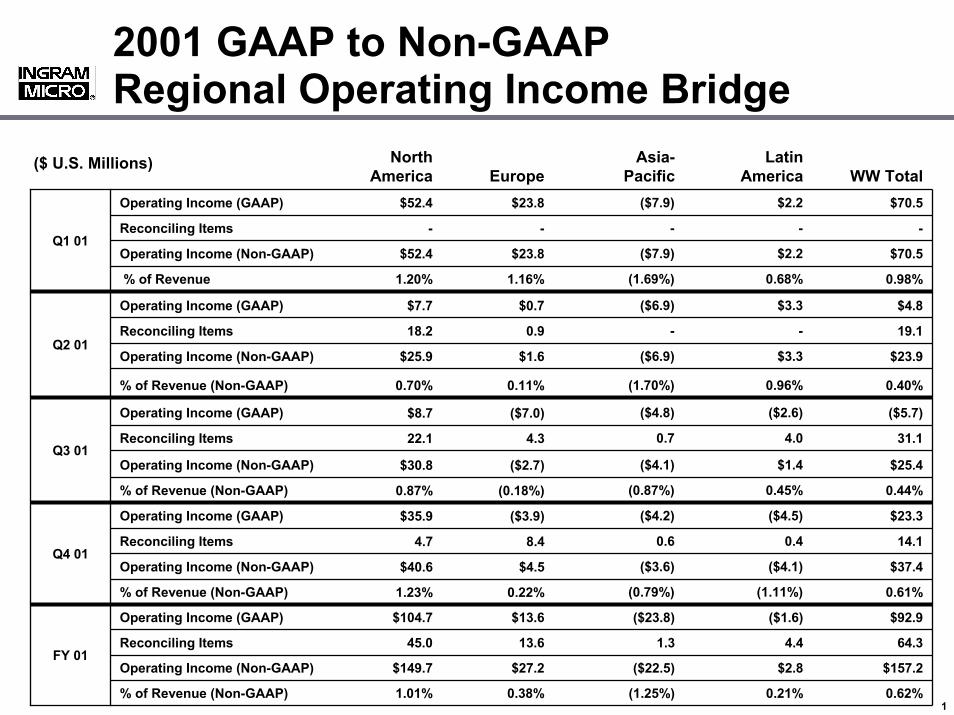
2001 GAAP to Non-GAAP Regional Operating Income Bridge
$70.5$2.2($7.9)$23.8$52.4Operating Income (GAAP)
-----Reconciling Items
$23.3($4.5)($4.2)($3.9)$35.9Operating Income (GAAP)
Q4 01
0.44%0.45%(0.87%)(0.18%)0.87%% of Revenue (Non-GAAP)
$25.4$1.4($4.1)($2.7)$30.8Operating Income (Non-GAAP)
31.14.00.74.322.1Reconciling Items
($5.7)($2.6)($4.8)($7.0)$8.7Operating Income (GAAP)
Q3 01
0.61%(1.11%)(0.79%)0.22%1.23%% of Revenue (Non-GAAP)
$37.4($4.1)($3.6)$4.5$40.6Operating Income (Non-GAAP)
14.10.40.68.44.7Reconciling Items
19.1--0.918.2Reconciling Items
$4.8$3.3($6.9)$0.7$7.7Operating Income (GAAP)
0.98%0.68%(1.69%)1.16%1.20%% of Revenue
$157.2$2.8($22.5)$27.2$149.7Operating Income (Non-GAAP)FY 01
$92.9($1.6)($23.8)$13.6$104.7Operating Income (GAAP)
0.62%
64.3
0.40%
$23.9
$70.5
WW Total
0.21%
4.4
0.96%
$3.3
$2.2
LatinAmerica
(1.25%)0.38%1.01%% of Revenue (Non-GAAP)
1.313.645.0Reconciling Items
(1.70%)0.11%0.70%% of Revenue (Non-GAAP)
($6.9)$1.6$25.9Operating Income (Non-GAAP)Q2 01
($7.9)$23.8$52.4Operating Income (Non-GAAP)Q1 01
Asia-PacificEurope
North America
($ U.S. Millions)


