
Transitions Pathways and Risk Analysis for Climate Change Mitigation and Adaptation Strategies
Case study researchers: Lei Song (Chinese Academy of Social Sciences (CASS) and Ying Chen China Executive Leadership Academy Pudong
Presented by: Dr Jenny Lieu, Co-Principal Investigator of TRANSrisk
SPRU, Science Policy Research Unit
Renewable energy: towards a low carbon transition pathway
CLAPES UC WorkshopSantiago, June 8th, 2017

• Introduction to risk and uncertainty framing
• Case study of China urban and peri-urban areas
• Urban development and air pollution
• Low carbon transition pathways
• Risk: barriers and negative outcomes of pathways
• Challenges and opportunities for Chile
AGENDA

Risk• Outcome is uncertain• Potential for negative consequences • Negative impact on livelihoods/society, environment,
economy, and infrastructure…
Uncertainty • Incomplete knowledge• Lack of information• Disagreement of what is known
Source: IPPC, 2014
Definitions
?

Likelihood (uncertainty low to high)
Outcome
positive
negative Risk
Benefit
Implementation risk: potential for a policy to not be implemented, given a barrier
Consequential risk: potential of a policy to cause a negative consequence
Synergy/ co-benefit: positive outcomes that have benefit on multiple scales: e.g. actors, context (political, social, environmental etc.)

• The growth of economy and rising income per capita improves indoor
comfort
• Urbanization and population growth trigger the increasing new
buildings and will dilute energy efficiency effects
CASE STUDY: URBAN AND PERI-URBAN CIT IESIN CHINA
Shanghai and Beijing urban development
Source: http://worldpopulationreview.com/world-cities/
Shanghai population: 25,202,000 Beijing population: 22,063,000

Figure 1: Residential sector energy consumption in selected non-OECD regions by energy source, 2012 and 2040 (percent of total)
ENERGY MIX IN RES IDENTIAL SECTOR
Source: https://www.eia.gov/outlooks/ieo/buildings.cfm

Source: http://data.worldbank.org/indicator/EN.ATM.PM25.MC.M3?end=2015&locations=CN-CL-ZJ-OE&start=2010&view=chart&year_high_desc=true
A IR QUALITY COMPARISONS ACROSS COUNTRIES
Figure 2: PM2.5 air pollution, mean annual exposure (micrograms per cubic meter)

Figure 3: Urban population (% of total)
GROWING URBANISATION TREND
Source: http://data.worldbank.org/indicator/SP.URB.TOTL.IN.ZS?locations=CN-CL-ZJ

A IR POLLUTION AND CLIMATE CHANGE
Figure 4 & 5 Beijing peri-‐urban, Daxing district
• Increasing extreme climate events such as heat waves, extreme cold trigger more energy consumption for heating and cooling
• Air pollution (smog) is a serious problem in Northern China
• Heating seasons are different, e.g. in Beijing, November- March every year
• Longer in Xinjiang, Inter-Mongolia and North-east China area
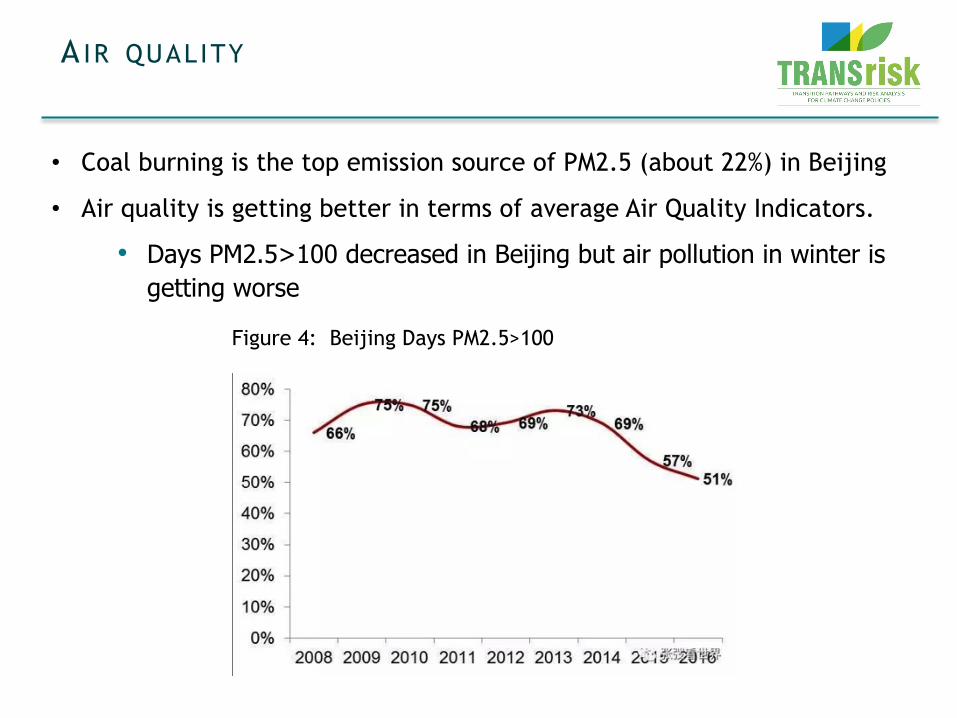
• Coal burning is the top emission source of PM2.5 (about 22%) in Beijing
• Air quality is getting better in terms of average Air Quality Indicators.
• Days PM2.5>100 decreased in Beijing but air pollution in winter is getting worse
A IR QUALITY
Figure 4: Beijing Days PM2.5>100

A IR QUALITY INDICATOR: C ITY COMPARISONSource: http://aqicn.org/city/chile/parque-ohiggins/
Aire Santiago

• Burning low quality coal for heating in winter
• Boiler and coal sources is the most commonly used heating system in North China.
• Traditional biomass is main sources for heating in peri-urban buildings in these cold regions.
• Biomass or coal ovens in peri-urban area emit much more pollutants than large boilers in urban areas
CONTEXT: HEATING IN BUILDINGS
New coal ovenTraditional biomass oven

Pathway 1: Energy efficiency (urban buildings) • New building: green building
codes, voluntary standards• Retrofits and renovations: wall,
roof insulation, doors, windows, and energy efficiency improvement in heating and ventilating
LOW CARBON TRANSIT ION PATHWAYS FORBUILDINGS IN CHINA
Pathways 2: Low carbon energy mix (peri-urban buildings)• Evolution of energy profiles in
urban and peri-urban• The share of electricity and
natural gas will dramatically increase
• Distributed energy including micro-grids, combined heat & power and renewable energy
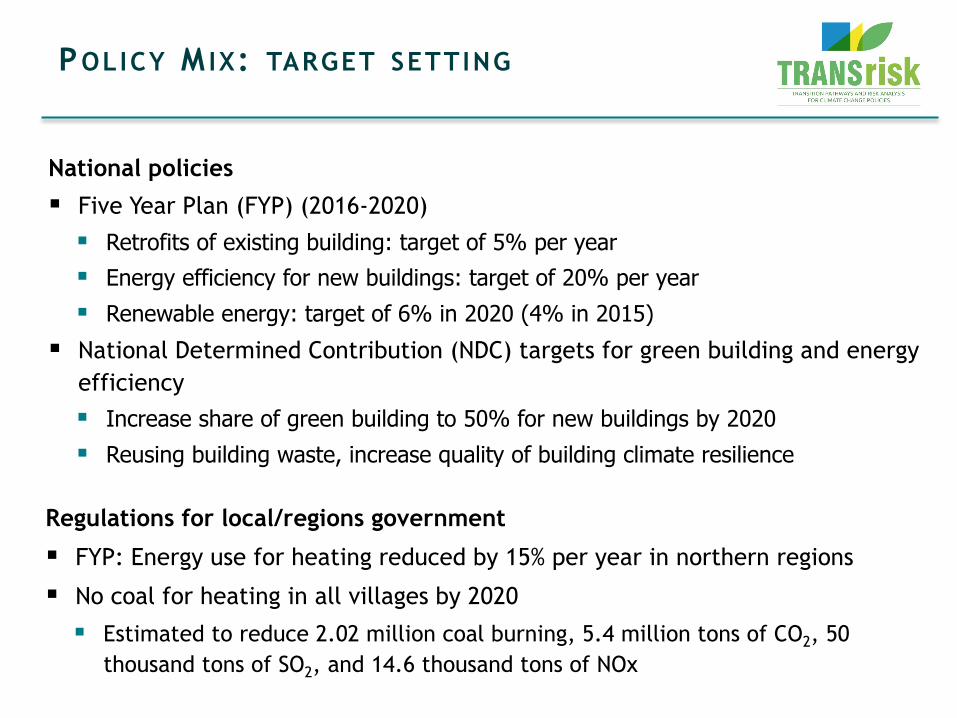
National policies
§ Five Year Plan (FYP) (2016-2020)
§ Retrofits of existing building: target of 5% per year § Energy efficiency for new buildings: target of 20% per year§ Renewable energy: target of 6% in 2020 (4% in 2015)
§ National Determined Contribution (NDC) targets for green building and energy efficiency § Increase share of green building to 50% for new buildings by 2020 § Reusing building waste, increase quality of building climate resilience
POLICY M IX: TARGET SETTING
Regulations for local/regions government
§ FYP: Energy use for heating reduced by 15% per year in northern regions
§ No coal for heating in all villages by 2020
§ Estimated to reduce 2.02 million coal burning, 5.4 million tons of CO2, 50 thousand tons of SO2, and 14.6 thousand tons of NOx
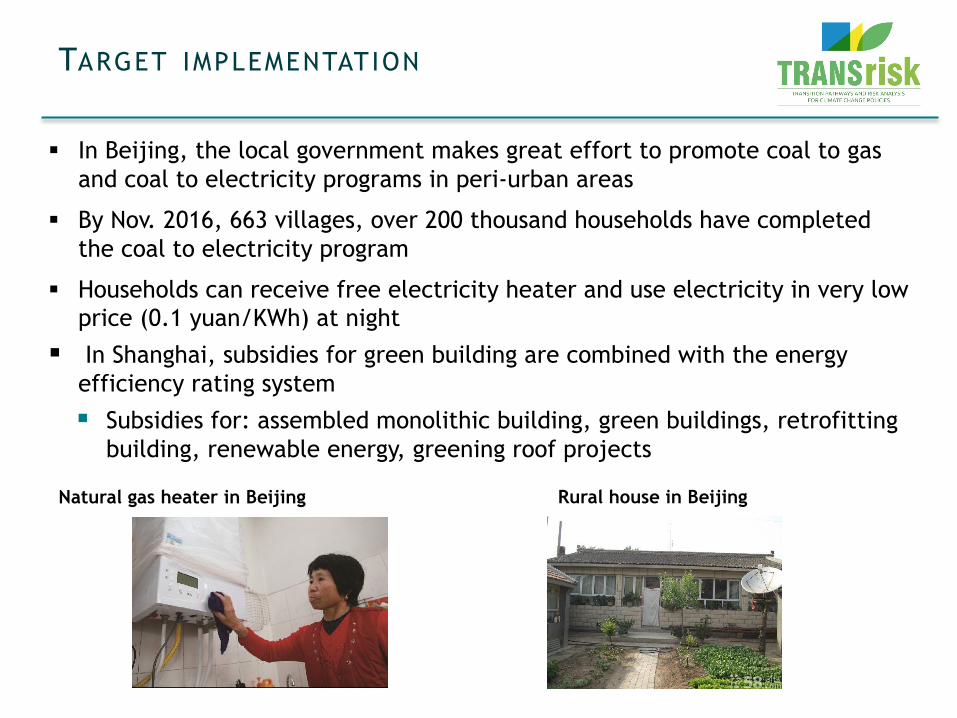
§ In Beijing, the local government makes great effort to promote coal to gas and coal to electricity programs in peri-urban areas
§ By Nov. 2016, 663 villages, over 200 thousand households have completed the coal to electricity program
§ Households can receive free electricity heater and use electricity in very low price (0.1 yuan/KWh) at night
§ In Shanghai, subsidies for green building are combined with the energy efficiency rating system
§ Subsidies for: assembled monolithic building, green buildings, retrofitting building, renewable energy, greening roof projects
TARGET IMPLEMENTATION
Natural gas heater in Beijing Rural house in Beijing

Implementation barriers
§ Government investment for urban building retrofit
§ Beijing has funds but other cities can not afford this
§ Ownership issues:
§ Residents cannot reach agreement for retrofit§ Different interests of tenants and owners
§ Noise and inconvenience for residents during construction
Negative outcomes
§ Behaviour of residents do not change leads and does not lead to reduced energy consumption or carbon emissions
§ Imbalanced heat distribution off-sets energy efficiency
PATHWAY 1: ENERGY EFFICIENCY URBANBUILDINGS IN CHINA

Implementation barrier:§ Most of buildings in peri-‐urban area have poor insulation performance § Heating with electric heater is slow, uncomfortable indoor temperature § Heating cost of electricity much higher than coal § Households receive subsidies but worry about the viability of subsidy policy
PATHWAY 2: LOW CARBON ENERGY IN PERI-URBAN BUILDINGS IN CHINA
Negative consequences:§ The electricity use of each householders increase 5
times§ Risks in power grid§ Some households receive free electric heaters but
use coal again § Natural gas burning emits NOx relevant to PM2.5§ Increase import of natural gas
Peri-‐urban house in Shanghai

Learning from China• Differentiated approach for different climatic regions • Air pollution and urban development links• Social and political priority• Strong regulatory framework
Challenges for Chile• Increasing income• Growing density in cities vs. suburban sprawl• Trade-offs: economy over environment?
Opportunities• Urban development in an integrated approach- human dimension• Develop new sectors
Other areas to explore in Chile• Data collection needs to improve: new construction builds • Transportation: private vs. public• Disappearance per-urban agriculture
LEARNING FROM CHINA &CHALLENGES & OPPORTUNITIES FOR CHILE
$

J e n n y L i e uT R A N S r i s k C o - P r i n c i p a l I n v e s t i g a t o r
j . l i e u @ s u s s e x . a c . u k
Thank-you!
RISK & UNCERTAINTIES: POTENTIAL FUTURES

Figure 3: CO2 emissions (kg per PPP $ of GDP)
DECREAS ING CO2 EMISS ION TREND PERPPP$ PF GDP
Source: http://data.worldbank.org/indicator/EN.ATM.CO2E.PP.GD?end=2013&locations=CN-CL-ZJ-OE&start=2000&view=chart&year_high_desc=true
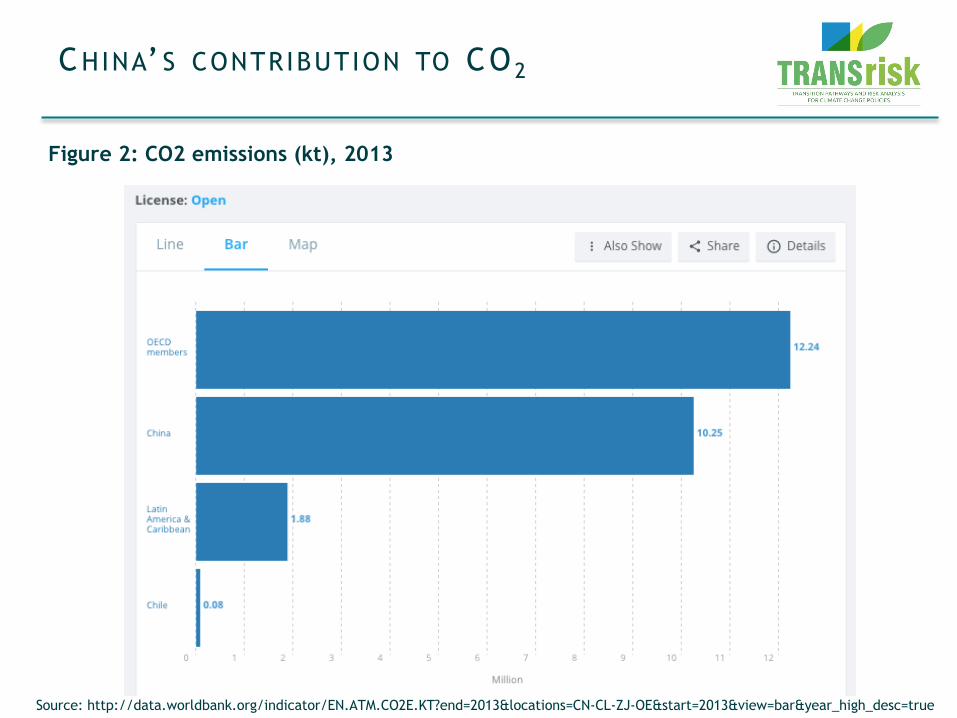
Figure 2: CO2 emissions (kt), 2013
CHINA’ S CONTRIBUTION TO CO2
Source: http://data.worldbank.org/indicator/EN.ATM.CO2E.KT?end=2013&locations=CN-CL-ZJ-OE&start=2013&view=bar&year_high_desc=true


