
Romania – an emerging
auto hub

22016 The Government of Romania
1. Industry overview
1.1 Automobile production
1.2 Automotive components
2. Romania’s promise as an automotive hub
2.1 Human capital
2.2 Labor costs
2.3 Energy prices
2.4 Government support
Contents

1. Industry overview
1.1 Automobile production
1.2 Automotive components

42016 The Government of Romania
5.4 6.07.6
9.210.7
12.62.62.9
3.5
4.1
5.2
5.4+18%
2013 2014
15.9
18.0
2012
8.0
2009
8.9
11.1
2011
13.3
2010
Market evolution [EUR billion]
Sursa: ACAROM; Ministry of Finance
Automotive ComponentsAutomobile Production CAGR
The local automotive industry has risen at an average of 18% per year since 2009, reaching EUR 18 billion in 2014 backed by exports
• The industry has grown strongly since 2009, more than doubling since 2009 (125% growth)
• The evolution of the main automobile producers has driven growth of the automotive components sector, although the shares have remained constant
32.5%
67.5%
ComponentsAutomobiles
30.0%
70.0%
2009 total: EUR 8 bln 2014 total: EUR 18 bln
1
Industry split by products [%]
52016 The Government of Romania
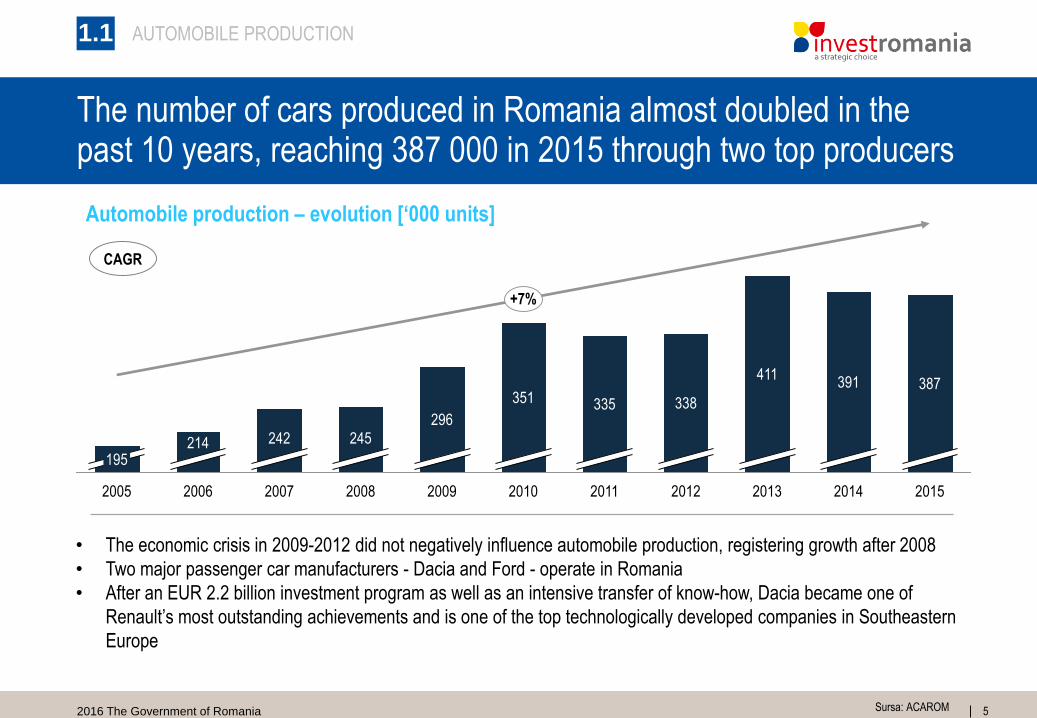
Automobile production – evolution [‘000 units]
Sursa: ACAROM
The number of cars produced in Romania almost doubled in the past 10 years, reaching 387 000 in 2015 through two top producers
1.1 AUTOMOBILE PRODUCTION
2005 2013201020092007
+7%
201420122006 2008 2011
214
296
195
245242
351 335
391 387
338
2015
411
CAGR
• The economic crisis in 2009-2012 did not negatively influence automobile production, registering growth after 2008
• Two major passenger car manufacturers - Dacia and Ford - operate in Romania
• After an EUR 2.2 billion investment program as well as an intensive transfer of know-how, Dacia became one of
Renault’s most outstanding achievements and is one of the top technologically developed companies in Southeastern
Europe

62016 The Government of Romania
Producer profiles
Sursa: Ministry of Finance
Dacia and Ford are the backbone of the local industry, hiring over 17000 people and accumulating over EUR 5 billion/ y in revenue
1.1 AUTOMOBILE PRODUCTION
Mioveni, Arges
Craiova, Dolj
4.2 89 14
0.9 6 3
2014 Revenue [EUR bln]
2014 Net profit[EUR mln]
2014 Employees[‘000]

72016 The Government of Romania
National production and export [# units]
Sursa: ACAROM
In 2014, 93% of local production of automobiles from the two producers was exported, with Ford selling next to 0% locally
1.1 AUTOMOBILE PRODUCTION
2013
14.0%
86.0%
Local market Export
92.0%
8.0%
Total production: 338 593Total production: 342 620
0.0%
100.0% 100.0%
0.0%
Total production: 52 829Total production: 68 339
2014Production evolution
-1%
-23%

82016 The Government of Romania
Mapping of horizontal sectors developed as a result of the evolution of automobile production
Sursa: ACAROM
Local industry has catalyzed the development of horizontal sectors, ranging from production of tires to electronics and optical devices
1.2 AUTOMOTIVE COMPONENTS
Export markets for components
Local automotive component integrators
• Tires
• Cables and conductors
• Plastics
• Aluminum and metal manipulation
• Rubber technical components
• Bearings and transmission components
• Electronics/ Mechatronic equipment
• Optical devices
• Batteries/ Accumulators
• Recycling
92016 The Government of Romania
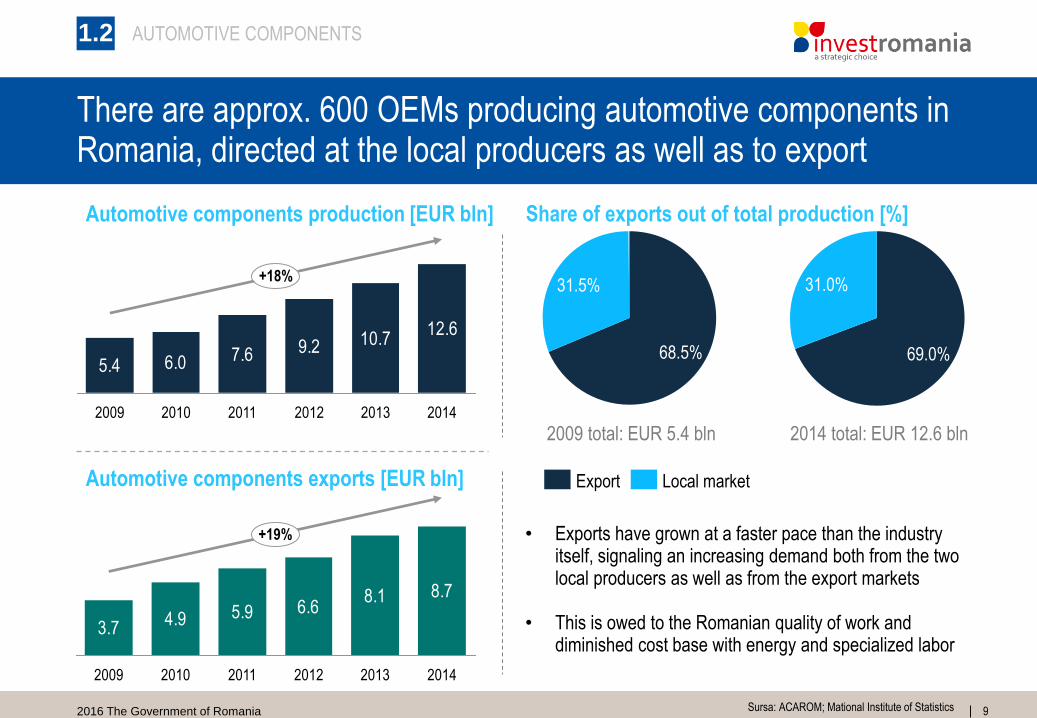
Automotive components production [EUR bln]
Sursa: ACAROM; Mational Institute of Statistics
There are approx. 600 OEMs producing automotive components in Romania, directed at the local producers as well as to export
1.2 AUTOMOTIVE COMPONENTS
5.4 6.0 7.6 9.2 10.712.6
2009 2010 2011
+18%
2013 20142012
31.5%
68.5%
31.0%
69.0%
2009 total: EUR 5.4 bln 2014 total: EUR 12.6 bln
Automotive components exports [EUR bln]
3.74.9 5.9 6.6
8.1 8.7
+19%
20142009 2010 201320122011
Share of exports out of total production [%]
Local marketExport
• Exports have grown at a faster pace than the industry itself, signaling an increasing demand both from the two local producers as well as from the export markets
• This is owed to the Romanian quality of work and diminished cost base with energy and specialized labor

2. Romania‘s promise as
an automotive hub
2.1 Human capital
2.2 Labor costs & taxes
2.3 Energy prices
2.4 Government support

112016 The Government of Romania
Enrolment in professional education has risen constantly, which translates to a shorter transit from the classroom to the workplace
49
2014
81
2013
+19%
156
86
2012
129
2011
1892
2
8
2
95
73
7
1
7
10
26
113
98
Special post-secondary schools – Cycle 2 Vocational schools Foremen Schools Post high school institutionsSpecial post-secondary schools
2.1
Source: NIS, Eurostat, InvestRomania
Students enrolled in professional schools in Romania [‘000]
HUMAN CAPITAL

122016 The Government of Romania
Over a 25% of graduating students will have a technical degree, followed by approx. another quarter in business and economics
• The quality of education in Romania is
recognized internationally, local students
consistently ranking in the top 10 in
International Olympiad competitions in math
and informatics, better than any other
country in the EU
• The focus on technical subjects is
significant, with the number of engineers/
capita – higher than the US, India, China or
Russia
• With 5 polytechnic universities, 59 domain
specific universities and 174 private
colleges, the most successful students tend
to pick high tech industries, such as IT – the
local education system supplies over 7,000
IT&C engineers every year
• 99% of Romanian students learn two or
more languages in upper secondary
education
10%
23%
11%28%
2%
26%
433
112 134
8
80 5743
Number of students by subject of degree [‘000, 2014]
* Includes: mathematics, physics, biology, chemistry, geography, journalism, history, political and administrative science, philosophy
Economics
Science and humanities
Medical
Arts
Technical
Law
Source: NIS, Eurostat, InvestRomania
University grads by subject of degree in 2014 [%]
2.1 HUMAN CAPITAL
132016 The Government of Romania
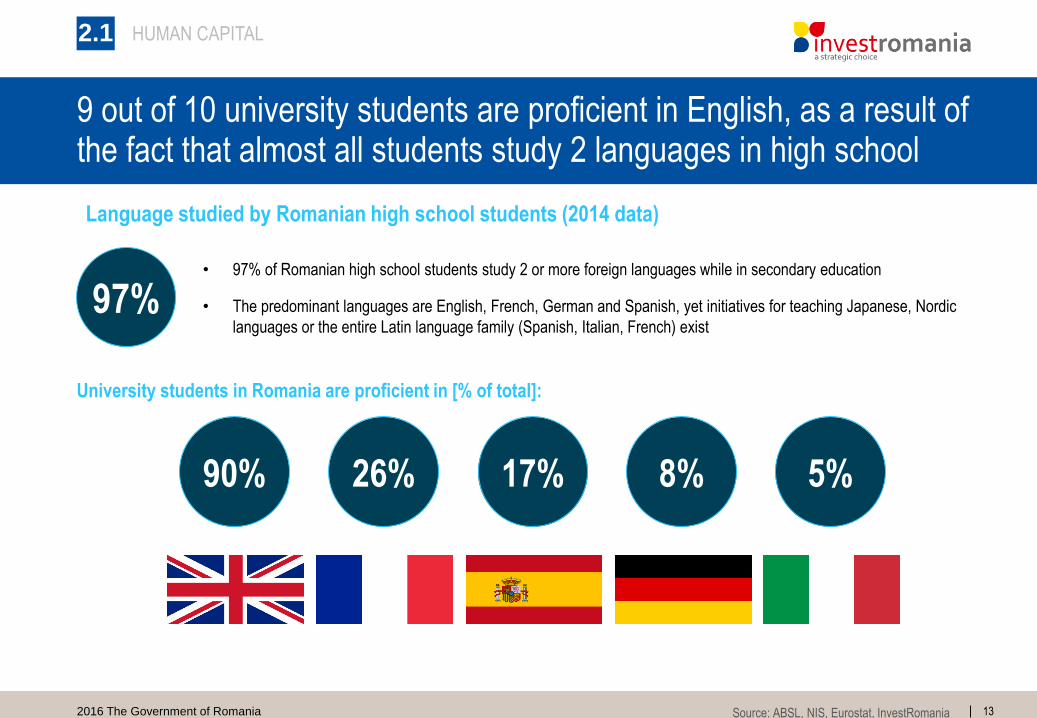
9 out of 10 university students are proficient in English, as a result of the fact that almost all students study 2 languages in high school
Source: ABSL, NIS, Eurostat, InvestRomania
97%• 97% of Romanian high school students study 2 or more foreign languages while in secondary education
• The predominant languages are English, French, German and Spanish, yet initiatives for teaching Japanese, Nordic
languages or the entire Latin language family (Spanish, Italian, French) exist
University students in Romania are proficient in [% of total]:
90% 26% 17% 8% 5%
2.1
Language studied by Romanian high school students (2014 data)
HUMAN CAPITAL

142016 The Government of Romania
The top university centers in Romania are Bucharest, Cluj – Napocaand Iasi, followed by Timisoara, Sibiu, Brasov and Constanta
Bucharest - 33 UniversitiesCluj - 10 UniversitiesIasi - 10 Universities
CJ
10
B
29
SB
3
AR
3
BVDJ
4
CT
5 49 6
TMIS
Number of graduates by University Center [‘000]
Sources: NIS, World Economic Forum, InvestRomania
= City 50,000 – 100,000 inhabitants
= City >100,000 inhabitants
Arad
Bacau
Baia Mare
Botosani
BrailaBrasov
Bucuresti
Buzau
Cluj-Napoca
Constanta
Craiova
Drobeta-Turnu Severin
Focsani Galati
Oradea
Piatra Neamt
Pitesti
PloiestiRamnicu Valcea
Satu Mare
Sibiu
Suceava
Targu Mures
Timisoara
Alba Iulia
Birlad
Bistrita
Calarasi
Deva
Giurgiu
Hunedoara
MediasOnesti
Resita
Roman
Sfantul Gheorghe
Slatina
SloboziaTargovisteTargu Jiu
Tulcea
Turda
VasluiZalau
Iasi
Human Capital Index 2015 - Rank 39Upper-middle income Country - Rank 3
Age group rankings
Human Capital Index
Top 3 University Centers
15 – 24Rank 45
25 – 54Rank 36
55 – 64Rank 29
2.1 HUMAN CAPITAL

152016 The Government of Romania
Romanian labor costs are some of the lowest in the EU, maintaining a competitive position relative to member states
2.2
National minimum wages in the EU [EUR/ month, 2016]*
PLEE
12131516
SLCY
16
RO
5
HUHR
10
GR PTES
21
MT LT
7
LV BG
689
CZ
9
SK
104
7
31
ATNL
36
SE UKDK
4034
30
LU DE
32
BE
3935
32
FR FI
37
28
IE
22
IT
Estimated average hourly labor costs [EUR/ h, 2014]**
1,923
1,5461,5291,5081,5021,4731,467
791764728684618431430408405370366353350
233215
ROBG LT LUIEUKMTGRPTPL DE BEFR NLSLESHRSK EELVHU CZ
* Denmark, Italy, Cyprus, Austria and Finland have not implemented a national minimum wage; ** Enterprises with 10 or more employees
Other labor costs Wages and salaries
Source: Eurostat
LABOR COSTS

162016 The Government of Romania
Social Security
With the local taxes already low compared to European peers, the government plans future tax cuts through the new fiscal code
VAT
Individual Tax Rate Corporate Tax Rate
2.2
EmployerEmployee
16%
• The government is committed to
reducing the tax burden – 2016
marked the drop in VAT to 20%,
which will be followed by
another drop to 19% in 2017
• VAT on food products is 9%
• The individual tax rate does not
have any planned cuts for the
near future
• However, the new fiscal code
planned a reduction of the
dividend tax from 16% to 5%
• The government’s
commitment to lower the
tax burden covers the
corporate tax rate as well,
with a reduction to 14%
planned for 2019
Tax System of Romania
Source: InvestRomania
Overview of the Romanian tax system
16%
20%
16%
23%
TAXES

172016 The Government of Romania
The taxes are some of the lowest in the EU, with planned policies aiming to reduce them even further in the favor of businesses (1)
2.2
Source: KPMG
VAT in the EU [2015, %]
171819192020202020202021212121212122222323232324252527 25
FREEATLV BGLT UKRO DECY MTSK LUES NLFISEHRDKHU ITPLIE SIPT BE CZGR
10131315151617191919202020202122222425252829293031333435
LTRO LV IE BGCYSIDK UKEEHRSKSEATNLESGR HULU PL CZFIPTFR ITBEMT DE
Corporate tax rate in the EU [2015, %]
10151616202223253235354042434445454547484850505052525557
SE DK PTSIBENLFI AT FRESIE DE UK ITLU LTHUEECZCY BGLV ROSKPLHR MTGR
Individual tax rate in the EU [2015, %]
TAXES
182016 The Government of Romania
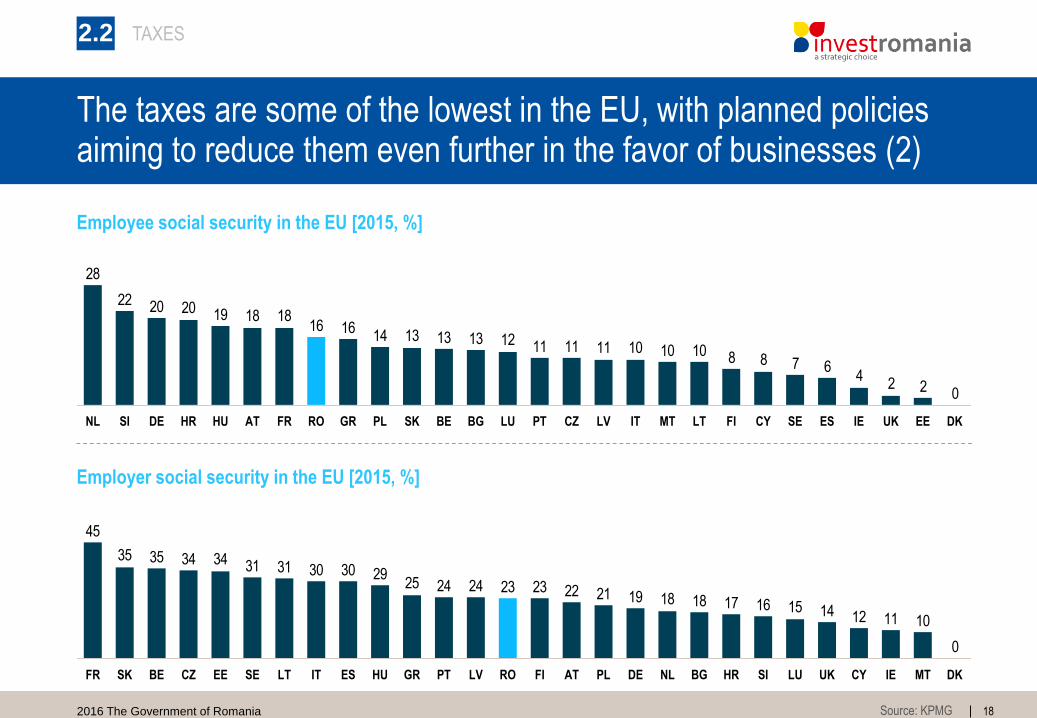
The taxes are some of the lowest in the EU, with planned policies aiming to reduce them even further in the favor of businesses (2)
2.2
Employee social security in the EU [2015, %]
0224
678810101011111112131313141616
181819202022
28
CZLUHU GRSI BG PTSKPLFRATDENL BEROHR LV EESE UK DKIEESLTMTIT FI CY
Employer social security in the EU [2015, %]
0
1011121415161718181921222323242425293030313134343535
45
DKMTIEAT SIBGFI NLDE CYRO LUPL UKGRHU HRLVPTEEBE LTSEFR ESCZSK IT
Source: KPMG
TAXES

192016 The Government of Romania
Romania has some of the lowest energy prices in the EU, marginally diminishing the cost base for energy intensive manufacturers
2.3
Source: Eurostat
Electricity prices in the EU [EUR / 1000 kWh, 2015]
616264687171727376767678818283848790919499104108112129132
144156
ROSI DKSEFIBGNLLTPL DEBE ATHRLVIT EEHULU FRCZCY ESUK IE SK PTELMT
Medium sized industry - electricity prices
6888888999999991010101010101010111111
NLBELTCZ DK ROPL ATSIIT BG FILVSKUKEEFRHUELLU SEIEESHRPT DE
Medium sized industry - gas prices
Gas prices in the EU [EUR / gigajoule, 2015]
ENERGY PRICES

202016 The Government of Romania
Number of payments required to cover tax costs per year
Source: World Banks, Doing Business Report 2016
8891014
999911
2829
20082006 20142004 20122010 20162007 2009 2011 2013 20152005
11-21
1414
3941
113113113113108108108
20142013 20152009 2010 20122008 201620112006 2007
-99
2.4
The government is showing more and more support to the private sector, implementing pro-growth policies to support entrepreneurs (1)
Number of days required to start a business in Romania
• From a tax perspective, the number of
payments/ year required to fulfil fiscal
obligations has dropped dramatically, from
113 in 2012 (historic maximum) to just 14
in 2016
• Coupled with a tax system that is one of
the most friendly in the EU, a more
accessible tax system is the next step for
growth
• In order to support entrepreneurs, the
Romanian government has also simplified
the process of opening up a business,
reducing the necessary time from 29 days
in 2004 to a little over a week in 2016
• For the short, medium and long term, the
government is committed to aiding
emerging entrepreneurs
GOVERNMENT SUPPORT

212016 The Government of Romania
0.60.70.70.80.80.90.91.11.51.6
1.92.2
2.9
20152014 2016201320122007 2009200820052004 20102006 2011
- 2.3 p.p.
2.02.12.42.83.02.62.83.54.54.45.3
7.4
10.9
2007 200920082005 2006 20102004 20152014201320122011 2016
- 8.9 p.p.
2.4
The government is showing more and more support to the private sector, implementing pro-growth policies to support entrepreneurs (2)
Paid-in minimum capital [% of income per capita]
Cost to start a business [% of income per capita] • Overall, the cost to start a business in
Romania has decreased by about 9
percentage points every year since 2004,
reaching 2% in 2016, the lowest recorded
value
• The pro-growth policy is still being
implemented, with further tax cuts and aids
being developed by the government
• The pro-growth policy has further
implications in the Romanian business
environment, with the necessary paid-in
minimum capital decreasing by 2.3
percentage points since 2004, reaching a
minimum historical value of 0.6% of
income per capita
Source: World Banks, Doing Business Report 2016
GOVERNMENT SUPPORT

222016 The Government of Romania
Fiscal incentives are aimed at leveraging the local technology and R&D capabilities by incentivizing investors and employers (1/2)
• 16% profit tax exemption for the reinvested profit in new technological equipment used for business purposes
• Eligible R&D expenses include: depreciation of R&D equipment, salaries for R&D personnel
• 50% of these expenses can be deducted from the taxable income
• A deduction of 50% from the fiscal value of the assets during the first year of use, while the remaining value may be depreciated linearly along the expected remaining lifespan
• Accelerated depreciation can be used also for equipment and/ or for research and development activities
• If a company benefits from exemption of the income tax for reinvestment it will not benefit from accelerated depreciation
Fiscal incentive Short description
Exemption from
profit tax
Income tax exemption for IT&C employees
Deduction of R&D eligible
expenses
Accelerated depreciation of machinery, equipmentand real estate used for R&D purposes
• An exemption on the 16% income tax is available in Romania for employees activating in IT, under conditions including:o Bachelor’s degree in one of the 14 technical specializations availableo Employee is hired on a software engineer/ programmer/ software analyst
positiono Annual revenue per exempted employee must be over USD 10 000
Sources: Ministry of Public Finance, InvestRomania
2.4 GOVERNMENT SUPPORT

232016 The Government of Romania
Fiscal incentives are aimed at leveraging the local technology and R&D capabilities by incentivizing investors and employers (2/2)
• Income received by people with serious disabilities can benefit from income tax exemption (e.g., for salary income, income from freelancing activities)
• Investors that set up manufacturing locations or offices in an industrial, scientific or technological park benefit from o Exemption on land, building and urban planning tax o Taxes charged for changing land destination
• International income derived by Romanian residents is tax exempted under the following conditions:o There is a valid tax treaty between Romania and the relevant jurisdiction
(from where the income is derived by the Romanian resident) o The interested party (taxpayer) can demonstrate that income tax was paid
abroad on the respective incomeo The tax credit cannot exceed the Romanian tax applicable for the respective
income
Fiscal incentive Short description
Foreign tax credit
Facilities for people with
serious disabilities
Industrial parks
incentives
Sources: Ministry of Public Finance, InvestRomania
2.4 GOVERNMENT SUPPORT

242016 The Government of Romania
In a competitive market employment incentives are designed to maximize productivity of the available human resource
For both types of incentives the employers will have to take into
consideration that they have to maintain working relations for 18 months.
In case of termination the employment contract before this period, the
employer will return the incentive if the contract was terminated in the
following conditions:
• Termination of the employment contract due to cancellation of
the employees position in the company for reasons which are
not related to the employee;
• In case the employee does not correspond professionally to the
job he has been assigned;
• Nullity of the employment contract observed by the parties
agreement or by a court decision; In case that job is occupied
again by a person that was illegally fired.
Hiring young graduates for
undetermined periods.
The incentives are granted to the
employer on a monthly basis for a
period of one year.
Hiring unemployed individuals with
the age over 45 (for an undetermined
period).
The incentives are granted to the
employer on a monthly basis for a
period of one year.
Employment incentives
Sources: Ministry of Public Finance, InvestRomania
2.4 GOVERNMENT SUPPORT

252016 The Government of Romania
State aid in Romania can be executed through 4 main methods, each being employed by various state aid schemes
• State Resources transfer
– Grants
– Fiscal benefits
– Guarantees
• Selectivity
– Oil reserves (with 600 million barrels)
– Export growth rate of R&D services
– Energy independence
• Effect upon market competitiveness and trade
– If EU law is obeyed, the skewing effect is drastically
reduced, according to the Competition Council
• Economic Advantage
– Renting or buying property from the state under the
market price
– Subsidies for salary costs
– Access to infrastructure tax-free
State Aid policy in Romania has been developed according to EU Law in order to facilitate
and stimulate foreign investment in the country
Sources: Ministry of Public Finance, InvestRomania
2.4 GOVERNMENT SUPPORT

262016 The Government of Romania
With a budget of EURm 600 for the next 6 years, the two schemes for regional state aid aim to support value adding investments
• The two schemes offer state aid in the form of non reimbursable grants from the state budget, caped by the limit of maxim intensity
approved according to the regional map
Aim• To support minimum investments valued at
EUR 10 million
• The creation of at least 10 jobs per
location, out of which 3 jobs are for
unfavored workers
Eligible Costs
• Construction of new buildings
• Renting costs for existing buildings
• CAPEX aimed at technical installations
and tools
• Acquisition of intellectual property
• Salary costs registered for a 2 consecutive
year period resulted as a direct
consequence of the investment
• Salary costs are comprised of gross
annual salary plus benefits
Budget • Total budget for the two schemes is EUR 600 million, with annual investments projected at EUR 100 million
Payout • 2015 – 2023 • 2015 – 2025
GD 2014/ 807 GD 2014/ 332
Sources: Ministry of Public Finance, InvestRomania
2.4 GOVERNMENT SUPPORT

272016 The Government of Romania
Eligibility criteria for companies concern their financial health and their capacity to see the investment project through
Eligibility Criteria for Companies (separate)
Eligibility Criteria for Companies (common)
• In the case of GD 2014/ 807, payout occurs after all or part of the eligible expenses have been covered
• In the case of GD 2014/ 332, payout occurs on a quarterly basis, after all or part of eligible expenses have been covered
GD 2014/ 807
• Net profitability for existing companies:
> 0%
• Equity for new companies: >= RON
100,000
• Net profitability for existing companies:
>1%
• Equity for new companies: >= RON
30,000
GD 2014/ 332
• Are registered according to company law no. 1990/31
• Execute an investment in one of the eligible sectors
• Do not have outstanding debt from the general consolidated budget
• Are not registered as enterprises in difficulty or are not debtors in an enforcement or insolvency
proceeding, nor are they suspended from activity
• Are not part in a state aid recovery proceeding
• Have not benefited from regional state aid for eligible costs in the same investment project
• Have not closed a similar or even identical enterprise in the European economic area in the past two
years and do not plan to do so for the next 2 years after the execution of the initial investment
Sources: Ministry of Public Finance, InvestRomania
2.4 GOVERNMENT SUPPORT

282016 The Government of Romania
There are also eligibility criteria pertaining to the project itself, such as its value and viability over the short, medium and long term
Eligibility Criteria for Investments (separate)
Eligibility Criteria for Investments (common)
• Minimum value: EUR 10 million
• To be viable and determine the operational
efficiency of the company
• To prove the stimulating effect of state aid
• To generate contributions to regional
development
• To facilitate extra investment in the region
• To lead to the creation of 10 new jobs per
investment location, out of which 3
positions to be covered by unfavored
workers
• To be viable and determine the operational
efficiency of the company
• To be considered initial investments
• In the case of large companies in the Bucharest region, investments must also develop new economic
activities within the local ecosystem
GD 2014/ 807 GD 2014/ 332
Sources: Ministry of Public Finance, InvestRomania
2.4 GOVERNMENT SUPPORT

292016 The Government of Romania
The intensity of state aid varies according to the region, varying from 15% (in Bucharest) to 50% in most of the country
North-West
50%
West
35%
North-East
50%
Center
50%
South-East
50%
South-West
50% South
50% 15%
35%
State aid intensity, according to development region:• North West – 50%
• North East – 50%
• South East – 50%
• South – 50%
• South West – 50%
• West – 35%
• Ilfov County – 35%
• Bucharest – 15%
• State aid intensity is established as per EU and national regulations and is subject to change according to EU law on the matter• Development regions of Romania represent a split of counties into larger regions in order to technically better target development programs and policies
Sources: Ministry of Public Finance, InvestRomania
2.4 GOVERNMENT SUPPORT
302016 The Government of Romania
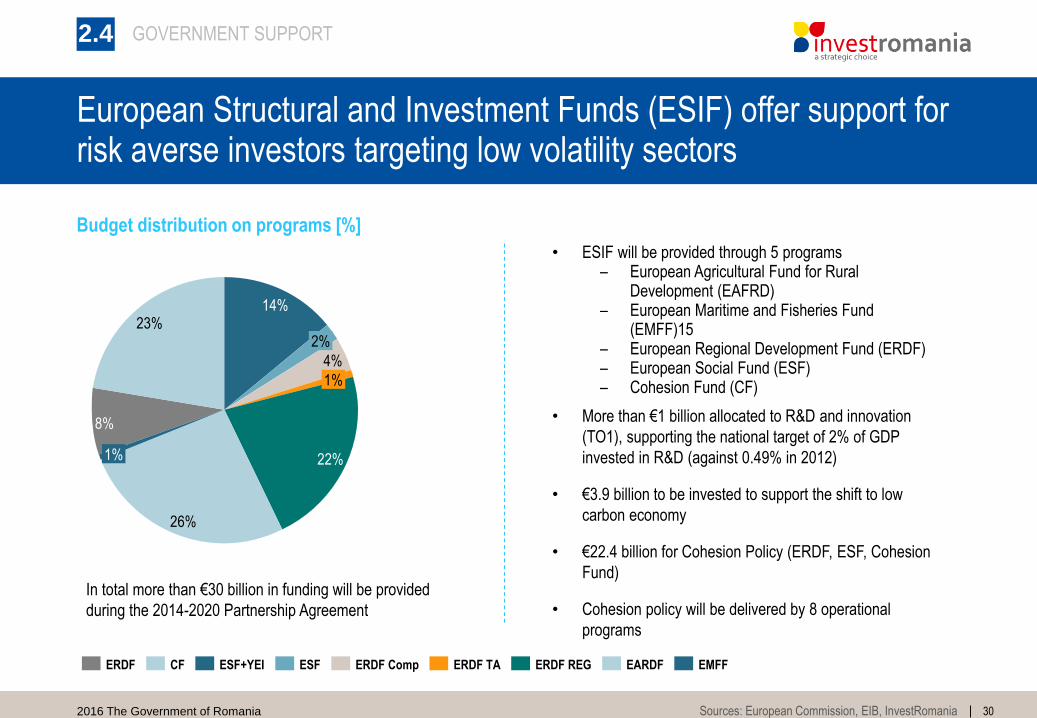
European Structural and Investment Funds (ESIF) offer support for risk averse investors targeting low volatility sectors
• ESIF will be provided through 5 programs– European Agricultural Fund for Rural
Development (EAFRD)– European Maritime and Fisheries Fund
(EMFF)15– European Regional Development Fund (ERDF)– European Social Fund (ESF)– Cohesion Fund (CF)
• More than €1 billion allocated to R&D and innovation
(TO1), supporting the national target of 2% of GDP
invested in R&D (against 0.49% in 2012)
• €3.9 billion to be invested to support the shift to low
carbon economy
• €22.4 billion for Cohesion Policy (ERDF, ESF, Cohesion
Fund)
• Cohesion policy will be delivered by 8 operational
programs
14%
2%
22%1%
26%
1%
4%
8%
23%
ESF+YEI EARDF EMFFERDF CF ERDF CompESF ERDF REGERDF TA
In total more than €30 billion in funding will be provided
during the 2014-2020 Partnership Agreement
Budget distribution on programs [%]
Sources: European Commission, EIB, InvestRomania
2.4 GOVERNMENT SUPPORT

312016 The Government of Romania
The Investment Plan for Europe (Juncker Plan) can be a very effective financing tool for riskier projects through the EFSI*
POLICYSECTORS COMPANIES
• The EFSI will target specific
sectors, including:
– Infrastructure
– Education
– Research
– Innovation
– Renewable energy
– Energy efficiency
• The companies targeted by the EFSI for
investment must fall into one of the
following two categories:
– Small and medium enterprises
(250 employees maximum)
– Mid-caps (250 to 3000
employees)
• Companies will also have to
facilitate the following objectives:
– Promote job creation
– Long term growth
– Competitiveness
• Besides the three filters, the criteria on which investment decisions are based include:
– Economic viability with the support of the initiative
– Sufficiently mature character in order for the business to be appraised on a global or local basis
– Consistency with EU policy priorities and value adding character at European level
– Maximization of private sector financing
• Projects do not have to be cross border
EFSI investment thesis outline
Sources: European Commission, EIB, InvestRomania
* EFSI = European Fund for Strategic Investment is a EUR 21 billion guarantee fund and core of the Investment Plan for Europe dedicated to facilitating private
investment across the EU
2.4 GOVERNMENT SUPPORT

322016 The Government of Romania
However, it is not only companies that can apply for EFSI financing; investment funds, public sector entities or banks are also welcome
Public Sector Entities (except Member States themselves)
SMEs (up to 250 employees)
Mid-caps (up to 3000 employees)
Large entities such as• Utilities• Special purpose vehicles• Project companies Banks to deliver intermediated lending (incl.
National Promotional Banks)
Investment funds
Bespoke Investment Platforms
• There are two main ways to apply for ESFI financing:– Through direct contact of the EIB with the proposal, following the usual application on the EIB website for the strategic investment
window – the government is not a gatekeeper in this process– Through the EIF financial intermediaries (dedicated to SMEs and mid-caps)
EFSI
Entities that can apply for EFSI financing
Sources: European Commission, EIB, InvestRomania
2.4 GOVERNMENT SUPPORT


