romania towards being a creative hub - guvernul...
TRANSCRIPT

Romania – towards being a
creative hub

22016 The Government of Romania
1. Creative Industries overview
1.1 CCIs sub-sectors
1.2 Most developed branches
1.3 Mapping CCIs
2. The development of Creative Industries in Romania [by sub-sector]
Market size
Labour
Government facilities & financing options
Contents

1. Industry overview
1.1 CCI`s sub-sectors
1.2 Most developed branches
1.3 Mapping Creative Industries

42016 The Government of Romania
The GDP contribution of the CCI sector overcame Agriculture by 0.1 p.p in 2013 and reached a level of 7% in 2014
Cultural activities [by sub-sector]
Arts – classified by sub-sectors
Creative activities [by sub-sector]
• Interactive leisure software• Music• Film and Video • Publishing• Television and Radio• Patrimony
• Performing arts
• Visual Arts
• Creative Writing and Music Composition
• Architecture• Advertising• Design • Software
CCI - concentric circles classification
1.1 CCI’s SUB-SECTORS
Source: KEA European Affairs
52016 The Government of Romania
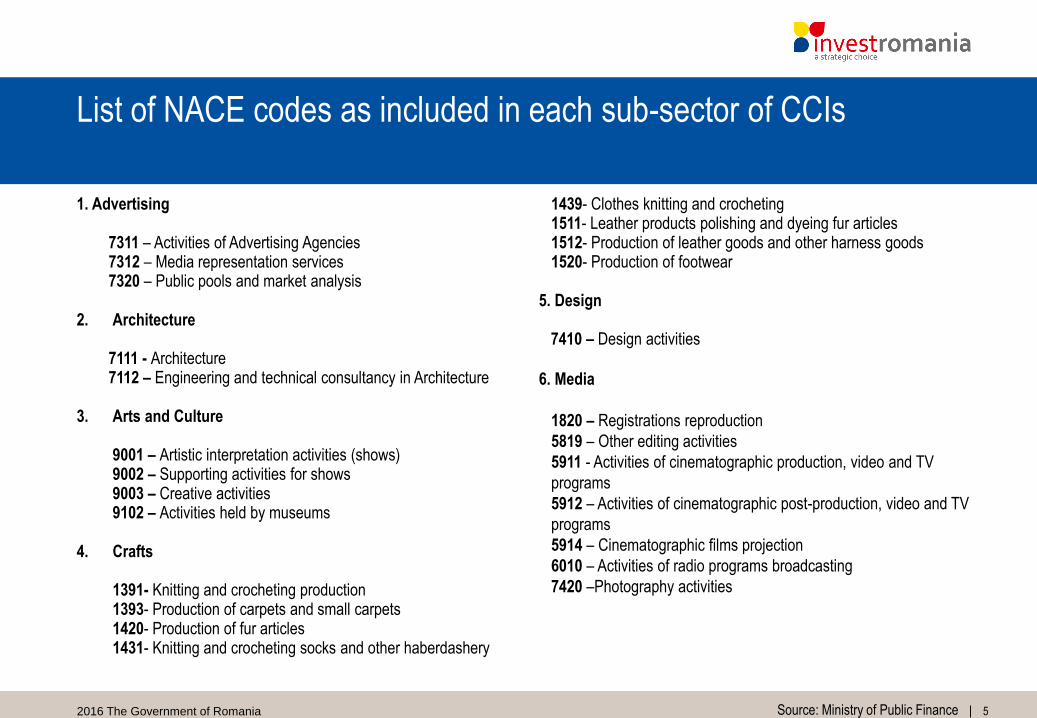
List of NACE codes as included in each sub-sector of CCIs
1. Advertising
7311 – Activities of Advertising Agencies 7312 – Media representation services7320 – Public pools and market analysis
2. Architecture
7111 - Architecture7112 – Engineering and technical consultancy in Architecture
3. Arts and Culture
9001 – Artistic interpretation activities (shows) 9002 – Supporting activities for shows9003 – Creative activities9102 – Activities held by museums
4. Crafts
1391- Knitting and crocheting production1393- Production of carpets and small carpets 1420- Production of fur articles1431- Knitting and crocheting socks and other haberdashery
1439- Clothes knitting and crocheting 1511- Leather products polishing and dyeing fur articles 1512- Production of leather goods and other harness goods1520- Production of footwear
5. Design
7410 – Design activities
6. Media
1820 – Registrations reproduction
5819 – Other editing activities
5911 - Activities of cinematographic production, video and TV
programs
5912 – Activities of cinematographic post-production, video and TV
programs
5914 – Cinematographic films projection
6010 – Activities of radio programs broadcasting
7420 –Photography activities
Source: Ministry of Public Finance

62016 The Government of Romania
7. Sports and Entertainment
9311 – Activities of the sports facilities
9312 – Activities of the sports clubs
9313 – Activities of the fitness centers
9319 – Other sports activities
9321 – Fairs and amusement parks
9329 – Other leisure and fun activities
8. Publishing
5814 – Editing of magazines and other publications5819 – Other editing activities7430 – Translations
10. Software 6312 – Activities of the Web portals6311 – Data analysis, web pages administration and
similar activities5821 – Computer games editing 5829 – Editing of other Software products
Source: Ministry of Public Finance
List of NACE codes as included in each sub-sector of CCIs
9. Printing
1811 – Newspaper printing
1812 – Other printing activities
1813 - Printing preview services
1814 – Bookbinding and other similar activities
5811 - Book editing
5812 – Editing of guides, leaflets and similar products
5813 – Newspaper editing

72016 The Government of Romania
In 2014, Bucharest’s total turnover for CCIs was of 62,56% of the national economy for this sector, the highest level in the country
• Bucharest – Radio and Advertising• Cluj – Capital of shows and festivals• Timiș – Gaming • Brașov – The heart of museums • Ilfov – The film citadel • Iași – Best Web Creativity
Top cities by CCI most developed sector
2.6%62.6%
7.8%
26.6%
Timis
Cluj
Bucharest
Others
Total turnover for CCIs by city
1.2 MOST DEVELOPED BRANCHES
Source: ONRC

82016 The Government of Romania
57,000
58,000
63,000
62,000
56,000
59,000
61,000
55,000
60,000
0
62,409.0
61,237.0
58,390.0
20122010 2011 2013 2014
57,951.0
2008 2009
+2%
56,723.0
59,308.0
54,637.0
2015
55,067.0
-5%
CCI active companies [#]
CCIs sit at the heart of innovation in the economy and they are recognized as a hub with many other activity sectors
• The number of active companies has been constantly growing since 2009, despite the drop between 2008 and 2009, as Romania real GDP decreased with 6,6%.
21.0%57.0%
22.0%
2013 total: EUR 10 bn.
1.2
Main sectors in CCI industry [%] in 2013
Others
Creative arts and entertainment
Software, consultancy and Informational Services
MOST DEVELOPED BRANCHES
Sources: Ministry of Public Finance, InvestRomania

92016 The Government of Romania
No. of employees [overall industry]
Overall, the number of employees dropped by 17% between 2008-2015 but, after 2013, it strongly increased in the Software sector
1.2 MOST DEVELOPED BRANCHES
277,532276,984270,611271,732273,091278,069299,169
362,452
20112010 20122008 2009 2015
-17%
20142013
• The economic crisis of 2009-2012 negatively influenced labour force participation in CCIs, registering a constant decrease between 2008
and 2013.
• Even though the number of employees dropped dramatically between 2008 and 2009, the Software sub-sector registered a significant
growth after 2010, reaching in 2015 more than 89,000 employees and overcoming the level of 2008 by 34%
• Romania overcame the level of EU28 in terms of Female market participation in CCIs by 7.1 p.p, reaching a level of 51.1% women working
in Creative arts
No. of employees
51.0%49.0%
Male
Female
Female market participation [2014]
Sources: Ministry of Public Finance, InvestRomania

102016 The Government of Romania
Overall, in 2015, the total turnover for the CCI sector grew up by 4% against 2014 and labour productivity increased after 2010
80
100
0
85
90
75
9595,9
72,1
93,0
2008
77,2
92,2
86,3
20142013 20152012201120102009
CAGR+5%
84,385,7
Total turnover [EUR Bn.]Labor productivity [ EUR 000’]
32
34
38
36
0
30
28
2008 2009 20152013
-9%
2012 2014
+5%
20112010
25.4
33.9
29.3
33.932.8
35.9
27.9
37.6
• CCIs represent a great environment for entrepreneurial development.• According to the study “Creating Growth - Measuring Cultural and Creative Markets in the EU” led by EY in 2014, at an European
level, the CCI creates a number of jobs which is 2,5 times higher than the one displayed by the Automotive sector.• The same study showed that, in 2014, the number of employees in CCIs - at a European level - was more than 7 mil. people.
Sources: Ministry of Public Finance, INCFC, InvestRomania
1.2 MOST DEVELOPED BRANCHES

112016 The Government of Romania
Net margin was above national economy average in 2015, at 11.64% of the total turnover. The most profitable segment was Arts with a net margin of 20,8%
Net profit margin in 2015 [%]
Sources: Ministry of Public Finance, INCFC, InvestRomania
1.2 MOST DEVELOPED BRANCHES
• CCI’s represent an important sector in terms of netmargin. According Ministry of Public Finance data, CCI’snet profit margin reached 11.64% of total turnover of thesector.
• At the same time, the most profitable sector in terms ofnet margin was Arts (20,8%), followed by Sports (20.7%),Architecture (13.3%), Design (14.5%) and Software(12.5%).
0
2
4
6
8
10
12
14
16
18
20
22
CCI sector
11.6%
20,720,8
11,4
14,5
11,6
10,0
5,6
13,312,5
Sports
Software Arts
Design
Advertising
MediaArchitecture
Crafts
Printing

1.3 Mapping Creative
and Cultural Industries
132016 The Government of Romania
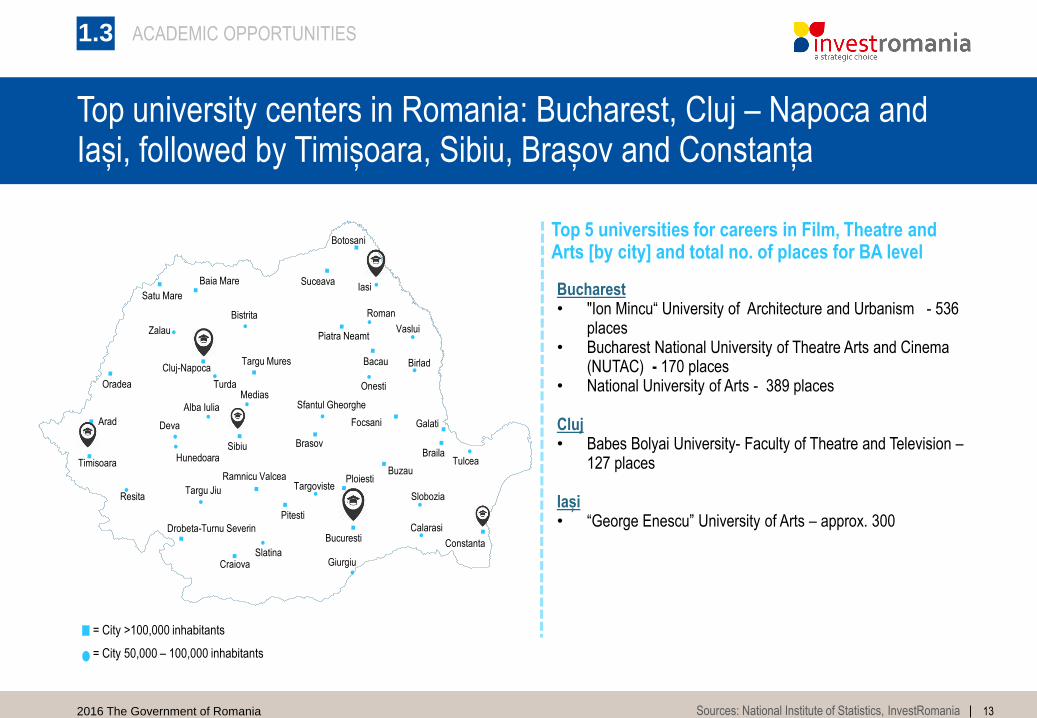
Top university centers in Romania: Bucharest, Cluj – Napoca and Iași, followed by Timișoara, Sibiu, Brașov and Constanța
Bucharest • "Ion Mincu“ University of Architecture and Urbanism - 536
places• Bucharest National University of Theatre Arts and Cinema
(NUTAC) - 170 places• National University of Arts - 389 places
Cluj• Babes Bolyai University- Faculty of Theatre and Television –
127 places
Iași• “George Enescu” University of Arts – approx. 300
Sources: National Institute of Statistics, InvestRomania
= City 50,000 – 100,000 inhabitants
= City >100,000 inhabitants
Arad
Bacau
Baia Mare
Botosani
BrailaBrasov
Bucuresti
Buzau
Cluj-Napoca
Constanta
Craiova
Drobeta-Turnu Severin
Focsani Galati
Oradea
Piatra Neamt
Pitesti
PloiestiRamnicu Valcea
Satu Mare
Sibiu
Suceava
Targu Mures
Timisoara
Alba Iulia
Birlad
Bistrita
Calarasi
Deva
Giurgiu
Hunedoara
MediasOnesti
Resita
Roman
Sfantul Gheorghe
Slatina
SloboziaTargovisteTargu Jiu
Tulcea
Turda
VasluiZalau
Iasi
Top 5 universities for careers in Film, Theatre and Arts [by city] and total no. of places for BA level
1.3
.
ACADEMIC OPPORTUNITIES
142016 The Government of Romania
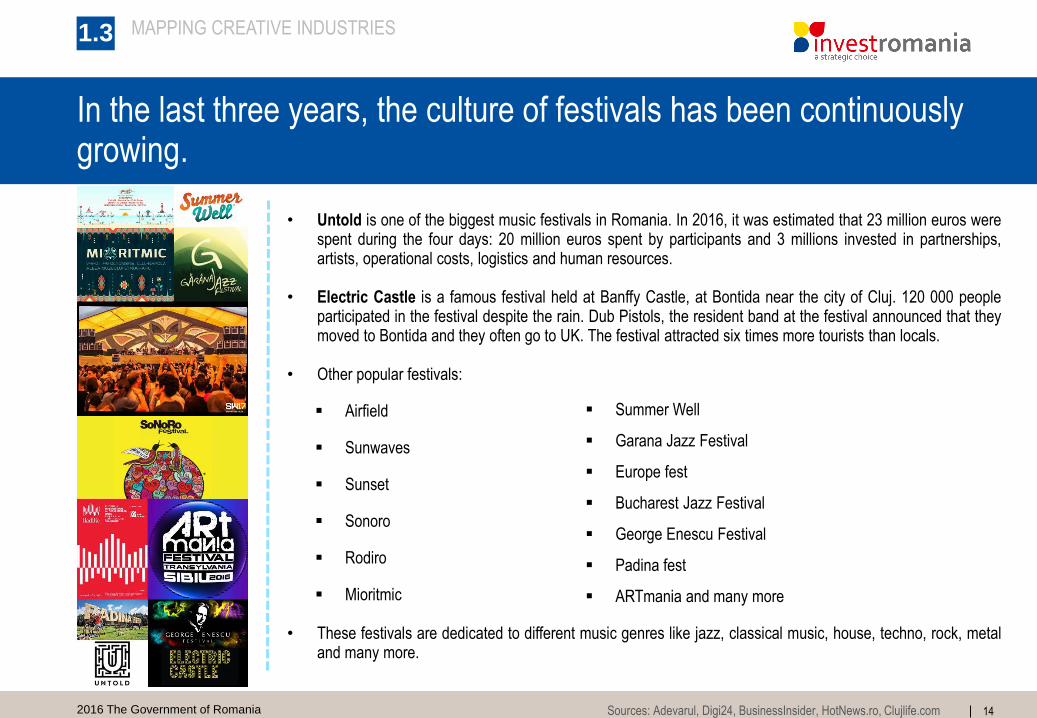
• Untold is one of the biggest music festivals in Romania. In 2016, it was estimated that 23 million euros werespent during the four days: 20 million euros spent by participants and 3 millions invested in partnerships,artists, operational costs, logistics and human resources.
• Electric Castle is a famous festival held at Banffy Castle, at Bontida near the city of Cluj. 120 000 peopleparticipated in the festival despite the rain. Dub Pistols, the resident band at the festival announced that theymoved to Bontida and they often go to UK. The festival attracted six times more tourists than locals.
• Other popular festivals:
Airfield
Sunwaves
Sunset
Sonoro
Rodiro
Mioritmic
• These festivals are dedicated to different music genres like jazz, classical music, house, techno, rock, metaland many more.
In the last three years, the culture of festivals has been continuously growing.
1.3 MAPPING CREATIVE INDUSTRIES
Sources: Adevarul, Digi24, BusinessInsider, HotNews.ro, Clujlife.com
Summer Well
Garana Jazz Festival
Europe fest
Bucharest Jazz Festival
George Enescu Festival
Padina fest
ARTmania and many more

152016 The Government of Romania
This year, Romania will be put under magnifying glass at Astra Film Festival through the documentaries presented.
• First film presented at Astra Film will be the BBC documentary “The New Gipsy Kings”, aunique product that talks about the complex phenomenon created around manele musicinterpreters. Other documentaries: Chat with Alice; Just a breath; Angela; Pregnant inRomania; Cinema, mon amour
• NexT is one of the biggest short film festival. This year it was the 10th anniversary. Therewere presented 140 short films and more than 16 sections. Out in Space, Oscars Night,Avant garde, NexT is Feminist, LGBT are important programs.
• Transylvania International Film Festival is the biggest event. This year emotionalmoments at TIFF, Romanian actress Tamara Buciuceanu received the Excellency Awardfor her entire career.
• Other film festivals: Bucharest International Experimental Film Festival, Timishort Film Festival, Pelicam International Film, Historic Film Festival at Râșnov, ANONIMOUS International Independent Film Festival, International Independent Film Producers Festival, Etno Film Festival, Anim’est, Bucharest International Experimental Film Festival and many more.
Sources: Infestival, Stirile Protv

162016 The Government of Romania
Romanian Film Director, Cristian Mungiu, took a new award for the“Best Director” Category at Cannes Film Festival in 2016
• In the last 10 years, the Romanian Film Industrybecame known at an international level due toproducers like Cristian Mungiu, Radu Jude, CalinPeter Netzer, Cristi Puiu or Corneliu Porumboiu.
• For the production of Graduation, Cristian Mungiureceived Best Director Award at Cannes’ FilmFestival on Sunday, 18th of September 2016.Mungiu is also renowned for the film “4 months, 3weeks and 2 days”.
• Other movies that received International Awards: The Death of Mister Lazarescu, Was it or was it not?, Child’s Pose, California Dreamin’ and many others.
Sources: The Guardian, IMDb

172016 The Government of Romania
• Festivals like The Maiden’s Fair (Alba), The Traditional CraftsFair (Bucharest), Medieval Days (Sighisoara), OradeaMedieval Festival (Oradea), Shepherds' Milk Fair (Brasov) justto name a few, support the promotion of arts and crafts andencourage the development of each of these sub-sectors.
The Romanian traditions are promoted through annual fairs and festivals and “IA” - the traditional blouse- is very popular abroad
1.3 MAPPING CREATIVE INDUSTRIES
Sources: Romaniatourism.com , InvestRomania
Arad
Bacau
Baia Mare
Botosani
BrailaBrasov
Bucuresti
Buzau
Cluj-Napoca
Constanta
Craiova
Drobeta-Turnu Severin
Focsani Galati
Oradea
Piatra Neamt
Pitesti
PloiestiRamnicu Valcea
Satu Mare
Sibiu
Suceava
Targu Mures
Timisoara
Alba Iulia
Birlad
Bistrita
Calarasi
Deva
Giurgiu
Hunedoara
MediasOnesti
Resita
Roman
Sfantul Gheorghe
Slatina
SloboziaTargovisteTargu Jiu
Tulcea
Turda
VasluiZalau
Iasi
• Through the diversity of customs and traditions exhibited by
every region of the country, Romania has a lot of potential to
exploit in the Crafts sector.
Main Arts and Crafts festivals [by city]Traditional arts and crafts products include blouses, cutlery, decorative porcelains

2. Market size and human
capital [by sub-sector]

192016 The Government of Romania
Between 2008 – 2015 labor productivity increased with about EUR 10k per employee in CCI’s sector
Labor productivity (EUR) [for Software]
0
40,000
35,000
45,000
32,741
2008
41,591
44,277
20142013
38,945
36,88938,391
2010
40,292
20122009
40,271-11.2%
20152011
• The sub-sector of Computer Programming, Consultancy and Information Services Businesses brought the highest level of GVA
contribution and since 2013 it has been continuously increasing, mainly due to the growing number of start-ups, most of them
focusing on the development of applications for the improvement of social media usage.
• Labour productivity had a 11,2% decrease in 2009 compared to 2008, mainly due to the financial crisis of 2007-2008 but it has been
constantly increasing since 2012, especially since the Software sub-sector is growing faster than the one for R&D and specialists are
turning to start-ups and increasing the number of employees in the Software development sub-sector.
Source: Eurostat
SOFTWARE2.
39.1%
60.9%
The whole Industry
Software
2015 – Total Turnover

202016 The Government of Romania
3.000
2.000
0
1.500
2.500
+1.628
201520132010 20142008 20112009
2.984
2012
Total turnover [EUR Mil.]
Total turnover [Software vs. CCI’s sector]
6
0
8
4
2
3,0
6,2
1,52,1
6,0
1,2
20132011201020092008 20152012
1,4
7,9
2014
6,86,5 6,66,86,7
2,41,91,7
Total CCI’s turnover [EUR Bil.]Software [EUR Bil.]
• The Software sector recorded a severe drop in 2009, butit was followed by a steady growth up to 2015.
• It is expected to grow further in the next year, taking intoaccount the recent development of the market, the levelof foreign investment attracted by Romania in this sectorand the Romanian Government’s initiative in building anIT Hub for public services in order to attract Software andIT specialists.
Total turnover’s evolution [Software]
• In 2014, against 2009, the editing activities of other Softwareproducts (NACE code 5829) came third for having one of thebiggest growth levels in total turnover.
• According to ONRC, in 2014, there was a 58% growth intotal turnover compared to the level reached in 2009.
Sources: Ministry of Public Finance, InvestRomania
2. SOFTWARE
In 2014, Bucharest was the leader city, holding 50,17% out of the total turnover from the Software development sub-sector

212016 The Government of Romania
89,68378,437
71,22865,720
57,81951,96552,028
66,896
0
20,000
40,000
60,000
80,000
100,000
201020092008
+14%
-22%
20142012 20152011 2013
26%
74%
Other sub-sectors
Software
Number of employees in Software [all corresponding NACE codes]
Number of active companies in Software
Source: Culturaldata.ro
• In terms of employees, Bucharest was also the leader for the NACE code [6201] – Software development, holding more than 40% of the number of jobs available in this branch. •It is interesting to observe that the 22% loss in 2009 against 2008 was followed by a steady growth and culminated with a 14%increase in the number of employees in 2015 against 2014.
SOFTWARE2.
In 2015, the no. of active companies in Software was 16,396,representing 26.3% of the no. of active companies within the sector

222016 The Government of Romania
Top 3 sectors for new jobs created [by NACE code]
Source: ONRC
The number of employees in Software Development, almost doubled in 2014, having an 81% increase against the level of 2009
22.5 40.8 +81%
8 11 +40%
2009 Employees
[‘000]
2014 Employees
[‘000]Dynamic
18.2 20.5 +13%
Activities held by
Advertising agencies
[7311]
Web and IT consultancy
[6202]
Software development
[6201]
2. SOFTWARE

232016 The Government of Romania
Top companies in Software
1) ORACLE ROMANIA 158,245,666.59 2.470
2) BITDEFENDER 62,294,713.16 595
3) SIVECO ROMANIA 58,003,224.74 695
4) MICROSOFT ROMANIA 43,786,119.68 362
5) TEAMNET BUSINESS SERVICES 42,086,858.26 50
6) SAP ROMANIA 39,132,206.29 1.142
7) ENDAVA ROMANIA 37,248,342.50 308
8) LUXSOFT ROMANIA 32,160,181.10 932
9) UBISOFT 30,537,075.14 1315
10) METRO SYSTEMS ROMANIA 26,801,476.26 710
Total turnover [EUR]
2. SOFTWARE
Company
Sources: DoingBusiness.ro, InvestRomania
No. of employees

242016 The Government of Romania
Overall, the Crafts sub-sector registered a decrease in 2015 compared to 2014 and there was a fall of 16,3% in net profit
1,5
0,0
0,5
1,0
11-4,5%
2011
-5,0%
2015
1
-26,7%
2012 201320092008 20142010
Total turnover [EUR Bn.]
2013201220102009 20112008 20152014
17.36119.173
14.84212.866
18.631
15.69716.321
13.826
Labour productivity [EUR/ employee]
Total turnover’s evolution for Crafts Labour productivity for Crafts
• The decrease registered in both 2009 and 2012 was aconsequence of the economic crisis, especially because suchactivities are costly and involve hand-made processing.
• In 2015, the total turnover decreased, following the same trendwith labour productivity, no. of employees and the no. of activecompanies. The decrease was also due to a fall in demandexplained by the high cost of such products.
• Labour productivity increased in 2015 compared to 2014, butovercame the level achieved for Arts in the same year.
• “The National Programme for Crafts Development” had abudget of 382,452 € allocated in 2015 and it was estimatedthat 200 economic operators benefited from it.
ARTS AND CRAFTS2.
Sources: Ministry of Public Finance, InvestRomania

252016 The Government of Romania
92.455
2008 2009 2010
72.15772.80367.554
20152011
73.17476.665
-26,9%
72.161
20132012 2014
77.235
2.
In 2015, the number of employees in Crafts was 26.9% lower than in 2008, and overall, it showed a decreasing trend from 2011 onwards
Number of employees in Crafts [#] • The Arts and Crafts sector is promoting the
Romanian traditions abroad even though
its contribution to the economy has
declined in 2015.
• Most of the people working in this sub-
sector are free-lancers and entrepreneurs
having a real passion for the Romanian
traditions.
• In order to promote Romania through its
customs and traditions, such Arts and
Crafts shops can be found not only in the
areas very popular among tourists, but also
in the big cities such as Bucureşti, Sibiu,
Timişoara or Craiova, airports and railway
stations.
ARTS AND CRAFTS
2012201120102009 2013 201520142008
2,416 2,411
-611
2,5052,468 2,496
2,931
2,3202,394
Number of active companies in Crafts
Sources: Ministry of Public Finance, InvestRomania

262016 The Government of Romania
Despite an 11.5% increase in total turnover in 2015 compared to 2014 for Arts, it holds less than 1% of the total turnover for CCIs
0,0
1,5
1,0
0,5
1,07
0,080,070,06
0,94
1,28 1,20
0,07 0,09
1,36
0,080,08
1,251,26
0,12
1,30
20112010 20142013201220092008 2015
2. ARTS AND CRAFTS
0.9%
13.5%
85.5%Other sub-sectors
Arts
Crafts
Total turnover for Arts vs. total turnover for Crafts
Arts and Crafts contribution to CCI [by sub-sector] in 2015
2,327
2015
1,792
2012 2013
1,8561,916
+535
2011
2,070
1,724
2010 201420092008
1,6461,681
Sources: Ministry of Public Finance, Economica.net, InvestRomania
Arts [EUR Bn.] Crafts [EUR Bn.]• The first Romanian auction dedicated to Contemporary
Visual Arts was held in 2015.
• According to the data displayed by Artmark, the organizingauction company, the masterpieces of renowned painterssuch as Theodor Aman, Nicolae Tonitza or NicolaeGrigorescu have registered top sales.
Active companies [Arts]

272016 The Government of Romania
No. of employees [Arts]
In 2015, Arts had among the lowest aggregate number of employees while Software has been the leader of the overall industry
2. ARTS AND CRAFTS
2015
86.0%
14.0%
24.3%
50.5%
24.3%
0.9%
2.400
2.800
2.200
2.600
0
3.000
2.128
20122010 2013 201520092008 20142011
2.601
2.820
2.164 2.1852.281
2.525
2.299
Other sectors
Software
Crafts
Arts
30
40
45
35
0
2009 2011 2012
27 27
37
41
36
3027
37
20152014201320102008
Labour productivity [EUR th.] for Arts
• Overall, in 2015, the Arts sub-sector had a contribution ofless than 1% to the total no. of employees in the CCIsector, while the Crafts sector made a much more visiblecontribution, of more than 24%.
Sources: Ministry of Public Finance, InvestRomania
Labour productivity [Arts]
No. of employees spread by CCI’s sub-sector

282016 The Government of Romania
Top companies in Arts and Culture
Total turnover [EUR] No. of employees
1) STAGE EXPERT SRL 5,262,009.67 44
2) SOUND S S.R.L. 1,806,862.76 5
3) H.B. MEDIA ENTERTAINMENT S.R.L. 1,252,271.76 7
4) HA HA HA PRODUCTION SRL 1,128,389.65 8
5) ART-TRADITION PRODUCTION S.R.L. 1,121,472.89 12
6) COOL PROMOTIONS S.R.L. 844,758.60 6
7) ART - DECO EXIM SRL 724,693.13 13
8) MABEL CONCERT S.R.L. 612,432.17 2
9) HOLOGRAF PRODUCTIONS SRL 536,760.85 6
10) REGIA NATIONALA A PADURILOR
ROMSILVA - MUZEUL CINEGETIC
AL CARPATILOR POSADA RA 256,122.15 13
Company
2. ARTS AND CRAFTS
Sources: DoingBusiness.ro, InvestRomania

292016 The Government of Romania
According to the data displayed by ONRC, the no. of active companies in Design increased by 19% in 2014 compared to 2009
DESIGN2.
10
40
70
30
80
0
60
20
50
78,6
66,6
38,3 36,4
50,551,7
20092008 2015201320122010 2011
+52%
2014
55,7
48,9
Total turnover for Design [EUR Mil.]
1,200
1,300
0
1,400
1,600
1,500
1,311
1,205
2010
1,153
2012
-9.5%+433
20142013
1,252
1,420
2011 2015
1,586
2008
1,124
1,242
2009
Active Companies [#]
• The same data shows that, with a 78% in total turnover for 2014 against 2009, this sub-sector, namely the NACE code for design activities [7410] had one of the biggest growth levels in total turnover, together with Gaming and web portals activities [NACE code 6312].
Sources: Ministry of Public Finance, ONRC InvestRomania

302016 The Government of Romania
In 2015, the number of employees in Design increased by 17% compared to 2014, but it is the lowest of all the CCI sub-sectors
2.
No. of employees in Design [#]
2,400
2,200
2,000
0
1,800
2011 20132008
1,855
2012
1,838 1,850
2,349
1,905-14% 2,009
2,158
1,741
20102009
+17%
20152014
DESIGN
• The number of active companies and the total turnover for this sector have been constantly growing since 2011.
• In March 2016, the biggest CCI promotion event was held in Bucharest.
• Romanian Design Week brought together entrepreneurs and free-lancers. The purpose of this event was to highlight the importance of Design and encourage other initiative in this sector.
• Albeit the number of employees in this sector is not
significant, Romania is the 17 th in Europe regarding
the number of employees in Creative Industries.
25
35
0
30
20092008 2010 2011
24,0
29,3
20,9
33,5
27,326,6
CAGR+8%
20,6
-14%
2015201420132012
33,1
Sources: Ministry of Public Finance, Institute.ro, InvestRomania
Labour productivity [EUR th. per employee]

312016 The Government of Romania
Top companies in Design
1) PROINVEST DESIGN COMP S.R.L. 10,106,268.61 26
2) MORPHOZA SRL 3,040,012.59 14
3) REKLAMA SHOP PACKAGING S.A. 2,353,852.19 15
4) PERFECT EVENTS ART S.R.L. 1,571,996.62 5
5) ALTAX SRL 1,354,963.77 25
6) FMCG MUNTENIA SRL 1,344,088.63 120
7) RHEA COSTA FASHION S.R.L 1,015,795.27 51
8) EURO SIGN PRODUCTION SRL 1,014,221.59 11
9) TWINS STUDIO S.R.L. 991,834.64 23
10) GRANATUL SRL 956,397.52 6
Total turnover [EUR]
2. DESIGN
Company No. of employees
Sources: DoingBusiness.ro, InvestRomania

322016 The Government of Romania
The net profit in the Media sector decreased in 2012, after a 12% growth in 2011, but since 2012 it has been continuously increasing
2.
No. of employees’ evolution [#]
15,000
10,000
0
10,442
201220112010
11,081
2009
10,649
2014 2015
10,311
2008
14,956
8,9209,514
2013
12,607
Total turnover Media [EUR Mil.]
550
450
0
400
500
389 386 394391
20092008 20112010 20132012
540
405 395377
20152014
Source: Ministry of Public Finance, Media Fact Book
MEDIA
• In 2015, the number of employees in the Media sectorfell by 6% against 2014, the highest level reached afterthe economic crisis being registered in 2014.
• The TV industry continued to be the growth engine lastyear, registering up to 212 millions euros. This wasfollowed by the radio industry with a 5 % growth.
• Overall, the net profit for the Media sector increased by7%, the highest level after the severe drop in 2009 beingachieved in 2015.

332016 The Government of Romania
45
0
40
35
2013 20142012
44,2
37,936,1
36,9
41,5
2011
35,4
2009
32,1
35,1
2010 20152008 2013 2014
+13.4%
2015
3,669
2,744
2010 2012
2,7122,781
2,601
2008
2,655
2009 2011
2,9503,039
Labour productivity [EUR th. per employee] Active companies [Media]
MEDIA2.
Sources: Ministry of Public Finance, Media Fact book, InvestRomania
• In the context of a permanent and sustained economic growth experienced by Romania since 2013, the media sector has beenincreasing. This could be explained by the increased level of consumption within the sub- sector and the interdependent relationshipbetween Media and Advertising.
• The market concentration degree increased from 11.3% in 2014 to 11.4% in 2015 and the no. of active companies increased by 3.5%showing no major changes in the distribution of the market share.
At the end of 2015, the Media displayed a positive growth trend and the market was expected to consolidate its growing trend in 2016
342016 The Government of Romania
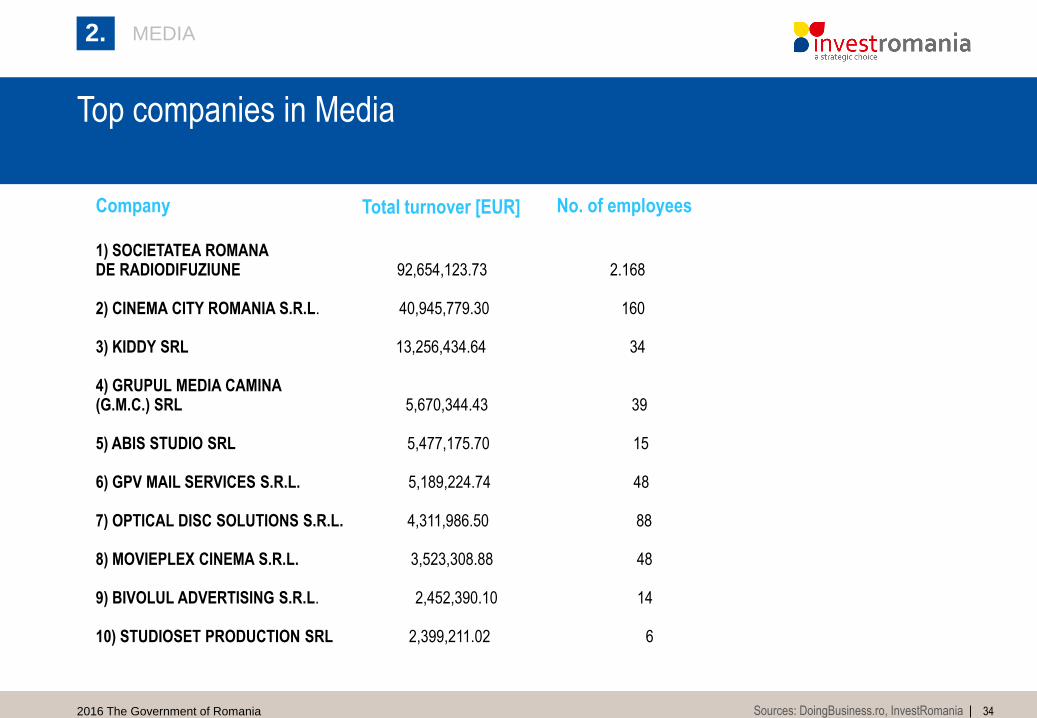
Top companies in Media
1) SOCIETATEA ROMANA DE RADIODIFUZIUNE 92,654,123.73 2.168
2) CINEMA CITY ROMANIA S.R.L. 40,945,779.30 160
3) KIDDY SRL 13,256,434.64 34
4) GRUPUL MEDIA CAMINA (G.M.C.) SRL 5,670,344.43 39
5) ABIS STUDIO SRL 5,477,175.70 15
6) GPV MAIL SERVICES S.R.L. 5,189,224.74 48
7) OPTICAL DISC SOLUTIONS S.R.L. 4,311,986.50 88
8) MOVIEPLEX CINEMA S.R.L. 3,523,308.88 48
9) BIVOLUL ADVERTISING S.R.L. 2,452,390.10 14
10) STUDIOSET PRODUCTION SRL 2,399,211.02 6
Sources: DoingBusiness.ro, InvestRomania
Company Total turnover [EUR] No. of employees
2. MEDIA

352016 The Government of Romania
In 2014, the Advertising market started recovering after 5 years of crisis and its mobile sector registered the most spectacular growth
ADVERTISING
192,429189,462
180,224
2012 201520142013
233,165
6%
222,796
2009 2011
221,560
210,842
2010
230,282
2008
Labour productivity [EUR per employee]
0
2,400
2,200
1,800
1,600
2,000
2008
2,314
20132011
+4%
2012 2014
-29%
1,454
20152010
1,712
2009
1,653
Total turnover for Advertising [EUR Mil.]
Total turnover [EUR]
2.
• Within this sub-sector, the Digital branch recorded the biggest annual growth (+12% in 2014 against 2013)• Television remained the branch with the biggest contribution in Romanian Advertising investments (63,5%) and it is forecasted to
maintain its position in the next year.
Sources: Ministry of Public Finance, Zenith Romania Advertising Expenditure Forecast, InvestRomania

362016 The Government of Romania
In 2014 the printed press captured only 6% of the total investments in Advertising and it was followed by the radio with 5,8%
ADVERTISING
25,90527,23926,88726,24526,506
38,971
24,645
79,990
2013 201520142009 2012201120102008
-69%
2011
8,993
9,169
20102008 2009
8,836
8,545
9,139
+9%
20152014
9,493
2013
9,3009,342
2012
No. of employees [Advertising] Active companies [Advertising]
2.
• The massive decrease in the no. of employees registered in 2009 is explained as a consequence of the Economic Crisis whenemployees have quit their jobs in Advertising for better paid jobs in other sectors.
• Similarly, the fall in the total turnover was due to the switch between printed and online press which quickly became more popularand less costly, thus optimizing the consumption within the sub-sector.
• In terms of Advertising, cinema captures a very small amount of 0,4% out of the total investment in the sub-sector.
Sources: Ministry of Public Finance, Zenith Romania Advertising Expenditure Forecast, InvestRomania

372016 The Government of Romania
Top companies in Advertising
Company Total turnover [EUR] No. of employees
1) B.V. MCCANN-ERICKSON S.R.L. 25,878,384.02 77
2) LION COMMUNICATION SERVICES SA 13,578,081.88 46
3) MEDIA GROUP SERVICES 9,663,644.31 65INTERNATIONAL S.R.L.
4) OGILVYACTION ROMANIA SRL 8,141,006.29 5
5) TOTAL DISPLAY GLOBAL SERVICES SRL 7,561,087.51 18
6) BT PRODUCTION GROUP S.R.L. 7,432,901.01 18
7) LEO BURNETT & TARGET SA 6,907,217.32 26
8) VIDEO PUBLICITATE S.R.L. 6,426,782.67 10
9) FEDERAL MEDIA PARTNER SRL 5,987,364.22 3
10) CENTRADE INTEGRATED SRL 5,947,309.78 35
2. ADVERTISING
Sources: DoingBusiness.ro, InvestRomania

382016 The Government of Romania
Two Romanian advertising campaigns won Cannes Lion awards in 2016, “Pay with Blood” and “Le Paul Patisserie”
• GMP Advertising won the Gold trophy at AD Stars 2015, acommercial festival in South Korea with Domo commercial.
• Four creative Romanians will participate on the jury side at theADCE festival (The Best in European Design and Advertising).Each will be part of different jury teams.
• Two campaigns of Universal McCann were awarded by AdWeekMagazine. The campaign for Le Paul Patisserie won at theAlternative Media Category and the campaign Pay with Blood wonat International Category. They were both winners at Cannes LionAwards.
Sources: Paginademedia.ro, InvestRomania
• Jorg Riommi, the Chief Creative Officer of Publicis Romania willbe a jury member for the Golden Drum Festival, one of the mostimportant competitions in advertising for Central and South-Eastern Europe.

392016 The Government of Romania
The awarded advertising companies have contracts with large multinationals and national companies
• Publicis Romania: Carrefour; OMV; Guinness; JTI; Nestle; Toortitza; Renault; Orange
• McCann: Vodafone, The Coca-Cola Company; Nestle; MasterCard; KFC; Pizza Hut;Mega Image; L'Oréal; Unilever; Heineken;
• Leo Burnett: P&G; McDonald’s; Kellogg’s; Samsung; Fiat; Pfizer
• GMP Advertising: Volkswagen Golf; Romtelecom; Gandul; BaumaX; Posta Romana
• Graffiti BBDO: Microsoft; Petrom; Henkel; Lay’s; MountainDew; Artmark; Bayer;Airwaves; Pepsi
Sources: Publicis.ro; McCann.ro; LeoBurnett.com; GMP.ro; Graffiti BBDO.ro

402016 The Government of Romania
In 2013, the local market for Architecture reached 200 mil. €, a drop of more than 50% compared to the level of 2008
2.
2
ARCHITECTURE
2,0
2,1
0,0
1,9
2,3
2,2
1,8
2010
1,74
2,05
20132011 2014
-10%
2,27
1,71
-15%
2008
2,01
2012
2,03
2009
2,082,11
2015
Total turnover [EUR bn.]
75,000
60,000
0
50,000
70,000
65,000
55,000 52,226
-8%
47,432
2012
53,542
2011 201520142009
60,258
2008
51,379 50,862
2010
+39%
51,431
2013
71,269
No. of employees [#]
Sources: Ministry of Public Finance, InvestRomania
412016 The Government of Romania
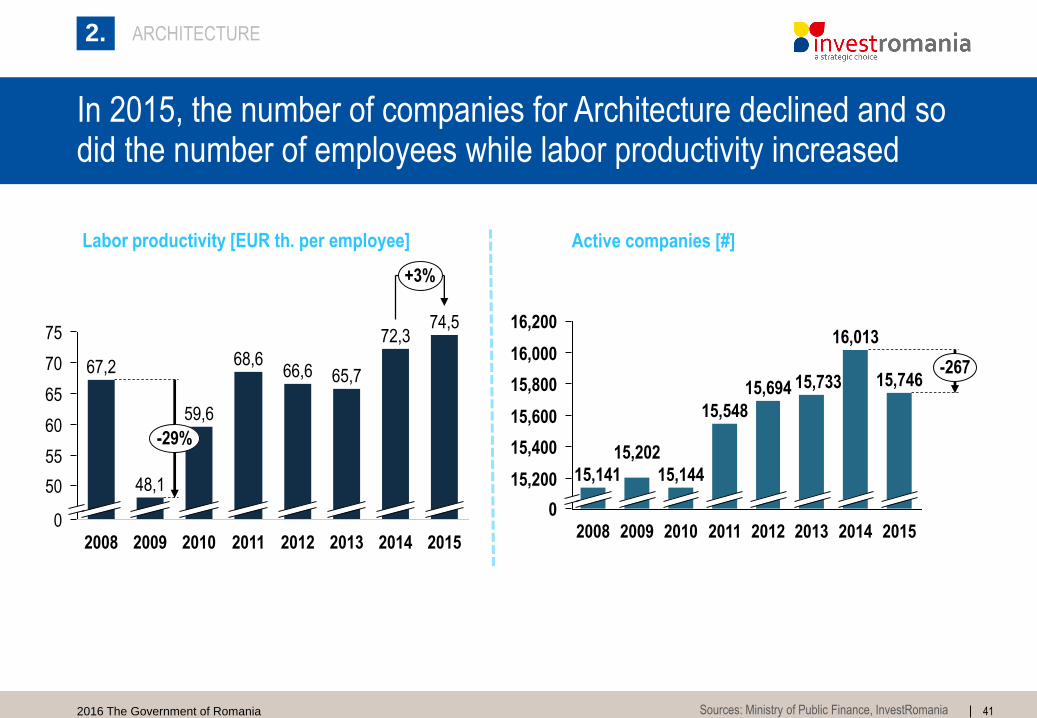
15,400
15,200
15,600
16,000
15,800
16,200
0
15,548
2011 20142012
15,74615,733
20152013
16,013
2008
15,694
15,141
15,202
-267
2009
15,144
2010
Active companies [#]
55
65
50
75
70
0
60
+3%
2009 2012
48,1
2015
74,5
20142013
65,766,6
2011
68,6
72,3
59,6
67,2
2008
-29%
2010
Labor productivity [EUR th. per employee]
ARCHITECTURE2.
In 2015, the number of companies for Architecture declined and so did the number of employees while labor productivity increased
Sources: Ministry of Public Finance, InvestRomania

422016 The Government of Romania
Top companies in Architecture
1) WEATHERFORD ATLAS GIP SA 25,042,933.18 266
2) EMERSON PROCESS MANAGEMENT ROMANIA S.R.L. 20,250,511.58 73
3) EPTISAROMANIA SRL 11,417,556.35 145
4) AKKA ROMSERV SRL 8,518,177.50 268
5) ASCON CONSULTING 2004 SRL 4,080,204.04 12
6) GISCAD S.R.L. 2,043,055.11 10
7) ARCHITECT-SERVICE SRL 1,970,606.74 13
8) ASCO CONSTRUCTII S.R.L 1,808,896.28 53
9) I.C.P.V. S.A. 1,132,484.13 38
10) ARGIF PROIECT SRL 757,136.33 12
Total turnover [EUR]Company No. of employees
Sources: DoingBusiness.ro, InvestRomania
2. ARCHITECTURE

432016 The Government of Romania
The total turnover for the Printing sector increased since 2013 but it did not overcome the pre-2012 level
These results can be explained by the low ranking Romania
has in the EU regarding the book industry.
In the last 5 years 2/3 of the publishing houses disappeared.
The number of employees has dropped by more than 50% in
2009 against 2008.
Overall, the book industry alone does not value more than 90-
100 million euros.
Sources: Ministry of Public Finance, InvestRomania
2. PRINTING
1,000
0
1,200
1,400
1,600
9691,0671,1001,087
1,461
1,0561,087
2015
-26%
1,043
20122011 2014201020092008 2013
Active companies [#]
-6%5,794
6,004
5,562
2012
5,660
201420092008 2010
5,530
5,7145,784
2013
5,689
2011
-4%
2015
Total turnover [EUR Mil.]
• In 2009, the no. of active companies dropped by 6% against
the level of 2008.
• In 2015, it dropped by 4%, after a 1% increase in 2014,
following the downwards slopping trend of all the other
indicators.

442016 The Government of Romania
Also, labor productivity constantly increased after 2009. In 2015, each employee contributed with more that EUR 44k in Printing sector
PRINTING 2.
Sources: Ministry of Public Finance, InvestRomania
35
25
45
30
0
40 37,938,9
44,3
19,4
27,7
39,1
201320122009
-50%
201520142011
25,8
2008 2010
42,6
0
40,000
50,000
30,000
60,000
20152010 201320092008
-3%
2011 2012 2014
+50%42,586
37,400
24,48027,450
55,926
23,83025,571
39,227
No. of employees [#] Labor productivity [EUR th. per employee]
452016 The Government of Romania
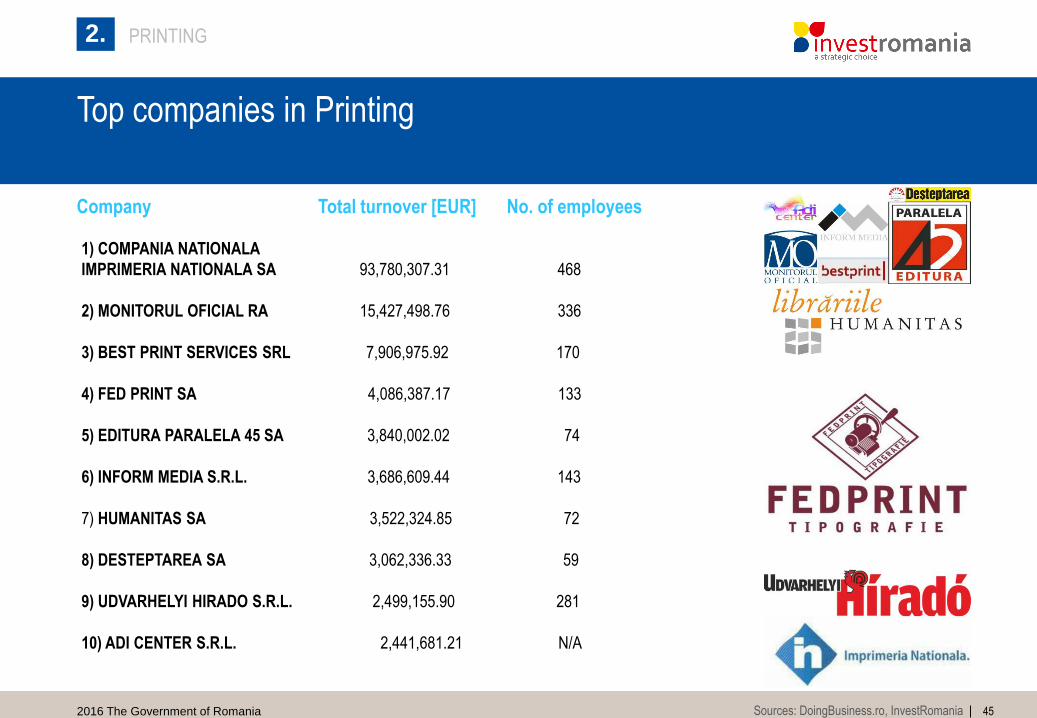
Top companies in Printing
1) COMPANIA NATIONALA
IMPRIMERIA NATIONALA SA 93,780,307.31 468
2) MONITORUL OFICIAL RA 15,427,498.76 336
3) BEST PRINT SERVICES SRL 7,906,975.92 170
4) FED PRINT SA 4,086,387.17 133
5) EDITURA PARALELA 45 SA 3,840,002.02 74
6) INFORM MEDIA S.R.L. 3,686,609.44 143
7) HUMANITAS SA 3,522,324.85 72
8) DESTEPTAREA SA 3,062,336.33 59
9) UDVARHELYI HIRADO S.R.L. 2,499,155.90 281
10) ADI CENTER S.R.L. 2,441,681.21 N/A
Total turnover [EUR]
PRINTING 2.
Sources: DoingBusiness.ro, InvestRomania
Company No. of employees

462016 The Government of Romania
Top companies in Publishing
1) BURDA ROMANIA SRL 14,139,561.97 103
2) GPV MAIL SERVICES S.R.L. 5,189,224.74 48
3) C.D. PRESS SRL 2,005,198.42 33
4) BAUER MEDIA SCS 1,916,402.92 15
5) TIPO-REX SERVICE S.R.L. 794,085.71 25
6) ATIP DESIGN S.R.L. 518,058.94 2
7) SMART ORGANIZATION S.R.L 440,484.58 15
8) EDITURA CARIERE SRL 323,711.58 18
Total turnover [EUR]
Sources: DoingBusiness.ro, InvestRomania
PRINTING 2.
Company No. of employees

472016 The Government of Romania
The fall in both labour productivity and total turnover registered in 2009 against 2008 were also reflected in a 20.3% drop in net profit
SPORTS
140
240
200
0
180
220
160 148
236
194-9%
2015
-50%
162
201420132011
150
2009 2012
172
118
2008
163
2010
Labor productivity [EUR th. per employee]
120
160
180
140
200
0
+1%
20152014
186
20122011
150
2013
186
2009
178
2008
110
-38%
2010
Total turnover [EUR Mil.]
• In 2009, there has been a huge drop in the Sports turnover due to Economic Crisis. Since 2009, the sports industry has beengrowing due to important sports events and increased media coverage.
• Despite the increasing appetite of fans for live competitions and many major competitions played top grosser, there are concernsabout the balance between sports competition and mass entertainment, which led to increased ticket prices, making some sportsevents dedicated exclusively to high-income strata.
Sources: Ministry of Public finance, 9am.ro, InvestRomania
2.

482016 The Government of Romania
After the crisis the number of employees has increased at a record level in 2015, almost 9300
SPORTS
9,000
7,000
0
10,000
6,000
8,000
+10%
201420132011
6,846
9,278
7,418
2012 20152010
-9%
5,461
20092008
6,015
3,000
5,000
0
4,000
4,833
3,890+67%
2,9392,7892,8883,212
20152012
3,616
2011 201420092008 2010
4,272
2013
No. of employees [#]
Active companies [#]
• Due to the the funds available in Sports, the mediacoverage and the revenues from passive and active fans,the number of companies has increased steadily since2009;
• In 2009, the number of employees in Sports dropped by 9%;
• Since 2009, the trend is ascendant due to high revenues andinvestments in sports competitions;
• In 2015, the number of employees increased by 10 % againstthe level in 2014.
Sources: Ministry of Public finance, 9am.ro, InvestRomania
2.

492016 The Government of Romania
Top companies in Sports
1) MEDUSA HOTEL INTERNATIONAL SRL 5,002,064.56 124
2) CLUB SPORT FITNESS CENTER MV S.R.L. 3,298,775.70 87
3) LIVING WELL S.R.L. 1,362,861.86 10
4) MURESUL-DRAMBAR S.R.L. 1,830,637.12 12
5) FIRESHOW S.R.L. 1,529,169.40 17
6) PURE HEALTH & FITNESS SRL 1,358,860.74 51
7) AQUALAND S.A. 1,358,851.74 75
8) CENTRUL DE FOTBAL MOGOSOAIA S.R.L. 965,395.50 33
9) MSPORT PRO SRL 845,541.73 7
10) ENVIRONMENT & SPORT DEVELOPMENT SRL 660,782.45 4
Total turnover [EUR]
Sources: DoingBusiness.ro, InvestRomania
PRINTING 2.
Company No. of employees

Government facilities & financing options

512016 The Government of Romania
Legal Framework concerning the protection of intellectual property rights, copyrights and other regulations for IP enforcement
Romanian State Authorities
Romanian Laws protecting Intellectual
Property Rights
• In addition, IP rights are also protected by the customs authorities in cases where they may retain goods infringing the IP rights.
• Generally, the IP rights of an owner may be enforced both in civil and criminal proceedings.
• Copyright Office (ORDA) is the sole state
authority for regulation, surveys,
arbitration and technical-scientific
expertise in the copyright and related
rights field:
• Romanian State Office for Inventions and
Trademarks (SOIT) is the main state
institution that is in charge for granting
protection for inventions, trademarks and
others.
1. Law no. 8/1996 on copyright and related rights, (“Copyright Law”).
1. Law no. 64/1991 (“Patents Law”) and Government Decision no. 547/2008 for the approval of the
Regulation for implementation of Law no. 64/1998 on patents.
2. Law no. 84/1998 (“Trademarks Law”) and Government Decision no. 833/1998 for the approval of
the Regulation for implementation of Law no. 84/1998 on trademarks and geographical indications
(“Trademarks Regulation”).
Sources: Ministry of Public Finance, InvestRomania
2.3 GOVERNMENT SUPPORT2.

522016 The Government of Romania
Romania accessed European Funds to develop and create CCI opportunities and encourage entrepreneurs to invest in the sector
“CultIn Programme“• This programme was launched by the Ministry of Culture
and it targets the entrepreneurs who work in the field of
Creative and Cultural Industries.
• The total amount that is available for funding cultural
actions/projects within the CultIN Programme rises to RON
500,000.
“POCU” (Human Capital Operational Programme)
• It grants financing for setting up new non-agricultural enterprises
in the urban area. The enterprises will be able to be set up by
individuals – unemployed, abeyant, employed and freelancers.
• The sums available are up to 25.000 euro.
Sources: Ministry of Public Finance, Ministry of European Funds, InvestRomania
2. GOVERNMENT SUPPORT
“Romania Creativa“
• Romanians who want to open small businesses in creative
sectors such as software, film production, crafts, music
production and other such business, may request European
funds of up to 25,000 euros.

Thank you!www.investromania.gov.rowww.facebook.com/investrowww.linkedin.com/company/investromania