
SINGLE MAMMALIAN CELL GENE EXPRESSION
ANALYSIS USING MICROFLUIDICS
Thesis by
Joshua S. Marcus
In Partial Fulfillment of the Requirements
for the Degree of
Doctor of Philosophy
CALIFORNIA INSTITUTE OF TECHNOLOGY
Pasadena, CA
2006
(Defended April 11, 2006)

ii
© 2006
Joshua Marcus
All Rights Reserved

iii
Acknowledgements
I thank my advisor Steve Quake for above all, his unwavering support throughout my
graduate career. Steve is not only brilliant, but also a master motivator, leader, and role
model. To me, he is the best kind of leader–one who lets his passion, commitment,
results, and work ethic, do the talking. He has allowed me to innovate and develop my
work independently, all while still being an integral part of the research. I hope that the
work presented here has left the lab in a better position than when I started, and will not
be delegated to the dustbins of history.
I thank Steve Mayo for making my transition to graduate school smooth and affording me
the opportunity to train in his lab. I am also grateful to Steve for being someone I could
turn to for advice and counsel. Seeing his scientific expertise as well as how he
supported me, it is easy to see Steve is a first rate advisor. Steve had Premal Shaw train
me in the lab; and I thank Premal for teaching me many of the molecular biology and
biochemistry techniques necessary to succeed in the field. Premal has become a friend as
well as a colleague and I am fortunate that our paths crossed while at Caltech.
I thank the members of my thesis committee – Judy Campbell, Jackie Barton, Jim Heath
and Steve Mayo. All have been supportive of my research and goals and I am better off
for having them as a part of my graduate career. I am sincerely grateful to Jim as well as
Mel Simon, for opening their respective labs to me and allowing me to use their
equipment. Without Jim and Mel, the research would not have progressed at the rate it
did. Working in the Heath and Simon labs provided me the opportunity to gain unique

iv
perspectives on my work through the eyes of their respective members. In particular, I
thank John Nagarah, Sangdun Choi, and Misook Chang for helpful and stimulating
discussions.
I thank French Anderson for his wisdom, dedication, enthusiasm, and resolve. French
has been a part of the work since the inception and has treated me like one of his own
students. I am fortunate to have worked with him. French has an unparalleled lab
manager in Kathy Burke and I thank her for all the help and advice she has given me.
Kathy has been a great outlet to talk to about everything from cell culture to qPCR to life
in general. I also thank Jiang (John) Zhong, another member of French’s group. John
sorted the cells used for the study presented in Chapter 5, and has been a valuable
resource for all things biology.
I have been extremely fortunate to work with many skilled scientists in my time at
Caltech. I am most grateful to Carl Hansen, for his advice, friendship, and example. Carl
was the catalyst behind the technology innovation in Chapter 5. Although the device is
nothing like our first design, seeing Carl’s confidence in a possible solution to the
problem pushed me to find a correct one. I hope our friendship continues to grow, and
look forward to working with him on the intellectual property portion of his research.
Sebastian Maerkl has also been a vital resource in the lab. I am grateful for the insight he
has imparted to me and conversations we have had over the years. I am grateful to the
remaining members of the Quake group and support staff for their scientific and
engineering skills, logistical support, and their friendship. In particular I thank Jong

v
Wook Hong, Luigi Warren, Emil Kartalov, and Chris Lacenere for useful discussions and
advice. I also thank Chris Lacenere for his help with video editing, being someone to
vent to about the state of the world, and for looking after my dog on occasion.
I thank the microfluidic foundry for fabricating some of the devices used throughout my
research. In particular, I am grateful to Alejandra Torres for device fabrication, putting
up with my perfectionist attitude towards fabrication, and for being a very good friend.
Your friendship and your devotion to my dog are incredible. I also thank Ali Ghaffari for
help and discussions concerning optical lithography issues.
I thank my dog and best buddy, Akili, for his unconditional love. We have been a team
for seven years and it’s hard to imagine my life without him. Akili is stricken with
hereditary ataxia, an ailment that has progressively left him in little control of his muscles
and movements. Seeing the fight in Akili and how he still loves living life, regardless of
how difficult it is to get around, is astounding. I hope his resolve and care free attitude
have rubbed off on me.
I am eternally grateful to my parents for their unconditional love, support, guidance, and
knowledge that whatever comes of my life, they will be by my side. I thank my twin
brother, Brad, who is also my best friend. I would do anything for him and am fortunate
to have his love, friendship, and counsel. I look forward to the next stage of our lives,
when we will be able to see more of each other. I am grateful to Sarit Bulmash for being
above all, my best friend. Sarit and I have known each other eight years, and she is truly

vi
remarkable. I hope I have matched a fraction of the passion, love, dedication, and
determination you show everyday. I know our friendship will continue to grow over the
years. The following work could not have been realized without the support of you four.

vii
Abstract
Single cell gene expression studies hold great promise for deciphering the
ubiquitous heterogeneity present in biological organisms. Although much progress has
been made in the field, tools to study gene expression (specific and global) in single cells
are generally lacking. This thesis describes the development of novel microfluidic
technologies and processes capable of processing single cells to first strand cDNA in a
parallel fashion, thereby filling a void in the single cell biology field. The author then
utilizes the technology to probe for transcriptional noise in ubiquitous genes present in
single mammalian cells. The noise measured far exceeds any measurement reported to
this date, and was shown to be attenuated during the G2 stage of the cell cycle. The work
presented here is first hand proof that technological innovation is a key component in
undertaking novel science.

viii
Table of Contents
Acknowledgements……………………………………………………………….. iii
Abstract…………………………………………………….……… ………………vii
Table of Contents…………………………………………………………………. viii
List of Figures………………………………………………….………………….. xi
List of Tables……………………………………………………………………….xv
Chapter 1: Overview……………………………………………………………...1
1.1 Introduction…………………………………………………………….. 1
1.2 Context…………………………………………………………………. 4
1.3 Organization……………………………………………………...…….. 5
Chapter 2: Proof of Principle mRNA Isolation / cDNA Synthesis Studies……. 8
2.1 Chip refinements……………………………………………………….. 8
2.2 Experimental design and chip layout…………………..………………. 10
2.3 On-chip mRNA isolation results……………………………………..… 11
2.3.1 End point RT-PCR analysis: GAPDH………………..…..…...12
2.3.2 Genomic DNA signals……………………………………...... 13
2.3.3 End point RT-PCR analysis: OZF…………………………… 15
2.3.4 Real-time RT-PCR results………………………………………........ 16
2.3.4.1 Feasibility Studies………………………………….………. 16
2.3.4.2 Serial mRNA isolation calibration………………………..... 17
2.4 On-chip first strand cDNA synthesis integration…………….………… 18
Chapter 3: Microfluidic Single Cell mRNA Isolation and Analysis…………... 20
Supporting Information…………………………………………………….. 27

ix
Chapter 4: Real-time PCR and Multiplex Primer Design……………………. 34
4.1 Introduction……………………………………………………………. 34
4.2 Bacterial mRNA primer and probe design…………………………….. 38
4.3 Benchtop reverse transcription efficiency measurements……………… 42
4.4 Primer/probe design for multiplex study………………………………. 45
4.5 Combating nonspecific product formation during RT…………………. 48
Chapter 5: Measuring Gene Expression Noise in Single Mammalian Cells
Using Microfluidics…………………………………………….…… 52
5.1 Introduction…………………………………………………….………. 52
5.1.1 Noise background……………………………………………. 52
5.1.2 Lognormal distribution background………………….……….54
5.1.3 Modeling noise in transcription…...…………………………..56
5.2 Results………………………………………………………………….. 57
5.2.1 Single cell gene expression measurements…………………... 57
5.2.1 Noise measurements…………………………………………. 65
5.3 Methods………………………………………………………………....70
5.3.1 Device component optimization……………………………... 70
5.3.1.1 Column construction………………………………. 70
5.3.1.2 Cell trapping and lysis………………………………72
5.3.1.3 Waste and collection outputs………………………. 76
5.3.2 Negative master mold fabrication for mature devices……….. 78
5.3.3 Device fabrication process…………………………………… 80

x
5.3.4 General device operation……………………………………. 81
5.3.5 20X and 50X cells-to-cDNA device process flow…………… 81
5.3.6 Device calibration and efficiency measurements……………. 84
5.3.7 Reagent preparation………………………………………….. 92
Chapter 6: Parallel Picoliter Rt-Pcrs Using Microfluidics……………………. 97
Supporting Information…………………………………………………….. 100
Chapter 7: Advances in Microfluidic Chip Fabrication and Operation……... 102
7.1 Multilayer soft lithography background……………………………….. 102
7.2 Push-up and push-down valves………………………………………… 104
7.3 Optical lithography considerations…………………………………….. 107
7.4 Sieve valves for robust separation assays……………………………… 109
7.5 Rapid parallel mixing………………………………………………….. 110
7.6 Column construction with one flow input………………………………112
7.7 Cell input with 100% reactor addressability…………………………… 113
Appendix A: Protocols…………………………………………………………… 117
Appendix B: Intracellular Single Cell Studies Using Microfluidics…………... 123
Appendix C: Prudent Modeling of Core Polar Residues in Computational
Protein Design……………………………………….....…………..144
Conclusions.................……………………………………………………….......... 156
Bibliography...............……………………………………………………….......... 158

xi
List of Figures
2.1 Optical micrographs of column construction area after bead release…………. 9
2.2 Second generation cell lysis/mRNA purification chip………………………..... 10
2.3 Agarose gel electrophoresis on microfluidic samples…………………………. 13
2.4 Agarose gel electrophoresis on genomic DNA control samples………………. 14
2.5 Low copy gene detection from microfluidic samples………………………….. 15
2.6 Melting peak analysis on microfluidic samples subjected to real-time PCR…... 16
2.7 Microfluidic mRNA isolation calibration and efficiency measurements……… 17
2.8 First strand cDNA synthesis on-chip…………………………………………... 19
3.1 Fourplex mRNA isolation/first strand synthesis device……………………….. 22
3.2 Microfluidic sieve valve……………………………………………………….. 23
3.3 Fourplex mRNA isolation calibration and efficiency measurements………….. 24
3.4 On-chip cDNA synthesis calibration and gene expression measurements in
various numbers of cells……………………………………………………...... 25
3S.1 qPCR and RT-qPCR standard curves………………………………………… 31
4.1 Taqman detection scheme……………………………………………………… 35
4.2 Real-time PCR amplification plots showing endpoint detection is not sufficient
for quantitative analysis……………………………………………………….. 38
4.3 Bacterial mRNA primer validation…………………………………………….. 41
4.4 Off-chip reverse transcription efficiency measurements………………………. 44
4.5 Amplification plots for fourplex, triplex, and simplex qPCRs………………… 47
4.6 Amplification plots showing μF RT-qPCR is the preferred format…………… 51
5.1 Probability density function for the lognormal distribution…………………… 55

xii
5.2 Gene expression correlation data………………………………………………. 60
5.3 Lognormal distributions for individual genes…………………………………. 63
5.4 Gene expression normalized pairwise for the three genes…………………….. 64
5.5 Raw noise measurements on NIH/3T3 cells………………………………….... 69
5.6 Column construction utilizing a fluidic multiplexer………………………….... 72
5.7 Cell trapping schemes……………………………………………………….…..75
5.8 Testing for optimal valve geometry in mixing rings…………………………....76
5.9 Outports for waste and products……………………………………………….. 77
5.10 20X cells-to-cDNA device……………………………………………………. 82
5.11 50X cells-to-cDNA device…………………………………………………….83
5.12 20X and 50X cells-to-cDNA device and process calibration………………… 88
5.13 Efficiency distribution for the final microfluidic step………………………... 89
5.14 Amplification plots from single cell spike experiment……………………...... 90
5.15 Amplification plots from negative control experiments…………………….... 91
5.16 Triplex qPCR standard curve construction………………………………….... 95
6.1 RT-PCR device…………………………………………………………….........98
6.2 RT-PCR results………………………………………………………………… 99
6.3 Benchtop RT-PCR results……………………………………………………… 101
7.1 MSL bonding process…………………………………………………………. 103
7.2 MSL process flow……………………………………………………………… 104
7.3 Cross-sectional cartoon view of push-up and push-down valve geometries…... 105
7.4 Scaling properties of a push-up valve……………………………………..........105
7.5 Normalized resistance provided by push-up and push-down valves…………...106
xiii
7.6 Comparison of Spr220-7/AZ-50 films that have been subjected to different
hard bake protocols……………………………………………………………..108
7.7 Optical micrograph of the chromatography portion of the device……………...110
7.8 Optical micrographs of reactors 1-4 of the 50X cells-to-cDNA device
before and after mixing……………………………………………………….112
7.9 Parallel multiplexing structure…………………………………………………. 113
7.10 Binary tree multiplexing structure……………………………………………. 114
7.11 AutoCAD drawing of 16x cells-to-cDNA device with
100% reactor addressability………………………………………………….. 116
B.1 Electroporation schemes………………………………………………….....… 136
B.2 Fourplex mRNA isolation/first strand synthesis device……………………….. 137
B.3 Digital PCR results from Unger et al………………………………………….. 138
B.4 Living cell array……………………………………………………………….. 139
B.5 Determination of erythrocyte contents by capillary electrophoresis………….. 140
B.6 Parallel intracellular study by microfluidic lysis/electrophoresis……………... 141
C.1 Solvent-accessible surface area (ASA) distribution of side-chains classified
as surface or core…………………………………………………………….. 145
C.2 DEE optimization progress as a function of processor time………………….. 147
C.3 Three-dimensional molecular representations of the various
thioredoxin structures………………………………………………………... 148
C.4 Far-UV circular dichroism spectra of the wt, no polar, and prudent
polar proteins………………………………………………………………. 149
C.5 NMR spectra………………………………………………………………….. 150

xiv
C.6 Protein denaturation experiments………………………………………………151
C.7 Correlation of the number of core MCU atoms with protein size…………….. 152

xv
List of Tables
3S.1 Yields from various mRNA isolation procedures……………………………. 32
4.1 Primer and probe specifications for three synthetic bacterial mRNAs………… 39
4.2 RT efficiency measurements and corresponding statistics…………………….. 45
4.3 Primer and probe specifications for multiplex pPCR study……………………. 47
5.1 Gene expression noise measurements based on raw mRNA transcripts………. 67
5.2 Gene expression noise measurements based on pairwise normalization………. 68
5.3 Microfluidic process efficiency grid…………………………………………… 86
5.4 Process efficiencies for individual Dap templates + 1 pg NIH/3T3 mRNA…....87
5.5 Reverse transcription competition effects………………………………………87
C.1 Hydrogen bonding of polar side-chains………………………………………..145
C.2 Side-chain hydrogen bonding at core positions………………………………..146
C.3 Hydrogen bond requirements for core positions……………………………….146
C.4 Amino acid sequence comparison of core positions…………………………...147
C.5 Experimental thermodynamic data………………………………….………….151

1
Chapter 1 – Overview
1.1 Introduction
Vast cellular heterogeneity is a common theme in all biological organisms, and
the ability to interrogate cells in an individual manner could elicit the presence of
subpopulations and provide insight into specific processes, such as stem cell
differentiation events, which are masked at the population level. It has become
increasingly clear that studying cell populations, regardless of what is being assayed (e.g.
mRNA, protein, or small molecule levels) is only sufficient for obtaining average values
over the particular populations or many subpopulations. Major cellular decisions
concerning growth, death and differentiation are reflected in altered patterns of gene
expression in individual cells. The ability to quantify transcription levels of individual
genes is a necessity in understanding these processes.1 Although an assessment of
mRNA or protein expression does not directly address function, the knowledge of when
and where a gene is expressed can provide information about potential roles of the
respective gene; and has been historically used for gene discovery.2 While questions
pertaining to what genes and proteins are expressed in single cells, to how individual
cells communicate and respond to different stimuli are all active research areas, tools to
answer these questions are generally lacking. The main reason for the lack of
technologies to study the single cell can be attributed to the poor yields encountered when
subjecting these precious samples to multi-step processes.
The state of the art in global gene expression studies in single cells has utilized
single cell reverse transcriptase-polymerase chain reaction (RT-PCR)3, 4 or T7 RNA
amplification5 coupled to product hybridization to oligonucleotide microarrays.

2
Although thousands of genes could be probed in parallel from single cells, there were
inherent problems with the assays and consequently only a minimal amount could be
learned from the data obtained. The amplification procedure was non-linear for the PCR
studies (50 cycles), so it is safe to assume products generated were not an accurate
reflection of the starting material present in each cell. Only 16 cells4 and 60 cells3 were
analyzed for each study, so the stochasticity of gene expression could not be fully
explored. In the case of Dulac’s group, 90 cells were isolated by laser capture
microdissection (LCM), but only 16 exhibited robust expression of the ubiquitous
transcript glyceraldehyde 3-phosphate dehydrogenase (GAPDH). Although the T7
amplification procedure is linear in nature, LCM was utilized to isolate cells, which may
have damaged the integrity of the samples, as was most likely the case with Dulac’s
study.4 The isolation method also limits the number of samples that can be processed.
Quantitative gene expression studies on one or a limited number of genes can be
performed with qPCR (discussed further in chapter 5). Although multiplex qPCR is
common for bulk samples, with a PubMed literature search yielding hundreds of papers,
qPCR, multiplex or otherwise, is much rarer for single cells, due to the sample processing
issues stated above2, 6-15. The multiplex single cell qPCR studies presented in this thesis
are the first of their kind, with detection of three or four distinct gene segments in the
initial log phase of the PCRs.
Clearly, there is room for single cell gene expression assay improvement.
Although one can query for the presence of thousands of genes in parallel with
microarrays, there is a limitation to a finite number of genes, so generating a full mRNA
expression profile is not possible. Also, if an interesting result is found, one does not

3
have the ability to isolate the gene sequence of interest and make the corresponding
protein. Compounding these issues, variation in results from researcher to researcher is
also a problem because of non-genetic influences such as quality of spotted DNA, surface
chemistries, and analysis methods.16 Furthermore, when a PCR is implemented, a true
reflection of initial levels of gene expression cannot be achieved on a regular basis unless
detection is employed during the initial log phase of the reaction.
Ideally, one would like to eliminate PCR and employ an a priori approach such as
cDNA library construction to analyze single cells, so as not to introduce biases towards
certain sequences, limit oneself to a finite number of genes, and so protein can be made
from individual clones, if desired. Because of the a priori nature of library construction,
it facilitates the discovery of genes important for cellular processes and phenomena.
When amplification becomes necessary to generate sufficient amounts of cDNA, global
linear amplification methods utilizing an RNA polymerase are preferred, to keep an
accurate reflection of the starting material. To date, 104-105 cells are the minimum
number needed to construct a cDNA library.17 Because of all the advantages cDNA
library construction has over current global gene expression analysis methods, the
technique would be extremely useful if applied to single cells.
Microfluidic assays overcome some of the limitations of conventional single cell
gene expression studies. The typical channel dimensions found in microfluidic devices
(10 μm–100 μm in x,y and z) and the ability to manipulate nanoliters of reagents on-chip
have made the devices encouraging platforms for the analysis of single cells.18
Furthermore, the economy-of-scale benefits along with the ability to parallelize and
automate processes are significant advantages not found with conventional biological

4
assays. Whole tissue or cultured cells can be placed in liquid suspension and
manipulated on-chip. Active valves19 make it possible to individually address
compartments of the chip20 and precisely mix and meter an array of reagents with
different properties.21, 22 Furthermore, the ability to build affinity columns directly on-
chip makes it possible to obtain a pure nucleic acid sample from whole cell lysate.23, 24
The work presented in this thesis encompasses the first five steps of cDNA library
construction, applied microfluidically, and can be built on by future students to realize
the full process. Furthermore, the technology disclosed in this thesis is mature enough to
perform various quantitative single cell gene expression assays. Here, the author
discloses the first reported measurements of gene expression noise in mammalian cells,
as well as the first studies to measure noise directly at the transcription level.
1.2 Context
The technologies in this thesis utilize and build upon the multilayer soft
lithography (MSL) process19 developed in the Quake group. At the inception of this
work, MSL had been applied to numerous biological questions, including but not limited
to protein crystallography,22, 25 nucleic acid processing,24 FACS,26, 27 enzyme assays,20
and PCR.28, 29 Although nucleic acid processing had been demonstrated previously, this
work provides a more robust implementation with quantitative calibrations, and provides
a building block for integration of downstream steps to eventually synthesize cDNA
libraries from single cells. The thesis describes the first application of MSL to the
quantitative study of gene expression in single cells. In addition, the integrated process
of cell capture/lysis → mRNA isolation/purification → cDNA synthesis/purification is
5
implemented for the first time on a microfluidic device. In all, four different devices are
presented throughout the work, with three pertaining to single cell processing for gene
expression analysis. The fourth device is a PCR device intended to carry out picoliter
RT-PCRs in a parallel fashion. The RT-PCR device provides substantial improvements,
as compared to the state of the art in microfluidic RT-PCR, in detection sensitivity,
volumes utilized, and degree of parallelization.
The three remaining devices are similar, in that they all mechanically isolate
single cells, purify the mRNA inside the cells, synthesize and purify the corresponding
first strand cDNA. It will become obvious to the reader that technological innovations
and need for sample parallelization and 100% reactor addressability pushed the device to
a third generation, which provides the most robust implementation of the aforementioned
process. The first reported gene expression noise measurements on mammalian cells are
performed on single cell cDNA samples processed with the second generation cells-to-
cDNA device. The single mammalian cell noise measurements are the culmination of the
thesis work and demonstrate firsthand how technological innovation is crucial for
performing novel science.
1.3 Organization
Chapter 2 describes the first cells-to-cDNA device, in which samples were
processed in a serial fashion. The chapter describes early proof-of-principle studies
aimed at validating the steps in the microfluidic process of cell lysis/mRNA
isolation/cDNA synthesis/product recovery.

6
Chapter 3 is an extension of the work presented in chapter 2, but with some
modifications. The manuscript was published as an article in Analytical Chemistry. The
chip presented in the manuscript is capable of processing four samples in parallel and was
utilized to perform quantitative calibrations of the microfluidic cells-to-cDNA method.
Quantitative single cell gene expression measurements were also performed with samples
processed on-chip.
Chapter 4 describes qPCR in detail, along with multiplex primer/probe design for
efficient and reproducible qPCR. The state of the art in single cell qPCR is discussed,
along with considerations for robust assays. Primer and probe validation assays are
presented for both multiplex qPCR studies on murine genes, as well as bacterial primer
design for single cell spike experiments.
Chapter 5 presents the first reported measurements of gene expression noise at the
transcriptional level, in single mammalian cells. Highly parallel microfluidic cells-to-
cDNA devices used for these measurements are discussed, along with process
refinements and calibrations.
Chapter 6 is a technical note published in Analytical Chemistry30 presenting a
device designed to carry out picoliter RT-qPCRs or qPCRs in a highly parallel fashion.
Results on RNA templates are offered.
Chapter 7 discusses MSL in general, along with technical advancements that were
made by the author during the course of his thesis research.
Appendix A presents the major protocols utilized throughout the thesis research.
qPCR protocols for microfluidic and conventional samples, as well as cell labeling for

7
FACS analysis, photolithography processes and MSL processes are all discussed in
detail.
Appendix B is the author’s contribution to a book chapter entitled “Progress in
nanofluidics for cell biology” to be published in the second edition of the CRC Handbook
for nanoscience, technology, and engineering.
Appendix C is a manuscript entitled “Prudent modeling of core polar residues in
computational protein design” published in the Journal of Molecular Biology. The
majority of the work was performed by Daniel Bolon, a former Caltech graduate student
of Stephen Mayo’s. My contribution to this work included synthesizing one of the gene
constructs by site directed mutagenesis, expressing the corresponding protein, and
performing various biochemical assays on the construct, including circular dichroism
(CD) spectroscopy and NMR spectroscopy (along with Scott Ross).
8
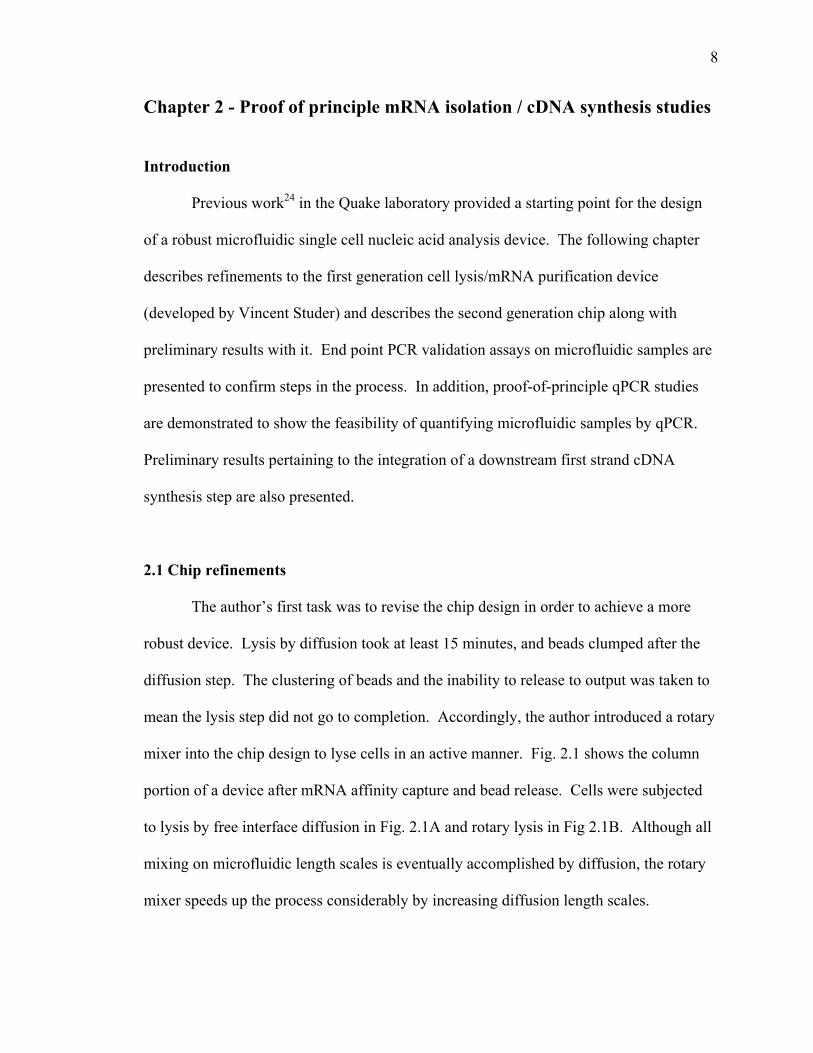
Chapter 2 - Proof of principle mRNA isolation / cDNA synthesis studies Introduction
Previous work24 in the Quake laboratory provided a starting point for the design
of a robust microfluidic single cell nucleic acid analysis device. The following chapter
describes refinements to the first generation cell lysis/mRNA purification device
(developed by Vincent Studer) and describes the second generation chip along with
preliminary results with it. End point PCR validation assays on microfluidic samples are
presented to confirm steps in the process. In addition, proof-of-principle qPCR studies
are demonstrated to show the feasibility of quantifying microfluidic samples by qPCR.
Preliminary results pertaining to the integration of a downstream first strand cDNA
synthesis step are also presented.
2.1 Chip refinements
The author’s first task was to revise the chip design in order to achieve a more
robust device. Lysis by diffusion took at least 15 minutes, and beads clumped after the
diffusion step. The clustering of beads and the inability to release to output was taken to
mean the lysis step did not go to completion. Accordingly, the author introduced a rotary
mixer into the chip design to lyse cells in an active manner. Fig. 2.1 shows the column
portion of a device after mRNA affinity capture and bead release. Cells were subjected
to lysis by free interface diffusion in Fig. 2.1A and rotary lysis in Fig 2.1B. Although all
mixing on microfluidic length scales is eventually accomplished by diffusion, the rotary
mixer speeds up the process considerably by increasing diffusion length scales.

9
Fig. 2.1. Optical micrographs of column construction area after bead release. Beads
were released by pneumatic pressure to an output port after cells-to-cDNA process was
complete. Left: Cell was lysed by free interface diffusion. Right: Cell was lysed in a
rotary mixer. Scale bars are 200 μm.
The author also refined the way in which the affinity purification column is built.
The implementation presented here and in later chapters provides a significant upgrade,
providing digital control over column construction, as compared to the analog control in
the first generation device.24 The column of oligo(dT)25 derivatized paramagnetic beads
are stacked against a sieve valve (Figure 2.2, blue valve in micrograph), present on a 13
μm high flow structure with a rectangular cross section, molded out of SU8-2015. The
previous column design used a slightly opened valve (present on a flow channel with
semi-circular cross section) to allow fluid flow while not allowing the 2.8 μm beads to
pass through.24 Parameter space sufficient to build both types of columns, as well as
fabrication considerations, are given in chapters 3 and 7, respectively.
The second generation chip is presented in Figure 2.2. Each 1” X 1” chip is able
to carry out two isolations, which is one more than its first generation counterpart.
A. B.

10
1.2 mm
* * 1
1
2
2
Cells out
Cells in
Cell partition right, pump3
Cell partion
left, pump2
Lysis buffer in
Push
Column /ring
interfaceBeads
in1
200 μm
Waste out1
Beads out
Beads in2
Pump1 Waste out2
Collect1 Collect2
Waste out1
Sieve valve2
Waste out2
Cells in Cells out
Cells in
Cells out
Sieve valve1
Beads in, Rxn
partition
Collect 1
Collect 2
200 μm
Furthermore, when the isolation is complete, the beads are sent to the output port and
collected with a pipette, as opposed to cutting the chip to retrieve products. In the
author’s scheme, the chip can be cleaned and reused, or disposed of. The ability to
process > 1 sample/chip decreases fabrication time by half when multiple measurements
are necessary.
Figure 2.2. Second generation cell lysis/mRNA purification chip. Inputs for control and
flow channels are labeled according to function. Middle: AutoCAD drawing of the chip.
Control channels are in blue and flow channels are in green. The column flow structure
is depicted in red. Left: Optical micrograph of the lysis ring. Right: Optical micrograph
of the column area and a stacked affinity column.
2.2 Experimental design and chip layout
As mentioned above, each chip is able to carry out two mRNA purifications.
Purified NIH/3T3 mRNA (Ambion) or NIH/3T3 cell suspension is geometrically metered
50 μm

11
into the mixing ring between the valves marked with asterisks (Fig. 2.2 left). The
remainder of the ring is dead end filled with lysis buffer to the valves marked with
asterisks, through flow inlet 1 (Fig 2.2). The contents of the ring are mixed, leading to
cell lysis in a matter of seconds (visualized by optical microscopy). The short mixing
time is possible because of the parabolic flow profile taken on by the fluid slugs.
Dispersion stretches the fluid streams, thereby decreasing the diffusion length by
maximizing the interface between the fluid streams.21, 22
Once the ring is mixed, a bolus of air is applied through flow inlet 2 (Fig 2.2
middle), pushing the lysate over the stacked beads at 10-20 μm/s to allow for extended
interaction between the affinity column and mRNA transcripts. A column wash step is
then performed to deal with non-specific interactors that may be present. The beads are
collected in reverse transcriptase-polymerase chain reaction (RT-PCR) buffer and frozen
at -80°C for future analysis.
2.3 On-chip mRNA isolation results
The first experiments the author carried out were with purified NIH/3T3 mRNA
(Ambion) and NIH/3T3 cells as templates for lysis and subsequent mRNA affinity
capture. In order to gauge the starting point sensitivity (e.g. without any optimization or
procedural refinements) of the bead column, various dilutions of mRNA were loaded in
the top portion of the rotary mixer (Fig. 2.2). For the cell capture/lysis → mRNA
isolation/purification experiments, murine NIH/3T3 cells were loaded into the region of
the ring where mRNA was loaded. The valve marked with a red arrow in Figure 2.2 was
opened and closed until the desired number of cells were present in the ring. After

12
loading the remainder of the ring with lysis buffer, the ring contents were mixed for 10
seconds and pushed via pneumatic pressure-driven flow (through inlet 2, Fig. 2.2) over
the oligo(dT)25 column. The beads were then washed in a salt solution and subsequently
collected in RT-PCR buffer. Conventional RT-PCR (35 cycles, 50 μL reactions) or real-
time RT-PCR (20 μL reactions) on a 150 base pair (bp) segment of the glyceraldehyde 3-
phosphate dehydrogenase (GAPDH) gene was then carried out on the mRNA bound to
the beads.
2.3.1 End point RT-PCR analysis: GAPDH
Results from conventional RT-PCR experiments from recovered on-chip sample
templates are shown in Figure 2.3. A clear, distinct band was seen for initial mRNA
templates ranging from 50→1 pg. Although there was no distinct band for the initial
template of 100 fg, the author was able to retrieve the mRNA from the chip, as seen by
the smear of DNA present on the gel (Fig 2.3). Since all the beads were retrieved, it is
likely either there were not enough initial copies of the gene to amplify efficiently, or
primer-dimer amplification competed for PCR reagents. Judging by the bands in the
noise of the gel, the latter is the case. Future studies will utilize primers with less of a
tendency to form non-specific products. Results for the on-chip cell capture/lysis →
mRNA isolation/purification experiments are also shown in Figure 2.3. Distinct bands
were visualized for all cellular templates and single cell resolution was achieved.
Negative control experiments (PBS from cell suspension) confirmed the absence of
contamination.

13
Figure 2.3. Agarose gel electrophoresis on microfluidic samples. 1% agarose gel was
run after 35 cycles of an RT-PCR on purified NIH/3T3 mRNA and NIH/3T3 cells. Black
numbers are pg NIH/3T3 mRNA and red numbers are NIH/3T3 cells. The band is a 132
bp portion of GAPDH.
2.3.2 Genomic DNA signals
Because the GAPDH primers do not span introns, the author needed to check for
genomic DNA contamination (gDNA) in the mRNA preparations. Six cells and 19 cells
were lysed on-chip and the lysate was driven over the affinity column. The beads were
then manipulated as previously described and collected in RT-PCR buffer in the absence
of enzymes. Each reaction was then split into two tubes. The beads in each tube were
then pelleted by centrifugation and resuspended in either RT-PCR buffer with reverse
transcriptase (RT) or without RT. An RT-PCR was then run to probe for genomic DNA
signal, with results from this experiment shown in Figure 2.4. A faint band for the six
cell mRNA isolation in the absence of RT was observed. However, no band was
0 250 100 50 25 20 10 1 0.1 0 500 0 27 13 10 10 8 4 0 0 1 3 4
Off-chip On-chip Off-chip On-chip On-chip

14
β-actin
RT - - - + + + + - - - - + + + Template 6 19 * 0 25 6 19 0 * 13 10 0 25 6
ng NIH/3T3 mRNA, # cells, *: cDNA generated from a benchtop PCR
GAPDH
observed for the 19 cell preparation in the absence of RT. These results indicate the
contamination was from an outside source and was not a genomic signal arising from the
NIH/3T3 cells. The author then repeated the experiment with β-actin primers that
spanned introns, and did not split the samples in half (Fig. 2.4). Both no RT reactions
were negative for the presence of DNA while both reactions with RT displayed a signal
(Figure 2.4). These results indicate the chip itself is not a source of contamination and
sample manipulation off-chip is the main contributor to false positive signals. Future
studies will control for contamination by having all primers span introns, as well as
controlling for sequence homology with human DNA (not done with GAPDH primers).
Figure 2.4. Agarose gel electrophoresis on genomic DNA control samples. mRNA
samples were purified on-chip (and/or lysed beforehand) followed by product collection
and an RT-PCR and gel electrophoresis of the PCR products.

15
2.3.3 End point RT-PCR analysis: OZF
In the next set of mRNA isolations, the author probed for a 399 bp portion of the
transcription factor OZF, which is expressed in much lower abundance than GAPDH.
Results from these isolations are shown in Figure 2.5. The equivalent of roughly the
amount of mRNA present in one cell31 (1 pg) was able to be recovered and amplified to
obtain a signal.
Figure 2.5. Low copy gene detection from microfluidic samples. Agarose (2%) gel
electrophoresis run after a RT-PCR, in which the author probed for a 399 bp segment
from the OZF gene.
0 500 0 10 20 1 11 6 4
OZF
Template (NIH/3T3 cells or pg NIH/3T3 mRNA)
Off-chip On-chip

16
2.3.4 Real-time RT-PCR results
2.3.4.1 Feasibility Studies
Because μL amounts of the beads (Dynal) used to construct mRNA affinity
columns fluoresce under green light, it was imperative to see if the ~3 nL column would
contribute to a SYBR Green I signal during real-time detection of product formation.
Accordingly, on-chip isolations with various templates were carried out, followed by
real-time RT-PCR analysis (RT-qPCR utilized interchangeably throughout thesis;
discussed in chapter 4 in greater detail). The recovered column from the no-template
purification yielded no detectable fluorescence signal when detection was enabled at the
appropriate temperature (Fig 2.6). These results allow for subsequent samples to be
analyzed in real-time to obtain quantitative gene expression data, unattainable when
utilizing end-point analysis.
Figure 2.6. Melting peak analysis on microfluidic samples subjected to real-time PCR.
Threshold cycle values are in parenthesis. Primer-dimer peaks are present at 74°C, while
← Chip no-template (27.31) ← Off-chip no-template (28.12)
←11 cells (22.61) ← 6 cells (23.48)

17
Thre
shol
d cy
cle
Mea
sure
d te
mpl
ate
(pg
NIH
/3T3
mR
NA
)
r2=0.99
Loaded template (pg NIH/3T3 mRNA)
product peaks are present at 83°C. During cycling, detection was enabled at 79°C to
eliminate signal from primer-dimers.
2.3.4.2 Serial mRNA isolation calibration
In order to determine how reliable and robust the microfluidic cells→mRNA
method is, the author generated standard curves with known NIH/3T3 mRNA templates
loaded onto the chip. These experiments give an indication of the column’s dynamic
range of capacity as well as recovery efficiency. Known NIH/3T3 mRNA templates
were loaded into the lysis ring, mixed with lysis buffer, and subsequently pushed via
pneumatic pressure over the columns. The columns were then washed as described
previously, and collected by pipetting. The templates were then subjected to real-time
RT-PCRs. Results from two separate experiments are plotted together and shown in
Figure 2.6. As the figure shows, the method of isolation and recovery is quantitative and
reproducible over three orders of magnitude (R = -0.99). The process efficiency was then
extrapolated by plotting the microfluidic threshold cycles onto a GAPDH standard curve
generated with off-chip NIH/3T3 mRNA standards (Fig. 2.6B). The average efficiency
for all samples processed was 47% that of an off-chip RT-PCR with benchtop standards.

18
Figure 2.7. Microfluidic mRNA isolation calibration and efficiency measurements.
Graphs are of data pooled from two independent experiments. A. mRNA isolation
standard curve. Threshold cycle corresponds to the PCR cycle when fluorescence
measured is significantly higher than background levels. B. The line’s slope (m=1)
indicates 100% efficiency. Measured template values were calculated by plotting the Cts
of the microfluidic samples onto an off-chip GAPDH standard curve generated with
identical off-chip template concentrations.
2.5 On-chip first strand cDNA synthesis integration
After mRNA isolation, cDNA synthesis is the next step in the process of creating
a cDNA library. Furthermore, the preference is to work with cDNA rather than mRNA
because of ambient RNases and subsequent degradation issues. Because of these two
factors, it would be well served to integrate a cDNA synthesis step with the existing
microfluidic process. The author chose to integrate the on-chip cDNA synthesis step by
implementing a solid phase synthesis strategy. The oligo(dT)25 sequences present on the
beads were used both to capture the mRNA and as primers for first strand synthesis. The
chip was heated to 40°C on a thermal microscope stage and reverse transcriptase along
with dNTPs were allowed to interact with the column at 10-20 μm/s for a defined amount
of time.
The author chose 45 minutes as the time for cDNA synthesis. The manufacturer
of the reverse transcriptase enzyme (Qiagen) recommended 1hr. for first strand synthesis
by benchtop methods, but because of the smaller reaction volume on-chip, 45 minutes
was reasoned to be more than sufficient for the reaction to go to completion. Results for
the first experiments integrating the two step process of mRNA isolation/purification →

19
cDNA synthesis/purification and the three step process of cell capture/lysis → mRNA
isolation/purification → cDNA synthesis/purification are shown in Fig 2.8. A positive
signal was obtained for all cell and mRNA templates; and all negative controls confirmed
the absence of DNA contamination. As with the mRNA isolation experiments, single
cell resolution was achieved when probing for a portion of GAPDH.
Figure 2.8. First strand cDNA synthesis on-chip. Agarose gel electrophoresis after PCR
for microfluidic cDNA synthesis samples. Black signifies NIH/3T3 mRNA templates
(pg) and red are NIH/3T3 cell templates. The green star is cDNA generated from an off-
chip PCR.
Template 0 * 100 8 100 5 0 1 0 100 0 2 3 5 Off-chip On-chip Off On Off On
RT - - - - + + + + + + + + + +
* Indicates cDNA generated from a PCR, NIH/3T3 cells, NIH/3T3 mRNA
GAPDH

20
Chapter 3:
Microfluidic Single Cell mRNA Isolation and Analysis

21

22

23

24

25

26

27
Supporting information for:
Microfluidic single cell mRNA isolation and analysis
Joshua S. Marcus,1,2
W. French Anderson,2,3
& Stephen R. Quake2,4,5
1
Biochemistry and Molecular Biophysics, 2Applied Physics and Physics, California
Institute of Technology, MS 128-95, Pasadena, CA 91125. 3Gene Therapy Laboratories,
Keck School of Medicine, University of Southern California, Los Angeles, CA 90033
4: To whom correspondence should be addressed. Email [email protected]
5: Current address: Bioengineering Dept., Stanford University, Clark Center, E350Q,
Stanford, CA 94305
Table of Contents Item Description Page # Methods Supplementary methods S-2 - S-4 Figure S-1 Various qPCR standard curves S-5 Table S-1 mRNA yields for various commercial kits S-6 Supporting references Supporting references S-6 Figure S-1 legend Legend for figure S-1 S-7

28
Supporting methods
Master Mold Fabrication
All photomasks, which define device features, were designed with AutoCAD
software (AutoDesk, Sausalito, CA) and printed at a resolution of 20,000 dots per inch on
transparency films. In all optical lithography processes, 3’’ silicon wafers were utilized
as substrates, and mold exposures were under UV light on an MJB mask aligner (7
mW/cm2) for the indicated time.
Twenty-four-μm-high features present on control molds are fabricated with a
single lithographic step. SU8-2025 (Microchem) is spun on a wafer (3,000 rpm, 45 s.),
baked before exposure to evaporate excess solvent (2 min./5 min. at 65°C/95°C), exposed
under a negative mask for 75 s., baked after exposure (2 min./5 min. at 65°C/95°C) to
facilitate additional resist polymerization, and developed in NanoSU8 developer
(Microchem). Once features are developed, the mold is baked again for 40 s. at 95°C to
remove remaining solvent.
A two step lithographic process is utilized for fourplex flow mold fabrication.
The first step is to define column construction flow channels (10 μm high). For these
channels, SU8-2010 (Microchem) is spun onto a wafer (3,000 rpm, 45 s.), baked before
exposure to evaporate excess solvent (1 min./3 min. at 65°C/95°C), exposed under a
negative mask for 45 s., baked after exposure (1 min./3 min. at 65°C/95°C) to facilitate
additional resist polymerization, and developed in NanoSU8 developer (Microchem).
Upon visualization of developed features, the mold is subjected to a 90 min. hard baked
at 150°C. When the mold cools to room temperature, the second step defining the
remaining 40 μm high channels is carried out. First, to promote resist adhesion, the mold

29
is exposed to hexamethyldisilizane (HMDS) vapor for 2 min. AZ-50 (Clariant) is then
spun onto the mold (1,600 rpm, 60 s.). The mold is subsequntly soft baked (2 min./5
min. at 65°C/115°C), aligned to the column construction flow channels, exposed under a
positive mask for 4 min., and developed in 25% 2401 developer (Microchem, diluted
with 18 mΩ dI H2O). Once features are developed, the mold is annealed/hard baked for 3
hr. at 200°C for the aforementioned reasons. Additionally, if the AZ-50 resist does not
undergo a chemical change (color turns from red to black), the features will crack when
subjected to subsequent soft lithography baking steps.
Device Fabrication
All devices are fabricated by multilayer soft lithography (MSL) with the silicone
elastomer polydimethylsiloxane (PDMS, General Electric). Each device employs push-
up valve geometry and is a three layer elastomeric structure bonded to a 3’’ X 1’’ RCA-
cleaned coverslip. Negative master molds are first exposed to chlortrimethylsilane
(TMCS, Aldrich) vapor for 2 min. to promote elastomer release from molds after baking
steps. Thirty g of liquid PDMS (5 parts A:1 part B) is poured onto the flow master,
degassed under vacuum, and baked for 45 min. at 80°C. Liquid PDMS (20 parts A:1
part B) is spun onto the control master mold (2,000 rpm for 60 s.) and allowed to settle
for 30 min. in order to obtain a uniform elastomer membrane on top of the control
features. The mold is then baked for 30 min. at 80°C. Upon completion of the baking
steps, the partially cured flow layer is peeled from its mold and 650 micron diameter flow
channel access holes punched (Technical Innovations, part# CR0350255N20R4). The
layer is then aligned to the partially cured control layer, still on the control master. The

30
two layer structure was then baked for 45 min. The third layer, a featureless elastomeric
membrane, is fabricated by spinning liquid PDMS (20 parts A:1 part B) onto a clean
silicon wafer (1,600 rpm for 60 s.) followed by baking for 30 min. at 80°C. Once baking
is completed, the two layer structure is peeled from the control master, control channel
access holes punched (Technical Innovations, part# CR0350255N20R4) and mounted
onto the third partially cured PDMS layer. The three layer structure is then baked for 5
hr. at 80°C. The assembled three layer structure is then peeled from the clean silicon
wafer, output holes punched (Technical Innovations, part #CR0830655N14R4), cut to
size, and bonded to an RCA-cleaned coverslip and baked overnight at 80°C.
31
Figure S-1

32
Table S-1
Supporting References 1. http://www.promega.com/pnotes/56/5338f/5338f_core.pdf
2. http://www.sigmaaldrich.com/sigma/bulletin/rtn10bul.pdf
3. http://www.stratagene.com/newsletter/pdf/13_3_p104-105.pdf
*Range is 1-5% of total RNA 0.18pg-0.89pg* 17.7pgStratagene Absolutely RNA kit3
0.15pg-0.75pg* 15pg Sigma GenElute Mammalian total
0.33pgN/APromega PolyA Tract mRNA
1pgN/AMicrofluidic fourplex mRNA yield per NIH/3T3 cellTotal RNA yield per NIH/3T3 cellMethod
0.5pgN/ADynal Bulk isolation
Yields from various mRNA isolation procedures

33
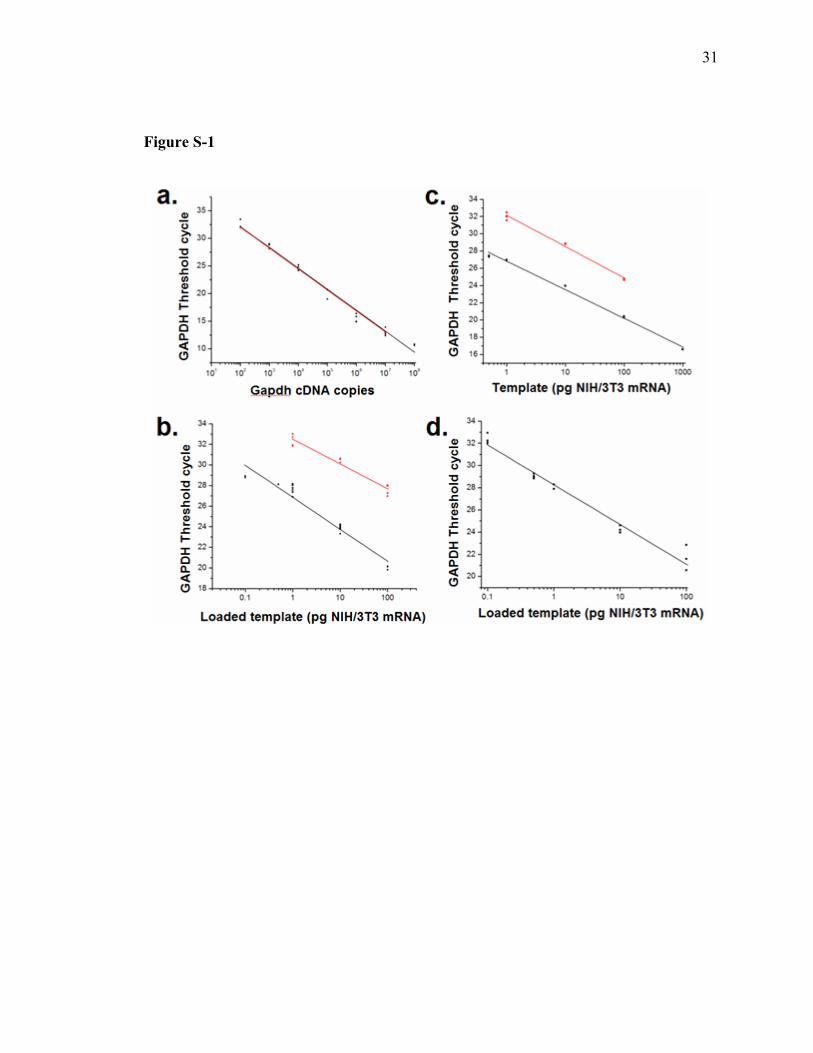
Supporting Figure Legends
Supporting Figure 1: qPCR and RT-qPCR standard curves. a. Standard curves utilized
to extract GAPDH copy number from cell samples. Black: qPCR standard curve was
generated with known GAPDH cDNA templates using the icycler platform (Y = -3.78X
+ 39.67. r2=0.99). The regression line was utilized to extrapolate average GAPDH copy
number in bulk preparations of NIH/3T3 mRNA by running RT-qPCR on seven mRNA
samples, each extracted from 2,500 NIH/3T3 cells. Red: Results from the identical
experiment in (a) utilizing the Roche Lightcycler (Y = -3.79X + 39.57. r2=0.99). b. RT-
qPCR standard curve generated with microfluidic mRNA samples (NIH/3T3 mRNA
loaded on-chip) . A 132 bp portion of GAPDH (black, Y = -3.11X + 26.86. r2=0.95), and
a 294 bp portion of HPRT (red, Y = -2.40X + 32.51. r2=0.96) were amplified and
detected. c. RT-qPCR standard curves generated with NIH/3T3 mRNA. A 132 bp
portion of GAPDH (black: Y = -3.31X + 26.82. r2=0.99) or a 294 bp portion of HPRT
(red: Y = -3.63X + 32.16. r2=0.99) were amplified and detected. d. qPCR standard curve
generated with microfluidic NIH/3T3 mRNA standards subjected to mRNA isolation/first
strand cDNA synthesis. Y = -3.59X + 28.27. r2=0.98.

34
Chapter 4: Real-time qPCR and oligonucleotide validation 4.1 Introduction
In order to achieve reliable quantification of mRNAs in biological samples, the
quality and reproducibility of the system (e.g. microfluidic process and subsequent
readout method) are of major importance.32 To verify the microfluidic cells-to-cDNA
process was quantitative, precise, and scalable (with regard to template concentration),
the author constructed qPCR standard curves9 with NIH/3T3 mRNA standards (Ambion)
subjected to the isolation and recovery process presented in chapters 3 and 5. Process
efficiency is extrapolated from stepwise process calibrations (ch. 3, 5) and is utilized as a
correction factor for the single cell gene expression measurements presented in this
thesis. Comparing standards along each step of the microfluidic process allows for the
efficiency of each step to be resolved, as well as determination of any process efficiency
differences that may exist at varying template concentrations. In this chapter, the
amplification efficiency and reproducibility of qPCR will be discussed as it relates to
multiple template concentrations and multiple genes, when probed for individually or in a
multiplex fashion. Only after it is determined that reaction efficiencies with non-
microfluidic standard templates within the dynamic range of the study are consistent and
reproducible can qPCR be utilized for cellular measurements and the quantification of the
microfluidic method itself.
In general, qPCR assays are characterized by a wide dynamic range of
quantification, high sensitivity, and precision, making these assays a natural fit for
validation of the microfluidic process.9 Furthermore, the need for post-PCR steps is
eliminated because detection of products occurs in real-time, thus avoiding the possibility

35
of cross-contamination when setting up a downstream assay. The majority of qPCR
assays discussed in this chapter are gene specific, and take advantage of the 5’ → 3’
exonuclease activity of Taq polymerase, as well as fluorescence resonance energy
transfer (FRET, Fig. 4.1). For each gene studied, three oligonucleotides (sense primer,
antisense primer, dual-labeled fluorescent probe) were designed. The dual-labeled
probe33 binds a sequence upstream of the sense primer sequence, and downstream of the
antisense primer sequence (or vice versa). Fluorescence of the reporter dye (5’ end) is
quenched by the second dye (3’ end of probe) when the probe is intact. When Taq
polymerase extends the PCR product off one of these primers, it cleaves the dual-labeled
probe and eliminates fluorescence quenching caused by FRET (Fig. 4.1). Because
reporter dyes become free in solution only when products are synthesized (unless DNases
are present in reactions), the amount of fluorescence measured is directly proportional to
amount of product generated.

36
Figure 4.1. Taqman PCR scheme. S is sense primer, A is antisense primer, and P is
dual-labeled probe. R and Q are the dual labeled probe’s reporter and quencher dyes,
respectively. A. Intitial state of the oligonucleotides before synthesis and extension of
products. B. The product is extended off the sense primer and in doing so, the probe is
cleaved. The reporter dye now free in solution is no longer quenched by the 3’ dye. C.
The probe is completely cleaved and the product has been fully extended. Quenching of
the 5’ reporter is completely eliminated.
The single cell qPCR literature is confined to studies that analyze cells harvested
either by laser capture microdisection (LCM),4, 34-36 patch-clamp,8, 15, 37 or other
micromanipulation methods.1-4, 6, 7, 9-15, 37-46 These methods suffer from a lack of
throughput and have been known to damage the integrity of the cells captured. Other
groups47, 48 have utilized aliquots from extremely dilute cell suspensions (which may or
may not have a single cell) and claimed single cell resolution. Single cell multiplex PCR
studies found in the literature all implement two successive rounds of PCR, with
detection taking place at the end of the thermal cycling.12, 46 Although the researchers
claimed their methods maintained an accurate reflection of the starting material, it is
reasonable to assume this would not be the case 100% of the time, or for all genes in a
cell. Inter-reaction efficiency differences (causing different amounts of products to be
generated in reactions with identical templates) can be caused by discrepancies in reagent
concentrations and primer-dimer competition differences. These differences will vary
from gene to gene depending on gene and primer characteristics such as secondary
structure and melting temperature. For multiplex studies, in order to maintain an accurate

37
quantification, individual reaction efficiencies for each gene should be similar.
Efficiency of a PCR on a given gene segment is stated as
P = T(1 + E)n (1)
where P is product after n cycles, T is starting template, and E is the reaction efficiency.
E will vary from 0 to 1 (1 = 100% efficiency), with values of 0.7–0.9 being the most
common. Because DNA generated from PCR increases exponentially after each cycle
(Equation 1), small inter-reaction variability can cause dramatic differences in reagents
consumed and therefore amount of product synthesized during a reaction. qPCR
overcomes this problem by monitoring products generated after each PCR cycle with
fluorescent probes that can either be sequence specific or non-specific. Quantification for
each reaction takes place by determining the PCR cycle (threshold cycle or Ct) where
fluorescence is significantly greater than background levels. The value typically
corresponds to the first inflection point of an amplification curve. The log-linear
relationship that exists between starting template concentration and Ct can then be
utilized to quantify unknown samples. Because product is exponentially amplified in the
reaction, end point analysis poses problems with quantifying the amount of mRNA
present initially. A high efficiency reaction starting with a low copy number can reach
the same product generation plateau as a low efficiency reaction that starts with a high
copy number (Fig. 4.2, experimental observations).

38
Figure 4.2. Real-time PCR amplification curves showing endpoint detection is not
sufficient for quantitative analysis. Diagram copied from Roche Molecular Biochemicals
technical note no. LC 8/99.
4.2 Bacterial mRNA primer and probe design
To obtain the sensitivity and dynamic range for the microfluidic cells-to-cDNA
process, with respect to transcript copy number, the author employed a synthetic mRNA
standard, specific to one transcript, and subjected it to the aforementioned microfluidic
process, or portions of it (ch. 5). In order to quantify murine cell lysis and competition
effects, the standard could not have homology to genes expressed in NIH/3T3 cells.
Comparing Ct values for the spiked-in transcripts (Dap mRNA + cells processed to
cDNA on-chip → qPCR) to Ct values for identically processed transcripts without cells
present (Dap mRNA processed to cDNA on-chip → qPCR) gives a quantification of the
cell lysis step. In addition, it is imperative to demonstrate equal priming and
amplification efficiency for the synthetic standard oligonucleotides, as compared to the

39
efficiency of the oligonucleotides utilized in the murine study. The author designed
primers for three of the four genes present in a synthetic polyA RNA control cocktail
(Affymetrix) with Beacon Designer software.49 Homology with mammalian genes was
controlled for by BLASTing (Basic Local Alignment Search Tool)50 the primer and probe
sequences against mouse, human, and rat genomes. Primers and probes were designed to
have Tms of 60°C ± 3°C and Tm(primer) + 10°C, respectively. These values have been
shown to be optimal for Taqman PCR assays.1 Primer and probe specifications are given
in Table 4.1 below.
Synthetic Bacterial mRNA primer & probe specifications
Dap Lys Thr Accession number L38424 X17013 X04603 Sequence length (bases)
1,560 1,192 1,680
Probe sequence TGT GAT GTG TAT
TCC ATT CCG CTC GCC A
CCG AAA CCT CCT CCA AGA TTC AGC ACC T
TGC CTT TGC CAC AGC CAT AAC CAT TCC G
Probe position; length 908; 28 696; 28 97; 28 Probe Tm (°C); GC% 63.5; 50 63.6; 53.6 64.9; 53.6 Beacon Designer probe rating; quality
80.5; best 71.3; best 77.1; best
Sense primer sequence
ACC GGA TGT CTC GGC ATT AAT C
GGC CGG TTT TGT GTT AGC AG
CGG AAG GCG TCA ATC CTA CG
Sense primer position; length
880; 22 592; 20 33; 20
Sense primer Tm (°C); GC%
57.1; 50 57; 55 58; 60
Antisense primer sequence
GCA CAA GAA TTT CCG CAG TAC C
GCG GTT CAT CAT CTT CCG TAT AAC
CGC ACA TAA TCG TGT CAT TGC C
Antisense primer position; length
965; 22 725; 24 128; 22
Antisense primer Tm (°C); GC%
56.7; 50 55.7; 45.8 57; 50
Product length; produt Tm (°C)
86; 83.8 134; 85.9 96; 85.2
Table 4.1. Primer and probe specifications for three synthetic bacterial mRNAs.

40
Once the primers and probes were designed and synthesized (Integrated DNA
Technologies), the author tested them against bacterial mRNA templates as well as
NIH/3T3 mRNA in RT-qPCR reactions, to determine if the primer and probe sequences
were unique to the synthetic bacterial mRNAs. A three step thermal cycling protocol was
executed (Appendix A), with a combined annealing/extension step at 57°C for 1 min.
Data collection was also enabled at this step. Amplification plots for the three genes
(100,000 copies respective bacterial mRNA/reaction, Fig. 4.3A) show the primers and
probe designed for Dap are the most reliable, giving strong amplification and a Ct one
cycle less than its tested counterparts for the same template. This implies either better
amplification efficiency or amplification of two products in parallel. To test for the latter,
the author utilized the Dap oligonucleotide set and performed Sybr green qPCR followed
by post run melt curve analysis (protocol given in Appendix A) on a dilution series of
bacterial mRNA templates. It should be noted that since the FAM reporter (utilized for
Dap probe) exhibits similar fluorescence excitation and emission properties to those of
Sybr green, the Dap probe needed to be resynthesized sans fluorophores. Figure 4.3B
illustrates the results of this experiment. The presence of one distinct peak for the
template dilution series verifies only one product is formed during PCR and further
validates the functionality of the Dap primer set. Furthermore, preliminary results
showed no cross homology with NIH/3T3 mRNA for all primer sets tested (Fig. 4.3A).
The author verified the Dap results in Fig. 4.3A by probing for Dap mRNA against a full
dilution series of NIH/3T3 mRNA in an RT-qPCR (Fig. 4.3C). The absence of non-
specific amplification was verified over the full range of NIH/3T3 templates tested (Fig.
4.3C).

41
Finally, the author needed to demonstrate equal priming and amplification
efficiencies for the Dap product as compared to the NIH/3T3 products, in order to
reliably measure absolute copies of mRNA present in single NIH/3T3 cells. Here, RT-
qPCR purified products generated with the primer and probe sets utilized in chapter 5
(Dap–Table 4.1, β-actin, GAPDH, PGK–Table 4.2) were utilized to generate standard
curves by qPCR (Dap) and triplex qPCR (β-actin, GAPDH, PGK). Primer specifications
for the multiplex study are discussed later in the chapter. In order to create a template for
triplex qPCR, so as to simulate the single cell measurements taken in chapter 5, the
mammalian gene products were combined into one tube. The four standard curves
generated are shown in Fig. 4.3D. The overlapping nature of the curves demonstrates
equal amplification efficiencies for templates spanning 6 orders of magnitude, and allows
the microfluidic process efficiency measurements generated with the synthetic mRNA
Dap to be transferred to the study of the three aforementioned genes in NIH/3T3 cells.
A. B.
C. D.
Thre
shol
d cy
cle
Template (cDNA molecules)

42
Figure 4.3. Bacterial mRNA primer validation. Orange lines in amplification plots
areplaced at the fluorescence threshold, in order to determine Ct values. A. Threbacterial
mRNA primer sets [Table 4.1, thr (black); lys (cyan); dap (red)] were tested against
serially diluted NIH/3T3 mRNA (0.1 pg, 1 pg, 10 pg, 100 pg, n=3 for each template) as
well as 100,000 copies of the respective bacterial mRNA template. Only the positive
controls were amplified for the three genes. B. Post-qPCR melting peak analysis for six
distinct Dap templates (106 copies → 10 copies Dap mRNA, serially diluted by a factor
of 10, n=3 for each template) C. Repeat of experiment in (A), but with only Dap primers
and probe. Five repeats for each NIH/3T3 template in the dilution series (0.1 pg, 1 pg, 10
pg, 100 pg, 1 ng) were run. D. qPCR standard curves generated in a triplex reaction (β-
actin - red, GAPDH - black, PGK – blue, see Ch. 5 for fits) or a simplex (Dap – green, Y
= -3.5(X) + 38.82, R = -0.99) reaction. Templates for all reactions were
spectrophotometrically quantified PCR purified products.
4.3 Benchtop reverse transcription efficiency measurements
Once it was established the Dap primer/probe set was amenable for microfluidic
efficiency measurements, the author ran an RT-qPCR dilution series experiment with 106
Dap mRNA molecules → 10 Dap mRNA molecules, diluting each template by an order
of magnitude for a total of six template concentrations. Amplification curves for this
experiment, as well as the corresponding standard curve, are given in Fig. 4.4A-B. The
figure shows the RT-qPCR to be reproducible and precise, evident from the overlapping
amplification plots of identical standards and the highly reliable correlation coefficient of
the corresponding standard curve (R = -0.99). The standard curve’s goodness of fit to the

43
data also implies equal amplification efficiency for all templates tested. If reaction
efficiencies varied by template concentration, linear regression analysis would be
problematic and therefore quantifying a range of templates present in mRNA or cell
samples would also pose troublesome. Only if amplification efficiency of all genes of
interest varied identically would quantification be possible in the unequal efficiency case.
Purification of the RT-qPCR products in (A) , and subsequent quantification by
spectrophotometry, enabled the author to generate a standard curve composed of varying
concentrations of the 86 bp Dap cDNA fragment (Fig. 4.3D green and Fig 4.4B red). A
measure of reverse transcription efficiency can then be extrapolated by plotting the Ct
values from the RT-qPCR (Fig. 4.4A-B, black) onto the qPCR (Fig. 4.4B, red) standard
curve. Averaging over all templates tested (10 molecules → 106 molecules), a reverse
transcription efficiency of 77% was measured, meaning for every one mRNA molecule,
0.77 corresponding cDNA molecules were synthesized (Table 4.2). The coefficient of
variation for all the measurements was 0.25. Measuring reverse transcription efficiency
for individual templates shows the enzyme to be fairly consistent over six orders of
magnitude. However, the variation is much higher for the lowest template concentration
than for the more concentrated ones (Table 4.2). This is expected, as reverse
transcriptase and taq polymerase are less efficient and more variable for low template
concentrations because of the stochastic nature of the RT and PCR reactions. The yields
obtained fall within the range of reverse transcription efficiency found in previous
studies.51, 52 However, the average efficiency values found in the literature tend to be
~0.5, but the enzyme utilized in this thesis was not tested in previous published reports.51,
52

44
Mea
sure
d te
mpl
ate
(Dap
mol
ecul
es)
Loaded template (Dap molecules)
Figure 4.4. Off-chip reverse transcription efficiency experiments. A. Dap amplification
curves for serially diluted [106 copies (magenta) → 10 copies (blue)] Dap mRNA. Red
curves are no-template control reactions. Orange line is placed at the fluorescence
threshold, which determines Ct values. B. Black: standard curve generated from the Ct
values in (A). Y = -3.54(X) + 39.4, R = -0.99. n=10 for each template. Red: Standard
curve generated from a qPCR with PCR purified templates. The curve is identical to the
blue curve in (Fig. 4.3C). Y = -3.50(X) + 38.82, R = -0.99. C. RT efficiency
measurements over six orders of magnitude. The Ct values from (A.) were plotted onto
the red standard curve in (B.) to arrive at a measured value of cDNA molecules. The line
indicates 100% efficiency (m=1).
A.
B. C.
Thre
shol
d cy
cle

45
RT Efficiency Measurements
Table 4.2. RT efficiency measurements and corresponding statistics. SD is standard
deviation and c.v. is coefficient of variation.
4.4 Primer/probe design for multiplex study
One of the scientific goals for the technologies in this thesis is to study gene
expression noise at the single cell level. To do this, the author chose to examine genes
expressed ubiquitously in NIH/3T3 cells. Real time detection is limited to four genes per
assay because the instrument contains four distinct emission channels. Accordingly, the
author opted for three genes present in the glycolysis pathway along with the
cytoskeleton protein, β-actin for the initial primer validation studies. Primer and probe
characteristics for the genes of interest are given in Table 4.3. As with the bacterial
mRNA design principles, the Tms of the primers and probes were designated to be 60°C ±
3°C and Tm(primer) + 10°C, respectively. Primer-dimer energies were also constrained
to be ≤ -6 kcal/mol in order to limit competition of non-specific product formation during
the RT and PCR reactions. To validate the functionality of the primer/probe sets, the
author performed simplex and fourplex qPCR reactions in parallel, as well as simplex and
mRNA copies (n=10 for each)
10 100 1000 10000 100000 1000000 all templates
average efficiency 0.68 0.83 0.81 0.8 0.77 0.73 0.77
variance 0.16 0.021 0.0059 0.0078 0.0053 0.0069 0.036
SD 0.39 0.14 0.077 0.088 0.073 0.083 0.19
c.v. 0.58 0.17 0.095 0.11 0.095 0.11 0.25

46
triplex qPCRs in parallel, for all four genes, or three of the four (Fig. 4.5). 10 pg/μL liver
cDNA was diluted serially by factors of 10 to give three templates for the experiment: 10
pg/reaction, 1 pg/reaction, and 0.1 pg/ reaction. Each template was run in triplicate for
simplex, triplex, and fourplex reactions. It should be noted the experiments in A.-D.
were run on different days than the ones pictured in E.-G. Accordingly, the simplex
reactions are not identical for the respective genes when comparing the black curves to
the blue curves in Fig. 4.5. As shown in Fig. 4.5, Ct values for simplex and fourplex as
well as simplex and triplex reactions overlap for each gene for every template tested,
indicating primer-dimer formation is not an issue during the qPCR. However, there is
much more variation for the Cy5 channel (PGK) in the fourplex reaction than the triplex.
This result was confirmed over multiple qPCR runs and it was determined to employ
three gene detection for the single cell measurements. Further optimization of the
fourplex qPCR should allow for quantitative detection of the four genes in parallel (Table
4.3).

47
Primer and Probe Specifications for Multiplex Study
Table 4.3. Primer and probe specifications for multiplex PCR study.
β-actin GAPDH PGK Enolase Accession number NM_007393 NM_001001303 M15668 NM_023119 Sequence length (bases) 1,892 1,243 1,653 1,720
Probe sequence
CCA TCC TGC GTC TGG ACC TGG CTG GC
CGT GCC GCC TGG AGA AAC CTG CCA AGT
ACC ACA GTC CAA GCC CAT CCA GCC AGC A
CCA CCT GGA TGC CCG CAC TAG CCG T
Probe position; length 601; 26 789; 27 973; 28 1,041; 25 Probe Tm (°C); GC% 68.7; 69.2 68.3; 63 68.9; 60.7 68.7; 68 Beacon Designer probe rating; quality 69.4; good 64.5; good 77.2; best 73.7; good
Sense primer sequence
CCA TCT ACG AGG GCT ATG CTC TCC
CCA ATG TGT CCG TCG TGG ATC TG
ACC TTG CCT GTT GAC TTT GTC ACT G
GTA CAA GTC CTT CGT CCA GAA CTA CC
Sense primer position; length 571; 24 765; 23 863; 25 932; 26 Sense primer Tm (°C); GC% 60.4; 58.3 62.3; 59.9 59.6; 48 58.4; 50
Antisense primer sequence
CAC GCT CGG TCA GGA TCT TCA TG
TCC TCA GTG TAG CCC AAG ATG CC
CCT CGG CAT ATT TCT TGC TGC TCT C
TTG GCA ATC CGC TTA GGG TTG G
Antisense primer position; length 669; 23 888; 23 1,001; 25 1,084, 22 Antisense primer Tm (°C); GC% 59.7; 56.5 60.9; 56.5 59.7; 52 60.2; 54.5 Product length; produt Tm (°C) 99; 90.4 124; 90.4 139; 89.3 153; 92.7
C. D.
A. B.

48
Figure 4.5. Amplification plots for fourplex, triplex, and simplex qPCRs. A.-D.
Fourplex reactions. Negative controls for simplex and fourplex reactions are shown in
green and blue, respectively. Red amplification curves are simplex reactions and black
curves are fourplex reactions. A. Enolase (Fam) B. GAPDH (Texas red) C. β-actin (Hex)
D. PGK (Cy5). E.-G. Triplex reactions. Red amplification curves are simplex reactions
and blue curves are triplex reactions. Negative controls are not pictured. E. GAPDH
(Fam) F. β-actin (Hex) G. PGK (Cy5).
4.5 Combating non-specific product formation during RT step
When the author ran RT-qPCR with multiple primer/probe sets (GAPDH, β-actin,
PGK) in a single reaction, it became clear that non-specific products form during the
reverse transcription step (Fig. 4.6). Multiplex qPCR over three orders of magnitude (10
pg, 1 pg, 0.1 pg liver cDNA) showed identical Ct values to those of the corresponding
G.
E. F.

49
simplex reactions (Fig. 4.6, column a). If primer-dimers were forming from the onset of
the PCR, it would be reasonable to suspect the Ct values for the multiplex reactions to be
higher than those of the respective simplex reactions, and that is not seen. However, non-
specific products are forming during the exponential phase of the multiplex reactions, as
shown by the amplification curves plateauing earlier than the corresponding simplex
curves. The plateau is due to reagent consumption in the formation of non-specific
products, thereby minimizing reagents for the main product to amplify. The non-specific
product formation during PCR is not an issue for the NIH/3T3 cell measurements
because Ct values are resolved for all three genes in the range necessary to detect
messages from single cells. In contrast, when utilizing identical concentrations of
NIH/3T3 mRNA to run multiplex RT-qPCR, only the most concentrated template (10
pg/reaction) is detected when probing GAPDH and PGK. For β-actin, 10 pg and 1 pg
NIH/3T3 mRNA templates can be resolved. In order to measure transcript levels in
single cells, the lowest template concentration (0.1 pg/reaction) needs to be discerned
from the measurement noise. It is known that reverse transcriptase is active at room
temperature and demonstrates non-specific priming. These two facts make it very
difficult to perform multiplex RT-qPCR reactions in a one-tube format.
The options to combat the non-specific reverse transcription problem are as
follows: (1) design new primers, (2) perform a two step reaction, both steps benchtop
(first strand cDNA synthesis reaction followed by qPCR), (3) perform a two step
reaction: microfluidic first strand cDNA synthesis, followed by qPCR. The strong
amplification plots obtained on cDNA templates down to 0.1 pg cDNA (Fig. 4.4 column
a) taken together with the characteristics of the reverse transcriptase enzyme, make it

50
highly unlikely that designing new primers is the answer. Option two is a viable one,
although not optimal. Loss of product may become an issue if the beads are handled off-
chip in additional processing steps. Option three is the best because primer-dimers and
other non-specific products will be washed away after the RT step and subsequent buffer
exchange.
Varying templates of NIH/3T3 mRNA (50pg, 10pg, 1pg and 0.1pg) were isolated
with 20X mRNA isolation chips (ch. 5). First strand cDNA synthesis on-chip was then
carried out on-chip (ch. 2, 3, 5) followed by recovery of the products. qPCR was
subsequently employed on the microfluidic NIH/3T3 standards (Fig. 4.4). The author
compared Ct values and amplification plots of the microfluidic samples to amplification
plots generated with a RT-qPCR (Fig. 4.6). These results indicate microfluidic cDNA
synthesis is a solution to the non-specific product formation during RT and subsequent
inhibition of the qPCR. The plots are cleaner, the exponential phase goes for longer, and
templates down to 0.1 pg are resolvable for all three genes, which is not the case when
RT-qPCRs are implemented. Despite the effectiveness of the microfluidic solution,
primer-dimers still are detected in the hex (β-actin) channel around cycle 35. In order to
quantify β-actin in single cells with the existing primer set, it is necessary for the
respective cell’s mRNA amplification to occur before the non-specific amplification.
This is indeed what is seen for single NIH/3T3 cells (ch. 5).

51
A.
B.
C.
a. qPCR b. RT-qPCR c. μf RT - qPCR
Figure 4.6. Amplification plots showing μF RT-qPCR is the preferred format. PGK
(cy5), β-actin (hex), and GAPDH (fam) curves are given in A., B. and C., respectively.
Column a. shows simplex (red) and triplex (black) qPCRs for the three genes of interest.
Templates are in triplicate and are either 0 (blue curves), 0.1, 1, or 10 pg liver cDNA.
Column b. gives amplification plots for triplex RT-PCR reactions for the three genes.
Templates are in triplicate and are either 0 (blue), 0.1 (magenta), 1 (black), or 10 pg (red)
NIH/3T3 mRNA. Column c. shows amplification plots for NIH/3T3 samples subjected
to microfluidic first strand synthesis, followed by qPCR. Templates are either 0 (blue),
0.1 (magenta), 1 (black), 10 pg (red), or 50 pg (green) NIH/3T3 mRNA.

52
Chapter 5: Measuring gene expression noise in single mammalian cells
using microfluidics
5.1 Introduction
5.1.1 Noise background
It is widely accepted that clonal populations of cells exhibit considerable
phenotypic variation, which is manifested by differences in molecular expression.53 The
variation, or noise, has been implicated as the underlying phenomenon necessary for
cellular differentiation events and development of heterogeneous tissues or systems.53, 54
Therefore, a better understanding of how noise is generated and the quantification of it
may provide insight into processes such as stem cell differentiation events and cancer cell
generation/metastasis. Variations in gene expression have been shown indirectly in single
isogenic E. coli and yeast by measuring dual reporter protein levels.53, 55, 56 This method
incorporates GFP variants into chromosomes, so as to circumvent the extrinsic noise
added into systems when utilizing plasmids free in the cellular environment.57 Plasmid
number is unable to be quantified because the concentration fluctuates randomly inside a
cell, thereby introducing a source of extrinsic noise. The single plasmid method58 is most
like the system described here in that there is some extrinsic noise initially, due to
fluctuating mRNA levels, inherent decay, RNases, or ribosomal translation. With the
dual reporter method, the total noise (ηtot) of a system can be deconvoluted into two
categories: (1) fluctuations of cellular components (extrinsic noise, ηext) and (2) inherent
stochasticity present in the biochemical process of gene expression (intrinsic noise,
ηint).53-55, 59 Intrinsic noise is defined by the extent of which the two reporter proteins’
expressions in the single cell fail to correlate, whereas the cell to cell difference in

53
reporter protein levels defines the extrinsic noise.53 To date, the dual reporter technique
has yet to be applied to a mammalian system. Single reporter techniques have been used
to quantify dynamic gene expression in single cells and can be conceivably utilized for
the measurement of ηtot in individual mammalian cells.60, 61 This technique has already
been applied to the study of noise strength in single S. cerevisiae.58 Results in the
literature are consistent in the fact that extrinsic noise is found to be the main contributor
to the total noise of the system. This is not surprising considering the many sources for
this noise (e.g. molecule concentration, cell cycle stage, mRNA decay rate, environment)
Reports discussing gene expression noise measurements, to this date, have
measured the corresponding protein levels to study noise in the genes expressed. This is
not ideal in that translational efficiency is not directly measurable because mRNA levels
are not initially quantified. Furthermore, noise has been extrapolated from arbitrary units
of fluorescence in protein levels, which makes it impossible to compare measurements
across laboratories unless a calibration in terms of molecules is present. This problem
parallels what is faced by researchers trying to discern the microarray data across
laboratories. The standard metrics to quantify noise assume cell distributions to be
normal about the mean. There have been a few cases in which histograms show normal
distributions for protein distribution.58, 62 These distributions are surprising in that there
are a multitude of reactions needed to go from DNA to protein expression, and all are
sensitive to random fluctuations of reactant molecules. In addition, studies that show the
normal protein distribution are in experimental contrast with a portion of the literature
that demonstrates intracellular mRNA and protein distributions support log
transformations.15, 56, 63-65 In most studies, histograms are lacking and careful statistical

54
analysis is therefore overlooked. In one study,56 the authors claim a lognormal fit
describes their dataset with more certainty than a normal Gaussian distribution; however
the metrics to quantify the corresponding noise are still linear in nature. Although the
coefficient of variation, which is commonly used as a noise metric, for a lognormally
distributed dataset is equivalent to the untransformed set; a more correct characterization
of the population, if lognormal, would be to incorporate a geometric mean term. In the
study presented in this chapter, the author measured gene expression noise directly at the
transcriptional level in single NIH/3T3 cells, and asked to what degree cell cycle phase
and pathway specific gene expression are contributors to ηtot in the cell population. The
following is the first reported direct measurement of transcriptional noise in single cells,
regardless of cell type, and the first measurement of noise in single mammalian cells.
5.1.2 Lognormal distribution background
There is increasing evidence in the literature that products of various biological
processes and reactions, transcription and translation included, are distributed
lognormally. The following section will describe the lognormal distribution
mathematically.
Consider a lognormally distributed variable x with mean μx and standard
deviation σx, denoted LN(μx, σx2). Then, the variable y, where
y=ln(x) (1)
is normally distributed with mean μy, standard deviation σy, and is denoted N(μy, σy2). It
should be noted μy and σy2 refer to the parameters of the log-transformed variable y, and

55
σy
therefore need to be back-transformed for meaningful analysis. The probability density
function f(x) (untransformed data) satisfying the lognormal distribution is stated as
, (2)
It can be seen from the probability density function in mathematical and graphical terms
(Fig. 5.1), that the lognormal distribution only holds for values of x > 0, and the
distribution encompasses a tail (skewed) to the right of the mean.
Fig 5.1. Probability density function of the lognormal distribution.66 Left: Linear
coordinates along the x axis. The peak of the curve corresponds to the median and the
geometric mean of the dataset. Right: Log transformation of plot on the left, with μy and
σy labeled.
The mean and variance for the untransformed dataset, μx and σx, can be discerned if μy
and σy are known for the transformed set:
(3)
(4)

56
If μy and σy are unknown, but μx and σx are known, it follows from (1) that
(5)
(6)
It should be noted again at this point μx corresponds to the population mean, and not the
geometric mean, which will correspond to the median of the untransformed dataset:
Geometric Mean(x) = Median f(x) = exp(μy) (7)
Now, by taking the square root of equation (4), and dividing it by equation (3), an
expression for the coefficient of variation of the dataset arises:
1)exp( 2 −= yCV σ (8)
Again, equation (8) takes the log-transformed variance as its argument. Interestingly, the
c.v. is only a function of σy, and not of the mean, μy of the transformed dataset.
5.1.3 Modeling noise in transcription–considerations and differences with reporter
systems
The main difference in the system employed here as opposed to elsewhere (in
bacteria and yeast) is that the latter utilized inducible promoters and the former is a
snapshot with background mRNA levels providing a source of extrinsic noise. This can
be reconciled by either calculating or modeling mRNA decay rates.67 Because the gene
expression data for all genes tested exhibit lognormal distributions, the model should
incorporate processes that are multiplicative in nature. For example, Paulsson57 describes
the probabilities of having n1 and n2 molecules per cell of chemical species X1 and X2

57
(for his example X1,X2 =mRNAs, proteins) as a birth and death Markov process with
events
.
These statements capture the dynamic disorder of the cell because n1 affects rate R2, but
n2 does not affect R1. In the system used here, protein translation is not measured;
however, these rates still hold for the intracellular environment. For example, n1 could
represent the rate-limiting component of the transcriptional machinery (including
chromatin remodeling proteins), whose concentration and fluctuations would randomize
mRNA transcription, to an extent.
5.2 Results
5.2.1 Single cell measurements
With each step along the microfluidic process quantified, and triplex qPCR
parameters worked out, it is now possible to measure absolute mRNA copy numbers of
the specified genes in single cells. NIH/3T3 cells were FACS sorted based on DNA
content, and a total of 202 cells (99 G1, 103 G2) were processed microfluidically to
cDNA, utilizing the 50X devices discussed later in the chapter. These samples were then
subjected to qPCR, after which Ct values were plotted onto the respective standard
curves, to obtain raw copy number values. Cells that contained copy numbers < 10
(before correction) for any of the three genes were immediately thrown out because 10
copies is the detection limit, in the author’s hands, for triplex qPCR. A total of 10 G1
and 12 G2 cells fulfilled the above criteria, and were scrapped, leaving 89 G1 and 91 G2
cells for analysis. The author first corrected the raw copy number data by dividing the
values by 0.12 (total efficiency of process, see methods). mRNA copies for each cell

58
were then normalized by their respective population average, and graphically represented
as a three-dimensional scatter plot, either sorted based on DNA content, or unsorted (Fig.
5.2A, B). G1 and G2 populations can be distinguished from each other in this
representation (Fig. 5.2A). However, when the data are unsorted, and normalized by the
entire population average, only one population is observed (Fig. 5.10B). These results
show cell cycle phase to be a factor in the absolute expression of the three ubiquitous
housekeeping genes in single NIH/3T3 cells. The G1 and G2 populations are also
distinguishable when plotting GAPDH vs. PGK expression two dimensionally (Fig.
5.2C).
Because the distributions in 5.10A and B exhibit long tails, the author transformed
the data into log coordinates, subtracting the log mean copy number from each cell’s
transcript copy number (Fig. 5.2D). Upon doing so, the two populations are
undistinguishable from each other (Fig 5.2D). Furthermore, transformed copy number
values centered about the mean for all three genes in both populations, indicating
lognormal distributions. The author further tested the distributions of the dataset by
plotting all pairwise correlation data in two-dimensional scatter plots (Fig. 5.2E-H). It
was found that the pooled G1 and G2 populations are co-linear with respect to PGK and
β-actin expression (Fig. 5.2E). Furthermore, these two populations pass a Kologmorov-
Smirnov test indicating the same underlying distribution (P=0.05). When the data are
separated according to cell cycle phase, the underlying β-actin and PGK distributions still
pass the Kologmorov-Smirnov test (P=0.2 for both, Fig. 5.2F-G). However, when
normalizing expression by the mean copy number of the respective transcript, the
distributions in the two genes do not match (Fig. 5.10H). Because PGK and β-actin have

59
different promoters and are located on different chromosomes, it is highly unlikely the
distributions are identical, as the statistical test implies. Furthermore, because the
distributions do not match statistically when subtracting out the mean transcript number,
the author takes the distribution data in Fig. 5.2E-G to be artifactual in nature.
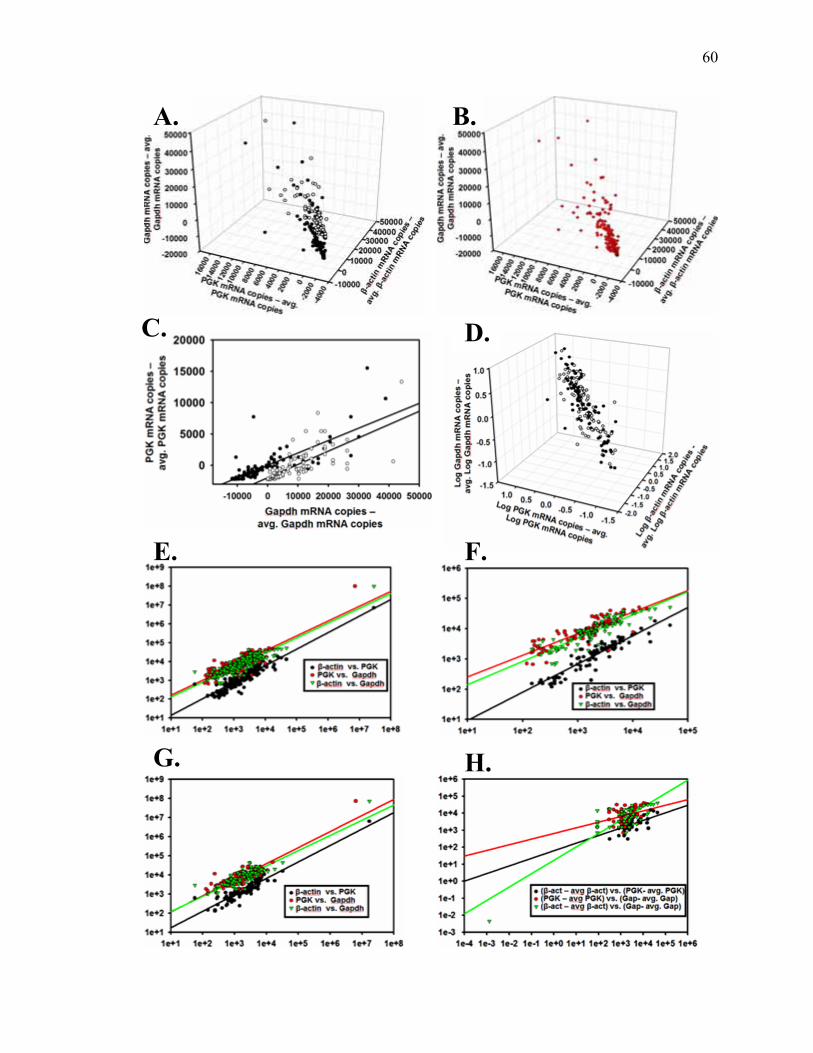
60
A. B.
C. D.
E. F.
G. H.

61
Figure 5.2. Gene expression correlation data. A. Three dimensional scatter plot showing
correlation between β-actin, PGK, and GAPDH gene expression. Raw copy numbers
were normalized by subtracting out the G1 (black) or G2 (white) population mean. B.
Copy numbers for genes were normalized by the average copy number for the entire
dataset and plotted three dimensionally. C. GAPDH vs. PGK expression in single G1
(black) and G2 (white) NIH/3T3 cells. D. Copy numbers for genes were log-transformed
and normalized by the average log copy number for the respective gene (G1 –black, G2 –
white). E.-G. Transcript correlation data without normalization by the mean. E. Pooled
dataset. F. G1 cells. G. G2 cells. H. Pairwise gene expression correlation with mean
normalization.
In order to test for lognormal distributions in the datasets, the author plotted
histograms of ln transformed copy number values for each gene and cell cycle phase;
after normalizing each cell’s value to the ln mean mRNA copy number (Fig. 5.3). Upon
fitting the histograms to Gaussian distributions, it was revealed that the three genes are
lognormally distributed in single NIH/3T3 cells, regardless of DNA content
(heterogeneous, G1, or G2; Fig. 5.3). The lognormal distribution is not surprising
because the process of transcription is dependent on multiplicative effects such as
concentrations of molecules required for intracellular signaling and the necessary
convergence of proteins to form the transcriptional machinery. The author also showed
that normalizing each gene pairwise, by taking the difference in natural logs, resulted in
lognormal distributions for all ratios tested (Fig. 5.4). This result is useful because the
difference of two logs, distributed normally is equivalent to the lognormal distribution of

62
the copy number ratios. The lognormal distributions visualized are also another
validation of the microfluidic cells-to-cDNA process. If the steps along the process were
not repeatable and consistent (i.e. if lysis did not go to completion), one would expect to
see random distributions. These results are also consistent with gene expression data
from single pancreatic cells, as well as what is found for protein expression in single E.
coli.15, 56

63

64
Figure 5.3. Individual genes are distributed lognormally over pooled (A.-C.) G1 (D.-F.)
and G2 (G.-I.) populations.

65
Figure 5.4. Gene expression normalized by in- and out-of-pathway genes. All
combinations are distributed lognormally over pooled, G1, and G2 populations. Only
pooled data are shown. A., B. Normalized to GAPDH. C., D. Normalized to β-actin.
5.2.2 Noise measurements
As stated above, mRNA distributions are distributed lognormally at the single cell
level. Despite this, the author quantified noise in the untransformed dataset, in terms of
coefficient of variation (c.v.: standard deviation/mean) and Fano factor (variance/mean).
Because some of the noise literature is void of cell population histograms and/or indicate
lognormal distributions, the author did as the authors of these studies do: quantified noise
based on the previously stated linear metrics (Table 5.4). The author first determined if
the noise exhibited in NIH/3T3 cells scaled as a Poisson process (Fig. 5.5A). If the noise
was Poissonian, the Fano factor would equal one (line in Fig. 5.5A: m=1). As the figure
shows, the mean copy number does scale with the variance, but the scaling is orders of
magnitude higher than what is seen in a Poisson process. The c.v. and Fano factors
obtained for the datasets are exceedingly higher than what is seen in the literature (Fig.
5.5 B, C). However, comparing datasets across studies may not be meaningful because
noise is not quantified in terms of copy numbers in previous work, as is done in the
present study. Nevertheless, possible explanations for the high noise include: (1)
mammalian cells were used in this study as compared to yeast and bacteria in previous
work, and (2) gene expression occurs on a single locus in the present study, whereas
engineered cells utilizing The transcriptional noise seen in NIH/3T3 exceeds the
measurement error, in some cases by five times; and therefore is a real affect.
66
Controlling for the extrinsic variable of DNA content, the author demonstrated noise
values decrease for the three genes in the G2 stage of the cell cycle, but remain relatively
unaffected in G1, as compared to a heterogenous population (Fig. 5.5, Table 5.1). These
results seem to implicate regulatory control of the glycolysis enzymes before cell
division. This is not surprising in that the daughter cells require some minimal
concentration of these enzymes to survive. Interestingly, when controlling for the basic
cellular environment, by normalizing copy numbers of the glycolysis genes to β-actin
gene expression, noise is seen to increase for the gene ratios as compared to the raw copy
number values. However, the noise in the ratio groups decreases in G1 as compared to
G2 and the heterogenous sample (Fig. 5.5). Furthermore in all three groups, the ratios’
coefficients of variation are higher than the noise measured for the glycolysis genes
alone. Although the total noise in all three genes goes down in G2, the ratios of gene
expression increase most likely due to the genes being active in distinct cellular
processes, with intracellular variability non-deleterious if copy numbers stay above a
certain threshold. The cell probably makes more than enough of the three genes studied
and employs regulation before divison. This mechanism could decrease noise at the
protein level (e.g. high copy numbers are the limiting case for translational noise) for the
housekeeping genes, with excess transcripts always available for translation, thus
obviating stochastic affects. The next generation of measurements, coupling protein
expression (utilizing fluorescence microscopy before lysis) to mRNA transcript
expression, should resolve this issue.

67
Gene Expression Noise Based on Raw Copy Numbers
g1 β actin g1 pgk g1 GAPDH mean 3833.18 2339.11 12365.96
geo mean 1921.7 1255.2 7993.2 std.dev 6313.28 2825.16 11200.06
var 4.03E+07 8.07E+06 1.27E+08 c.v. 1.65 1.21 0.91
Fano 10516.16 3450.98 10259.35 g2 β actin g2 pgk g2 GAPDH
mean 3034.12 2375.62 10255.84 geo mean 1726.2 1458.8 7359.8
std.dev 4096.02 2513.21 8494.96 var 4.03E+07 8.07E+06 1.27E+08 c.v. 1.37 1.1 0.83
Fano 13285.7 3397.93 12370.2
Pooled β actin pooled pgk pooled GAPDH
mean 3512.54 2382.8 11694.9 geo mean 1326.2 1104.6 5173.7
std.dev 5883 2823.4 12463.3 var 34609888.9 7971642.2 155334247.6 c.v. 1.67 1.18 1.07
Fano 9853.23 3345.52 13282.25
Table 5.1. Gene expression noise measurements calculated based on raw mRNA
transcript values and the log-transformed data. The c.v. values are identical whether in
the log or linear scale (see discussions on lognormal distribution).
The noise strength (Fano factor) for the copy number ratios is exceedingly lower
than the ones found when analyzing the raw dataset. This demonstrates the need to stay in
original units when quantifying noise strength. Normalization, in most cases, will
decrease variance, and therefore decrease the noise strength.

68
Pairwise Normalization of Gene Expression Noise
g1
actin/pgk g1
gap/pgkg1
pgk/acting1
gap/acting1
actin/gap g1
pgk/gap mean 1.77 7.60 0.78 4.78 0.28 0.20
Std.dev 1.14 4.78 0.75 2.72 0.17 0.23 var 1.30 22.81 0.56 7.42 0.03 0.05 c.v. 0.65 0.63 0.96 0.57 0.62 1.16
Fano 0.74 3.00 0.72 1.55 0.11 0.27
g2
actin/pgk g2
gap/pgkg2
pgk/acting2
gap/acting2
actin/gap g2
pgk/gap mean 1.40 6.19 1.04 5.27 0.29 0.24
Std.dev 0.81 5.46 1.21 5.48 0.19 0.16 var 0.66 29.83 1.47 30.08 0.03 0.02 c.v. 0.58 0.88 1.17 1.04 0.65 0.66
Fano 0.47 4.82 1.41 5.71 0.12 0.10
pooled
actin/pgk pooled gap/pgk
pooled pgk/actin
pooled gap/actin
pooled actin/gap
pooled pgk/gap
mean 1.58 6.90 0.91 5.04 0.28 0.22 Std.dev 1.00 5.14 1.01 4.31 0.18 0.20
var 1.00 26.42 1.02 18.60 0.03 0.04 c.v. 0.63 0.74 1.11 0.86 0.63 0.91
Fano 0.63 3.83 1.12 3.69 0.11 0.18
Table 5.2. Gene expression noise measurements calculated based on pairwise
normalization of genes. Because these data are distributed lognormally when
transformed (e.g. ln actin – ln pgk = log normal relationship), the author divided the raw
copy numbers to arrive at these values

69
Figure 5.5. Raw noise measurements on NIH/3T3 cells. Extrinsic noise due to cell cycle
stage and basic intracellular variability (β-actin normalization) are quantified. Note
measurement error (~0.3) has not been subtracted.

70
5.3 Methods
Although the devices in chapters 2 and 3 are able to process single cells to cDNA
in a parallel manner, running only four samples in parallel poses problems for the
researcher in terms of obtaining enough samples for meaningful analysis. Single cells are
ideally analyzed from the same cell culture or tissue section in order to minimize
extrinsic noise in the samples analyzed, brought on by day to day variation (e.g.
temperature fluctuations, age of sample). However, there are no widespread methods to
process single cells to cDNA for gene expression studies, in a parallel manner. In this
section, the author describes a solution to this problem and applies the novel technology
to the study of gene expression noise in single NIH/3T3 cells.
5.3.1 Device component optimization
As is the case frequently when developing a nascent microfluidic device into a
mature platform capable of carrying out a specific process, the initial device design
varied considerably from the optimized design.
5.3.1.1 Column construction
The author first attempted to stack 20 to 80 bead columns in parallel. To do this,
beads were resuspended to two times their normal concentration and flowed into a
serpentine channel. Once beads were present throughout the serpentine, valves
partitioned off each reactor, and lysis buffer pushed the beads against the sieve valves
through an input upstream of the bead input. The author found the amount of beads
trapped in the serpentine was far from sufficient to build a bead column of appropriate

71
length (~300 μm). Iterating between the lysis buffer push step and filling the serpentine
channel produced better results; however, a full column could still not be stacked after 10
iterations. Concentrating the beads beyond 3X eventually clogged the bead input, so a
better solution was needed.
In order to solve the bead stacking problem, the author implemented a fluidic
multiplexer to individually address reactors on-chip (Fig. 5.6, Ch. 7). The multiplexer
allows for unlimited bead columns to be stacked in a serial fashion. Figure 5.1 is an
AutoCAD drawing of the bead stacking portion of a 20X cells-to-cDNA device along
with an optical micrograph of 20 stacked columns. The columns are stacked in a uniform
fashion regardless of whether 1, 2, 4, or 8 columns are constructed in unison (column
pitch of 500 μm, experimental observations). To address multiple flow lines with the
plexer, pneumatic pressure was disconnected from individual control lines until the least
significant plexer line pair corresponded to the desired number of columns to be stacked.
For example, when the author stacked four columns in parallel, the control lines boxed in
blue in Fig. 5.6 (two plexer line pairs, four total control lines) were disconnected from
their respective pressure sources.

72
Figure 5.6. Column construction utilizing a fluidic multiplexer. Left: AutoCAD
drawing of the bead loading module. Red are 24 μm high, rectangular cross-section
control channels (SU8-2025); white are flow channels (12 μm high, semicircular cross
section molded from Spr 220-7); green are flow channels (AZ-50 photoresist, 40 μm
high, semicircular cross section) for cell loading, blue is the column construction area
(SU8-2010, 10 μm high, rectangular cross section). The bead/cell partition control
channel is closed when beads are stacked. Scale bars are 600 μm. Right: Optical
micrograph of 20 stacked affinity columns.
5.3.1.2 Cell trapping and lysis
The author’s scheme to trap and lyse cells also evolved from the first iteration of
the highly parallel cells-to-cDNA device. The first implementation employed sieve

73
valves present on a 10 μm high flow structure (Fig. 5.7). In this scheme, cells were flown
down a serpentine channel, open to atmosphere downstream of the sieve valve. The idea
here was that cells would be trapped in the opening(s) of the sieve valves in a serial
manner, with reactors closest to the “cell inlet” addressed first (see ch. 7 for microfluidic
channel resistance discussion). The only valves downstream of the cell trapping valve
were sieve valves for column construction, so flow was always open to atmosphere. This
implementation proved ineffective for trapping single cells. Cells were seen escaping
through the opening of the sieve valves, most likely due to a remodeling of their
respective actin cytoskeletons. Although escaped cells would eventually be caught on the
corresponding stacked bead column, and eventually lysed, lysis would no longer be
uniform throughout the device. Accordingly, the author changed the cell trapping
scheme to no longer include sieve valves. Instead, a 3 μm portion of SU8 molded flow
structure was placed where the 10 μm structure was in the previous iteration. The
remaining cell loading components remained the same. Again, cells were seen
remodeling their cytoskeletons to escape through the small openings.
Finally, the author decided to close the cell trapping module off from the
atmosphere (bead/cell partition control channel, Figs. 5.6, 5.7) and to partition simply a
cell suspension with valves. Although not all reactors will be addressed with single cells
in this scheme, a sufficient number (1 out of 3) should contain single cells, if the
suspension is diluted correctly. This scheme worked well in the author’s hands, and was
implemented in the most mature device discussed in this chapter. At first, lysis by
diffusion (Fig. 5.7B) was implemented because single cells were visualized to disappear
in a matter of seconds, when exposed to lysis buffer. However, this scheme was changed

74
to an active mixing protocol (Fig. 5.7C) after beads were visualized to stick in channels
when released to an outport. In order to achieve a working device with mixers, the author
needed to determine the optimal valve geometry for pumping valves as well as the
reaction and module partition valves. Although 200 μm X 200 μm is typically a
sufficient valve geometry for a 40 μm high flow channel, the surrounding valve geometry
precluded valves this size from actuating at workable pressures. To solve the valve
dimension problem, the author redrew the mixing ring portion of the cells-to-cDNA
device in AutoCAD, varying dimensions of the “cells in” valve (Fig. 5.8). The full cells-
to-cDNA process was simulated by filling the region of the test chip to the left of the cell
loading module (lysis buffer in) with food dye. Next, the author filled the “cells in”
portion of the chip with food dye, and closed the “cells in” valve array. Consideration
was paid to whether mixing occurred between modules and, if not, the minimum
actuation pressure of the valve array. After testing six geometries, it was determined 225
μm X 150 μm was the optimal valve dimension. Readers are directed to Ch. 2 for a
further discussion on lysis by diffusion and mixing, as well as ch. 7 for a solution to the
problem of addressing 100% of the reactors on-chip with single cells.

75
Figure 5.7. Cell trapping schemes. Purple channels are replica molded from 40 μm high
AZ-50, cyan channels signify 12 μm high channels molded from AZ-50, and the pink
channels represent 10 μm high channels cast from SU8 2010 photoresist. Scale bars are
600 μm. A. Cells enter a serpentine channel, where the right portions of the channels
open to atmosphere. B. Cells enter a serpentine channel, opened to atmosphere at the end
of the channel. Once the channel is filled with cell suspension, reactors are portioned off
by closing the valves marked with asterisks. Cells are then lysed by opening the
“buffer/cell partion” valve. C. Cells are partitioned the same way as (B), but are actively
lysed in a ring structure by executing a peristaltic pump sequence with the valves marked
1, 2, and 3.

76
Figure 5.8. Testing for optimal valve geometry in deep, parallel mixing rings.
AutoCAD drawing of the chip. Scale bar is 600 μm. Six devices of this size fit on a 3’’
silicon wafer. Purple lines represent 25 μm high control channels (SU8-2025), white
lines represent 12 μm high channels molded from Spr220-7 resist, and green line depicts
40 μm high flow channels cast from AZ-50. A total of six geometries were tested for the
valve array present on the AZ-50 channel (control width X flow width): 1) 200 μm X
100 μm, 2) 200 μm X 125 μm, 3) 200 μm X 150 μm, 4) 225 μm X 125 μm, 5) 225 μm
X 150 μm, 6) 225 μm X 175 μm. Inset: Geometries of the valves marked with asterisks
and the green flow channel were varied by the dimensions listed above.
5.3.1.3 Waste and collection outputs
The early iterations of the densely integrated cells-to-cDNA chip employed the
same output for both beads and waste. It was reasoned that further chip complexity was
not needed because when the beads were retrieved from the chip, a wash step could
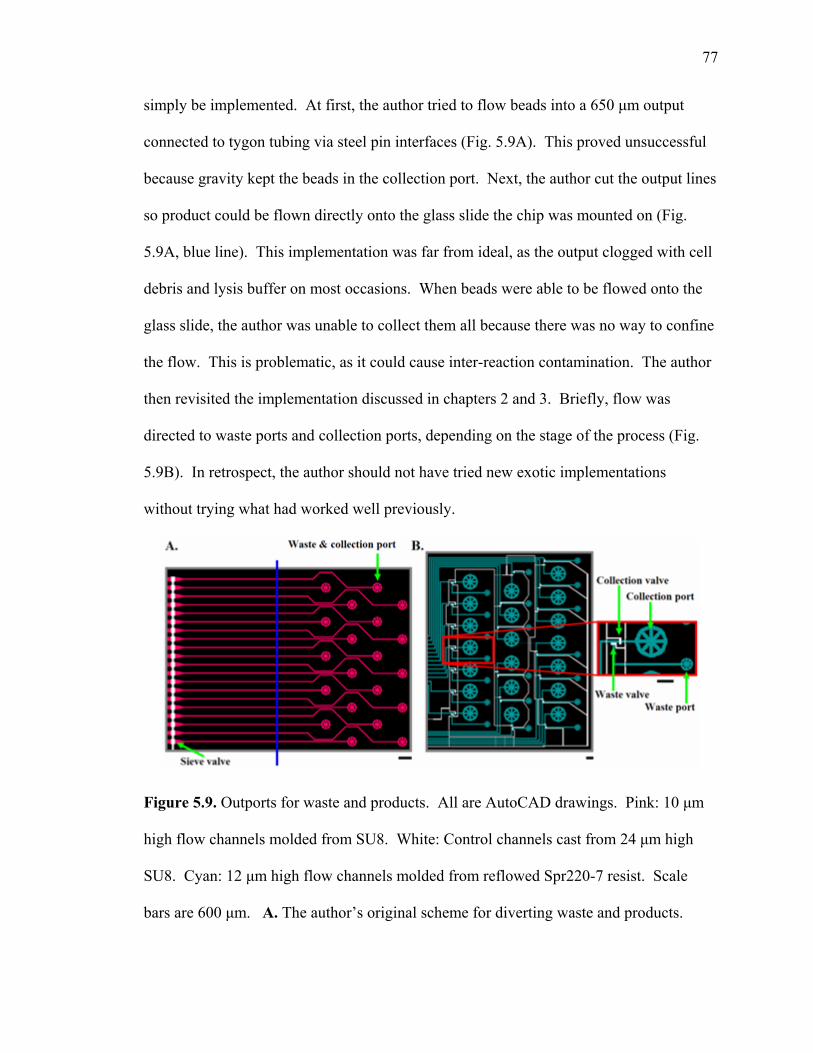
77
simply be implemented. At first, the author tried to flow beads into a 650 μm output
connected to tygon tubing via steel pin interfaces (Fig. 5.9A). This proved unsuccessful
because gravity kept the beads in the collection port. Next, the author cut the output lines
so product could be flown directly onto the glass slide the chip was mounted on (Fig.
5.9A, blue line). This implementation was far from ideal, as the output clogged with cell
debris and lysis buffer on most occasions. When beads were able to be flowed onto the
glass slide, the author was unable to collect them all because there was no way to confine
the flow. This is problematic, as it could cause inter-reaction contamination. The author
then revisited the implementation discussed in chapters 2 and 3. Briefly, flow was
directed to waste ports and collection ports, depending on the stage of the process (Fig.
5.9B). In retrospect, the author should not have tried new exotic implementations
without trying what had worked well previously.
Figure 5.9. Outports for waste and products. All are AutoCAD drawings. Pink: 10 μm
high flow channels molded from SU8. White: Control channels cast from 24 μm high
SU8. Cyan: 12 μm high flow channels molded from reflowed Spr220-7 resist. Scale
bars are 600 μm. A. The author’s original scheme for diverting waste and products.

78
Products and waste were delivered to outports either connected to tygon tubing though 23
gauge steel pins or onto a glass slide by cutting the channels where the blue line is in the
figure. B. The mature waste and product delivery scheme. Waste is diverted to a
separate outport by opening the waste valve and closing the collection valve. When
products are ready to be collected, the “waste valve” is closed and “collection valve" is
opened. Beads are then retrieved via pipetting with gel loading tips.
5.3.2 Negative master mold fabrication for mature devices
All photomasks defining device features are designed with AutoCAD software
(AutoDesk, Sausalito, CA), and printed at a resolution of 20,000 dots per inch on
transparency films (CAD/Art services). In all optical lithography processes, 3’’ silicon
wafers are utilized as substrates; and mold exposures are under UV light (365-405 nm) on
an MJB mask aligner (7 mW/cm2) for the indicated time.
Twenty-four-μm-high features present on control molds are fabricated with a
single lithographic step. SU8-2025 (Microchem) is spun on a wafer (3,000 rpm, 45 s.),
baked before exposure to evaporate excess solvent (2 min./5 min. at 65°C /95°C),
exposed under a negative mask for 75 s., baked after exposure (2 min./5 min. at
65°C/95°C) to facilitate additional resist polymerization, and developed in NanoSU8
developer (Microchem). Once features are developed, the mold is baked again for 40 s.
at 95°C to remove remaining solvent.
Three lithographic steps are undertaken for the flow molds. The first step is to
define column construction flow channels (10 μm high). For these channels, SU8-2010
(Microchem) is spun onto a wafer (3,000 rpm, 45 s.), baked before exposure to evaporate

79
excess solvent (1 min./3 min. at 65°C/95°C), exposed under a negative mask for 45 s.,
baked after exposure (1 min./3 min. at 65°C/95°C), and developed in NanoSU8 developer
(Microchem). Upon visualization of developed features, the mold is subjected to a 90
min. hard baked at 150°C. When the mold cooled to room temperature, the second step
defining 12-μm-high features (output, bead and buffer delivery channels) is carried out.
First, to promote resist adhesion, the mold is exposed to HMDS vapor for 2 min.
Twelve-μm-high features are defined with Spr220-7 (Shipley). The resist is spun onto
the mold (1,500 rpm, 60 s.), soft baked (90 s. at 105°C), aligned to the first layer (column
construction flow lines), exposed under a positive mask for 3 min., and developed in
100% MF-319 developer (Microchem). The features are then annealed/hard baked for 3
hr. 200°C to facilitate channel rounding, necessary for valve closure, and also to
chemically modify the resist. If the resist does not exhibit a chemical change (color turns
from red to black), features will wash away during the third developing step. For the
third step of the flow mold fabrication process, AZ-50 (Clariant) is spun onto the mold
(1,600 rpm, 60 s.), after a two minute HMDS exposure. The mold is then soft baked (2
min./5 min. at 65°C/115°C), aligned to the second layer, exposed under a positive mask
for 4 min., and developed in 25% 2401 developer (Microchem, diluted with 18 mΩ dI
H2O). Once features were developed, the mold was annealed/hard baked for 3 hr. 200°C
for the aforementioned reasons. Additionally, if the AZ-50 resist does not undergo a
chemical change (color turns from red to black), the features will crack when subjected to
subsequent soft lithography baking steps.

80
5.3.3 Device fabrication process
All devices are fabricated by multilayer soft lithography (MSL)19 with the silicone
elastomer polydimethylsiloxane (PDMS, General Electric). Each device employs push-
up valve geometry68 and is a three layer elastomeric structure bonded to an RCA-cleaned
microscope slide. Negative master molds are first exposed to chlortrimethylsilane
(TMCS, Aldrich) vapor for 2 min. to promote elastomer release from molds after baking
steps. Thirty g of liquid PDMS (5 parts A:1 part B) is poured onto the flow master,
degassed under vacuum, and baked for 45 min. at 80°C. Liquid PDMS (20 parts A:1
part B) is spun onto the control master mold (1,800 rpm for 60 s.) and allowed to settle
for 30 min. in order to obtain a uniform elastomer membrane on top of the control
features. The mold is then baked for 30 min. at 80°C. Upon completion of the baking
steps, the partially cured flow layer is peeled from its mold and 650 μm diameter flow
channel access holes punched (Technical Innovations, part# CR0350255N20R4). The
layer is then aligned to the partially cured control layer, still on the control master. The
two layer structure is then baked for 45 min. The third layer, a featureless elastomeric
membrane, is fabricated by spinning liquid PDMS (20 parts A:1 part B) onto a clean
silicon wafer (1,600 rpm for 60 s.) followed by baking for 30 min. at 80°C. Once baking
is complete, the two layer structure is peeled from the control master, control channel
access holes punched (Technical Innovations, part# CR0350255N20R4) and mounted
onto the third partially cured PDMS layer. The three layer structure is then baked for 3
hr. at 80°C. The assembled three layer structure is then peeled from the clean silicon
wafer, output holes punched (Technical Innovations, part# CR0830655N14R4), cut to
size and bonded to an RCA-cleaned microscope slide and baked overnight at 80°C.

81
5.3.4 General device operation
The on-off valves within each device are controlled by individual pressure
sources (Fluidigm) and are interfaced via 23 gauge pins (New England Small Tube) and
tygon tubing (VWR). We utilized an NI-DAQ card through a Labview interface
(National Instruments) to actuate the pressure sources.
5.3.5 20X and 50X cells-to-cDNA device process flow
An AutoCAD drawing of a 20X device is given in Fig. 5.10. The 50X device is a
scaled up version of the 20X device, with the same control and flow channels. However,
two additional multiplexer control channels are necessary for the 50X chip because of the
additional reactors (Fig. 5.10, 5.11). Lysis buffer is loaded into the white flow channels
through inlet 2 (Fig. 5.10) until it reaches the waste outlets, so as to leave no air bubbles.
Beads are then loaded into inlet 3 and columns are built serially by addressing flow lines
individually with the multiplexer control channels, while keeping the sieve valve (valve
present on blue flow channels) actuated. Once columns are built, excess beads still
present in the flow channels are pushed with lysis buffer (inlet 2) to the constructed
columns. Cell suspension is then loaded into inlet 1 (Fig. 5.10), and once the suspension
flows to its outlet, the reactors are closed off by actuating the control channel marked
with an asterisk. Cells are contained in the green portion of the mixing ring by keeping
the vertical control channels to the east and west of the cell capture module closed. Lysis
buffer is then loaded into the remaining portion of the device through inlet 4. Cells are
then lysed chemically by mixing cells with lysis buffer in the ~10 nL ring. Mixing

82
occurs by executing a peristaltic pump sequence21, 23 with control channels a, b, and c
(Fig. 5.10). Cell lysates are then pushed via pneumatic pressure over the affinity
columns, followed by washing of the columns with first strand synthesis buffer, dNTPs,
and reverse transcriptase. Once the reverse transcriptase reaction fills the flow channels,
first strand synthesis is then carried out by heating the device to 40°C on a thermal
microscope stage with the beads utilized both as primers (oligo(dT)25 sequences) and a
solid phase support. The reaction mixture is flowed over the columns for 45 min. at a
flow rate of ~20 μm/s. Upon completion of the reaction, the waste valves are closed,
collection valves opened, and beads sent to output by opening the sieve valves and
flowing columns off the device in a serial manner in PCR buffer, by using the fluid
multiplexer to address reactors individually. Beads are collected by pipetting and stored
at -20°C in qPCR buffer for future analysis.

83
Figure 5.10. 20X cells-to-cDNA device. Control channels are in red, 10 μm high flow
channel with rectangular cross section utilized for column construction is shown in blue,
12 μm high flow channels are shown in white, and the 40 μm high flow channel is shown
in green. A chip capable of performing 50 reactions in parallel is fabricated with the
same flow and control channel layouts.
Figure 5.11. 50X cells-to-cDNA device filled with food dye. All flow channels are
filled with yellow food dye, multiplexer control channels are filled with red dye, waste
and collection control channels are in blue. Inset 1: Cell lysis module. Cells are
portioned in the flow channels filled with blue dye. The pump valves are in green. Inset
2: Buffer inputs. The vertical valve in the picture is kept closed while loading buffer, to

84
compensate for any negative pressure in the channels caused by valves displacing
volume. The back pressure compensation is needed to prevent contamination between
reactors. Inset 3: Bead and lysis buffer inputs. Beads enter through one of the inlets and
lysis buffer pushes residual beads present in channels to the sieve valves through the
other inlet. Inset 4: Optical micrograph of one NIH/3T3 cell captured (corresponds to
blue dye in inset 1). Inset 5: Multiplexer control channels and sieve valve channel.
Inset 6: Six stacked bead columns. Inset 7: Output (1) and waste (2) valves, as well as
a portion of the collection port.
5.3.6 Device calibration and efficiency measurements
In order to achieve absolute copy number determination from samples processed
microfluidically, the author needed to calibrate and quantify the efficiency of each step
along the microfluidic cells-to-cDNA process. The first step was to determine benchtop
reverse transcriptase (RT) efficiency (results in ch. 4). Briefly, the author generated
standard curves by benchtop qPCR or RT-pPCR, utilizing either Dap mRNA or Dap
cDNA69 as the template. The qPCR standard curve generated with the cDNA standards
was then utilized to extrapolate measured copy number values for the mRNA samples.
This was accomplished by plotting the Ct values obtained from the RT-qPCR standard
curves onto the cDNA standard curve. Upon doing so, an average RT efficiency of 77%
was achieved.
The author then quantified the microfluidic mRNA isolation step of the cells-to-
cDNA process with a synthetic mRNA standard (Affymetrix). Although four synthetic
mRNAs are present in the standard, only one (Dap) was probed for. The synthetic

85
mRNA was partitioned on-chip, mixed with lysis buffer, and run over affinity columns,
either 50 in parallel (Fig. 5.12A red) or 20 (Fig. 5.12A black). Collection of the mRNA
standards took place by releasing bead columns serially to output ports. It took an
average of 3 min. per bead column for collection. Times varied because in some
instances beads would stick in channels or disperse in the outport to a greater extent than
other columns. Bead sticking is fixed by increasing the pressure applied to the column
upon release. When plotting Ct values from the isolated microfluidic templates onto a
Dap cDNA standard curve, a 40% efficiency is measured (Fig. 5.12B). Although the
standard curve in Fig. 5.12A has an R value of -0.99, there was high variability (c.v.
values of 3.58 and 3.37, Table 5.3) in efficiency values for the microfluidically isolated
templates. The high disparity could be caused by 1) ambient RNases present during
collection and the aforementioned variability in collection times; or 2) different
interaction times of mRNAs with their respective affinity column. The author does not
think it is the latter causing variability because columns are built with excess capacitance
(200,000 oligo(dT)25 sequences per bead); and lysates are pushed over the columns at a
sufficiently slow velocity to allow for full interaction with the column. Similarly, there
was no attempt to determine if time for collection was correlated to the variability
observed. Instead, the author subjected identical concentrations of Dap mRNA to the
additional microfluidic reverse transcription step, followed by the construction of another
highly reliable standard curve (R = -0.99, Fig. 5.12C). The inclusion of the additional
step decreased the C.V. values over six fold (Table 5.3). However, the variation
observed is still greater than what was seen for samples processed in earlier studies (ch.
3). Next generations of devices will surely implement a binary tree architecture for lysis

86
buffer loading to assure equal path lengths (ch. 7). This implementation should solve the
unequal sample interaction times with the affinity columns.
Microfluidic Process Efficiency Grid
Table 5.3. Microfluidic process efficiency grid. Ct values subjected to the processes
listed in the columns two-five were plotted onto the standard curves listed in the rows of
the first column. First number lists the mean efficiency and second number is the
corresponding coefficient of variation for all templates tested.
When employing the additional on-chip step, an absolute process efficiency of
18% is obtained. The microfluidic reverse transcription step is 25% as efficient as
benchtop RT (Table 5.3). Competing the Dap samples on-chip with 1 pg NIH/3T3
mRNA serves to decrease the absolute process efficiency to 12% from 18% (Fig. 5.11D,
blue, Table 5.3, 5.4). On-chip mRNA isolation and first strand synthesis competition
effects can be measured by plotting the Ct values obtained from Dap mRNAs loaded on-
chip together with NIH/3T3 mRNA, onto the standard curve generated with uncompeted
mean, coefficient of variation
Dap cDNA
Dap mRNA → RT-qPCR
Dap → μF mRNA
isolation → RT-qPCR
Dap → μF mRNA
isolation → μF RT→ qPCR
Dap + 1 pg NIH/3T3 mRNA → μF mRNA
isolation → μF RT→ qPCR
Dap cDNA 1,0 0.77 0.4, 3.58 0.18, 0.55 0.12, 0.91 Dap mRNA → RT-
qPCR X 1,0 0.54, 3.37 0.25, 0.55 0.15, 0.48 Dap → μF mRNA
isolation → RT-qPCR X X 1,0 0.66, 0.57 0.37, 0.47 Dap → μF mRNA
isolation → μF RT→ qPCR X X X 1,0 0.68, 0.49
Dap + 1 pg NIH/3T3 mRNA → μF mRNA
isolation → μF RT→ qPCR X X X X 1,0

87
Dap mRNA (Table 5.4). Upon doing so, a 32% loss in efficiency is calculated. An
average c.v. of 0.91 was obtained for all mRNA samples (Fig. 5.12, Dap + NIH/3T3
mRNA) isolated and synthesized on-chip to cDNA (Table 5.3). When narrowing the
range of templates to the expected range seen for the genes of interest (ch. 4) in single
cells, a c.v. of 0.22 is obtained (Table 5.5). These numbers will serve as a baseline for
determining if gene expression noise is exhibited in single NIH/3T3 cells.
Table 5.4. Process efficiencies for individual Dap templates spiked with 1 pg NIH/3T3
mRNA. Efficiency is based on the standard curve generated with Dap cDNA templates.
Table 5.5. Reverse transcription competition effects. The Ct values obtained from Dap
+ NIH/3T3 standards were plotted on the standard curve generated with Dap templates
subjected to no competition.
Assessing Template Competition: Comparison of the two (Dap, Dap + NIH/3T3) microfluidic cDNA synthesis std.
curves
10 copies
100 copies
1k copies 10k copies
100, 1k 1k, 10k
100, 1k, 10k all
avg eff 0.99 0.45 0.74 0.63 0.61 0.61 0.61 0.67 variance 0.36 0.03 0.017 0.018 0.043 0.035 0.035 0.11 std dev 0.6 0.17 0.13 0.14 0.21 0.19 0.19 0.33 coeff var 0.6 0.38 0.18 0.22 0.34 0.31 0.31 0.49
Dap + 1 pg NIH/3t3 mRNA compared to qPCR std. curve
10
copies 100 copies
1k copies
10k copies 100, 1k 1k, 10k
100, 1k, 10k all
avg eff 0.14 0.067 0.15 0.1 0.11 0.13 0.11 0.12 variance 0.0079 0.0007 0.027 0.0005 0.017 0.015 0.012 0.011std dev 0.089 0.026 0.17 0.023 0.12 0.12 0.11 0.11 coeff var 0.62 0.39 1.08 0.22 1.14 0.95 0.98 0.91

88
Figure 5.12. 20X and 50X cells-to-cDNA device and process calibrations. A. RT-qPCR
standard curve (Y = 3.46(X)+40.64, R = -0.99) generated with Dap mRNA standards
subjected to the microfluidic mRNA isolation → recovery process, either with 50X (red)
or 20X (black) devices. Curve is fitted to the data from both devices. B. Microfluidic
mRNA isolation → recovery efficiency measurements based on a qPCR standard curve
(Y = -3.50(X) + 38.82, R = -0.99, Fig. 4.4). Average efficiency was 40%. C. qPCR
standard curves generated with Dap mRNA standards subjected to the microfluidic
mRNA isolation → first strand synthesis → recovery process. All standards were run

89
through 20X devices. The black curve (Y =-3.57(X) +41.84, R = -0.99) is fitted to Dap
standards while the blue curve (Y = -3.58(X) +42.58, R = -0.99)
is fitted to Dap + 1 pg NIH/3T3 mRNA standards.
Figure 5.13. Efficiency distribution for the dap + 1pg NIH/3T3 mRNA templates. A.
Black is normal fit and red is lognormal fit of the data. B. Data from (A) was ln
transformed and fitted to a normal distribution.
In order to quantify cell lysis, specifically RNase activity during lysis, the author
spiked cell suspensions off-chip with defined concentrations of the bacterial mRNA
standard, loaded the suspension on-chip and subjected it to the 20X cells-to-cDNA
process. Results to this study were inconclusive. Regardless of starting concentration
samples were amplified the same extent, and at the same Cts as samples with no cells
(Fig. 5.14, PBS + Dap mRNA in microfluidic reactor). These results can be explained by
the RNase activity prevalent in PBS when not DEPC treated. Because the bacterial
mRNAs are mixed directly with PBS, the mRNAs are not protected from buffer based
RNases, unlike mRNAs inside a cell. The next set of experiments can either utilize
DEPC treated PBS or design a chip-based scheme to carry out mixing of cell suspension,
A. B.

90
Dap mRNAs and lysis buffer. On-chip mixing will protect the Dap mRNA from RNases
because RNase inhibitor and denaturant is present in the lysis buffer.
Figure 5.14. Amplifcation plots from Dap mRNA/single cell spike experiments. Red:
Off-chip negative controls. Black: PBS + 10,000 copies Dap/microfluidic reactor.
Magenta: Single cell + 10,000 Dap/microfluidic reactor.
Negative control experiments
The author verified qPCR signals obtained from on-chip calibrations and single
cell measurements were real, and not a product of contamination, by performing negative
control experiments. In order to rule out the possibility of the cell suspensions or chips
being contaminated with nucleic acids, PBS from the suspensions was subjected to the
microfluidic cells-to-cDNA process in parallel with reactors containing NIH/3T3 cells.
qPCR was then run on positive and negative templates harvested from chips, and Ct
values compared (Fig. 5.14A-C). As the figure illustrates, Ct values for no-template
reactions are consistently higher than for single cell samples. Furthermore, the Ct values
obtained for the no-template samples are consistent with values obtained for qPCRs with
H2O as template (Fig. 4.7). The plots shown in the figure are indicative of typical results

91
obtained from single cell and no-template samples harvested from 50X chips, after
subjection to the microfluidic cells-to-cDNA process. The author then verified the
calibrations presented earlier in the chapter by confirming Dap signal was produced from
samples loaded on-chip, and not by some artifact or contamination. The cells-to-cDNA
process without the reverse transcriptase enzyme was carried out on highly concentrated
Dap mRNA templates (100,000 copies/reactor). Samples were then harvested and
subjected to qPCR (Fig. 5.14D). No amplification was observed for any of the
microfluidic samples, confirming the earlier calibration and efficiency values. Similar
experiments were carried out on cells and NIH/3T3 mRNA, with the consistent results
obtained (Fig. 2.8).

92
Figure 5.15. Amplification plots from negative control experiments. A.-C. Triplex
qPCR was carried out on either single NIH/3T3 cell samples (black) or PBS from cell
suspensions (red). A. β-actin (Hex) B. PGK (Cy5) C. GAPDH (Fam) D. Amplification
plots for Dap samples subjected to the microfluidic cells-to-cDNA process sans reverse
transcriptase.
5.3.7 Reagent preparation
NIH/3T3 preparation
NIH/3T3 cells were grown to ~70% confluency in Dulbecco’s modified Eagle
medium (DMEM)/10% calf serum (CS, Hyclone) in 12.5 cm2 vacuum-gas plasma treated
polystyrene culture flasks (BD Falcon). Cells were then washed in 1X PBS, trypsinized,
and further diluted in culture medium to stop the trypsinization reaction. After counting
the cells, the cell suspension was washed in 1X PBS and pelleted 1 X 10⁴ cells per 15 mL
conical tube(s) (1800 rpm, 5 min). Each pellet was resuspended in one mL DMEM/10%
CS followed by the addition of two μL DyeCycle green (Invitrogen) to each suspension.
The suspension(s) was then incubated for 30 min. in 37°C/10% CO2 incubator.
qPCRs
All qPCRs were carried out on a BioRAD icycler instrument utilizing either
Taqman probe or sybr green chemistry. The latter was employed to verify the absence of
primer-dimers and to generate products for standard curve construction. The cycling
protocols below were modified to include an additional one min. extension step at 72°C,
where detection was also enabled, for sybr green qPCRs.

93
An 86 bp portion from the synthetic bacterial mRNA Dap (Affymetrix, accession
# L38424) was amplified with the following protocol and oligonucleotides: 95°C for 15
min. and 50 cycles of 94°C for 15 s., 57°C for 1 min. Detection was enabled during the
57°C step. Reverse transcription was carried out first, either on-chip for 1 hr. at 37°C or
30 min. at 50°C as the initial PCR step. The following oligonucleotides were utilized:
Probe: 5’-Fam-TGT GAT GTG TAT TCC ATT CCG CTC GCC A -BHQ_2-3’
Sense primer: 5’-ACC GGA TGT CTC GGC ATT AAT C-3’
Antisense primer: 5’-GCA CAA GAA TTT CCG CAG TAC C-3’
PCRs on the mouse genes β-actin (accession # NM_007393, 99 bp),
phosphoglycerate kinase (PGK, accession # M15668, 139 bp) and glyceraldehyde 3-
phosphate dehydrogenase (GAPDH, accession # NM_001001303, 124 bp) were carried
out with the following protocol: 95°C for 15 min. and 50 cycles of 94°C for 15 s., 60°C
for 1 min. Detection was enabled during the 60°C step. A modified protocol was
implemented when detecting the three genes in the same reaction (above is for one gene
detection): 95°C for 15 min. and 50 cycles of 94°C for 45 s., 60°C for 90 s. Detection
was enabled during the 60°C step. The following oligonucleotides were employed:
β-actin:
Probe: 5’-Hex- CCA TCC TGC GTC TGG ACC TGG CTG GC -BHQ_1-3’
Sense primer: 5’- CCA TCT ACG AGG GCT ATG CTC TCC -3’
Antisense primer: 5’- CAC GCT CGG TCA GGA TCT TCA TG -3’

94
PGK:
Probe: 5’-Cy5- ACC ACA GTC CAA GCC CAT CCA GCC AGC A -BHQ_2-3’
Sense primer: 5’- ACC TTG CCT GTT GAC TTT GTC ACT G -3’
Antisense primer: 5’- CCT CGG CAT ATT TCT TGC TGC TCT C -3’
GAPDH:
Probe: 5’-Fam- CGT GCC GCC TGG AGA AAC CTG CCA AGT –BHQ_2-3’
Sense primer: 5’- CCA ATG TGT CCG TCG TGG ATC TG -3’
Antisense primer: 5’- TCC TCA GTG TAG CCC AAG ATG CC -3’
Products from a sybr green PCR were purified, and utilized to generate standard
curves for all three genes (Fig. 5.15). These curves are utilized to determine copy
numbers of the respective genes in single NIH/3T3 cells. In addition, melting curve
analysis was carried out in order to determine how many products are generated with the
above primers (Fig. 5.15C). This is necessary because quantification by spectroscopy is
only effective if one product is present in the sample. The author employed triplex qPCR
(combined three purified samples in one tube) with the PCR purified standards, so as to
simulate the single qPCRs discussed in this chapter.

95
Figure 5.16. Triplex qPCR standard curve construction. Black: GAPDH, red: β-actin,
blue: PGK A. Amplification plots from simplex sybr green qPCRs. B. Products from
(A) were purified, quantified by spectrophotometry, and utilized as templates for triplex
qPCR. GAPDH: Y = -3.65(X) + 39.13, R = -0.99; β-actin: Y = -3.63(X) + 39.23, R = -
0.99; PGK: Y = -3.63(X) + 39.39, R = -0.99. C. Melting curve analysis of products
generated in (A). Distinct primer sets yielded distinct products.
96
Chapter 6:
Parallel Picoliter RT-PCR Assays Using
Microfluidics

97

98
Figure 1. RT-PCR device. Left: Photograph of the device loaded with food dye. Guard channels, which supply water vapor to the porous PDMS, are filled with yellow dye, flow channels are filled with orange dye, and the two control channels are filled with blue (horizontal control channel) and green dye (vertical reaction partition control channel). Right: Optical micrographs of eight reaction chambers (upper) and one reaction chamber (lower).

99

100
Supporting Information for Parallel picoliter RT-PCR assays using microfluidics
Joshua S. Marcus
1,2, W. French Anderson
2,3, and Stephen R. Quake
2,4,5
1Option in Biochemistry and Molecular Biophysics, 2Department of Applied Physics,
California Institute of Technology, MS 128-95, Pasadena, CA 91125. 3Gene Therapy
Laboratories, Keck School of Medicine, University of Southern California, Los Angeles, CA 90033 4: To whom correspondence should be addressed. Email: [email protected] 5: Current address: Bioengineering Dept., Stanford University, Clark Center, E300, Stanford, CA 94305 Table of Contents Item Description Page# Figure S-1 Benchtop real-time RT-PCR results S-2 Figure S-1 legend Legend for figure S-1 S-2

101
Figure S-1 a.
b. Supporting Figure 1: a. Benchtop RT-qPCR standard curve utilizing serially diluted human male total RNA as template. We were able to detect the 0.5 pg template in only one of five reactions. b. Fluorescence traces of RT-PCR control reactions. Red curves are no-template reactions. All other curves are no RT reactions with serially diluted human male total RNA templates. Templates range from 0.05 pg total RNA (gray) to 500 pg total RNA (black). Only reactions with 500 pg total RNA and 50 pg total RNA (magenta) templates amplified. All other templates (5 pg total RNA, green; 0.5 pg total RNA, blue) did not amplify. We can estimate the percent of gDNA contamination by plotting the Ct values of the no RT reactions onto the off-chip standard curve shown in a. When this is done, gDNA contamination is estimated to be 0.3% of total RNA template.

102
Chapter 7: Advances in Microfluidic chip fabrication and operation
The development of multilayer soft lithography (MSL) by Quake and coworkers19
has laid the foundation for complex fluid manipulation on the nanoliter scale. This
chapter describes the technique of MSL in detail and further discusses the author’s
contributions to MSL fabrication and device operation.
7.1 Multilayer soft lithography background
MSL,19 which builds upon the replica molding technique of soft lithography,70
enables the construction of true sealing valves on-chip. Silicone rubbers have become the
material of choice for MSL fabrication because of their optical properties,
biocompatibility, and low Young’s modulus. In general, fabrication with silicone
rubbers, for example General Electric RTV 615, proceeds by mixing two parts of liquid
elastomer, which then will cure into a flexible solid in the presence of heat and a
platinum catalyst. Part A consists of polydimethylsiloxane polymers functionalized with
vinyl groups, and part B is rich in silicon hydride groups. When mixed at a
stoichiometric ratio (10A:1B), the addition reaction of the vinyl groups to the silicone
hydride groups forms covalent bonds with no excess functional groups. However, if the
two parts are mixed off-ratio, excess groups in separate layers will be available for
covalent bonds between layers, creating a multilayer monolithic device (Fig 7.1).

103
Figure 7.1. MSL bonding process. Silicone hydride groups are covalently cross-linked
to vinyl groups by addition reaction. Excess of one functional group enables multi-layer
bonding and monolithic device fabrication.
Figure 7.2 depicts the process for creating a microfluidic chip by MSL.
Photomasks are drawn with AutoCAD (Autodesk) and printed on transparency film at a
resolution of 20,000 dpi (CAD/Art Services). The two-dimensional masks for the control
and flow layers are then used to define three-dimensional features by standard optical
lithography. The negative molds are subsequently used as casts for the liquid elastomer,
polydimethylsiloxane (PDMS). The top layer is cast thick (flow), rich in vinyl groups
and platinum catalyst while the bottom layer (control), rich in silicon hydride groups, is
cast thin by spincoating. The elastomer is then baked and partially cured on the molds,
after mold treatment with trimethylchlorosilane, to facilitate elastomer release. The thick
layer is peeled off its mold, and flow channel access holes punched and aligned to the
thin layer. Interlayer covalent bonding is then facilitated by baking the aligned layers at
Si-H
Si-H
Si-H H-Si Si-H
Si-H
Si-H H-Si H-Si
H-Si
H-Si
Si-H H-Si
Si-H
Si-H H-Si Si-H
Si-H
H-Si
H-Si
Si-H H-Si
Cured “A”-rich elastomer structure
Cured “B”-rich elastomer structure
+ ΔH
Monolithic, Multilayer Elastomer Structure:
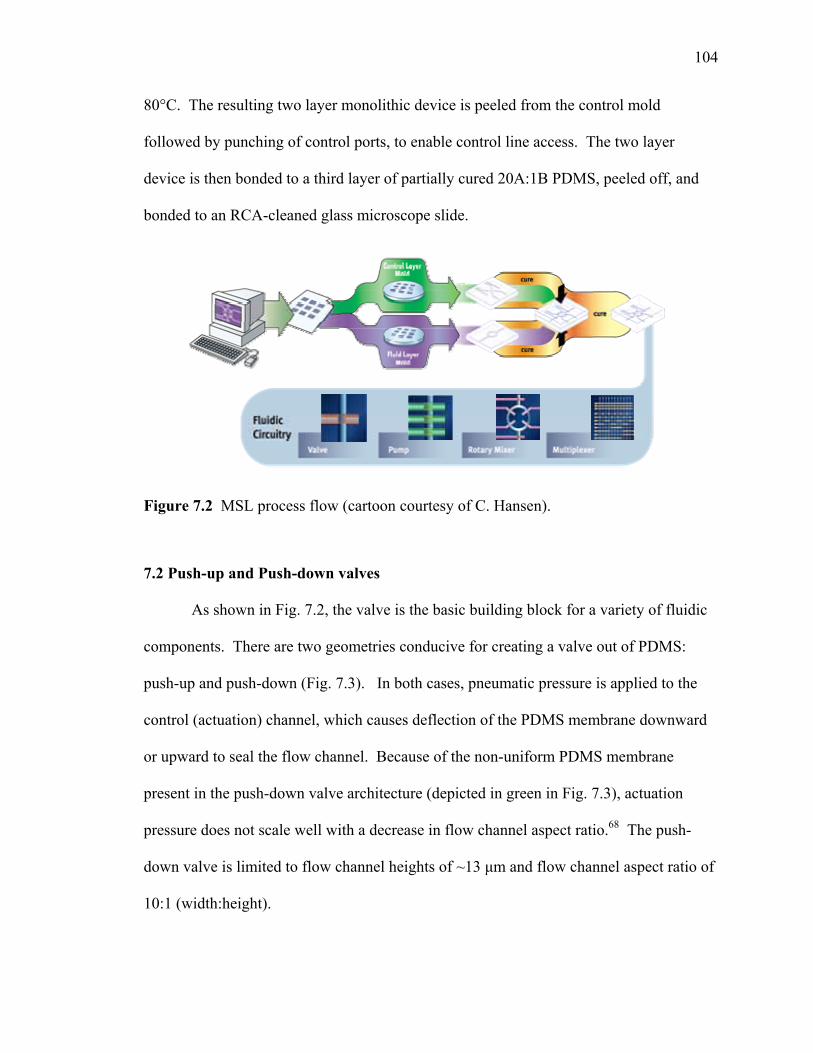
104
80°C. The resulting two layer monolithic device is peeled from the control mold
followed by punching of control ports, to enable control line access. The two layer
device is then bonded to a third layer of partially cured 20A:1B PDMS, peeled off, and
bonded to an RCA-cleaned glass microscope slide.
Figure 7.2 MSL process flow (cartoon courtesy of C. Hansen).
7.2 Push-up and Push-down valves
As shown in Fig. 7.2, the valve is the basic building block for a variety of fluidic
components. There are two geometries conducive for creating a valve out of PDMS:
push-up and push-down (Fig. 7.3). In both cases, pneumatic pressure is applied to the
control (actuation) channel, which causes deflection of the PDMS membrane downward
or upward to seal the flow channel. Because of the non-uniform PDMS membrane
present in the push-down valve architecture (depicted in green in Fig. 7.3), actuation
pressure does not scale well with a decrease in flow channel aspect ratio.68 The push-
down valve is limited to flow channel heights of ~13 μm and flow channel aspect ratio of
10:1 (width:height).

105
Actuation channel
Flow channel
Glass slide
Actuation channel
Flow channel
Glass slide
Figure 7.3. Cross sectional cartoon view of push-up (left) and push-down (right) valve
geometries. The blue layer above glass slide is a thin layer of PDMS. Figure is not
drawn to scale.
In order to manipulate eukaryotic cells on-chip, which have diameters ranging
from 10-35 μm, higher flow structures, and as a result lower aspect ratios for flow
channels, are needed. Accordingly, Vincent Studer along with others68 developed the
push-up valve. The uniformly thin membrane allows for the actuation pressure to scale
well with aspect ratio (Fig. 7.4). Furthermore, actuation pressure of a push-up valve
scales with membrane thickness (Fig. 7.4), and as expected, devices with thinner
membranes actuate at lower pressures.
Figure 7.4. Scaling properties of a push-up valve. Left: Actuation pressure is
symmetrical with channel width. PDMS membrane is ~5μm. Right: Actuation pressure

106
as a function of membrane thickness for a 300 μm X 300 μm valve. The flow channel is
56 μm high. Closed circles are measured values and open circles are simulations.68
A comparison of the resistance across a flow channel provided by the two valve
geometries demonstrates the push-up valve closes at an order of magnitude lower
pressure than its push-down counterpart (Fig. 7.5). For these measurements, identical
valve parameters of 300 μm X 200 μm, 46 μm high flow channel, 10 μm membrane were
utilized. The measurements were taken by first measuring the interface of two fluid
stream positions as a function of input pressure of one of the streams. The interface was
then tuned to the middle of the channel and pressure was applied to a valve located close
to one of the inputs. The change in the position of the interface was then plotted against
the pressure in the valve. Finally, normalized resistance (percentage of input pressure)
was extrapolated and plotted as a function of actuation channel pressure.68 The results
are shown in Fig. 7.5.
Figure 7.5. Plot of the normalized resistance provided by a push-up (purple, pink) and
push-down (blue, yellow) valve as a function of actuation channel pressure. The first
color listed is for increasing actuation channel pressures and the second color listed is for
decreasing pressures. The push-up valve shows a hysteresis due to membrane sticking to
the top of the flow channel.68

107
7.3 Optical lithography considerations
A key consideration in microfluidic chip design is the minimization of dead
volume. Consequently, valve dimensions should be as small as possible in areas of the
device that are not crucial for process functionality. For example, when building
microfluidic affinity columns for the mRNA isolation devices presented in chapter 5, one
would ideally want to utilize 100 μm X 100 μm valves (or smaller) for the bead
multiplexer valves. If the multiplexer implements 200 μm X 200 μm valves, as would be
the case if channels were cast out of AZ-50, cell lysates would have to be pushed
pneumatically an additional 1.5 mm for the 20X device and 2 mm for the 50X device.
The additional length would increase the possibility of lysate sticking to channels and
therefore loss of material before affinity purification. Furthermore, in the case of the 50X
device, the larger valves would result in a larger device, making the possibility of fitting
it on a 3” silicon wafer unlikely. Because manipulating cells on-chip requires channels
with heights on the order of 40 μm, a three layer lithography process (Su8 2010, Spr220-
7, AZ-50) had to be implemented to achieve an optimal device.
Two level molds that incorporate SU8 as the shorter feature are straightforward to
implement and were utilized for the devices presented in chapters 2 and 3. Because of
the considerations presented in the above paragraph, three layer molds had to be
fabricated for the denser (20X and 50X) mRNA isolation/cDNA synthesis devices. The
incorporation of a third layer on top of a positive resist, in this case Spr220-7, turns out to
be a non-trivial problem. 2401 developer (AZ-50 developer) dissolves Spr220-7 features
after a basic reflow protocol (20 min. @ 125°C; Fig. 7.6), so the reflow protocol had to

108
A. B.
C.
be changed to include a hard bake step at a higher temperature. Others in the lab had
experienced similar problems when processing tall SU8 features on a mold with
processed positive resist (personal communication with Carl Hansen). Hansen found
hard baking temperatures above 180°C for 1 hour resulted in a permanent chemical
change to the 5740 photoresist. Investigation of hard baking protocols for the Spr220-7
resist yielded a similar result. A combined reflow/hard bake step of 200°C for 2 to 3
hours resulted in the Spr resist changing color from red to black (Fig. 7.6). The time
varies from mold to mold because the hot plates do not have 100% level surface, so
amount of contact varies depending on where molds are placed on the respective hot
plate. After the chemical change, the Spr film is resistant to solvents such as acetone and
2401 developer (AZ-50 developer).
Figure 7.6. Comparison of Spr220-7/AZ-50 films that have been subjected to different
hard bake protocols. AZ-50 features are boxed in white. The remaining features are
Spr220-7. Spr220-7 features were processed first, followed by a hard bake and
subsequent AZ-50 processing and final AZ-50 hard bake. Scale bars are 100 μm. A.

109
Spr220-7 and AZ-50 were not hard baked to the point of a chemical change (features are
red). B. Spr220-7 and AZ-50 were hard baked until films changed color. C. Spr220-7
channels after reflow process in (A) and exposure to AZ-50 developer.
7.4 Sieve valves for robust separation assays
The sieve valve, or digital filter, discussed primarily in chapter 3, provides an
elegant solution for on-chip separation assays. The sieve valve is aligned to a flow
structure with rectangular cross section, allowing for fluid flow through the valve, but not
for micron size particles to pass. Because full closing valves need to be aligned to
rounded flow structures, multilayer molds are needed to implement microfluidic
separation assays. Separation assays can be run successfully when a range of pressures is
applied to the sieve valve, because of its digital nature. This is in direct contrast to a prior
solution,24 where the valve used to construct an affinity column was analog and pressure
needed to be finely tuned. SU8 films, because of their mechanical properties, inability to
be re-flown at high temperatures, and wide range of heights (3 μm-200 μm) are the resist
of choice when implementing digital filters. Sieve valve height and width is tuned
according to the particle size that needs to be captured. For example, 3 μm beads are
trapped sufficiently (~20 psi applied to filter) when utilizing a 200 μm X 200 μm valve
present on a rectangular 10 μm high channel. Applications of the digital filter include
chromatography columns to cell capture.

110
Figure 7.7. Optical micrograph of the chromatography portion of the cells-to-cDNA
device presented in chapter 2. Sieve valve is shown in blue. Inset: 3 μm beads
derivatized with oligo(dT)25 sequences are stacked against the sieve valve for mRNA
affinity capture. Scale bars are 100 μm.
7.5 Rapid parallel mixing
As discussed in chapter 2, lysing a cell by free interface diffusion25 poses
problems for bead recovery after mRNA affinity capture/first strand cDNA synthesis (Fig
2.1). Although all mixing in microfluidic devices of the length scales presented in this
thesis is ultimately accomplished by diffusion, because flow is laminar; accelerated
mixing can be achieved by actively decreasing diffusion lengths. Pumping cells and lysis
buffer in a ring-shaped channel allows for the repeated folding of fluids onto themselves,
thereby allowing for full homogenization of the ring contents and therefore complete
lysis. A detailed discussion of the scaling laws that govern microfluidic mixing are
presented elsewhere.71 However, in order to achieve rapid parallel mixing of 20 to 50
reactors on-chip, the basic rotary mixer design needed to be changed from the
implementation presented in chapters 2 and 3 to an architecture that could be
implemented in more of a linear reaction scheme. Therefore, the ring structures were

111
stretched out from a circle to an oval (Fig. 7.7). The oval implementation allows for a
high density reactor design, with 50 parallel reactors easily fitting onto a 2’’ X 2’’ chip.
Mixing in the lysis rings is governed by the flow rate in each of the three pump
lines. Flow rate in a channel with rectangular cross section can be given as
PL
whQ Δ=μ12
3
(1)
where Q is the volume flow rate, h is the channel height, w is the channel width, L is the
channel length, ΔP is the driving pressure, and μ is the fluid viscosity.22 Consequently, to
obtain complete mixing in each ring, the flow rate in each pump line needed to be
sufficiently fast to get valve actuation in each reactor. Because flow rate scales favorably
with channel dimensions, the author chose to implement pump lines with 125 μm valves
along with 60 μm crossovers. Typically, control channels that address 12 μm flow lines
would have 100 μm valves with 15 μm crossovers. The linearity of the cells-to-cDNA
process allows for pump inputs to be placed at either end of the chip and not in the
middle, as in a previous implementation (chapter 3). The bulky rotary mixers in early
cells-to-cDNA chips made it necessary to include 15 μm crossovers as well as generally
thin control lines (50 μm) for the pump lines, making complete mixing impossible unless
inputs were in the middle of the chip. Figure 7.8 shows complete mixing in 50 parallel
reactors is feasible.

112
4
8rLR
πμ
=
Figure 7.8. Optical micrographs of reactors one-four of the 50X cells-to-cDNA device
before (left) and after (right) mixing. The reactors shown are the farthest from the pump
inputs. Scale bars are 250 μm.
7.6 Column construction with one flow input
In order to build affinity columns on a microfluidic device for highly parallel
sample analysis, various technical issues need to be addressed. The main consideration
has to be given to fluidic resistance, which in a rounded channel is expressed as
(2)
where R is the fluidic resistance, L is the channel length, μ is the fluid viscosity, and r is
the channel radius. If every column were built simultaneously in parallel, column lengths
would vary tremendously because most of the beads would stack against the sieve valves
closest to the bead input (path of least resistance). Serial bead stacking with a fluidic
multiplexer overcomes the parallel stacking problem. The multiplexer uses an array of
complementary valve pairs organized in a binary-tree architecture to select 1 of N flow
lines using 2Log2N control lines (Fig. 7.8).71 The fluidic multiplexer has been
implemented previously for large scale integration devices,20 as well as protein

113
crystallization and combinatorial mixing chips.22, 25 Implementing the fluidic multiplexer
to stack bead columns allows for unlimited columns to be built on-chip, with the size of
the chip being the limiting factor for number of columns implemented. In this scheme,
columns can be built either one, two, four, or eight at a time in a uniform fashion.
As previously discussed in section 7.3, dead volume issues also need to be
addressed in order for optimal device operation. Three layer flow molds minimize dead
volume and were implemented for all devices containing a multiplexer element.
Figure 7.9. Parallel multiplexing structure.20 Each pair of complementary valves
composes a bit. Figure not drawn to scale.
7.7 Cell input with 100% reactor addressability
The final technological innovation by the author was to implement a binary tree
multiplexer to allow for 100% reactor addressability with single cells. In earlier devices,
reactors were loaded one at a time (chapter 3) or by flowing cell suspension onto a chip
and massively partitioning it (chapter 5). The first implementation was not optimal

114
because of the need for separate valves for each cell input and output. The second
implementation was not optimal because Poisson statistics govern that only one third of
the reactors will be filled by single cells, if the suspension is correctly diluted. One way
to keep the device’s complexity the same while addressing each reactor with individual
cells is to implement a binary tree multiplexer (Fig. 7.10, 7.11) that shares control line
inputs with the bead multiplexer. N consecutive bifurcations originating at a single
channel allow for the 2N inlet channels to be connected through equivalent fluidic paths.71
Figure 7.10. Binary tree multiplexing structure. Low dead-volume junctions and
interleaved flush lines (blue) allow for zero reagent cross-contamination and
addressability of each reactor. Cell suspension or buffer (green) is flushed through
unique path of binary tree. Figure adapted from Carl Hansen’s thesis.71
An AutoCAD drawing of a 16x device, which utilizes multiplexers for both cell
and bead loading, is given in Fig 7.11. The same design has also been implemented to
fabricate a device with 32 reactors. The additional multiplexer has no affect on device
complexity (e.g. inputs from outside world) because every level of the multiplexers is

115
addressed with the same input (Fig. 7.11, white box). Lysis buffer is first introduced into
the device as described in chapter 5, with slight modifications. Instead of keeping the
lysis buffer confined to the bead stacking and output modules of the device, it is also
introduced into the mixing rings, by opening the control channel marked with an asterisk
(Fig. 7.11, bottom right). Once lysis buffer is in the chip, affinity columns are built as
described in chapter 5. Cell suspension is then loaded onto the chip through inlet 1, and
multiplexer valves are actuated to address each reactor with cells. At the final
multiplexer level, flow can be directed to a waste output by opening valve b and closing
valve a, or into the ring by opening valve a and closing valve b (Fig. 7.11, bottom right).
If flow is directed into the ring, valve c can be toggled on and off until the desired
number of cells are captured in the mixing ring. Once a cell is captured in the mixing
ring, the next reactor is addressed, until all reactors are filled. Excess cells are then
washed away to the waste outputs in PBS. After the two washes, cells are chemically
lysed by executing a peristaltic pump sequence described above. The process of
capturing mRNA, synthesizing first strand cDNA and recovery are identical to the 20X
chip process described in chapter 5.

116
Figure 7.11. AutoCAD drawing of 16X cells-to-cDNA device with 100% reactor
addressability. Control channels are in red, 10 μm high flow channels with rectangular
cross section utilized for column construction are shown in blue, 12 μm high rounded
flow channels are shown in white, and the 40 μm high rounded flow channel is shown in
green. The same design is utilized for a device capable of handling 32 reactors. White
arrows in top inset show where flow would be directed when certain multiplexer lines are
closed (shown with white x’s).

117
Appendix A: Protocols
A.1 Photolithography processes A.1.1 Su8-2010 10 μm/Spr220-7 15 μm/AZ-50 40 μm flow molds
1. Spin Su8-2025 at 3000 rpm for 45 s. with an acceleration of 10. 2. Soft bake mold for 1 min./3 min. at 65°C /95°C. 3. Expose mold 50 s. real-time on MJB mask aligner (7 mW/cm2). 4. Bake mold post-exposure for 1 min./3 min. at 65°C /95°C. 5. Develop in Su8 nano developer. Rinse in fresh Su8 nano developer and
determine if developed by looking at mold under microscope. 6. Once developed, hard bake mold at 150°C for 2 hr. 7. Expose mold to HMDS vapor for 90 s. 8. Spin Spr220-7 (cold, straight from refrigerator) at 1500 rpm for 1 min. with an
acceleration of 15. 9. Soft bake mold for 90 s. at 105°C. 10. Expose mold under a 20,000 dpi positive transparency mask (CAD/Art Services)
for 3.2 min. real-time on MJB mask aligner (7 mW/cm2). 11. Develop mold in MF-319 developer and rinse under a stream of H2O. Determine
if developed by looking at mold under microscope. Spr develops rather quickly, except for areas around the Su8 layer. Therefore, some areas may get overdeveloped when trying to remove residual resist around Su8 portions.
12. Hard bake 2 hr. at 200°C. 13. Expose mold to HMDS vapor for 90 s. 14. Spin AZ-50 (cold, straight from refrigerator) at 1600 rpm for 1 min. with an
acceleration of 15. 15. Soft bake mold for 1 min./5 min./1 min. at 65°C/115°C/65°C. 16. Expose mold under a 20,000 dpi positive transparency mask (CAD/Art Services)
for 4 min. real-time on MJB mask aligner (7 mW/cm2). 17. Develop mold in 3:1 H2O:2401 developer. Rinse mold under a stream of H2O. 18. Once developed (determine by visualization under microscope), hard bake 3 hr. at
200°C. Note: Temperatures for hard bakes are ramped up and down from room temperature by either turning on or off the hot plate. This will prevent resist cracking. A.1.2 Su8-2025 23 μm control molds
1. Spin Su8-2025 @ 3000 rpm for 45 s. with an acceleration of 10. 2. Soft bake mold for 2 min./5 min. at 65°C/95°C. 3. Expose mold under a 20,000 dpi negative transparency mask (CAD/Art Services)
1.2 min. real-time on MJB mask aligner (7 mW/cm2). 4. Bake mold post-exposure for 2 min./5 min. at 65°C /95°C.

118
5. Develop in Su8 nano developer. Rinse in fresh Su8 nano developer and determine if developed by looking at mold under microscope.
6. Once developed, bake mold at 95°C for 45 s to evaporate excess solvent. A.2 Three-layer RTV device fabrication (push-up valves)
1. Prepare 5:1 GE RTV A:RTV B (mix 1 min., de-foam 5 min.). 2. Expose flow mold to TMCS vapor for 2 min. 3. Pour 30 g 5:1 GE RTV A:RTV B on respective flow mold. 4. De-gas flow mold under vacuum. 5. Bake flow mold 45 min. at 80°C. 6. While flow mold is de-gassing, prepare 20:1 GE RTV A:RTV B (mix 1 min., de-
foam 5 min.). 7. Expose control mold to TMCS vapor for 2 min. 8. Spin 20:1 RTV mix at 2000 rpm for 60 s. with a 15 s. ramp. 9. Let RTV settle on control mold for ~30 min. before baking 30 min. at 80°C. 10. Bake control mold 30 min. at 80°C. 11. Cut devices out of flow mold and punch holes with 650 μm diameter punch tool
(Technical Innovations #CR0350255N20R4). 12. Clean flow device with transparent tape and align to control mold. 13. Bake 2-layer device for 45 min. at 80°C. 14. While 2-layer device is baking, prepare 20:1 GE RTV A:RTV B (mix 1 min., de-
foam 5 min.) to spin on blank silicon wafer. 15. Expose blank(s) to TMCS vapor for 2 min. 16. Spin 20:1 RTV mix on blank wafer(s) at 1600 rpm for 60 s. with a 15 s. ramp. 17. Bake blank wafer for 30 min. at 80°C. 18. Cut out 2-layer device(s) from control mold(s), clean with tape and mount on
blank wafer(s). Check for debris and collapsed valves. Collapsed valves can be fixed by applying pneumatic pressure with a syringe to the respective control channel(s). This should overcome valves sticking to channels. Once pressure is applied and released, peel device back from blank wafer and re-mount.
19. Bake 3-layer RTV device(s) for 6-18 hr. Less is best (devices can still handle ~30 psi without delaminating).
20. If output holes need to be punched, do so with technical innovation titanium nitride coated punch (#CR0830655N14R4).
21. Cut 3-layer device(s) out, clean with tape and mount on RCA-cleaned glass slide(s). Check for collapse as in (18).
22. Bake finished devices overnight at 80°C.

119
A.3 RCA Cleaning
1. Clean microscope slides in Micro-90 microcleaning soap (Cole Parmer) in heated ultrasonic tank for 30 min.
2. Rinse slides 3x in DI H2O to get rid of residual soap. 3. Make RCA cleaning solution, 6:4:1 H2O:NH4OH(37%):H2O2(30%). 4. Heat solution on hot plate (~60°C, between 3 and 4 on hot plate dial), with
samples immersed in it for 80 min. Use magnetic stir bar to stir solution. 5. Rinse samples 5x in DI H2O and store long term in DI H2O. 6. Blow samples dry with N2 stream before using.
Notes: RCA cleaing procedure cleans out most organic and metal contamination because of the strong oxidation activity. Hydroxyl groups are left on the finished surface and thus render the surface hydrophilic. Treatment for more than an hour makes the glass surfaces a bit rough. This roughness creates more contact area for a PDMS device, which promotes adhesion to the glass slide. A.4 Real-time PCR master mix recipes for microfluidic samples.
For conventional samples, volume of water is reduced by 5 μL for every 100 μL master rxn. This allows for 1 μL template per 20 μL rxn.
A.4.1 Sybr green PCR using the Roche Lightcycler 1.5 or BioRAD iCycler. 2X Qiagen sybr green master mix 50 μL 3’ Primer (20 μM stock, 300 nM final) 1.5 μL 5’ Primer (20 μM stock, 300 nM final) 1.5 μL Nuclease free H2O 47 μL -------------------------- 100 μL -20 μL to each bead pellet. A.4.2 Sybr green RT-PCR using the Roche Lightcycler 1.5 or BioRAD iCycler. 2X Qiagen sybr green master mix 50 μL 3’ Primer (20 μM stock, 300 nM final) 1.5 μL 5’ Primer (20 μM stock, 300 nM final) 1.5 μL Sensiscript reverse transcriptase 1.0 μL 40 U/μL RNase Inhibitor 1.0 μL Nuclease free H2O 45 μL -------------------------- 100 μL -20 μL to each bead pellet.

120
A.4.3 Taqman PCR using the BioRAD iCycler. 2X Qiagen quantitect taqman master mix 50 μL 3’ Primer (20 μM stock, 400 nM final) 2.0 μL 5’ Primer (20 μM stock, 400 nM final) 2.0 μL Taqman probe (10 μM stock, 200 nM final) 2.0 μL Nuclease free H2O 44 μL -------------------------- 100 μL -20 μL to each bead pellet. A.4.4 Taqman RT-PCR using the BioRAD iCycler. 2X Qiagen quantitect taqman master mix 50 μL 3’ Primer (20 μM stock, 400 nM final) 2.0 μL 5’ Primer (20 μM stock, 400 nM final) 2.0 μL
Taqman probe (10 μM stock, 200 nM final) 2.0 μL Sensiscript reverse transcriptase 1.0 μL 40 U/ μL RNase inhibitor 1.0 μL Nuclease free H2O 42 μL -------------------------- 100 μL -20 μL to each bead pellet. A.4.5 Taqman multiplex PCR using the BioRAD iCycler. 2X Qiagen quantitect taqman mux master mix 50 μL 3’ Primer gene 1 (20 μM stock, 300 nM final) 1.5 μL 5’ Primer gene 1 (20 μM stock, 300 nM final) 1.5 μL
3’ Primer gene 2 (20 μM stock, 300 nM final) 1.5 μL 5’ Primer gene 2 (20 μM stock, 300 nM final) 1.5 μL
3’ Primer gene 3 (20 μM stock, 300 nM final) 1.5 μL 5’ Primer gene 3 (20 μM stock, 300 nM final) 1.5 μL Taqman probe 1 (10 μM stock, 200 nM final) 2.0 μL
Taqman probe 2 (10 μM stock, 200 nM final) 2.0 μL Taqman probe 3 (10 μM stock, 200 nM final) 2.0 μL
Nuclease free H2O 35 μL -------------------------- 100 μL -20 μL to each bead pellet.

121
A.4.6 Taqman RT-PCR using the BioRAD iCycler. 2X Qiagen quantitect taqman mux master mix 50 μL 3’ Primer gene 1(20 μM stock, 300 nM final) 1.5 μL 5’ Primer gene 1 (20 μM stock, 300 nM final) 1.5 μL
3’ Primer gene 2 (20 μM stock, 300 nM final) 1.5 μL 5’ Primer gene 2 (20 μM stock, 300 nM final) 1.5 μL
3’ Primer gene 3 (20 μM stock, 300 nM final) 1.5 μL 5’ Primer gene 3 (20 μM stock, 300 nM final) 1.5 μL Taqman probe 1 (10 μM stock, 200 nM final) 2.0 μL
Taqman probe 2 (10 μM stock, 200 nM final) 2.0 μL Taqman probe 3 (10 μM stock, 200 nM final) 2.0 μL Sensiscript reverse transcriptase 1.0 μL 40 U/ μL RNase inhibitor 1.0 μL
Nuclease Free H2O 33 μL -------------------------- 100 μL -20 μL to each bead pellet. A.5 Thermal cycling protocols A.5.1 Conventional benchtop thermal cycling (50 μL reactions) A.5.2 Sybr green PCR using the Roche Lightcycler 1.5 or BioRAD iCycler. Cycle 1: ( 1X) Step 1: 95.0ºC for 15:00 Cycle 2: (50X) Step 1: 94.0ºC for 00:15 Step 2: 55.0ºC for 00:30 Step 3: 72.0ºC for 00:30 Step 4*: 79.0ºC for 00:10 *Data collection and real-time analysis enabled. A.5.3 Sybr green RT-PCR using the Roche Lightcycler 1.5 or BioRAD iCycler. Cycle 1: (1X) Step 1: 50.0ºC for 30:00 Cycle 2: (1X) Step 1: 95.0ºC for 15:00 Cycle 3: (50X) Step 1: 94.0ºC for 00:15 Step 2: 55.0ºC for 00:30 Step 3: 72.0ºC for 00:30 Step 4*: 79.0ºC for 00:10

122
*Data collection and real-time analysis enabled. A.5.4 Taqman PCR using the BioRAD iCycler Cycle 1: (1X) Step 1: 95.0ºC for 15:00 Cycle 2: (50X) Step 1: 94.0ºC for 00:15 Step 2*: 60.0ºC^ for 01:00 *Data collection and real-time analysis enabled. ^ 60.0ºC is used for mammalian genes and 57.0ºC is used for bacterial genes. A.5.5 Taqman RT-PCR using the BioRAD iCycler Cycle 1: (1X) Step 1: 50.0ºC for 30:00 Cycle 2: (1X) Step 1: 95.0ºC for 15:00 Cycle 3: (50X) Step 1: 94.0ºC for 00:15 Step 2*: 60.0ºC^ for 01:00 *Data collection and real-time analysis enabled. ^ 60.0ºC is used for mammalian genes and 57.0ºC is used for bacterial genes. A.5.6 Taqman multiplex PCR using the BioRAD iCycler Cycle 1: (1X) Step 1: 95.0ºC for 15:00 Cycle 2: (50X) Step 1: 94.0ºC for 00:15 Step 2: 60.0ºC for 00:45 Step 3*: 60.0ºC for 00:45 *Data collection and real-time analysis enabled. A.6 Labeling cells with DyeCycle green dye (Invitrogen# V35004)
1. Trypsinize cells (0.5 mL) and when cells detach from plate, stop reaction with 4.5 mL DMEM/10% CS.
2. Count cells in culture and spin down 1X10⁴ cells per tube (5000 rpm, 5 min.) 3. Resuspend each pellet in 1 mL DMEM/10% CS. 4. Add 2 μL dye to each mL of cell suspension (15 mL concical tube). 5. Incubate suspension for 30 min. in 37°C/10% CO2 incubator.

123
Appendix B: Intracellular Single Cell Studies Using Microfluidics
Note: Appendix B is the author’s contribution to a chapter entitled “Progress in
nanofluidics for cell biology” in the second edition of the CRC handbook of nanoscience,
engineering, and technology, to be published in October 2006.
Introduction
It has become increasingly clear that studying cell populations, regardless of what
is being assayed (e.g. mRNA, protein, or small molecule levels) is only sufficient for
obtaining average values over the particular population. Vast cellular heterogeneity is a
common theme in all biological organisms, and the ability to interrogate cells in an
individual manner could elicit the presence of subpopulations and provide insight into
specific processes, such as stem cell differentiation events, which are masked at the
population level. Although questions pertaining to what genes and proteins are expressed
in single cells, to how individual cells communicate and respond to different stimuli are
all active research areas, tools to answer these questions are generally lacking. The main
reason for the lack of technologies to study the single cell can be contributed to the poor
yields encountered when subjecting these precious samples to multi-step processes.
The typical channel dimensions found in microfluidic devices (10 μm-100 μm in
x, y, and z) and the ability to manipulate nanoliters of reagents on-chip have made the
devices encouraging platforms for the analysis of single cells.18 Furthermore, the
economy-of-scale benefits along with the ability to parallelize and automate processes are
significant advantages not found with conventional biological assays. The focus of this
section will be on micro/nanofluidic assays developed to interrogate the intracellular

124
content of single cells, although cell population assays that are amenable to individual
cells will also be considered. We will begin by discussing assays in which single cells
can be biochemically modified, followed by assays to determine expression of genes,
proteins, and other signaling molecules. It is not the section’s intention to provide a
comprehensive list of intracellular assays applied in microfluidic devices, but rather to
highlight techniques that have the most promise for single cell analysis.
Single cell electroporation
Electroporation, or the application of an electrical field to induce changes in
membrane permeability, has been harnessed in batch assays to introduce polar and
charged agents such as nucleic acids, proteins, dyes, and drugs into cells. Single cell
electroporation allows for intracellular biochemical manipulation as well as investigation
of cell-to-cell variation in response to various substances. Recently, electroporation
assays have been developed to perform the technique on single cells in microchannels.72-
75 These efforts utilized cell loading with a syringe in order to control flow rate and to
apply back pressure to the microchannel for effective trapping. The earlier devices72, 75
were fabricated with standard silicon microfabrication techniques and trapped an
individual cell in a micropore present between two electrodes. The more recent work
took advantage of soft lithography70 to trap cells in tapered microchannels. Cross
sections of the devices that employ the two electroporation schemes are given in Fig. B.1.
Each group effectively trapped a single cell between two electrodes and was able to show
electroporation events by either measuring molecular uptake or release, by fluorescence.
Current jumps due to membrane poration could also be studied by treating the cell as a

125
resistor in the existing electrical circuit. Although cells were successfully trapped by
either strategy, a significant difference between the two strategies was the effective
voltage needed to electroporate cells. In the PDMS chip73, ≤ 1 V was needed to
electroporate a single HeLa cell, while in the silicon devices,72, 75 15-20 V were needed to
reversibly electroporate various individual mammalian cells. In each case, however,
molecular transfer rate was close to 100%, a direct contrast to conventional schemes.74 A
main avenue of research in this area will be integration of downstream on-chip steps after
electroporation/molecular transfer events, as well as development of more efficient
trapping strategies to increase sample throughput.
Cellular nucleic acid isolation
The isolation of gDNA or mRNA from bacterial and/or mammalian single cells is
a crucial step for many biological and medical applications. Construction of cDNA or
gDNA libraries at the single cell level could allow for gene discovery in rare cells and the
elucidation of molecules important for various processes. The following section will
focus on the isolation of nucleic acids on-chip from single and/or a small number of cells.
It is known that pipetting DNA or RNA results in its shearing,76 and therefore focus will
be given to reports that take advantage of the low Reynolds number flow (shear-free
flow) inside microfluidic channels to lyse cells.
Early work on cell lysis/gDNA isolation77 focused on lysing single GFP
expressing Escherichia coli (E. coli) bacterial cells (treated off-chip with lysozyme to
break down the peptidoglycan layer) by diffusional mixing with dI water at the junction
of a T channel, which was molded in PDMS and bonded to a glass coverslip by oxygen

126
plasma treatment. Efficient lysis was demonstrated by the release of GFP into the
microchannel. The lysate was then transported via dielectrophoresis (DE) to a trapping
region of the device, where the channel constricted and contained a series of 10 μm gaps
both to maximize the electric field and trap the E. coli chromosomes. DNA was
visualized with a nucleic acid stain, with cells being stained before loading on-chip. It
was shown that manipulating the applied DC and AC currents allows for chromosome
shuttling to downstream DE traps.
Anderson et al.78 developed a polycarbonate machined device capable of
automated microarray sample preparation and subsequent hybridization. A solid phase of
cellulose is packed into a chamber, and homogenous lysate generated off-chip is drawn
by vacuum through the extraction chamber. The nucleic acid is then eluted for
downstream PCR. The nucleic acid isolation procedure yielded a sensitivity of 300
copies.
The first reported integrated mammalian cell capture, lysis, and nucleic acid
isolation chip-based assays24 utilized the technique of multilayer soft lithography
(MSL)19, 79 for device fabrication. In this report, both E. coli and murine NIH/3T3 cells
were isolated in nanofluidic channels by active mechanical valves. Cells were lysed on-
chip by diffusional mixing, followed by nucleic acid isolation by affinity capture.
Columns of microbeads were built against a partially closed microvalve, with valve
pressure and lysate flow rate having to be tuned precisely to carry out successful assays.
Hong et al. demonstrated single mammalian cell lysis followed by mRNA
capture/purification as well as bacterial cell lysis/gDNA isolation and purification from
as little as 30 bacterial cells. Recent advances in the Quake group have made column

127
construction more robust and digital in nature, as opposed to the analog predecessor (Fig.
B.2). Marcus et al. demonstrated single mammalian cell resolution with the new
method.23 In addition, first strand cDNA synthesis was integrated with the
aforementioned processes by utilizing the oligo(dT)25 derivatized beads, which comprised
the affinity column, as both primers and a solid-phase support. The additional step did
not have adverse effects on sensitivity. By utilizing off-chip quantitative RT-PCR (RT-
qPCR) on the bead:mRNA, or the bead:cDNA, complexes the authors demonstrated the
capability to detect mRNA copy numbers spanning 6 orders of magnitude (10-106
copies).
Nucleic acid amplification/detection
PCR has proven to be the most sensitive method for amplifying small amounts of
nucleic acids for the purpose of global and specific gene identification, with single cell
studies now commonplace in the literature.3, 4, 10, 13, 14, 40-42, 44 Nanofluidic channels offer
a robust platform for PCR28, 29, 78, 80-84 for various reasons. Microfluidic devices provide
efficient thermal transfer due to high surface to volume ratios and offer diagnostic and
forensic applications based on the ability for faster thermal cycling and on-site detection.
The capacity to partition reagents into thousands of chambers20, 29 enables concentrated
reactions, digital detection,85 and therefore absolute copy number determination in single
cells or otherwise.84 Despite the overwhelming promise for applying microfluidic PCR
to single cells, little has been reported23, 78, 80, 86 on devices that integrate cell lysis and
RNA or DNA purification with an amplification reaction. Integration of cell lysis is
critical because of the aforementioned shearing issue and because it establishes the
128
temporal resolution of the particular downstream measurement(s).87 Furthermore, to
realize true economy of scale and to maintain concentrated samples throughout the full
purification and amplification processes, microfluidic process integration is essential.
On-chip PCR has been reviewed extensively elsewhere,76, 88 and therefore only one
application of microfluidic PCR will be discussed here. Other gene expression
microanalytical techniques will also be reviewed.
Unger et al.84 harnessed MSL technology to design a PCR device capable of
partitioning PCR reactions into tens of thousands of picoliter compartments (Fig B.3).
The proof-of-principle work isolated varying concentrations of β-actin cDNA molecules
down to 0.1 copies per chamber and employed fluorescent hydrolysis probes specific to
β-actin for readout of the method. The observed number of positive chambers matched
almost identically with what is calculated by Poisson statistics (Fig B.3). More recently,
this technology has been applied by Quake’s group to study multiplexed gene expression
in single mammalian cells, as well as to determine phenotypes of unculturable bacteria
found in the termite gut.24 In the case of mammalian cells, single cells are seeded in 96
well plates or microcentrifuge tubes followed by chemical lysis off-chip in a modified
RT-PCR buffer. The lysate is then loaded onto the device and partitioned via actuation of
the valve array. The chip is then thermal cycled and fluorescence detected with a flatbed
scanner. Besides fluorescence detection with oligonucleotide probes or DNA binding
dyes, the presence of on-chip PCR products has been elucidated by electrochemical80, 89-91
and electrophoretic methods.
Nucleic acid sequence based amplification (NASBA) has been applied in
nanoliter volumes inside microfluidic devices, although not to single cells.92-94 The

129
technique is gaining popularity in nanosystems because the process is isothermal (41°C)
and therefore simplifies chip design, and obviates the problem of evaporation at hot start
and denaturation temperatures (~95°C). Jayaraman’s group60, 61 developed PDMS-based
microfluidic devices to study TNF-α activated NF-κB gene expression dynamics with
EGFP reporters, inside living mammalian cells. The authors presented two similar
devices, both of which allowed for cells to be seeded in chambers along a microfluidic
network, and subsequently grown to the desired confluency. Medium exchange every 12
hours was accomplished with syringe pumps to replenish metabolites and to remove toxic
wastes and dead cells. The devices differed in fluidic architecture so that eight60 or four61
different concentrations of activator (applied via syringe pumps) could be applied to cells
in parallel, enabling dose response curves to be generated for populations of cells as well
as single cells (Fig B.4). Future microfluidic work based on these studies will surely
incorporate the monitoring of multiplexed gene expression dynamics using multiple
reporters, as well as dynamics of heterogeneous cells, grown together in culture, by the
utilization of distinct reporters in each cell type. Furthermore, intrinsic and extrinsic
noise53 in single cell gene expression will be able to be resolved by these methodologies.
Microfluidic electrophoresis
An extensive body of work has been done to study intracellular contents of single
cells by electrophoresis inside nanofluidic channels.87, 95-101 The majority of applications
has focused on the detection of small molecules and metabolites,95, 97-99 as well as DNA
content.96 Electrophoretic detection of specific protein expression has been accomplished
in microfluidic devices in immunoassay-based formats102 as well as by probing for
130
aromatic amino acids; but has yet to be integrated on-chip with single cell samples.103
However, a device integrating cell lysis with detection of a GFP chimera has been
disclosed.104
Fang and coworkers97, 99 published two reports in the past year disclosing a
method that utilized microfluidic electrophoresis to detect reactive oxygen species (ROS)
and/or glutathione (GSH) inside single human erythrocytes. These molecules are known
to mediate numerous pathological processes, including cancer and brain trauma. The
researchers utilized photolithographic and wet chemical etching to define a 12 μm deep
and 48 μm wide microfluidic T-channel in soda-lime glass (Fig B.5). Single cells were
transported into the lyis/separation portion of the channel by electroosmotic flow (EOF)
by applying electrical potentials to the reagent reservoirs. Lysis of the single cell was
accomplished by either subjecting the cell to a stronger electric field,99 or by subjecting it
to the same electric field after a buffer exchange.97 For detection, the authors took
advantage of native nonfluorescent dyes rhodamine 123 (DHR 123) and 2,3-naphthalene-
dicarboxaldehyde (NDA) that fluoresce when oxidized by either ROS or GSH,
respectively. Labeling of the cells was accomplished either before sample loading or
directly after cell lysis, by diffusive mixing. The authors utilized laser induced
fluorescence (LIF) for detection, and were able to resolve ROS and GSH at sensitivities
two orders of magnitude lower than conventional detection limits.
Munce et al.98 employed a scheme to electrophoretically separate the intracellular
contents of four individual cells in parallel, followed by multiplexed detection of the cell
permeable molecule calcein AM (which fluoresces after cleavage by esterases inside the
cell) and the DNA minor groove binder, Hoechst 3342, by LIF. Acute myeloid leukemia

131
(AML) cells were transported via optical tweezing to a tapered portion of the
microchannel where cells underwent lysis by electromechanically shearing. The
technique offers selective lysis of cells that contact the channel opening (Fig B.6), which
allows for the simultaneous injection of the cell’s cytoplasmic contents into
predetermined channels.98 The channels were defined in PMMA by laser ablation, and
electrodes were formed by inserting stainless steel wires into the cathode and anode
reservoirs in the microfluidic device. The majority of future studies in this field will most
likely harness soft materials, such as PDMS,19, 70 in order to achieve greater
parallelization and process integration and separation via mechanical valves.
Proteomics applications
In general, reported single cell protein expression studies, whether specific or on
the scale of the proteome, are far fewer in number than single cell gene expression
studies. Numerous factors contribute to this fact, including the inability to amplify
proteins from a single cell and the variability of gene products expressed due to
truncations, splice variants, and post-translational modifications.105 Tools that operate on
the length scale of proteins, such as microfluidic devices harnessing nanofluidic channels,
could have far-reaching implications for single cell protein expression experiments.
Benchtop-based immunoassays, such as ELISA, are the workhorse for
determining intracellular protein expression in bulk samples. ELISA has been transferred
to microfluidic formats,103 but has not been utilized to detect analytes from cell lysates.
The key consideration for these assays is how to immobilize the first layer of the
immunostack inside a nanochannel. Two methods that immediately come to mind are
132
surface derivatization and solid phase extraction with antibody-coated microbeads.
Because of the high surface to volume ratio found in nanofluidic channels, surface
derivatization will employ a greater capacity for capture than beads or conventional
microtiter plate-based assays. However, bead assays with the scheme employed by
Marcus et al. (Fig B.2) may provide a robust way to interact cellular lysate with
antibodies for proteomic applications. Kartalov et al. derivatized epoxide floors of
PDMS nanochannels with antibodies to cancer markers.106 Because the device utilized
active valving, specific channels could be individually addressed with antibodies of
choice, enabling multiplexed detection from one sample. Once antibodies are bound to
the surface, the antigen-containing sample can be pressure-driven over each section of the
device, enabling all antibody parameter space to be sampled. Protein digests have also
been detected in microfluidic systems by two-dimensional (2-D) electrophoresis,
although not from cellular samples. Ramsey’s group107, 108 has separated tryptic digests
of model proteins by micellar electrokinetic chromatography (MEKC) followed by
capillary electrophoresis. The second report demonstrated higher separation resolution
because of the optimized channel geometry. The more recent work employed
asymmetric turns and decreased the second dimension’s injection plug length, therefore
achieving faster sampling and a single order of magnitude improvement in peptide peak
resolution.
Other proteomics tools being transferred to the nanoscale are devices that prepare
samples for mass spectrometry (MS) and x-ray diffraction analysis. Mass spectrometry is
a powerful tool in that it can elucidate global networks of proteins; and x-ray diffraction
of macromolecular crystals is the most sensitive method for determining molecular

133
structure. Microfluidic MS applications have been reviewed extensively elsewhere103
and therefore will not be discussed further. Because structure implies function,
elucidating protein structure is an extremely active pursuit in both biochemistry and cell
biology laboratories. Hansen et al. took advantage of the unique fluid physics present on
the microscale25, 109 to screen protein crystallization conditions by barrier interface
metering (BIM). The PDMS device fabricated by MSL is capable of screening 144
protein crystallization conditions with only 10 nL of protein for each condition, which is
2 orders of magnitude less than conventional methods such as hanging drop.
Quantifying intracellular protein and small molecule levels
Detecting proteins and small molecules in single living cells has been
accomplished via fluorescence assays inside microfluidic devices. In the case of small
molecules, most reported work18, 110-112 has been carried out probing intracellular Ca2+
concentration, [Ca2+]i, in mammalian cells, mainly due to the established commercial
dyes available and the importance of Ca2+ as a universal second messenger. Protein
expression has been examined by quantifying GFP variants transfected inside cells.20, 61,
113, 114 Thorsen et al. utilized microfluidic LSI20 to probe for the expression of a
particular enzyme in single E. coli, in a massively parallel fashion. The researchers
isolated cytochrome C peroxidase (CCP) expressing cells in subnanoliter compartments
by actuating a valve array. The cells were then allowed to interact with substrate,
followed by fluorescent product detection. In the future, high throughput screening
should become the norm with this technology.
134
In the [Ca2+]i reports referred to above, cells were either stained with respective
calcium indicators off-chip,18, 110, 111 or staining was implemented via diffusive mixing
on-chip.112 Mixing fluorescent dye with cells on-chip was inefficient, taking nearly an
hour to maximize signal to noise, with respect to the cell and its surrounding channel.
Although dye loading on-chip minimizes cell damage, more robust and efficient methods
are needed to shorten the diffusion length scale, possibly by implementing valves19 to
enclose the reaction. Manipulation of cells on-chip also varied from researcher to
researcher. Two reports18, 112 disclosed microfabricated structures inside fluidic channels
to retain single cells, while another group took advantage of a hydrodynamic pressure
difference between two parallel flow channels to dock cells in a hard-wired dam between
the channels.111 The final group110 flowed cells through microchannels and numerous
detection zones, in order to gain real-time monitoring of [Ca2+]i. The [Ca2+]i assays
implemented were similar in nature, employing diffusive mixing of calcium agonists
with cells followed by detection of a fluorescent dye product. The next generation of
calcium assays will certainly integrate the culture of mammalian cells along with real-
time calcium monitoring. The ability to partition cell subpopulations in nanoliter
compartments will allow for high throughput screening applications as well as the study
of intrapopulation effects.
Conclusions
Microfluidic assays for cell interrogation and manipulation show great promise
for robust single cell analysis. Harnessing the length scales present within these devices
will provide highly concentrated assays and the ability to analyze single cells in a

135
massively parallel fashion. The fluid physics present in the nanoliter regime, as well as
the ability to manipulate single cells in channels on the order of their diameter, may
provide answers to single cell biological questions not obtainable through conventional
analysis.
Acknoweledgements
The authors thank W. French Anderson for critical reading of the chapter. JSM is
a graduate student in Stephen R. Quake’s group at the California Institute of Technology
and is supported by National Institutes of Health (NIH) grant 1R01 HG00264401A1.

136
Figure B.1 Figure B.1. Electroporation schemes. A. Bulk electroporation. Only a portion of the
cells are electroporated because the electric field is not uniform with respect to the cells
exposed to it. B., C. Cross sections of silicon single cell electroporation devices. Cells
are transported in a microchannel and captured in a pore by applying back pressure to the
channel. Reprinted from Sens. Actuators A, Vol. 89, Huang, Y., and Rubinsky, B.,
Microfabricated electroporation chip for single cell membrane permeabilization. pp. 242-
249, 2001; and Sens. Actuators A, Vol. 104, Huang, Y., and Rubinsky, B., Flow-through
micro-electroporation chip for high efficiency single-cell genetic manipulation, pp. 205-
212, 2003, with permission from Elsevier. D. Cross section of a PDMS based single cell
electroporation device. Cells are captured between electrodes by hard wiring the device
to constrict channels to a height smaller than a cell’s diameter. Khine, M., et al. (2005).
A single cell electroporation chip. Lab Chip 5, pp. 38-43, reproduced by permission of
The Royal Society of Chemistry.

137
Figure B.2
Figure B.2. Fourplex mRNA isolation/first strand synthesis device.23 a. AutoCAD
drawing of a device with inputs and outputs labeled according to function. Rounded flow
channels are depicted in light gray and control channels are shown in dark gray.
Unrounded (rectangular profile) flow channels for affinity column construction are
shown in dark gray. Portions of drawing in white boxes are shown in b and c,
respectively. b. Optical micrographs of the lysis ring and an NIH/3T3 cell captured in the
ring. A cell is captured by opening the respective cell in and out valves and keeping
pump 1 and pump 2 closed (marked with arrows in figure). Cells are then loaded under
pneumatic pressure with a pipet tip. c. Optical micrographs of the affinity column
construction area and a stacked column against a sieve valve (marked with star in figure).

138
Scale bars are 400 μm. Marcus, J. S., Anderson, W. F., and Quake, S. R. (2006).
Microfluidic single cell mRNA isolation and analysis. In Press (Anal. Chem.),
reproduced with permission from the American Chemical Society.
Figure B.3
Figure B.3. Digital PCR results from Unger et al. A. Scan of a chip after 30 cycles
(check on this) of PCR. β-actin cDNA molecules were serially diluted and detected with
Taqman™ chemistry and a flatbed scanner. B. The positive reactors in (A) are nearly
identical to what is calculated by Poisson statistics. The black line is number of observed
positive wells while the gray line is the number calculated by Poisson statistics. Adapted
from http://www.fluidigm.com/didIFC.htm

139
Figure B.4
Figure B.4. Living Cell Array A. Chip loading scheme. Cells are seeded into the device
with a syringe pump through one of the inlets. Chemicals and medium are also loaded
with syringe pumps. B. Medium and chemicals are diluted via diffusive mixing in the
dilution module and are delivered to the cells. TNF-α (spiked with fluorescein) gradient
is formed via diffusive mixing. Cells are visualized with d2GFP reporters. C. TNF-α
dose response curve for chambers in the LCA. Thompson, D. M., et al. (2004). Dynamic
gene expression profiling using a microfabricated living cell array. Anal. Chem. 76, pp.
4098-4103, reproduced with permission from the American Chemical Society.

140
Figure B.5
Figure B.5. Determination of erythrocyte contents by capillary electrophoresis. A. a.
Schematic of the T-microchannel etched in soda-lime glass. Channels are 12 μm high
and 48 μm wide. b. Single cell is transported from S through intersection point A to AS
and SW by hydrostatic pressure. c. Set of electrical potentials are applied to inject single
cell from sample channel into separation channel. Voltages are turned off once cell is
docked in channel. d. Docked cell is lysed by applying the same voltage used for cell
transport under different buffer conditions. B. Recorded electropherograms of seven
cells injected consecutively. The separation distance was 25 mm and took place with a
voltage of +240 V/cm. Arrows indicate the starting point for separations. Top – Fresh
cells. Bottom – Stimulated with H2O2 for 10 min. Ling, Y. Y., Yin, X. F., and Fang, Z.
L. (2005). Simultaneous determination of glutathione and reactive oxygen species in
individual cells by microchip electrophoresis. Electrophoresis 26, pp. 4759-4766,
reproduced with permission from John Wiley and Sons.

141
Figure B.6
Figure B.6. Parallel intracellular study by microfluidic lysis/electrophoresis. A. Layout
of device utilized for parallel cellular electromechanical lysis/electrophoresis. One laser
etched channel is shown for clarity. B. Scanning electron micrograph of the tapered
intersection of the injection and separation modules of the channels. Munce, N. R., et al.
(2004). Microfabricated system for parallel single-cell capillary electrophoresis. Anal.
Chem. 76, pp. 4983-4989, reproduced with permission from the American Chemical
Society.

142
Appendix B - Figure References
Hong, J. W., Studer, V., Hang, G., Anderson, W. F., and Quake, S. R. (2004). A
nanoliter-scale nucleic acid processor with parallel architecture. Nat Biotechnol 22, 435-
439.
Huang, Y., and Rubinsky, B. (2001). Microfabricated electroporation chip for single cell
membrane permeabilization. Sens Actuators, A 89, 242-249.
Huang, Y., and Rubinsky, B. (2003). Flow-through micro-electroporation chip for high
efficiency single-cell genetic manipulation. Sens Actuators A 104, 205-212.
Khine, M., Lau, A., Ionescu-Zanetti, C., Seo, J., and Lee, L. P. (2005). A single cell
electroporation chip. Lab Chip 5, 38-43.
Ling, Y. Y., Yin, X. F., and Fang, Z. L. (2005). Simultaneous determination of
glutathione and reactive oxygen species in individual cells by microchip electrophoresis.
Electrophoresis.
Marcus, J. S., Anderson, W. F., and Quake, S. R. (2006). Microfluidic single cell mRNA
isolation and analysis. In Press.
Munce, N. R., Li, J., Herman, P. R., and Lilge, L. (2004). Microfabricated system for
parallel single-cell capillary electrophoresis. Anal Chem 76, 4983-4989.
Thompson, D. M., King, K. R., Wieder, K. J., Toner, M., Yarmush, M. L., and
Jayaraman, A. (2004). Dynamic gene expression profiling using a microfabricated living
cell array. Anal Chem 76, 4098-4103.
Unger, M., Manger, I., Lucero, M., Yong, Y., Miyashita-Lin, E., Wienecke, A., and
Facer, G. (2004). European Patent. Vol. EP1463796.

143
Wieder, K. J., King, K. R., Thompson, D. M., Zia, C., Yarmush, M. L., and Jayaraman,
A. (2005). Optimization of reporter cells for expression profiling in a microfluidic device.
Biomed Microdevices 7, 213-222.

144

145

146

147
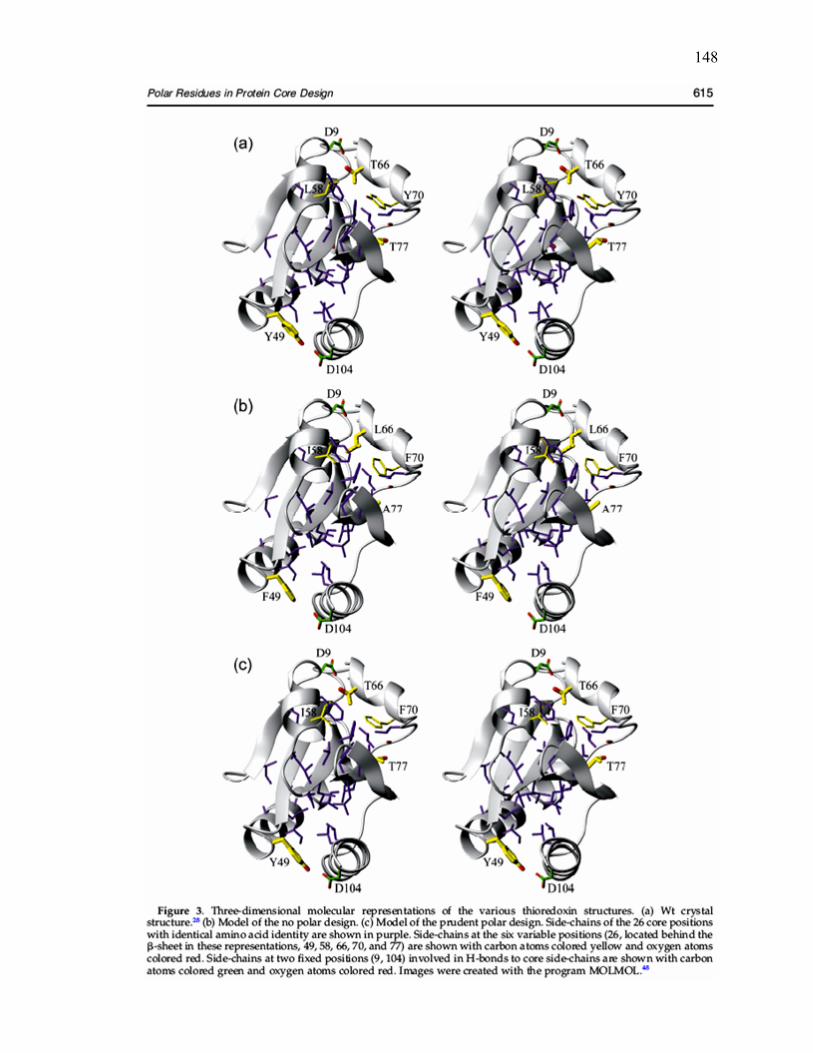
148

149

150

151

152

153

154

155

156
Conclusions This thesis is a combined effort of technological innovation and scientific
discorvery. The author presents novel microfluidic technologies capable of processing
single cells to first strand cDNA in a parallel manner. With these devices, the first direct
measure of transcriptional noise, as well as the first measurements of noise in single
mammalian cells is undertaken.
The technology provides marked improvement on previous devices designed for
cell processing for nucleic acid analysis. First, the sieve valve innovated by the author
provides a more robust implementation for on-chip separation assays than previous
schemes. In Ch. 3 the author shows columns can operate at a significantly higher range
of pressures than the previous method. This provides the user flexibility in what
pressures to run separation assays, whereas the prior implementation could only
functionally operate at one defined pressure. The author also provided quantitative
calibrations over six orders of magnitude for each step along the microfluidic process,
allowing for absolute copy number quantification in single mammalian cells, or
otherwise. First strand synthesis integration was shown to decrease variability of
measurements five fold, as compared to product collection after the mRNA isolation step.
The decreased variability is most likely due to ambient RNase activity during product
collection. Although on-chip reverse transcription efficiency was shown to be less than
benchtop, the author showed the ability to perform multiplex microfluidc RT- multiplex
qPCR in the template range for single cell measurements, unattainable by benchtop
methods. The gain in resolution is due to the utilization of a purified cDNA product, void
of dNTPs, reverse transcriptase and RT buffer. Unlike benchtop first strand synthesis

157
coupled to qPCR, the microfluidic method allows for 100% of the first strand product to
be utilized in the multiplex qPCR. Ten percent of product is more the norm for benchtop
assays because inhibition of PCR from excess first strand reaction components is an issue
at higher percentages. In the author’s scheme, excess reaction components are washed
away before collection of purified product.
The author utilized the novel technology presented in Ch. 5 to study
transcriptional noise in single NIH/3T3 cells. Histograms of gene expression data
indicated lognormal distributions for all genes measured, and for each stage of the cell
cycle. These results are consistent with the literature on gene and protein distributions,
where the end product is the result of many intracellular reactions propagating in a
multiplicative fashion. The author calculated coefficient’s of variation for the pooled
dataset, as well as subsets of the data, to attempt to decrease extrinsic noise. The values
obtained in NIH/3T3 cells were significantly higher than values obtained in E. coli and
yeast. However, because the author quantified in terms of absolute copy numbers, as
well as based on lognormal distributions, conclusions based on these comparisons should
be made cautiously. The author also demonstrates noise calculations in the literature are
misleading because the noise was calculated based on linear distributions, even when
lognormal fits are more appropriate. The questions asked and results presented in Ch. 5
are evidence that technological innovation breeds novel science.

158
Bibliography 1. Bustin, S.A. Absolute quantification of mRNA using real-time reverse
transcription polymerase chain reaction assays. J Mol Endocrinol 25, 169-193 (2000).
2. Brady, G. Expression profiling of single mammalian cells--small is beautiful. Yeast 17, 211-217 (2000).
3. Chiang, M.K. & Melton, D.A. Single-cell transcript analysis of pancreas development. Dev Cell 4, 383-393 (2003).
4. Tietjen, I. et al. Single-cell transcriptional analysis of neuronal progenitors. Neuron 38, 161-175 (2003).
5. Kamme, F. et al. Single-cell microarray analysis in hippocampus CA1: demonstration and validation of cellular heterogeneity. J Neurosci 23, 3607-3615 (2003).
6. Alsbo, C.W., Wrang, M.L., Moller, F. & Diemer, N.H. Is the AMPA receptor subunit GluR2 mRNA an early indicator of cell fate after ischemia? A quantitative single cell RT-PCR study. Brain Res 894, 101-108 (2001).
7. Danik, M., Puma, C., Quirion, R. & Williams, S. Widely expressed transcripts for chemokine receptor CXCR1 in identified glutamatergic, gamma-aminobutyric acidergic, and cholinergic neurons and astrocytes of the rat brain: a single-cell reverse transcription-multiplex polymerase chain reaction study. J Neurosci Res 74, 286-295 (2003).
8. Henne, J., Pottering, S. & Jeserich, G. Voltage-gated potassium channels in retinal ganglion cells of trout: a combined biophysical, pharmacological, and single-cell RT-PCR approach. J Neurosci Res 62, 629-637 (2000).
9. Klein, D. Quantification using real-time PCR technology: applications and limitations. Trends Mol Med 8, 257-260 (2002).
10. Lindqvist, N., Vidal-Sanz, M. & Hallbook, F. Single cell RT-PCR analysis of tyrosine kinase receptor expression in adult rat retinal ganglion cells isolated by retinal sandwiching. Brain Res Brain Res Protoc 10, 75-83 (2002).
11. Maryanski, J.L., Attuil, V., Bucher, P. & Walker, P.R. A quantitative, single-cell PCR analysis of an antigen-specific TCR repertoire selected during an in vivo CD8 response: direct evidence for a wide range of clone sizes with uniform tissue distribution. Mol Immunol 36, 745-753 (1999).
12. Peixoto, A., Monteiro, M., Rocha, B. & Veiga-Fernandes, H. Quantification of multiple gene expression in individual cells. Genome Res 14, 1938-1947 (2004).
13. Silbert, S.C. Quantitative single-cell RT-PCR for opioid receptors and housekeeping genes. Methods Mol Med 84, 107-140 (2003).
14. Wagatsuma, A. et al. Determination of the exact copy numbers of particular mRNAs in a single cell by quantitative real-time RT-PCR. J Exp Biol 208, 2389-2398 (2005).
15. Bengtsson, M., Stahlberg, A., Rorsman, P. & Kubista, M. Gene expression profiling in single cells from the pancreatic islets of Langerhans reveals lognormal distribution of mRNA levels. Genome Res 15, 1388-1392 (2005).

159
16. Rickman, D.S., Herbert, C.J. & Aggerbeck, L.P. Optimizing spotting solutions for increased reproducibility of cDNA microarrays. Nucleic Acids Res 31, e109 (2003).
17. Das, M., Harvey, I., Chu, L.L., Sinha, M. & Pelletier, J. Full-length cDNAs: more than just reaching the ends. Physiol Genomics 6, 57-80 (2001).
18. Wheeler, A.R. et al. Microfluidic device for single-cell analysis. Anal Chem 75, 3581-3586 (2003).
19. Unger, M.A., Chou, H.P., Thorsen, T., Scherer, A. & Quake, S.R. Monolithic microfabricated valves and pumps by multilayer soft lithography. Science 288, 113-116 (2000).
20. Thorsen, T., Maerkl, S.J. & Quake, S.R. Microfluidic large-scale integration. Science 298, 580-584 (2002).
21. Chou, H.P., Unger, M.A. & Quake, S.R. A microfabricated rotary pump. Biomedical Microdevices 3, 323-330 (2001).
22. Hansen, C.L., Sommer, M.O. & Quake, S.R. Systematic investigation of protein phase behavior with a microfluidic formulator. Proc Natl Acad Sci U S A 101, 14431-14436 (2004).
23. Marcus, J.S., Anderson, W.F. & Quake, S.R. Microfluidic single cell mRNA isolation and analysis. Anal Chem 78, 3084-3089 (2006).
24. Hong, J.W., Studer, V., Hang, G., Anderson, W.F. & Quake, S.R. A nanoliter-scale nucleic acid processor with parallel architecture. Nat Biotechnol 22, 435-439 (2004).
25. Hansen, C.L., Skordalakes, E., Berger, J.M. & Quake, S.R. A robust and scalable microfluidic metering method that allows protein crystal growth by free interface diffusion. Proc Natl Acad Sci U S A 99, 16531-16536 (2002).
26. Fu, A.Y., Chou, H.P., Spence, C., Arnold, F.H. & Quake, S.R. An integrated microfabricated cell sorter. Anal Chem 74, 2451-2457 (2002).
27. Fu, A.Y., Spence, C., Scherer, A., Arnold, F.H. & Quake, S.R. A microfabricated fluorescence-activated cell sorter. Nat Biotechnol 17, 1109-1111 (1999).
28. Liu, J., Enzelberger, M. & Quake, S. A nanoliter rotary device for polymerase chain reaction. Electrophoresis 23, 1531-1536 (2002).
29. Liu, J., Hansen, C. & Quake, S.R. Solving the "world-to-chip" interface problem with a microfluidic matrix. Anal Chem 75, 4718-4723 (2003).
30. Marcus, J.S., Anderson, W.F. & Quake, S.R. Parallel picoliter RT-PCR assays using microfluidics. Anal Chem 78, 956-958 (2006).
31. Alberts, B. et al. Molecular biology of the cell, Edn. 4. (Garland Publishing, New York; 1994).
32. Ovstebo, R., Haug, K.B., Lande, K. & Kierulf, P. PCR-based calibration curves for studies of quantitative gene expression in human monocytes: development and evaluation. Clin Chem 49, 425-432 (2003).
33. Cardullo, R.A., Agrawal, S., Flores, C., Zamecnik, P.C. & Wolf, D.E. Detection of nucleic acid hybridization by nonradiative fluorescence resonance energy transfer. Proc Natl Acad Sci U S A 85, 8790-8794 (1988).
34. Becker, A.J. et al. Transcriptional profiling in human epilepsy: expression array and single cell real-time qRT-PCR analysis reveal distinct cellular gene regulation. Neuroreport 13, 1327-1333 (2002).

160
35. Fink, L. et al. Real-time quantitative RT-PCR after laser-assisted cell picking. Nat Med 4, 1329-1333 (1998).
36. Shi, X. et al. Gene-expression analysis of single cells-nested polymerase chain reaction after laser microdissection. World J Gastroenterol 9, 1337-1341 (2003).
37. Durand, G.M., Marandi, N., Herberger, S.D., Blum, R. & Konnerth, A. Quantitative single-cell RT-PCR and Ca(2+) imaging in brain slices. Pflugers Arch (2005).
38. Baro, D.J. et al. Quantitative single-cell-reverse transcription-PCR demonstrates that A-current magnitude varies as a linear function of shal gene expression in identified stomatogastric neurons. J Neurosci 17, 6597-6610 (1997).
39. Dixon, A.K., Richardson, P.J., Pinnock, R.D. & Lee, K. Gene-expression analysis at the single-cell level. Trends Pharmacol Sci 21, 65-70 (2000).
40. Gentile, L. et al. Single-cell quantitative RT-PCR analysis of Cpt1b and Cpt2 gene expression in mouse antral oocytes and in preimplantation embryos. Cytogenet Genome Res 105, 215-221 (2004).
41. Han, S.H. et al. Single-cell RT-PCR detects shifts in mRNA expression profiles of basal forebrain neurons during aging. Brain Res Mol Brain Res 98, 67-80 (2002).
42. Liss, B. Improved quantitative real-time RT-PCR for expression profiling of individual cells. Nucleic Acids Res 30, e89 (2002).
43. Stahlberg, A., Zoric, N., Aman, P. & Kubista, M. Quantitative real-time PCR for cancer detection: the lymphoma case. Expert Rev Mol Diagn 5, 221-230 (2005).
44. Todd, R. & Margolin, D.H. Challenges of single-cell diagnostics: analysis of gene expression. Trends Mol Med 8, 254-257 (2002).
45. Yan, L., Kaczorowski, G. & Kohler, M. One-Tube Protocol for Single-Cell Reverse Transcriptase-Polymerase Chain Reaction. Analytical Biochemistry 304, 267-270 (2002).
46. Osawa, M. et al. Molecular characterization of melanocyte stem cells in their niche. Development 132, 5589-5599 (2005).
47. Al-Taher, A., Bashein, A., Nolan, T., Hollingsworth, M. & Brady, G. Global cDNA amplification combined with real-time RT-PCR: accurate quantification of multiple human potassium channel genes at the single cell level. Yeast 17, 201-210 (2000).
48. Brail, L.H. et al. Gene expression in individual cells: analysis using global single cell reverse transcription polymerase chain reaction (GSC RT-PCR). Mutat Res 406, 45-54 (1999).
49. http://www.premierbiosoft.com/molecular_beacons/index.html 50. http://www.ncbi.nlm.nih.gov/Education/BLASTinfo/guide.html 51. Stahlberg, A., Hakansson, J., Xian, X., Semb, H. & Kubista, M. Properties of the
reverse transcription reaction in mRNA quantification. Clin Chem 50, 509-515 (2004).
52. Stahlberg, A., Kubista, M. & Pfaffl, M. Comparison of reverse transcriptases in gene expression analysis. Clin Chem 50, 1678-1680 (2004).
53. Elowitz, M.B., Levine, A.J., Siggia, E.D. & Swain, P.S. Stochastic gene expression in a single cell. Science 297, 1183-1186 (2002).

161
54. Swain, P.S., Elowitz, M.B. & Siggia, E.D. Intrinsic and extrinsic contributions to stochasticity in gene expression. Proc Natl Acad Sci U S A 99, 12795-12800 (2002).
55. Raser, J.M. & O'Shea, E.K. Control of stochasticity in eukaryotic gene expression. Science 304, 1811-1814 (2004).
56. Rosenfeld, N., Young, J.W., Alon, U., Swain, P.S. & Elowitz, M.B. Gene regulation at the single-cell level. Science 307, 1962-1965 (2005).
57. Paulsson, J. Summing up the noise in gene networks. Nature 427, 415-418 (2004).
58. Blake, W.J., M, K.A., Cantor, C.R. & Collins, J.J. Noise in eukaryotic gene expression. Nature 422, 633-637 (2003).
59. Thattai, M. & van Oudenaarden, A. Intrinsic noise in gene regulatory networks. Proc Natl Acad Sci U S A 98, 8614-8619 (2001).
60. Thompson, D.M. et al. Dynamic gene expression profiling using a microfabricated living cell array. Anal Chem 76, 4098-4103 (2004).
61. Wieder, K.J. et al. Optimization of reporter cells for expression profiling in a microfluidic device. Biomed Microdevices 7, 213-222 (2005).
62. Ozbudak, E.M., Thattai, M., Kurtser, I., Grossman, A.D. & van Oudenaarden, A. Regulation of noise in the expression of a single gene. Nat Genet 31, 69-73 (2002).
63. Keene, O.N. The Log Transformation Is Special. Statistics in Medicine 14, 811-819 (1995).
64. Koch, A.L. Logarithm in Biology.1. Mechanisms Generating Log-Normal Distribution Exactly. Journal of Theoretical Biology 12, 276-290 (1966).
65. Koch, A.L. Logarithm in Biology.2. Distributions Simulating Log-Normal. Journal of Theoretical Biology 23, 251-268 (1969).
66. Welch, B.L. Distributions in Statistics - Continuous Univariate Distributions - Johnson,Nl and Kotz,S. Journal of the Royal Statistical Society Series a-General 135, 433-433 (1972).
67. Wang, Y. et al. Precision and functional specificity in mRNA decay. Proc Natl Acad Sci U S A 99, 5860-5865 (2002).
68. Studer, V.H., G; Pandolfi, A.; Ortiz, M.; Anderson, W.F.; Quake, S.R. Scaling properties of a low actuation pressure microfluidic valve. J Appl Phys 95, 393-398 (2004).
69. Dap cDNA was generated by amplifying dap mRNA in an RT-PCR. We then purified the PCR products and quantified the sample by spectrophotometry.
70. Xia, Y. & Whitesides, G.M. Soft Lithography. Angew Chem Int Ed 37, 550-575 (1998).
71. Hansen, C.L. Microfluidic technologies for structural biology. Ph.D. thesis (2004).
72. Huang, Y. & Rubinsky, B. Flow-through micro-electroporation chip for high efficiency single-cell genetic manipulation. Sens Actuators A 104, 205-212 (2003).
73. Khine, M., Lau, A., Ionescu-Zanetti, C., Seo, J. & Lee, L.P. A single cell electroporation chip. Lab Chip 5, 38-43 (2005).

162
74. Olofsson, J. et al. Single-cell electroporation. Curr Opin Biotechnol 14, 29-34 (2003).
75. Huang, Y. & Rubinsky, B. Microfabricated electroporation chip for single cell membrane permeabilization. Sens Actuators A 89, 242-249 (2001).
76. Tegenfeldt, J.O. et al. Micro- and nanofluidics for DNA analysis. Anal Bioanal Chem 378, 1678-1692 (2004).
77. Prinz, C., Tegenfeldt, J.O., Austin, R.H., Cox, E.C. & Sturm, J.C. Bacterial chromosome extraction and isolation. Lab Chip 2, 207-212 (2002).
78. Anderson, R.C., Su, X., Bogdan, G.J. & Fenton, J. A miniature integrated device for automated multistep genetic assays. Nucleic Acids Res 28, E60 (2000).
79. Studer, V. et al. Scaling properties of a low-actuation pressure microfluidic valve. J Appl Phys 95, 393-398 (2004).
80. Liu, R.H., Yang, J., Lenigk, R., Bonanno, J. & Grodzinski, P. Self-contained, fully integrated biochip for sample preparation, polymerase chain reaction amplification, and DNA microarray detection. Anal Chem 76, 1824-1831 (2004).
81. Obeid, P. & Christopoulos, T. Continuous-flow DNA and RNA amplification chip combined with laser-induced fluorescence detection. Analytica Chimica Acta 494, 1-9 (2003).
82. Yuen, P.K. et al. Microchip module for blood sample preparation and nucleic acid amplification reactions. Genome Res 11, 405-412 (2001).
83. Zhou, X. et al. Determination of SARS-coronavirus by a microfluidic chip system. Electrophoresis 25, 3032-3039 (2004).
84. Unger, M. et al. European Patent. Vol. EP1463796. (2004). 85. Vogelstein, B. & Kinzler, K.W. Digital PCR. Proc Natl Acad Sci U S A 96, 9236-
9241 (1999). 86. Lee, C.-Y., Lee, G.-B., Lin, J.-L., Huang, F.-C. & Liao, C.-S. Integrated
microfluidic systems for cell lysis, mixing/pumping and DNA amplification. J. Micromech Microeng 15, 1215-1223 (2005).
87. McClain, M.A. et al. Microfluidic devices for the high-throughput chemical analysis of cells. Anal Chem 75, 5646-5655 (2003).
88. Auroux, P.A., Koc, Y., deMello, A., Manz, A. & Day, P.J. Miniaturised nucleic acid analysis. Lab Chip 4, 534-546 (2004).
89. Galloway, M. & Soper, S.A. Contact conductivity detection of polymerase chain reaction products analyzed by reverse-phase ion pair microcapillary electrochromatography. Electrophoresis 23, 3760-3768 (2002).
90. Galloway, M. et al. Contact conductivity detection in poly(methyl methacrylate)-based microfluidic devices for analysis of mono- and polyanionic molecules. Anal Chem 74, 2407-2415 (2002).
91. Shiddiky, M.J., Park, D.S. & Shim, Y.B. Detection of polymerase chain reaction fragments using a conducting polymer-modified screen-printed electrode in a microfluidic device. Electrophoresis (2005).
92. Foote, R.S., Khandurina, J., Jacobson, S.C. & Ramsey, J.M. Preconcentration of proteins on microfluidic devices using porous silica membranes. Anal Chem 77, 57-63 (2005).
93. Gulliksen, A. et al. Real-time nucleic acid sequence-based amplification in nanoliter volumes. Anal Chem 76, 9-14 (2004).

163
94. Gulliksen, A. et al. Parallel nanoliter detection of cancer markers using polymer microchips. Lab Chip 5, 416-420 (2005).
95. Gao, J., Yin, X.F. & Fang, Z.L. Integration of single cell injection, cell lysis, separation and detection of intracellular constituents on a microfluidic chip. Lab Chip 4, 47-52 (2004).
96. Kleparnik, K. & Horky, M. Detection of DNA fragmentation in a single apoptotic cardiomyocyte by electrophoresis on a microfluidic device. Electrophoresis 24, 3778-3783 (2003).
97. Ling, Y.Y., Yin, X.F. & Fang, Z.L. Simultaneous determination of glutathione and reactive oxygen species in individual cells by microchip electrophoresis. Electrophoresis (2005).
98. Munce, N.R., Li, J., Herman, P.R. & Lilge, L. Microfabricated system for parallel single-cell capillary electrophoresis. Anal Chem 76, 4983-4989 (2004).
99. Sun, Y., Yin, X.F., Ling, Y.Y. & Fang, Z.L. Determination of reactive oxygen species in single human erythrocytes using microfluidic chip electrophoresis. Anal Bioanal Chem 382, 1472-1476 (2005).
100. Xia, F., Jin, W., Yin, X. & Fang, Z. Single-cell analysis by electrochemical detection with a microfluidic device. J Chromatogr A 1063, 227-233 (2005).
101. Roper, M.G., Shackman, J.G., Dahlgren, G.M. & Kennedy, R.T. Microfluidic chip for continuous monitoring of hormone secretion from live cells using an electrophoresis-based immunoassay. Anal Chem 75, 4711-4717 (2003).
102. Cheng, S.B. et al. Development of a multichannel microfluidic analysis system employing affinity capillary electrophoresis for immunoassay. Anal Chem 73, 1472-1479 (2001).
103. Lion, N. et al. Microfluidic systems in proteomics. Electrophoresis 24, 3533-3562 (2003).
104. Hellmich, W., Pelargus, C., Leffhalm, K., Ros, A. & Anselmetti, D. Single cell manipulation, analytics, and label-free protein detection in microfluidic devices for systems nanobiology. Electrophoresis 26, 3689-3696 (2005).
105. Li, J. et al. Application of microfluidic devices to proteomics research: identification of trace-level protein digests and affinity capture of target peptides. Mol Cell Proteomics 1, 157-168 (2002).
106. Kartalov, E.P. et al. High-throughput multi-antigen microfluidic fluorescence immunoassays. Biotechniques (2006).
107. Ramsey, J.D., Jacobson, S.C., Culbertson, C.T. & Ramsey, J.M. High-efficiency, two-dimensional separations of protein digests on microfluidic devices. Anal Chem 75, 3758-3764 (2003).
108. Rocklin, R.D., Ramsey, R.S. & Ramsey, J.M. A microfabricated fluidic device for performing two-dimensional liquid-phase separations. Anal Chem 72, 5244-5249 (2000).
109. Hansen, C. & Quake, S.R. Microfluidics in structural biology: smaller, faster, better. Curr Opin Struct Biol 13, 538-544 (2003).
110. Tran, L. et al. Agonist-induced calcium response in single human platelets assayed in a microfluidic device. Anal Biochem 341, 361-368 (2005).

164
111. Yang, M., Li, C.W. & Yang, J. Cell docking and on-chip monitoring of cellular reactions with a controlled concentration gradient on a microfluidic device. Anal Chem 74, 3991-4001 (2002).
112. Li, X. & Li, P.C. Microfluidic selection and retention of a single cardiac myocyte, on-chip dye loading, cell contraction by chemical stimulation, and quantitative fluorescent analysis of intracellular calcium. Anal Chem 77, 4315-4322 (2005).
113. Buhlmann, C., Preckel, T., Chan, S., Luedke, G. & Valer, M. A new tool for routine testing of cellular protein expression: integration of cell staining and analysis of protein expression on a microfluidic chip-based system. J Biomol Tech 14, 119-127 (2003).
114. Li, P.C., de Camprieu, L., Cai, J. & Sangar, M. Transport, retention and fluorescent measurement of single biological cells studied in microfluidic chips. Lab Chip 4, 174-180 (2004).


