JOURNAL OF RESEARCH IN SCIENCE TEACHING VOL. 9999, NO. 00, PP. 1–25 (2011)
Slowmation: Preservice Elementary Teachers Representing ScienceKnowledge Through Creating Multimodal Digital Animations
Garry Hoban,1 John Loughran,2 and Wendy Nielsen1
1Faculty of Education, University of Wollongong, Wollongong, New South Wales 2522, Australia2Faculty of Education, Monash University, Melbourne, Victoria, Australia
Received 7 October 2010; Accepted 3 August 2011
Abstract: Research has identified the value of learners using technology to construct their own
representations of science concepts. In this study, we investigate how learners, such as preservice ele-
mentary teachers, design and make a narrated animation to represent their science knowledge. The type
of animation exemplified is called a ‘‘Slowmation’’ (abbreviated from ‘‘Slow Animation’’), which is a
simplified way for preservice teachers to make an animation that integrates features from claymation,
object animation, and digital storytelling. Drawing on semiotic theory, a case study of three preservice
elementary teachers, who were audio and video recorded as they created a slowmation, illustrates how
the construction process enabled them to engage with a science concept in multiple ways. Findings
suggest that when preservice teachers create a slowmation, they design and make a sequence of
five representations, each being a semiotic system with particular affordances that link as a semiotic
progression: (i) research notes; (ii) storyboard; (iii) models; and (iv) digital photographs, which culmi-
nate in (v) a narrated animation. In this study, the authors present their theoretical framework, explain
how the preservice teachers created a slowmation using a sequence of representations to show their
science knowledge and discuss the implications of these findings for learners in universities and schools.
� 2011 Wiley Periodicals, Inc. J Res Sci Teach 9999: 1–25, 2011
Keywords: slowmation; technology; animation; semiotics; multimodal representation
The education literature has repeatedly highlighted concerns about the nature of science
learning in schools and universities (Bennett, 2001; Committee for the Review of Teaching
and Teacher Education, 2003; Lee, Wu, & Tsai, 2009; National Academy of Sciences, 2006;
Tytler, 2008). Despite some notable exceptions, there is a persistent view that science learning
is more often about learners’ memorization of content as propositional knowledge rather than
their development of deep conceptual understanding; at least, that is how many preservice
teachers perceive their own school science experiences (Davis, Petish, & Smithey, 2006;
Goodrum, Hackling, & Rennie, 2001). What is needed is the introduction of new ways of
representing content that motivate students to take an interest in interpreting information,
transforming this knowledge, and developing richer links between science concepts and their
everyday experiences of the real world (Loughran, 2010).
If teachers are to become more skilled at using approaches that encourage students to
engage with content, an obvious place to begin is in their own teacher preparation programs
TEA-11-03-0091.R1(20436)
Additional Supporting Information may be found in the online version of this article.
Contract grant sponsor: Australian Research Council Discovery Grant; Contract grant number: DP0879119.
Correspondence to: G. Hoban; E-mail: [email protected]
DOI 10.1002/tea.20436
Published online in Wiley Online Library (wileyonlinelibrary.com).
� 2011 Wiley Periodicals, Inc.
by enabling them to experience new ways of learning that may be different from how they
learned science when they were at school. One such way is to get preservice teachers to
create their own representations of science knowledge. This approach is consistent with cur-
rent views on learning in science education; ‘‘we conceptualize learning in science as the
process and outcomes whereby students come to understand how to interpret and construct
scientific meanings, processes and reasoning procedures using the representational conven-
tions of this subject’’ (Waldrip, Prain, & Carolan, 2010, p. 69).
This is especially needed for preservice elementary teachers whose limited content
knowledge is one reason why they often avoid teaching science (Davis et al., 2006). For
example, elementary teachers sometimes have difficulty understanding scientific concepts
such as day and night (Atwood & Atwood, 1997), phases of the moon (Trundle, Atwood, &
Christopher, 2002), the water cycle (Stoddart, Connell, Stofflett, & Peck, 1993), and energy
(Trumper, Raviolo, & Shnersch, 2000). Even in secondary schools, a lack of content knowl-
edge is sometimes a concern for teachers especially if they teach outside their specialization
(e.g., a physics teacher teaching biology; Nielsen & Nashon, 2007). Our challenge as instruc-
tors in science teacher education is to encourage our preservice teachers to experience for
themselves new ways to represent science knowledge. Using technology can sometimes pro-
vide such encouragement, especially if the tools help preservice teachers to engage with
knowledge and transform it in multiple ways (Jonassen, Myers, & McKillip, 1996; Kim &
Reeves, 2007; Lee, Linn, Varma, & Liu, 2010). As Kozma (2000) notes, ‘‘technology can
augment the cognitive and social processes of scientific understanding and learning’’ (p. 13).
There are several reasons why technology can be such a catalyst. First, it has been argued
that learners need to become immersed in ways of thinking and use of technology that are
commonly used in scientific communities (Lemke, 1998, 2004). Second, the worldwide ex-
plosion in personal digital technologies offers increasing opportunities for learners in univer-
sities and schools to use their own technologies to represent content (Kim & Reeves, 2007;
Traxler, 2010). For example, nearly all preservice teachers and school children have the ca-
pacity to create their own digital media because of their access to digital cameras (still or
movie cameras), iPodsTM for playing and storing sound tracks, and computers preloaded with
free movie-making software. It is not surprising, therefore, that the most popular web sites in
the world—Facebook, Wikipedia, MySpace, Twitter, and YouTube—are all driven by user-
generated content, which will only expand with the additional affordances of Web 2.0 tech-
nologies. Third, there is a growing body of research suggests that getting learners to create
their own representations of a science concept using technology is a way to engage them with
science content (Hand, Gunel, & Ulu, 2009; Prain & Waldrip, 2006; Tytler & Prain, 2010).
We believe that creating opportunities where our preservice teachers use their own per-
sonal digital technologies to design and integrate different modes of representation could be a
suitable means to foster such engagement with science content. A mode is a ‘‘meaning-mak-
ing system in order to articulate the meanings demanded by the social requirements of partic-
ular communities’’ (Kress, Jewitt, Ogborn, & Tsatsarelis, 2001, p. 43). Examples of modes
for expressing meaning include writing, diagrams, graphs, gestures, music, layout, images
(still and moving), 2D and 3D models as well as voice. According to Prain (2006), technolo-
gy can be used to integrate these modes as ‘‘student manipulation of computer-generated
texts, where students integrate imagery, sound, mathematical symbols, diagrams, and writing,
alters the role of written language as the major or dominant medium of learning’’ (p. 180).
Literature suggests that it is relatively common in schools and universities to have learn-
ers use various modes to make representations of their science knowledge (e.g., Danish &
Phelps, 2010; Mammino, 2008; Prain, Tytler, & Peterson, 2009). In the process of making a
2 HOBAN ET AL.
Journal of Research in Science Teaching
representation, learners can translate meaning from one mode to another (Ainsworth, 2008;
Van Meter & Garner, 2005). If the representations involve interpreting different modes or
media, then there is potential for developing understanding (Eilam & Poyas, 2010). But as
Ainsworth suggests, there are challenges in making connections between representations and
modes, since learners need to understand how a representation encodes information with
particular modes. Ainsworth also notes that making multiple representations of the same con-
cept can also be beneficial for learning. Digital technology has been particularly useful for
integrating a range of modes in visualizations of science concepts (Chin & Wu, 2009;
Gilbert, Reimer, & Nakhleh, 2008; Tasker & Dalton, 2008). These can take many forms
including models, simulations, or games, however, most often these representational forms
are expert-generated for learners to interpret the information presented (Gilbert, 2007;
Phillips, Norris, & Macnab, 2010). In particular, visualizations in the form of animations can
provide new and exciting opportunities to use various modes of representation to facilitate
science learning.
Animations in Science Education
Many computer-based environments have been developed by experts to assist learners in
working with symbolic representations of various science processes. For example,
ThinkerTools (White & Frederickson, 1998) used symbolic elements to represent both real-
world objects and abstract concepts allowing middle school learners of varying ability levels
to explore Newtonian mechanics. Elliot Soloway’s group at the University of Michigan devel-
oped a series of computer-based tools to support phases of scientific investigation. One of
these, Model-It (Metcalf, Krajcik, & Soloway, 2000; Soloway et al., 1997), is a specially
designed software program that enables middle and high school students to build qualitative
models to explore dynamic phenomena, such as water quality in a stream or the effects of
different drugs on the human body. Other topics that have specially designed animations
targeting a range of school and university learners include the mathematics of change and
variation (Roschelle, Kaput, & Stroup, 2000), infectious diseases (Colella, 2000), astronomy
(Sadler, Gould, Brecher, & Hoffman, 2000) as well as other scientific visualizations (Clark &
Jorde, 2004; DeJong et al., 1999; Edelson, 2001).
However, studies on student learning using computer-generated animations have pro-
duced mixed results. For example, some studies have shown that watching animations to
explain science concepts has improved the knowledge of both high school students (Marbach-
Ad, Rotbain, & Stavy, 2008) and college students (Williamson & Abraham, 1995), especially
with regard to learning about challenging concepts such as molecular genetics and college
level chemistry. In contrast, other studies have found that there has been little improvement in
learning when students in introductory college chemistry courses watch animations that are
intended to explain science concepts (Sanger & Greenbowe, 2000; Yang, Andre, Greenbowe,
& Tibell, 2003). For example, reviews of literature involving over 100 studies found mixed
results regarding the relationship between use of animation and student learning across many
contexts (Berney & Betrancourt, 2009; Rapp, 2007; Sperling, Seyedmonir, Aleksic, &
Meadows, 2003). A common finding was that animations often present key concepts too
quickly and do not explain concepts well, largely because they are designed to demonstrate
educational concepts in real time (Tversky, Morrison, & Betrancourt, 2002). One suggestion
is that the educational value of animations could be improved if the key features to be learned
were highlighted and if they were played slower to enable learners to follow the movements
in the objects being animated:
SLOWMATIONQ1: PRESERVICE ELEMENTARY TEACHERS 3
Journal of Research in Science Teaching
Animations must be slow and clear enough for observers to perceive movements,
changes, and their timing, and to understand the changes in relations between the parts
and the sequence of events. This means that animations should lean toward the schemat-
ic and away from the realistic. . . It also may mean annotation, using arrows or
highlighting or other devices to direct attention to the critical changes and relations.
(Tversky et al., 2002, p. 258)
One salient point, however, is that nearly all animations intended to promote student
learning have been designed by experts. If there was a change in the role of who makes the
animation and for what purpose, it might provide a different way for learners to use anima-
tions to engage with science knowledge.
Learner-Generated Animations
It is possible that animations could carry new meaning if learners themselves (preservice
teachers or school students) became the designers and creators rather than consumers of
knowledge presented in expert-generated animations (Chan & Black, 2005). In accord with
this view, Bransford, Brown, and Cocking (2000) argued that making and manipulating sci-
ence models is valuable because learners ‘‘develop a deeper understanding of phenomena in
the physical and social worlds if they build and manipulate models of these phenomena’’ (p.
215). However, the possibility of learners designing and creating their own animations has
been limited because the process of making an animation is usually too complex and time
consuming. The significant challenge of learners creating animations of science concepts is
clear from the paucity of research in this area.
To gauge the extent of research, the following string was used to search across six educa-
tional databases (Proquest Educational Journals, ERIC, EdITLibrary, Scopus, ISI Web of
Knowledge, and Science Direct): ‘‘student generated or learner generated or student created
or learner created and animation and science.’’ The search revealed a small number of re-
search publications involving learners creating animations about science. One learner-centered
animation software, called Chemation, was specially designed to enable 7th grade school
students (N ¼ 271) to design and evaluate simple flip-book like animations about the particu-
late nature of matter (Chang, Quintana, & Krajcik, 2010). Pre- and post-test results revealed
that there was a significant effect on the learning of student participants, especially if they
also peer-evaluated the animations produced. Students needed access to hand-held Palm com-
puters to help them design the animations to represent chemical reactions. Other studies have
been conducted using another specially designed software, ChemSense, which enabled high
school students to construct their own representations of molecular level animations in chemi-
cal systems by viewing, manipulating, and interpreting visualizations in chemistry (Schank &
Kozma, 2002; Stieff & Wilensky, 2003; Wilder & Brinkerhoff, 2007; Wu, Krajcik, &
Soloway, 2001). A third specially designed software, Carousel, enabled 12 computer science
undergraduates to design their own animations of three different mathematical algorithms
involving text, pictures, video, animations, and speech, which could also be shared with other
students on a web site (Hubscher-Younger & Hari Narayanan, 2008). Pre- and post-tests
suggested that authoring and evaluating animations was a positive learning experience for
most of these students. A common feature of these studies involving either Chemation,
ChemSense, or Carousel was that the animations produced were peer reviewed, which also
enhanced student learning.
Although the number of research studies on learner-generated animations is small, their
educational value was noted: ‘‘encouraging students to create their own animations (which
4 HOBAN ET AL.
Journal of Research in Science Teaching
are not found in textbooks or commonly employed by teachers) of complex procedural con-
cepts may enhance learning in an otherwise traditionally delivered course’’ (Hubscher-
Younger & Hari Narayanan, 2008, p. 258). However, in each study a specially designed
software package needed to be programmed in order for the students to generate their own
animations. It seems reasonable to suggest that a simpler way to make animations without
requiring subject specific software would enable learners to create animations across a range
of concepts and possibly provide a new way to represent their science knowledge.
Slowmation: A Simplified Way to Make Stop-Motion Animations
Because of advances in personal digital technologies, it is now becoming easier for learn-
ers such as preservice teachers to make animations to explain their interpretation of a science
concept. But even with access to portable technologies, making an animated mini-movie to
explain a science concept could still be difficult for them because science objects do not
move by themselves unless they are motorized. However, using a traditional stop-motion
animation technique is feasible because it is the creator who manually moves the objects
whilst taking a digital still photograph, thus eliminating the need for complex mechanisms to
provide movement. Yore and Hand (2010) also contend that getting students to make stop-
motion animations is a good way for teachers to introduce content as ‘‘students take a series
of still photographs and produce a time-series or time lapse collection or a flipbook to illus-
trate relative motion’’ (p. 99). However, traditional approaches to stop-motion animation,
such as claymation are still very tedious and challenging to implement in the confines of a
science methods class.
Slowmation (abbreviated from ‘‘Slow Animation’’) is a simplified way for preservice
teachers to make a narrated stop-motion animation as an instructional resource to explain a
science concept (Hoban, 2005, 2007, 2009). They can learn the process in 1–2 hours using
models made out of everyday materials, such as plasticine, cardboard, or paper, or use exist-
ing plastic models and take digital still photos of the models as they are moved manually.
Creating a slowmation integrates features of clay animation, object animation, and digital
storytelling (Lambert, 2002) with the product being similar to a narrated flip-book. It involves
the preservice teachers designing a sequence of five representations using a range of modali-
ties (Hoban & Nielsen, 2010, 2011): (i) research notes; (ii) storyboard; (iii) models; (iv) digi-
tal photographs; and (v) the narrated animation. In short, a slowmation displays the following
features:
purpose. The intention of a making slowmation is for preservice teachers to engage
with science content by making a 1–2 minute narrated animation as an instructional
resource to explain a science concept. According to Jonassen et al. (1996), when
students design multimedia to explain content ‘‘they reflect on that knowledge in new
and meaningful ways’’ (p. 95). Its design can include a range of enhancements such
as narration, music, and static images.
timing. Slowmations are usually played slowly at 2 fps, not the usual animation speed
of 20–24 fps, thus need 10 times fewer photos than in clay or computer animation,
hence the name ‘‘Slow Animation’’ or ‘‘Slowmation.’’ This slow speed is suitable for
a narration to explain the science.
orientation. Models are made in 2D and/or 3D and usually manipulated in the horizon-
tal plane (lying flat on a table or the floor) and photographed by a digital still camera
mounted on a tripod looking down or across at the models, which makes them easier
to make, move, and photograph.
SLOWMATION: PRESERVICE ELEMENTARY TEACHERS 5
Journal of Research in Science Teaching
materials. Because models do not have to stand up, many different materials can be
used such as soft play-dough, plasticine, 2D pictures, drawings, written text, existing
3D models, felt, cardboard cut-outs, and natural materials such as leaves, rocks, or
fruit.
technology. Students use their own digital still camera or a hand-held mobile phone
camera (with photo quality set on low resolution) and free movie-making software
available on their computers (e.g., iMovie or SAM Animation on a Mac or Windows
Movie Maker on a PC).
In summary, slowmation greatly simplifies the process of creating an animation enabling
preservice teachers to: (i) make or use existing 2D or 3D models that may lie flat on a table
or the floor; (ii) play the animation slowly at 2 fps requiring 10 times fewer photos than
normal animation; and (iii) use widely available technology such as a digital still camera, a
tripod, and free movie-making computer software. Whilst previous research on learner-gener-
ated animations (Chang et al., 2010; Hubscher-Younger & Hari Narayanan, 2008; Schank &
Kozma, 2002), has identified their value, the research area could benefit from the develop-
ment of a simpler way for learners such as preservice teachers to make them. The purpose of
the present study, therefore, is to investigate how preservice teachers create a slowmation to
represent their science knowledge. To address this purpose, the following research question
was posed:
How did the preservice teachers represent their science knowledge by making a slow-
mation and what were their reflections on the construction process?
Whereas most research studies on animations have used either cognitive or situative theo-
ries as their focus (Russell & Kozma, 2007), our theoretical framework for the study draws
on a language-based theory, semiotics, because it focuses on the representations produced to
help explain the slowmation construction process and the preservice teachers’ reflections on
their meaning making.
Theoretical Framework
The theoretical framework selected to study slowmation construction is semiotics—the
study of signs and their relationship to meaning making. In semiotics, a sign is something
that stands for something else, such as the sign H stands for Hydrogen in the Periodic Table.
Peirce (1931/1955) was one of the pioneers in the field and identified three terms that help
explain how meaning is made when a sign represents an object: (i) a ‘‘referent’’ or ‘‘object’’
is the concept or content being represented; (ii) the sign created is called a ‘‘representamen’’
or more recently a ‘‘representation’’; and (iii) the meaning generated from the sign is called
an ‘‘interpretant.’’ This is how he explained the relationship between the three terms:
A sign or representamen, is something which stands to somebody for something in
some respect or capacity. It addresses somebody, that is, creates in the mind of that
person an equivalent sign, or perhaps a more developed sign. That sign which it creates
I call the interpretant of the first sign. The sign stands for something, its object. . .that is
to have a like content. (Peirce, 1931/1955, pp. 99–100) [italics in original]
As Peirce noted, these three influences on meaning making—the referent, the representa-
tion, and interpretant—do not act independently, but instead form an interrelated whole as a
‘‘semiotic system.’’ This dynamic relationship is shown in Peirce’s (1931/1955) triadic model
6 HOBAN ET AL.
Journal of Research in Science Teaching
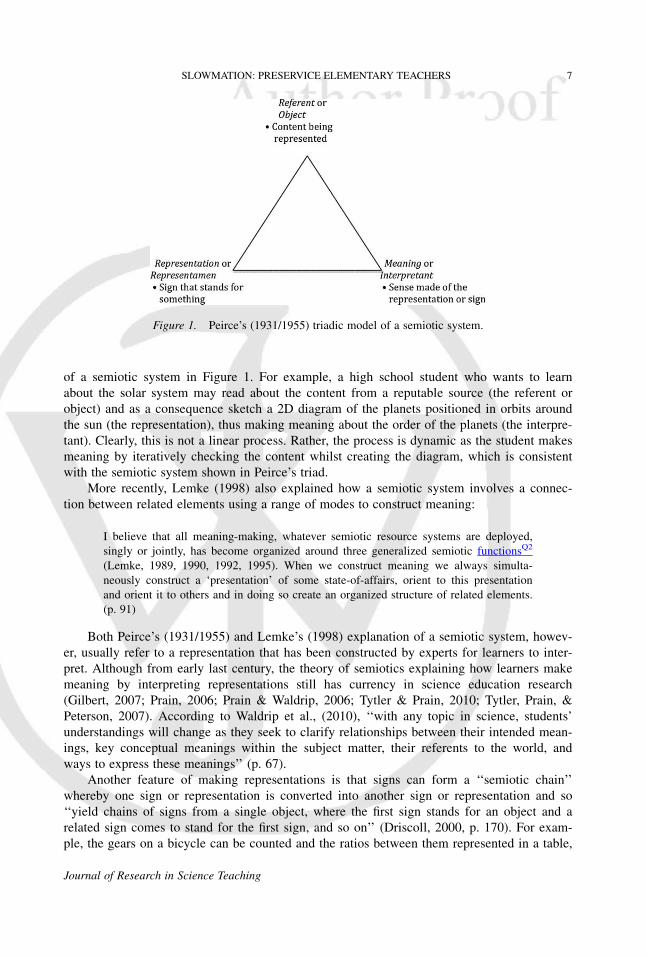
of a semiotic system in Figure 1. For example, a high school student who wants to learn
about the solar system may read about the content from a reputable source (the referent or
object) and as a consequence sketch a 2D diagram of the planets positioned in orbits around
the sun (the representation), thus making meaning about the order of the planets (the interpre-
tant). Clearly, this is not a linear process. Rather, the process is dynamic as the student makes
meaning by iteratively checking the content whilst creating the diagram, which is consistent
with the semiotic system shown in Peirce’s triad.
More recently, Lemke (1998) also explained how a semiotic system involves a connec-
tion between related elements using a range of modes to construct meaning:
I believe that all meaning-making, whatever semiotic resource systems are deployed,
singly or jointly, has become organized around three generalized semiotic functionsQ2
(Lemke, 1989, 1990, 1992, 1995). When we construct meaning we always simulta-
neously construct a ‘presentation’ of some state-of-affairs, orient to this presentation
and orient it to others and in doing so create an organized structure of related elements.
(p. 91)
Both Peirce’s (1931/1955) and Lemke’s (1998) explanation of a semiotic system, howev-
er, usually refer to a representation that has been constructed by experts for learners to inter-
pret. Although from early last century, the theory of semiotics explaining how learners make
meaning by interpreting representations still has currency in science education research
(Gilbert, 2007; Prain, 2006; Prain & Waldrip, 2006; Tytler & Prain, 2010; Tytler, Prain, &
Peterson, 2007). According to Waldrip et al., (2010), ‘‘with any topic in science, students’
understandings will change as they seek to clarify relationships between their intended mean-
ings, key conceptual meanings within the subject matter, their referents to the world, and
ways to express these meanings’’ (p. 67).
Another feature of making representations is that signs can form a ‘‘semiotic chain’’
whereby one sign or representation is converted into another sign or representation and so
‘‘yield chains of signs from a single object, where the first sign stands for an object and a
related sign comes to stand for the first sign, and so on’’ (Driscoll, 2000, p. 170). For exam-
ple, the gears on a bicycle can be counted and the ratios between them represented in a table,
Figure 1. Peirce’s (1931/1955) triadic model of a semiotic system.
SLOWMATION: PRESERVICE ELEMENTARY TEACHERS 7
Journal of Research in Science Teaching
and then re-represented into a line graph and then a column graph, thus creating multiple
representations of the same concept. Science education researchers claim that meaning-mak-
ing is enhanced when learners create more than one representation of a concept; ‘‘multiple
representations refers to the practice of re-representing the same concept through different
forms, including verbal, graphic, and numerical modes, as well as repeated student exposures
to the same concept’’ (Prain & Waldrip, 2006, p. 1844). When students create one representa-
tion from another it is called a translation task. According to Loughran (2010):
Translation occurs when ideas and information presented in one way are processed and
then used in another form. It requires cognitive manipulation as the ideas and informa-
tion being worked will need to be well understood in order for them to be applied in a
different way in a different setting. Being able to translate information is one way for
students to demonstrate understanding of a subject because the work of translation
depends on much more than just restating facts and information. (p. 104) [italics in
original]
In agreement, Yore and Hand (2010) claim that ‘‘the transformation among multimodal
representations has the greatest potential in promoting learning and depth of processing’’
(p. 96). Other researchers have also argued for the value of learners creating multiple repre-
sentations of the same concept as a semiotic chain (Bezemer & Kress, 2008; Hand & Choi,
2010; Kozma, 2003; Kress et al., 2001; Lemke, 1998; Waldrip et al., 2010). How preservice
elementary teachers represent their science knowledge by making a slowmation, as well as
their reflections on the construction process, is now demonstrated in a case study of three
preservice teachers, which was preceded by pilot studies.
Methodology
Pilot Studies
Two pilot studies preceded the case study reported in this article because to the best of
our knowledge, getting preservice teachers to use their own technology to create animations
to represent science knowledge is a relatively new field of research and the pilot studies
helped us to refine the methodology. In both studies, the participants were preservice elemen-
tary teachers at a university in a 4-year Bachelor of Education program in New South Wales,
Australia. During that period of time, all the elementary preservice teachers in three cohorts
(over 600 in total) in a core science methods course successfully made a slowmation as one
assignment to explain a science concept although only a small number were selected to be
participants in the two pilot studies.
In both pilot studies, preservice teachers were allocated typical elementary science topics
at the beginning of a science method course (e.g., weather patterns, life cycles, floating and
sinking, habitats, day and night, phases of the moon, earthquakes, forces, animal adaptations,
seasons, motion, or kitchen chemistry) and participated in a 1-hour workshop on how to
create a slowmation. They were expected to create a 1–2 minute narrated slowmation as one
assessment task to explain a science concept from their allocated topic as an instructional
resource for children in elementary schools. The preservice teachers in both pilot studies
were interviewed as soon as they were allocated a topic and asked to sketch a concept map,
which was used to help identify their prior knowledge about the concept. They were then
interviewed 4 weeks later when they had submitted their slowmations. During the interviews,
participants modified the concept maps that they had previously sketched. Data suggested that
the preservice teachers (N ¼ 15 in 2007 and N ¼ 14 in 2008) designed a slowmation to
8 HOBAN ET AL.
Journal of Research in Science Teaching
represent science knowledge as a multimodal representation (Hoban, McDonald, & Ferry,
2009; Hoban, McDonald, Ferry, & Hoban, 2009). However, data from these studies did not
allow us to draw conclusions as to how they actually created the slowmation. We felt that we
needed to design a more focused study in which data were collected during the actual con-
struction process to understand how the preservice students created a narrated animation,
which is the aim of this study. An overview of the two pilot studies and the case study is
summarized in Table 1.
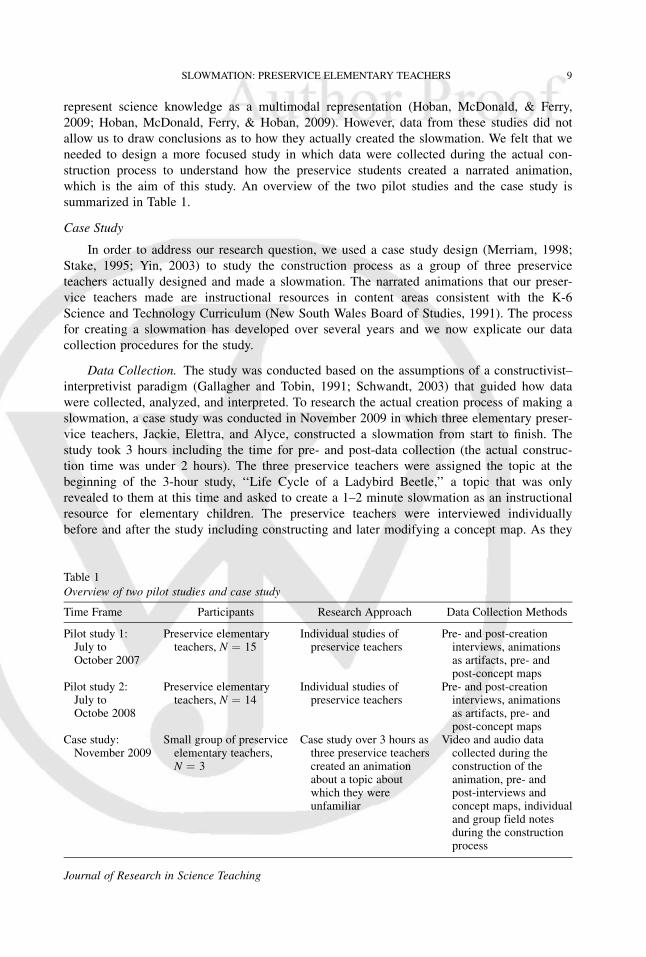
Case Study
In order to address our research question, we used a case study design (Merriam, 1998;
Stake, 1995; Yin, 2003) to study the construction process as a group of three preservice
teachers actually designed and made a slowmation. The narrated animations that our preser-
vice teachers made are instructional resources in content areas consistent with the K-6
Science and Technology Curriculum (New South Wales Board of Studies, 1991). The process
for creating a slowmation has developed over several years and we now explicate our data
collection procedures for the study.
Data Collection. The study was conducted based on the assumptions of a constructivist–
interpretivist paradigm (Gallagher and Tobin, 1991; Schwandt, 2003) that guided how data
were collected, analyzed, and interpreted. To research the actual creation process of making a
slowmation, a case study was conducted in November 2009 in which three elementary preser-
vice teachers, Jackie, Elettra, and Alyce, constructed a slowmation from start to finish. The
study took 3 hours including the time for pre- and post-data collection (the actual construc-
tion time was under 2 hours). The three preservice teachers were assigned the topic at the
beginning of the 3-hour study, ‘‘Life Cycle of a Ladybird Beetle,’’ a topic that was only
revealed to them at this time and asked to create a 1–2 minute slowmation as an instructional
resource for elementary children. The preservice teachers were interviewed individually
before and after the study including constructing and later modifying a concept map. As they
Table 1
Overview of two pilot studies and case study
Time Frame Participants Research Approach Data Collection Methods
Pilot study 1:July toOctober 2007
Preservice elementaryteachers, N ¼ 15
Individual studies ofpreservice teachers
Pre- and post-creationinterviews, animationsas artifacts, pre- andpost-concept maps
Pilot study 2:July toOctobe 2008
Preservice elementaryteachers, N ¼ 14
Individual studies ofpreservice teachers
Pre- and post-creationinterviews, animationsas artifacts, pre- andpost-concept maps
Case study:November 2009
Small group of preserviceelementary teachers,N ¼ 3
Case study over 3 hours asthree preservice teacherscreated an animationabout a topic aboutwhich they wereunfamiliar
Video and audio datacollected during theconstruction of theanimation, pre- andpost-interviews andconcept maps, individualand group field notesduring the constructionprocess
SLOWMATION: PRESERVICE ELEMENTARY TEACHERS 9
Journal of Research in Science Teaching
jointly constructed their slowmation, they were audio and video recorded and the artifacts
produced were also collected.
It should be noted that there was some previous preparation for the study: (i) the three
preservice teachers were in the third year of a 4-year Bachelor of Primary Education degree
program and had previously made a slowmation in a first year course, so they were familiar
with the construction process and use of the technology; and (ii) a week before the study the
students completed 1-hour workshop in which they were encouraged to ‘‘think-aloud’’ and
verbalize their thinking as they made a slowmation. It should be noted that in order for the
case study to finish within 3 hours (including the pre- and post-interviews), the preservice
teachers were given a plastic model set of the four stages in the life cycle of a ladybird beetle,
but no other information was provided. They were also provided with assorted colors of
plasticine and construction paper to make any other models. Data from the transcript of the
construction were selected to illustrate how the preservice teachers represented their content
knowledge during the study. Data are also included that were collected after making each
representation, whereby the three preservice teachers held a ‘‘reflective discussion’’ in which
they articulated influences on their thinking consistent with their ‘‘think aloud’’ workshop.
It is beyond the scope of this study to make claims about the preservice teachers’ learn-
ing through making a slowmation, which is documented in a separate paper (and includes
data from the pre- and post-interviews, the concept maps, and a discourse analysis). Instead,
the purpose of the current study is to investigate how the preservice teachers made a slow-
mation to represent their science knowledge and their reflections on this process as elaborated
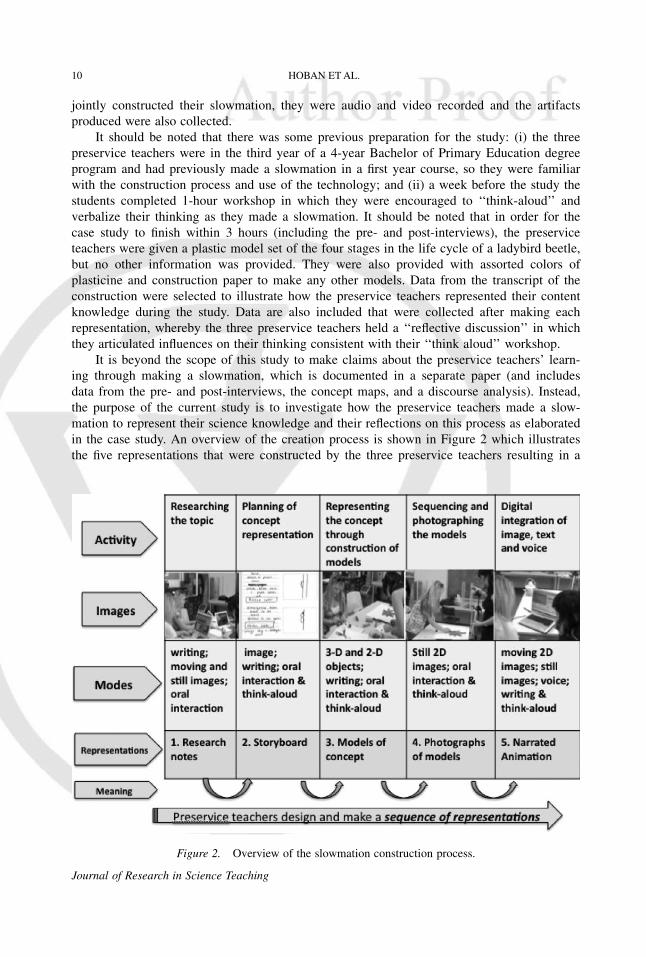
in the case study. An overview of the creation process is shown in Figure 2 which illustrates
the five representations that were constructed by the three preservice teachers resulting in a
Figure 2. Overview of the slowmation construction process.
10 HOBAN ET AL.
Journal of Research in Science Teaching
slowmation: (i) research notes; (ii) storyboard; (iii) models; (iv) digital photographs; and
(v) the narrated animation.
The next section presents data collected during the construction of each representation
along with our interpretive analysis. To address the first part of the research question concern-
ing how the preservice teachers represented their science knowledge, a general description of
the making process is provided followed by excerpts from the case study collected from video
and audio recordings as they constructed each representation. To address the second part
of the research question concerning the preservice teachers’ reflections on the construction
process, we present data from the reflective discussions held immediately after each represen-
tation was completed.
Findings
Representation 1: Research Notes
Some background knowledge is required before preservice teachers can begin to think
about designing and making an animation as an instructional resource to explain a science
concept. As a starting point, preservice teachers are usually allocated a topic and then conduct
research in order to be cognizant of salient information that they can use to represent a
concept. From observations of and interviews with preservice teachers from the two
pilot studies and the follow-up case study, preservice teachers mainly gather information
through an internet search using the Google search engine and/or by watching videos on
YouTube.
The following excerpts from the case study illustrate discussions about the science con-
tent as the preservice teachers gathered initial information from the internet about the topic of
the ‘‘Life Cycle of the Ladybird Beetle’’ allocated to them at the beginning of the study. The
three elementary preservice teachers (Jackie, Elettra, and Alyce) were sitting around a desk,
each with their laptop computers open using a wireless connection to the internet as shown
in Figure 2. They were all gathering information by reading Wikipedia and watching a
video from YouTube, discussing what they found and writing notes. As they were doing their
research, the preservice teachers clarified two points of confusion. The first was shared
between Jackie and Elettra as they clarified the differences between an egg, larvae, and
pupae:
Jackie: So the larvae are the eggs, yeah?
Elettra: No, the larvae is the pupa thing, and there’s one of them there. [points to the
internet]. I’m pretty sure that just moves around and then the thing comes out
of it, but I don’t know, like there must be a phase.
Jackie: [reading from the internet] ‘So there are four stages—egg, larvae, pupa, and
adult’. That’s what it says here. Yes look, the larvae hatches from the tiny eggs.
I thought larvae were eggs, but I guess not, that’s confusing.
Elettra: That’s a pupa. . .this would be the larvae [pointing to the screen]. So this is
what I thought the mating was [from YouTube video]. See how it looks like
two bugs, it’s coming out of it and then it turns into that [points to the screen].
The preservice teachers’ second point of confusion concerned what ladybird beetles eat
(aphids), and whether an aphid was a plant or animal:
Jackie: What’s an aphid, did we say that?
Alyce: Oh, and they eat aphids.
SLOWMATION: PRESERVICE ELEMENTARY TEACHERS 11
Journal of Research in Science Teaching
Jackie: Yeah, that’s why she lays the eggs there, the female lays the cluster of eggs
near an aphid colony.
Elettra: Sorry, aphids are plants aren’t they?
Alyce: Some sort of flower?
Elettra: What’s an aphid, OK?
Alyce: It’s like a little, yeah, we need more information than what I’m saying about
aphids.
Jackie: Are you saying it’s an animal or a plant?
Alyce: No, it’s a little bug.
Elettra: ‘‘also known as plant lice. Small plant-eating insects’’ [reading from Wikipedia]
During this time the preservice teachers summarized their research using the internet in
nine dot points, which took 20 minutes. Then they had a reflective discussion for a few
minutes about creating this first representation. They discussed how they were processing
information in a multimodal way by reading text, viewing still images and the video as well
as looking at the models. Interpreting this information challenged some of their prior knowl-
edge and clarified two points of confusion:
Jackie: My previous ideas were challenged because I didn’t know what an aphid was
and I actually thought larvae were eggs, but in fact these are the eggs and the
larvae comes out of the eggs. So I didn’t realize that.
Elettra: I was confused with that as well.
Jackie: So I guess as I was reading, my ideas were conflicting, so I had to change my
understanding of what larvae was.
Alyce: So it was like from the reading of the material on our search engines and the
pictures have helped us see and understand. . .so models have helped us, the
internet has helped us, speaking to each other about what we know, like sharing
things.
Jackie: Yeah, rephrasing our ideas.
Elettra: So first of all we read information so we were like reading.
Alyce: So you were imagining it in your own head from what you’re reading.
Elettra: We looked at the words, then looked at the pictures, like the photos of a life
cycle and then we actually watched the video.
Jackie: It confirms what knowledge was gained, like confirmed the knowledge gained
was correct.
In relation to Peirce’s triad in Figure 1, the preservice teachers generated nine dot points
using the mode of writing (the representation) to summarize features of the ladybird lifecycle
(the referent), which was a semiotic system. The meaning generated (the interpretant) was
then transferred and used in designing the next representation.
Representation 2: Storyboard
There are two aspects when creating a storyboard as the second representation in a slow-
mation—chunking and sequencing. First, making a storyboard encourages preservice teachers
to break a target concept down into its constituent elements or ‘‘chunks.’’ Each chunk then
needs to be placed in a sequence to bring the anticipated actions and explanations into a
coherent order. In addition to storyboarding, a narration is usually scripted because thinking
about a narration is likely to inform other parts of the storyboard such as sketches and labels.
In this study, however, the preservice teachers discussed the narration at the end of the
12 HOBAN ET AL.
Journal of Research in Science Teaching
storyboarding but did not script it until the final representation. Data collected illustrates how
the preservice teachers designed their storyboard by contracting the nine dot points from the
research notes into six chunks, each represented in the mode of a sketch with a label as
shown in Figure 2: (i) ladybird beetles mating in spring; (ii) laying eggs next to aphid colony;
(iii) larvae crawls out of eggs and eats aphids; (iv) larvae attaches to plant stem and pupae
comes out; (v) emergence from pupae as an adult; and (vi) color develops, eats aphids, looks
for mate straight away. As they did this they checked their information by referring back to
the text they read from Wikipedia and the YouTube video. An excerpt of the dialog is provid-
ed showing how the preservice teachers made decisions about the design and modes to use
based on what they had read and viewed on the internet:
Jackie: So the first slide will be about mating in the spring and then summer. . .and the
next sequence will be laying the eggs.
Elettra: What do they lay them on? It [the internet] says near aphids.
Jackie: Well it’d be near the aphid colony, so I guess it would be on some part of a
plant.
Elettra: But they [YouTube video] show the aphids on a stem didn’t they?
Jackie: All right, so put them right near a stem.
Elettra: There’s the little aphids. [as she sketches them]
Jackie: Yes, so we can draw a little plant stem if you want and have the ladybird just
come and lay the eggs there.
Elettra: So laying the eggs next to aphids, then the eggs hatch. [sketches]
Jackie: Yes, into the larva. So we have this larva crawling out of the eggs and then the
eggs disappear.
Elettra: I’ve got the pupa attaches itself to a stem. Oh sorry, the larvae attaches itself to
the stem, sheds a final skin and the pupa comes out. How long is it in the pupae
phase?
Jackie: One week and then it goes to the next phase.
In the reflective discussion held immediately after designing the storyboard, the preser-
vice teachers stated that constructing a storyboard helped them to break down the information
and provided them with a chance to ‘‘check’’ their information and think about the simplest
way to explain it to elementary children:
Jackie: It’s helping us to clarify the sequence of the life cycle.
Alyce: So we did a sequence before we put it onto the storyboard. Because we’re
learning such new information, we needed to break it down so we’d remember
it for a start.
Jackie: And we’re trying to plan, we are learning new information so we’re breaking it
down.
Elettra: And then we’re just transferring it but simplifying it for children, so we’ve
gathered our information, we’ve written down the main points, now we’re go-
ing, like re-collaborating on our information like I guess putting it into our
brain.
Alyce: So before putting all our information into the storyboard, we’ve decided to
make sure it’s right, check it’s right and add to it before we transfer it.
In relation to Figure 1, the process of creating the storyboard using the modes of sketches
and writing (the representation) to explain phases of the ladybird lifecycle (the referent) was
a semiotic system with the meaning (interpretant) generated being transferred to guide the
SLOWMATION: PRESERVICE ELEMENTARY TEACHERS 13
Journal of Research in Science Teaching
design of the next representation of modeling. It is worth noting that the process is not linear,
but is recursive like a system with the preservice teachers moving back and forth between
sketching and writing the storyboard as they checked their information from the internet and
from YouTube (both were used as sources for the referent) to clarify the length of each phase
of the life cycle and the role of the aphids as food.
Representation 3: Models
The third representation involves preservice teachers thinking about each chunk of the
storyboard in concrete ways and how to best represent it through constructing models.
Because the models in a slowmation are often layed down flat on a table or a floor, many
different types of materials can be used to express the particular features of the concept. In
the case study, the preservice teachers were given a plastic model for each of the four life-
cycle phases. The prefabricated models helped to limit the time required for the construction
to under 2 hours, however, the preservice teachers decided to make other models to comple-
ment the ones provided. They made another model of a ladybird beetle (as a partner) out of
plasticine, as well as models of the aphids. They also collected a real plant stem and leaves
from the garden as props as shown in Figure 2. Making the models made the preservice
teachers think about the relative size of aphids compared to the ladybird beetle as they again
checked their knowledge using the internet:
Elettra: We’re ready to start making.
Alyce: What’s that coming out there? [pointing to the model of the emerging adult]
Jackie: They’re the wings, that’s the wings while drying.
Elettra: That’s what I got from it, I’m pretty sure that’s what it says in here. [reading
from the internet] ‘‘Emergence.’’ Here we go. . .‘‘Twenty-four hours after emer-
gence from the pupa case the rear shell changes from yellow to red. The spots
will appear while the wings are drying.’’
Elettra: Look, here is our stem and the leaves. Well, we have no little aphids, what can
we have for little aphids? Let’s make them. . .oh, but the paper is yellow.
Aphids can be orange.
In the reflective discussion immediately after model construction, the preservice teachers
noted that as they were making models, they were again discussing and checking information
from the internet about features such as emergence and the actual appearance of the ladybird
beetle and the aphids. Interestingly, they discussed that although being presented with pre-
made models did limit construction time, it also meant that they did not check the details of
these models, which limited their thinking. In contrast, making models caused them to check
their information to ensure that their models were accurate with an appropriate relative size:
Alyce: I think being given the models is in many ways responsible for the way that
we’re doing it. Because in a way we’re limited because we can’t make the
model.
Elettra: Whereas if you are making it yourself, you’re constructing it yourself and you
need to go into more information and look for actual visual images of what it
would look like.
Alyce: So you are learning more.
Referring back to Peirce’s (1931/1955) triadic model in Figure 1, a semiotic system was
established by the preservice teachers trying to represent features of the ladybird beetle and
14 HOBAN ET AL.
Journal of Research in Science Teaching
aphids (the referent) through making the aphids and the ladybird beetle partner out of plasti-
cine as well as the props (the representation). The meaning generated (interpretant) was then
transferred and used in the next representation as they photographed the manual movements
of the models.
Representation 4: Photographs
The next step involves taking digital still images of the models as they are manually
moved in small increments consistent with a stop-motion animation technique. Photos can be
taken with a digital still camera mounted on a tripod looking down at the models or using a
camera in a hand-held mobile phone. The preservice teachers in our study placed a yellow
piece of project cardboard flat on a table and mounted a digital still camera on a tripod next
to the table looking down at the cardboard sheet as shown in Figure 2. They placed a plant
stem, collected from the garden, flat on the cardboard, and then arranged models of the aphids
in a fork on the stem. The ladybird models were manually moved step-by-step to approach
the aphids as photographs were taken of each movement. As the preservice teachers were
taking photographs, they were able to stop after each one to discuss any points of confusion
and when needed, recheck their information in order to correctly label the duration of each
life cycle stage. Only one photo was taken of the title page and labels as these are copied
several times as a ‘‘static image’’ in the final representation. In double-checking the content
with the internet, they realized they had made an error with regard to labeling the time for
the stages and were able to correct it and take another still photo:
Elettra: How long do they stay eggs? How much did we say?
Jackie: Eggs hatch into a larvae stage. It [internet] says it stays like this for
10–15 days.
Alyce: We should quickly find out, because we’re saying how long everything else is.
Alyce: How long until the eggs hatch, is it 7 days or something? Ah, ‘‘egg stage,
2–5 days.’’ [reading from the internet]
Elettra: How long did we say the larvae stage was?
Jackie: 10–15 days.
Elettra: Because here [internet] it says 21 days. Three weeks, that’d be right, 3 more
days. . .we need to double-check the information. [on the internet]
Alyce: OK, well that’s like conflicting what we just wrote.
Elettra: No, because the egg stage is 21 days.
Alyce: The egg stage is 21 days?
Jackie: Yeah, because we’ve said the larvae stage.
Elettra: Oh sorry, I got totally confused. [reading from the internet] ‘Egg stage is 2–5
days, larvae stage is 21 days’ which is 3 weeks, ‘‘pupae stage is 7 days.’’
In the reflective discussion after taking the photos, the preservice teachers acknowledged
that they confused some information about one of the stages. As a result, they stopped and
checked their information with the internet about the length of each stage. As they took the
photos they were visualizing the video they had seen on YouTube:
Elettra: Well, with taking the photos we had to double confirm our information.
Alyce: Oh, that’s right because we found that we were missing some information.
Jackie: I think its also helping to clarify it as well, because as I’m making this [model
of a ladybird beetle], I am imagining it like a movie in my head. So I can see
the animation like moving through the life cycle stages.
SLOWMATION: PRESERVICE ELEMENTARY TEACHERS 15
Journal of Research in Science Teaching
Alyce: I’m thinking of the video when we’re doing it as well, that we saw on YouTube.
That’s what’s in my head, stuck in my head the most probably.
In relation to Peirce’s (1931/1955) model in Figure 1, the process of moving the models
and taking the digital photographs (the representation) to represent phases of the ladybird life
cycle (the referent) was another semiotic system with the meaning (interpretant) generated
being transferred and used in the design of the final representation.
Representation 5: The Narrated Animation
The final step of the construction process involves downloading the images onto the
desktop of a computer and uploading them into any movie-making software on a computer.
This is an important aspect of thinking because it offers a meta-level of analysis whereby the
synthesized explanation of the concept can be viewed as a whole and altered accordingly.
During this editing, refinements can be made to enhance it as an instructional resource by
‘‘copying and pasting’’ key images such as labels and important still images as many times as
necessary to be ‘‘static images’’ to suit the narration.
When the preservice teachers finished taking their photographs, they sat down at Alyce’s
computer and downloaded the photographs onto her desktop. The photographs were then
uploaded into a movie-making program on her laptop computer. Importantly, the animation
speed was set at 2 fps to provide the slow-moving images enabling the preservice teachers to
provide a narration. Also, the preservice teachers made decisions about which photographs
should be ‘‘copy and pasted’’ to stay on the screen longer than the predetermined half-second
as a ‘‘static image.’’ Although it is suggested that the narration be written during the story-
boarding, in this study the preservice teachers wrote it in this last phase. Interestingly, it was
whilst writing the narration that the preservice teachers stopped and had a discussion about
another point of confusion regarding what ladybird beetles eat. Up until making this last
representation, Jackie thought that ladybird beetles ate plants, but she was corrected by
Elettra as they suddenly realized that ladybird beetles were carnivores:
Jackie: As we are preparing the narration, we’re recasting one another’s ideas to formu-
late what we are going to say.
Alyce: Stuff is sinking in better I think, like I just realized that ladybirds are carnivores.
Elettra: I was just saying then, ladybirds eat aphids and Jackie said, ‘‘and other small
plants’’ and I went, ‘‘no, other small insects.’’ And they were like, ‘‘oh, that’s
right, they don’t eat plants.’’
Finalizing the slowmation construction involves recording the narration to explain the
slow-moving images supported by the static images as labels and key still photos. Below is a
script of the co-constructed narration that was recorded by Elettra to explain the ladybird
beetle life cycle in the 1 minute and 9 second animation:
‘‘The Life Cycle of the Ladybird Beetle’’
Ladybirds mate in spring and summer.
The female lays a cluster of eggs of up to 300 near an aphid colony.
After 2–5 days the eggs hatch into a larvae state. This state lasts up to 3 weeks.
The larvae eat aphids and grows rapidly shedding its skin several times.
When the larvae is full size, it attaches itself to a plant stem.
The larvae splits and exposes the pupae stage which lasts for 1 week.
16 HOBAN ET AL.
Journal of Research in Science Teaching
After this week the ladybird emerges as an adult.
It is a pale yellow color with no spots.
But over 24 hours the wings dry and its color darkens to become red with black spots.
Adult ladybirds eat aphids and other small insects and quickly search for a mate.
The Life Cycle continues.
When the preservice teachers held their final reflective discussion immediately after fin-
ishing the slowmation, Alyce used the term ‘‘foreign’’ to describe information written in their
first representation as research notes, but this ‘‘started to sink in’’ as they made the other
representations:
Alyce: It started off foreign, it was foreign information to us; we didn’t know anything.
Then as you started to see the pictures [on the internet], we could link the
information with the pictures. And then as you saw the video we could think
and string it all together and say, ‘‘Oh, so that and that work together to make
this.’’ And then let’s try and make that ourselves and then it started to sink in
through the actual making of it. Even though the information is there, you can
read something, but you do not necessarily take it in. These steps have helped
us, you know, to take it in.
Int: What do you mean take it in?
Elettra: Gain the knowledge.
Alyce: Observe it, you can read a book and not be concentrating, so to actually take it
in and apply it to yourself and store it in your head.
Jackie: I think that’s because we had to represent it in multiple ways. Like we had to
represent it visually, had to represent it orally, written and then orally as well,
yeah, in the different ways.
Elettra: The three aspects or modes of learning are there. You’ve got your visual learn-
ers, your verbal learners and your kinesthetic in the doing, like they are all
there.
In sum, the preservice teachers created a 1 minute and 9 second narrated animation to
explain the life cycle of a ladybird beetle, which was a topic introduced to them only 2 hours
earlier (See Animation S1 for the slowmation created by the preservice teachers available as
Supplementary Material accompanying the online article).
Discussion
The need to find new ways for elementary preservice teachers to represent science knowl-
edge is well documented (Bennett, 2001; Committee for the Review of Teaching and Teacher
Education, 2003; Davis et al., 2006; Goodrum et al., 2001; Lee et al., 2009; National
Academy of Sciences, 2006; Tytler, 2008). With regard to the first part of the research ques-
tion concerning how the preservice teachers made a slowmation to represent their science
knowledge, they re-represented text, still images, and video they had seen on the internet by
designing and making a sequence of representations culminating in a narrated animation as
an instructional resource for elementary children. Furthermore, each representation was a
semiotic system (Lemke, 1998; Peirce, 1931/1955) because the preservice teachers were mak-
ing meaning (the interpretant) as they made decisions about which modes to use (the repre-
sentation), as well as thinking about how to integrate them to best explain the life cycle of
the ladybird beetle (the referent). Furthermore, the final semiotic system is a multimodal
digital animation that the preservice teachers designed by aligning the modes of slow moving
SLOWMATION: PRESERVICE ELEMENTARY TEACHERS 17
Journal of Research in Science Teaching
images, still images, text, and narration to complement each other (Jewitt, 2009; Kress et al.,
2001). A key feature of this process is that it did not involve the use of any topic-specific
software as in other learner-generated animations such as Chemation (Chang et al., 2010),
Carousel (Hubscher-Younger & Hari Narayanan, 2008), or ChemSense (Schank & Kozma,
2002).
Another feature of the making process that distinguishes it from topic-specific software,
is that the creation process involves the preservice teachers in ‘‘translating’’ (Loughran, 2010)
the content five times through a progression of representations. To make the first representa-
tion of research notes, the preservice teachers translated information presented in text, still
images and video from the internet into nine summary points. These points were then trans-
lated to make the second representation of a storyboard, whereby the preservice teachers
synthesized the nine points into six chunks (sketches with a label), and then sequenced them
in a way that best explains the concept. Each chunk or panel in the storyboard was then
translated into models in the third representation by using existing plastic models and making
new ones. The fourth translation involved manually moving these models in order to take the
digital still photographs. The fifth and final translation involved uploading the digital photo-
graphs into the movie-making software on a computer and using technology to edit and inte-
grate the modes of narration, writing, still, and moving images to explain the concept.
This sequence of interrelated semiotic systems, involving a transfer of meaning from one
representation to the next culminating in the final narrated animation, we call a semiotic
progression. This is different from a semiotic chain (Driscoll, 1990Q3), which involves chang-
ing one representation into another complete representation, such as changing a table into a
graph, because each representation in a slowmation transfers meaning to be a part of the
subsequent one rather than being a finished representation, except for the final narrated ani-
mation. It needs to be noted, however, that this progression of meaning is not strictly linear,
because in the construction of each representation, there was a good deal of recursive check-
ing of information with the internet and with previous representations.
With regard to the second part of the research question concerning the preservice teach-
ers’ reflections on the construction process, they shared reflections immediately after making
each representation, which provided some interesting insights. One finding is that each repre-
sentation had a role or affordance that focused the preservice teachers’ thinking about the
concept in a particular way. For example, in constructing the first representation of research
notes, the preservice teachers engaged in multimodal learning by summarizing information
presented in the modes of writing and still images on Wikipedia as well as from video from
YouTube. The storyboard then has the affordance of making the preservice teachers ‘‘break
down’’ the content into several ‘‘chunks’’ and place them in a logical sequence. The chunks
are then used as the basis of modeling, which has the affordance of causing the preservice
teachers to closely examine features of the model they are making thus motivating them to
check details of the content. Taking the digital photographs as the models are moved manual-
ly using a stop-motion technique has the affordance of focusing the preservice teachers on
aspects of relative size and visualizing how the models move in relation to each other, ‘‘like a
movie in my head’’ (Jackie). Importantly, this stop-motion technique enables the preservice
teachers to stop, discuss and check their information whilst taking each photo, which is differ-
ent from making a video in which the filming is usually continuous. Finally, the affordance of
the final representation is that the preservice teachers use technology to integrate the four
modes of writing, moving, and still images and narration. Constructing each representation
therefore allows the preservice teachers to revisit the content for different purposes and ‘‘the
three aspects or modes of learning are there’’ (Elettra).
18 HOBAN ET AL.
Journal of Research in Science Teaching
A useful feature of making a slowmation is that the preservice teachers used their own
technology to create their digital artifact to represent their knowledge. This includes using
their own digital still camera mounted on a tripod and using the generic movie-making soft-
ware existing on their own computer. Although not a part of this study, another use of tech-
nology could be sharing and critiquing a learner-generated animation. This is similar to what
previous researchers (Chang et al., 2010; Hubscher-Younger & Hari Narayanan, 2008;
Schank & Kozma, 2002) noted, whereby learners were involved in reviewing and critiquing
each other’s animations, so that the public display of the created representations could be a
further enhancement to student engagement. This is an important step because any representa-
tion, especially created by learners, is an approximation to the referent or content it is repre-
senting. Public display of a slowmation may provide an opportunity to become aware of and
discuss preservice teachers’ alternative conceptions, which may be revealed in a representa-
tion that they create (Keast & Cooper, 2011). The important point being that creating a slow-
mation to explain a science concept produces a digital artifact that can be shown publically,
which may illuminate preservice teachers’ alternative conceptions and in so doing, the con-
ception may be modified in light of discussion or further research.
A limitation of the study is that there were only three preservice teachers involved and
they were self-selected when we asked for volunteers. Also not providing the existing plastic
models would have enabled the participants to investigate particular features of each life
cycle phase in more detail, but the construction process would likely to have taken longer
than 2 hours. Repeating the study with a range of learners such as other preservice teachers
and school students and using a range of topics would confirm the findings of this study.
Moreover, conducting additional studies using a quasi-experimental design with groups that
use different forms of representation such as expert-generated animations would be a useful
comparison.
Implications for Science Education
There are several implications for the use of slowmation in the science education com-
munity. First, the simplicity of the construction technique and accessibility of the technology
suggest that slowmation may provide opportunities for widespread use by a variety of learners
as a new way of representing science knowledge. There is already evidence for this on the
internet. A Google search on the word Slowmation provides several hundred URLs showing
examples created by elementary, secondary, and university students from different countries
and there are over 100 examples already uploaded to YouTube. The use of mobile phone
cameras creates additional possibilities for using stop-motion animation in different locations.
It does not surprise us, however, that we have not been able to find other examples in the
research literature of preservice teachers creating animations to explain science concepts. We
attribute this to the crowded curriculum in a science methods course and time consuming
nature of making animations in a traditional way. However, because of the simplicity of the
slowmation technique, preservice teachers can learn how to make one in a 1–2 hour class,
and then create their own at home using their own technology as an assignment or a home
project. The number of plastic models in school and university science laboratories may also
provide opportunities for creating a slowmation, for example, models of atoms for organic
and inorganic Chemistry, models of cells and human organs in Biology, models of land forms
in Geology as well as a range of equipment in Physics. Other specific models exist in labora-
tories in a Faculty of Science (even in Medicine and Dentistry), enabling science university
students to animate them using a stop-motion technique to explain the concepts as instruction-
al resources.
SLOWMATION: PRESERVICE ELEMENTARY TEACHERS 19
Journal of Research in Science Teaching
In a school context, our preservice teachers have shown the slowmation they made to
primary children whilst on practicum and some have encouraged the children to create their
own by making or using existing models. The most common use appears to be encouraging
school children to make a slowmation towards the end of a science topic as an assessment
task to represent what they have learned about the topic. In some school classes, these have
been shown to the rest of the class to discuss if the science concepts were represented accu-
rately and evaluated in terms of how they could be improved. Uploading these to the internet
on YouTube or TeacherTube makes collaborations between classes in different schools
possible.
A second implication is that getting learners (university students or school children) to
create slowmations as instructional resources may be a new way for them to learn science
content or at least provide a motivation to learn it. Current literature in science education has
emphasized the value of learners constructing their own representations of a science concept
and re-representing these ideas to enhance understanding (Anthony, Tippett, & Yore, 2010;
Hand & Choi, 2010; Hand et al., 2009; Prain & Waldrip, 2006; Tytler & Prain, 2010;
Waldrip, Prain, & Carolan, 2006; Yore & Hand, 2010). To justify this inference, however, is
beyond the scope of this study and would require analyzing the pre- and post-knowledge of
the preservice teachers as well as conducting a discourse analysis of the discussion whilst
they created their slowmation. It would also mean repeating the case study using a range of
concepts and a range of preservice teachers. A third implication is that whilst this study
focuses on how preservice teachers design and make a progression of representations when
creating their slowmation, the research studies conducted so far have not focused on the
decisions learners make regarding the relationship between the different modes and represen-
tations. Yore and Treagust (2006) emphasized that there have been few studies to investigate
‘‘the enhanced cognition that occurs during the transformation from one representation to
another representation or one mode to another’’ (p. 208).
It is clear that further research is needed to study how learners in different contexts use
their own technology to design and make multimodal animations to represent science con-
cepts. This would include studies to develop insights into how preservice teachers and school
students might build understanding of science concepts through the creation process. We are
hoping that this study may provide an impetus for further studies to investigate how, why,
and when preservice teachers or school children use different modes to represent their
ideas and the possible consequences for their learning. With the inevitable rapid advances in
personal digital technologies and Web 2.0 capacities, we anticipate that learner-generated
digital animations such as slowmation may have an increasing presence in university and
school science courses.
Free examples, instructions and resources for making Slowmations can be accessed at
the project web site www.slowmation.com. The authors would like to thank the three
preservice teachers who participated in this study as well as the anonymous reviewers
and colleagues who provided insightful feedback on drafts of the article.
References
Ainsworth, S. (2008). The educational value of multiple-representations when learning complex
scientific concepts. In J. K. Gilbert, M. Reimer & M. Nakhleh (Eds.), Visualization: Theory and practice
in science education (pp. 191–208). Dordrecht, The Netherlands: Springer.
Anthony, R., Tippett, C., & Yore, L. (2010). Pacific CRYSTAL Project: Explicit literacy instruction
embedded in middle school science classrooms. Research in Science Education, 40(1), 45–64.
20 HOBAN ET AL.
Journal of Research in Science Teaching
Atwood, R. K., & Atwood, V. A. (1997). Effects of instruction on preservice elementary teachers’
conceptions of the causes of night and day and the seasons. Journal of Science Teacher Education, 8(1),
1–3.
Bennett, J. (2001). Science with attitude: The perennial problem of pupil’s responses to science.
School Science Review, 82(300), 59–70.
Berney, S., & Betrancourt, M. (2009). When and why does animation enhance learning: A review.
Paper presented European Association for Research on Learning and Instruction, Amsterdam,
Netherlands.
Bezemer, J., & Kress, G. (2008). Writing in multimodal texts. Written Communication, 2, 166–195.
Bransford, J. D., Brown, A. L., & Cocking, R. (Eds.). (2000). How people learn: Brain, mind,
experience and school. Washington, DC: National Academy.
Chan, M. S., & Black, J. B. (2005). When can animation improve learning? Some implications for
human computer interaction and learning. Proceedings of the World Conference on Educational
Multimedia, Hypermedia and Telecommunications 2005 (pp. 2581–2588). Norfolk, VA.
Chang, H., Quintana, C., & Krajcik, J. S. (2010). The impact of designing and evaluating molecular
animations on how well middle school students understand the particulate nature of matter. Science
Education, 94(1), 73–94.
Chin, M., & Wu, H. (2009). The roles of multimedia in the teaching and learning of the triplet
relationship in chemistry. In J. K. Gilbert & D. Treagust (Eds.), Multiple representations in chemical
education (pp. 251–283). Dordrecht, The Netherlands: Springer.
Clark, D., & Jorde, D. (2004). Helping students to revise disruptive experientially supported ideas
about thermodynamics: Computer visualizations and tactile models. Journal of Research in Science
Teaching, 41(1), 1–23.
Colella, V. (2000). Participatory simulations: Building collaborative understanding through immer-
sive dynamic modeling. The Journal of the Learning Sciences, 9(4), 471–500.
Committee for the Review of Teaching and Teacher Education. (2003). Australia’s teachers:
Australia’s future, advancing innovation, science, technology and mathematics. Canberra: Department of
Education, Science and Training.
Danish, J. A., & Phelps, D. (2010). RepresentationQ4 practices by the numbers: How kindergarten
and first-grade students create, evaluate and modify their science representations. International Journal
of Science Education. DOI: 10.1080/09500693.2010.525798.
Davis, E. A., Petish, D., & Smithey, J. (2006). Challenges new science teachers face. Review of
Educational Research, 76(4), 607–651.
DeJong, T., Martin, E., Zamorro, J.-M., Esquembre, F., Swaak, J., & van Joolingen, W. R. (1999).
The integration of computer simulation and learning support: An example from the physics domain of
collisions. Journal of Research in Science Teaching, 36(5), 597–615.
Driscoll, M. P. (2000). Psychology of learning for instruction (2nd ed.). Needham Heights, MA:
Allyn & Bacon.
Edelson, D. C. (2001). Learning-for-use: A framework for the design of technology-supported
inquiry activities. Journal of Research in Science Teaching, 38(3), 355–385.
Eilam, B., & Poyas, Y. (2010). External visual representations in science learning: The case of
relations among system components. International Journal of Science Education, 32(17), 2335–2366.
Gallagher, J. J., & Tobin, K. G. (1991). Reporting interpretive research. In J. Gallagher (Ed.),
Interpretive research in science education (pp. 85–95). National Association of Research in Science
Teaching Monograph No. 4. Manhattan, KS: NARST.
Gilbert, J. (2007). Visualization: A metacognitive skill in science and science education. In J. K.
Gilbert (Ed.), Visualization in science education (pp. 9–27). Dordrecht: Springer.
Gilbert, J. K., Reimer, M., & Nakhleh, M. (Eds.) (2008). Visualization: Theory and practice in
science education. Dordrecht, The Netherlands: Springer.
Goodrum, D., Hackling, M., & Rennie, L. (2001). The status and quality of teaching and learning
of science in Australian schools. Canberra: Commonwealth Department of Education, Training and
Youth Affairs.
SLOWMATION: PRESERVICE ELEMENTARY TEACHERS 21
Journal of Research in Science Teaching
Hand, B., & Choi, A. (2010). Examining the impact of student use of multiple modal representa-
tions in constructing arguments in organic chemistry laboratory classes. Research in Science Education,
40(1), 29–44.
Hand, B., Gunel, M., & Ulu, C. (2009). Sequencing embedded multimodal representations in a
writing to learn approach to the teaching of electricity. Journal of Research in Science Teaching, 46(3),
225–247.
Hoban, G. (2005). From claymation to slowmation: A teaching procedure to develop students’
science understandings. Teaching Science: Australian Science Teachers’ Journal, 51(2), 26–30.
Hoban, G. (2007). Using slowmation to engage preservice elementary teachers in understanding
science content knowledge. Contemporary Issues in Technology and Teacher Education, 7(2), 1–9.
Hoban, G. (2009). Facilitating learner-generated animations with slowmation. In L. Lockyer, S.
Bennett, S. Agostino, & B. Harper (Eds.), Handbook of research on learning design and learning
objects: Issues, applications, and technologies (pp. 313–330). Hershey, PA: IGI Global.
Hoban, G., McDonald, D., & Ferry, B. (2009). Improving preservice teachers’ science knowledge
by creating, reviewing and publishing Slowmations to TeacherTube. In I. Gibson et al. (Eds.),
Proceedings of Society for Information Technology & Teacher Education International Conference 2009
(pp. 3133–3140). Chesapeake, VA: Association for the Advancement of Computers in Education.
Hoban, G., McDonald, D., Ferry, B., & Hoban, S. (2009). Simplifying animation to encourage
preservice teachers’ science learning and teaching using ‘‘Slowmation.’’ In G. Siemens & C. Fulford
(Eds.), Proceedings of World Conference on Educational Multimedia, Hypermedia and
Telecommunications (pp. 2838–2847). Chesapeake, VA: Association for the Advancement of Computers
in Education.
Hoban, G., & Nielsen, W. (2010). The 5 Rs: A new teaching approach to encourage slowmations
(student-generated animations) of science concepts. Teaching Science: Australian Science Teachers
Journal, 56(3), 33–37.
Hoban, G., & Nielsen, W. (2011). UsingQ5 ‘‘Slowmation’’ to enable preservice primary teachers to
create multimodal representations of science concepts. Research in Science Education. DOI: 10.1007/
s11165-011-9236-3.
Hubscher-Younger, T., & Hari Narayanan, N. (2008). Turning the tables: Investigating character-
istics and efficacy of student-authored animations and multimedia. In R. Lowe & W. Schnotz (Eds.),
Learning with animation: Research implications for design (pp. 235–259). New York: Cambridge
University.
Jewitt, C. (2009). The Routledge handbook of multimodal learning. London: Routledge.
Jonassen, D., Myers, J. M., & McKillop, A. M. (1996). From constructivism to constructionism:
Learning with hypermedia/multimedia rather than from it. In B. G. Wilson (Ed.), Constructivist learning
environments (pp. 93–106). Engelwood Cliffs, NJ. Educational Technology Publications.
Keast, S., & Cooper, R. (2011). Developing the knowledge base of preservice science teachers.
In D. Corrigan, J. Dillon, & R. Gunstone (Eds.), The professional knowledge of science teachers
(pp. 164–199). Dordrecht: Springer.
Kim, B., & Reeves, T. (2007). Reframing research on learning with technology: In search of the
meaning of cognitive tools. Instructional Science, 35, 207–256.
Kozma, R. B. (2000). The use of multiple representations and the social construction of understand-
ing in chemistry. In M. J. Jacobson (Ed.), Innovations in science and mathematics education: Advanced
designs for technologies and learning (pp. 11–46). Mahwah, NJ: Lawrence Erlbaum Associates.
Kozma, R. B. (2003). The material features of multiple representations and their cognitive and
social affordances for science understanding. Learning and Instruction, 13, 205–226.
Kress, G., Jewitt, C., Ogborn, J., & Tsatsarelis, C. (2001). Multimodal teaching and learning: The
rhetorics of the science classroom. London: Continuum.
Lambert, J. (2002). Digital storytelling: Capturing lives, creating community. Berkeley, CA: Digital
Diner Express.
Lee, H., Linn, M., Varma, K., & Liu, O. (2010). How do technology-enhanced inquiry science units
impact classroom learning? Journal of Research in Science Teaching, 47(1), 71–90.
22 HOBAN ET AL.
Journal of Research in Science Teaching
Lee, M., Wu, Y., & Tsai, C. (2009). Research trends in science education from 2003–2007: A
content analysis of publications in selected journals. International Journal of Science Education, 31(15),
1999–2020.
Lemke, J. (1998). Multiplying meaning: Visual and verbal semiotics in scientific text. In J. R.
Martin & R. Veel (Eds.), Reading science: Critical and functional perspectives on discourses of science
(pp. 87–113). New York: Routledge.
Lemke, J. (2004). The literacies of science. In E. W. Saul (Ed.), Crossing the borders of literacy
and science instruction (pp. 33–47). Arlington, VA: International Reading Association/National Science
Teaching Association.
Loughran, J. J. (2010). What expert teachers do: Enhancing professional knowledge for classroom
practice. Sydney: Allen & Unwin.
Mammino, L. (2008). Teaching chemistry with and without external representations. In J. K.
Gilbert, M. Reimer & M. Nakhleh (Eds.), Visualization: Theory and practice in science education
(pp. 155–185). Dordrecht, The Netherlands: Springer.
Marbach-Ad, G., Rotbain, Y., & Stavy, R. (2008). Using computer animation and illustration activi-
ties to improve high school students’ achievement in molecular genetics. Journal of Research in Science
Teaching, 45(3), 273–292.
Merriam, S. (1998). Qualitative research and case study applications in education. San Francisco:
Jossey-Bass.
Metcalf, S. J., Krajcik, J., & Soloway, E. (2000). Model-It: A design retrospective. In M. J.
Jacobson (Ed.), Innovations in science and mathematics education: Advanced designs for technologies
of learning (pp. 77–116). Mahwah, NJ: Lawrence Erlbaum Associates.
National Academy of Sciences. (2006). Rising above the gathering storm: Energizing and employ-
ing America for a brighter economic future. Washington, DC: National Academies of Science.
New South Wales Board of Studies. (1991). Science and technology K-6: Syllabus and support
document. North Sydney, NSW: Board of Studies.
Nielsen, W. S., & Nashon, S. M. (2007). Accessing science courses in rural BC: A cultural border
crossing metaphor. Alberta Journal of Educational Research, 53(3), 174–188.
Peirce, C. (1931/1955). Logic as semiotic: The theory of signs. In B. Justus (Ed.), Philosophical
writings of Peirce (1893–1910) (pp. 98–119). New York: Dover.
Phillips, L., Norris, S., & Macnab, J. (2010). Visualization in mathematics, reading and science
education. Dordrecht: Springer.
Prain, V. (2006). Learning from writing in secondary science: Some theoretical and practical impli-
cations. International Journal of Science Education, 28(2–3), 179–201.
Prain, V., Tytler, R., & Peterson, S. (2009). Multiple representations in learning about evaporation.
International Journal of Science Education, 31(6), 787–808.
Prain, V., & Waldrip, B. (2006). An exploratory study of teachers’ and students’ use of multi-modal
representations of concepts in primary science. International Journal of Science Education, 28(15),
1843–1866.
Rapp, D. (2007). Mental models: Theoretical issues for visualizations in science education. In J. K.
Gilbert (Ed.), Visualization in science education (pp. 43–60). Dordrecht: Springer.
Roschelle, J., Kaput, J. L., & Stroup, W. (2000). SimCalc: Accelerating students’ engagement with
the mathematics of change. In M. J. Jacobson (Ed.), Innovations in science and mathematics education:
Advanced designs for technologies and learning (pp. 47–76). Mahwah, NJ: Lawrence Erlbaum
Associates.
Russell, J., & Kozma, R. (2007). Assessing learning from the use of multimedia chemical visual-
izations. In J. K. Gilbert (Ed.), Visualization in science education (pp. 299–332). Dordrecht: Springer.
Sadler, P. M., Gould, R., Brecher, K., & Hoffman, B. (2000). Astronomical experiences using inter-
net-accessible remote instrumentation. In M. J. Jacobson (Ed.), Innovations in science and mathematics
education: Advanced designs for technologies and learning (pp. 287–320). Mahwah, NJ: Lawrence
Erlbaum Associates.
SLOWMATION: PRESERVICE ELEMENTARY TEACHERS 23
Journal of Research in Science Teaching
Sanger, M., & Greenbowe, T. (2000). Addressing student misconceptions concerning electron flow
in aqueous solutions with instruction including computer animations and conceptual change strategies.
International Journal of Science Education, 22(5), 521–537.
Schank, P., & Kozma, R. (2002). Learning chemistry through the use of a representation-based
knowledge building environment. Journal of Computers in Mathematics and Science Teaching, 21, 253–
279.
Schwandt, T. A. (2003). Three epistemological stances for qualitative inquiry: Interpretivism, her-
meneutics and social constructionism. In N. K. Denzin & Y. S. Lincoln (Eds.), The landscape of qualita-
tive research (pp. 292–331). Thousand Oaks, CA: Sage.
Soloway, E., Pryor, A. Z., Krajcik, J. S., Jackson, S., Stratford, S. J., Wisnudel, M, et al. (1997).
ScienceQ6Ware’s Model-it: Technology to support authentic science inquiry. T.H.E. Journal, 25(3),
54–57.
Sperling, R., Seyedmonir, M., Aleksic, M., & Meadows, G. (2003). Animations as learning tools in
authentic science materials. International Journal of Instructional Media, 30(2), 213–221.
Stake, R. (1995). The art of case study research. Thousand Oaks, CA: Sage.
Stieff, M., & Wilensky, U. (2003). Connected chemistry—Incorporating interactive simulations into
the chemistry classroom. Journal of Science Education and Technology, 12(3), 285–302.
Stoddart, T., Connell, M., Stofflett, R., & Peck, D. (1993). Reconstructing elementary teacher can-
didates’ understanding of mathematics and science content. Teaching and Teacher Education, 9(3), 787–
810.
Tasker, R., & Dalton, R. (2008). Visualizing the molecular world—Design, evaluation and the use
of animations. In J. K. Gilbert, M. Reimer & M. Nakhleh (Eds.), Visualization: Theory and practice in
science education (pp. 103–131). Dordrecht, The Netherlands: Springer.
Traxler, J. (2010). Students and mobile devices. Research in Learning Technologies, 18(2),
149–160.
Trumper, R., Raviolo, A., & Shnersch, A. (2000). A cross-cultural survey of conceptions of energy
among elementary school teachers in training: Empirical results from Israel and Argentina. Teaching
and Teacher Education, 16(7), 697–714.
Trundle, K., Atwood, R. K., & Christopher, J. (2002). Preservice elementary teachers’ conceptions
of moon phases before and after instruction. Journal of Research in Science Teaching, 39(7), 633–658.
Tversky, B., Morrison, J., & Betrancourt, M. (2002). Animation: Can it facilitate? International
Journal of Human-Computer Studies, 57(4), 247–262.
Tytler, R. (2008). Re-imagining science education. Melbourne: ACER.
Tytler, R., & Prain, V. (2010). A framework for re-thinking learning in science from recent cogni-
tive perspectives. International Journal of Science Education, 32(15), 2055–2078.
Tytler, R., Prain, V., & Peterson, S. (2007). Representational issues in students learning about
evaporation. Research in Science Education, 37, 313–331.
Van Meter, P., & Garner, J. (2005). The promise and practice of learner-generated drawing:
Literature review and synthesis. Educational Psychology Review, 17(4), 285–325.
Waldrip, B., Prain, V., & Carolan, J. (2006). Learning junior secondary science through multi-
modal representations. Electronic Journal of Science Education, 11(1), 21–32.
Waldrip, B., Prain, V., & Carolan, J. (2010). Using multi-modal representations to improve learning
in junior secondary science. Research in Science Education, 40(1), 65–80.
White, B. Y., & Frederickson, J. R. (1998). Inquiry, modeling and metacognition: Making science
accessible to all students. Cognition and Instruction, 16(1), 3–100.
Wilder, A., & Brinkerhoff, J. (2007). Supporting representational competence in high school biolo-
gy with computer-based biomolecular visualizations. The Journal of Computers in Mathematics and
Science Teaching, 26(1), 5–26.
Williamson, V., & Abraham, M. (1995). The effects of computer animation on the particulate
mental models of college chemistry students. Journal of Research in Science Teaching, 32(5), 521–534.
24 HOBAN ET AL.
Journal of Research in Science Teaching
Wu, H., Krajcik, J. S., & Soloway, E. (2001). Promoting understanding of chemical representations:
Students’ use of a visualization tool in the classroom. Journal of Research in Science Teaching, 38(7),
821–842.
Yang, E., Andre, T., Greenbowe, T., & Tibell, L. (2003). Spatial ability and the impact of vizualiza-
tion/animation on learning electrochemistry. International Journal of Science Education, 25(3), 329–349.
Yin, R. (2003). Case study research: Design and methods. Thousand Oaks, CA: Sage.
Yore, L., & Hand, B. (2010). Epilogue: Plotting a research agenda for multiple representations,
multiple modality, and multimodal representational competency. Research in Science Education, 40,
93–101.
Yore, L., & Treagust, D. (2006). Current realities and future possibilities: Language and science
literacy—Empowering research and informing instruction. International Journal of Science Education,
28, 291–314.
SLOWMATION: PRESERVICE ELEMENTARY TEACHERS 25
Journal of Research in Science Teaching
AUTHOR QUERY FORM
JOURNAL: JOURNAL OF RESEARCH IN SCIENCE TEACHINGArticle: tea_20436
Dear Author,
During the copyediting of your paper, the following queries arose. Please respond tothese by annotating your proofs with the necessary changes/additions.
& If you intend to annotate your proof electronically, please refer to the E-anno-tation guidelines.
& If you intend to annotate your proof by means of hard-copy mark-up, pleaserefer to the proof mark-up symbols guidelines. If manually writing correctionson your proof and returning it as a scanned pdf via email, do not write tooclose to the edge of the paper. Please remember that illegible mark-ups maydelay publication.
Whether you opt for hard-copy or electronic annotation of your proofs, we recom-mend that you provide additional clarification of answers to queries by entering youranswers on the query sheet, in addition to the text mark-up.
Query No. Query Remark
Q1 Please check the suitability of the short title on
the odd-numbered pages. It has been formatted
to fit the journal’s 45-character (including
spaces) limit.
Q2 References ‘‘Lemke, 1989’’, ‘‘Lemke, 1990’’,
‘‘Lemke, 1992’’, ‘‘Lemke, 1995’’ aew not given
in the list. Please provide it in the reference list.
Q3 Reference is not given in the list. Please provide
it in the reference list.
Q4 Please provide the volume number and page
range.
Q5 Please provide the volume number and page
range.
Q6 Please provide the list of all the authors.
1 1 1 R I V E R S T R E E T, H O B O K E N, N J 0 7 0 3 0
ELECTRONIC PROOF CHECKLIST, J O U R N A L O F R E S E A R C H I N S C I E N C E T E A C H I N G
***IMMEDIATE RESPONSE REQUIRED***Please follow these instructions to avoid delay of publication.
READ PROOFS CAREFULLY• This will be your only chance to review these proofs.• Please note that the volume and page numbers shown on the proofs are for position only.
ANSWER ALL QUERIES ON PROOFS (Queries for you to answer are attached as the last page of your proof.)• Mark all corrections, including query answers, directly on the proofs, within the text. Note that excessive
author alterations may ultimately result in delay of publication and extra costs may be charged to you.
CHECK FIGURES AND TABLES CAREFULLY (Color figures will be sent under separate cover.)• Check size, numbering, and orientation of figures.• All images in the PDF are downsampled (reduced to lower resolution and file size) to facilitate Internet delivery.
These images will appear at higher resolution and sharpness in the printed article.• Review figure legends to ensure that they are complete.• Check all tables. Review layout, title, and footnotes.
RETURN PROOFS AND SIGNED COPYRIGHT TRANSFER AGREEMENT VIA EMAIL ONLY : SEE INSTRUCTION PAGE FOR SOFT PROOFING E-PROOFS*
1: RETURN CTA WITHIN 48 HOURS OF RECEIPT VIA SCANNED PDF FILE TO [email protected]
2: RETURN PROOF CORRECTIONS WITHIN 48 HOURS USING ADOBE ACROBAT NOTES TO [email protected]
*If you do not have access to Adobe Acrobat Notes tool, please
either (a) mark the proofs with black pen and scan into a pdf to send as an email attachment, or (b) send your corrections by marking up your original manuscript in a Word document file.
black pen and s NUMBER ON FAX
QUESTIONS? Alyson Linefsky, Senior Production EditorPhone: 201-748-6723E-mail: [email protected] to journal acronym and DOI number(i.e., TEA 20000 for The Journal of Research in Science Teaching ms 20000).
COMPLETE REPRINT ORDER FORM BY CLICKING ON THE LINK SHOWN ON THE REPRINT ORDER PAGE•
If no reprints are desired, please ignore this reprints page.
A. COPYRIGHT
1. The Contributor assigns to Wiley-Blackwell, during the full term of copy-right and any extensions or renewals, all copyright in and to the Contribution,and all rights therein, including but not limited to the right to publish, repub-lish, transmit, sell, distribute and otherwise use the Contribution in whole or inpart in electronic and print editions of the Journal and in derivative worksthroughout the world, in all languages and in all media of expression nowknown or later developed, and to license or permit others to do so.
2. Reproduction, posting, transmission or other distribution or use of the finalContribution in whole or in part in any medium by the Contributor as permit-ted by this Agreement requires a citation to the Journal and an appropriatecredit to Wiley-Blackwell as Publisher, and/or the Society if applicable, suitablein form and content as follows: (Title of Article, Author, Journal Title and Volume/Issue, Copyright © [year], copyright owner as specified in the Journal).Links to the final article on Wiley-Blackwell’s website are encouraged whereappropriate.
B. RETAINED RIGHTS
Notwithstanding the above, the Contributor or, if applicable, the Contributor’sEmployer, retains all proprietary rights other than copyright, such as patentrights, in any process, procedure or article of manufacture described in theContribution.
C. PERMITTED USES BY CONTRIBUTOR
1. Submitted Version. Wiley-Blackwell licenses back the following rights tothe Contributor in the version of the Contribution as originally submitted forpublication:
a. After publication of the final article, the right to self-archive on the Con-tributor’s personal website or in the Contributor’s institution’s/employer’sinstitutional repository or archive. This right extends to both intranets andthe Internet. The Contributor may not update the submission version orreplace it with the published Contribution. The version posted must containa legend as follows: This is the pre-peer reviewed version of the followingarticle: FULL CITE, which has been published in final form at [Link to finalarticle].
b. The right to transmit, print and share copies with colleagues.
2. Accepted Version. Re-use of the accepted and peer-reviewed (but notfinal) version of the Contribution shall be by separate agreement with Wiley-Blackwell. Wiley-Blackwell has agreements with certain funding agencies governing reuse of this version. The details of those relationships, and otherofferings allowing open web use, are set forth at the following website:http://www.wiley.com/go/funderstatement. NIH grantees should check thebox at the bottom of this document.
3. Final Published Version. Wiley-Blackwell hereby licenses back to the Contributor the following rights with respect to the final published version ofthe Contribution:
a. Copies for colleagues. The personal right of the Contributor only to sendor transmit individual copies of the final published version in any format tocolleagues upon their specific request provided no fee is charged, and further-provided that there is no systematic distribution of the Contribu-tion, e.g. posting on a listserve, website or automated delivery.
b. Re-use in other publications. The right to re-use the final Contribution orparts thereof for any publication authored or edited by the Contributor(excluding journal articles) where such re-used material constitutes lessthan half of the total material in such publication. In such case, any modifi-cations should be accurately noted.
c. Teaching duties. The right to include the Contribution in teaching ortraining duties at the Contributor’s institution/place of employment includ-ing in course packs, e-reserves, presentation at professional conferences,in-house training, or distance learning. The Contribution may not be usedin seminars outside of normal teaching obligations (e.g. commercial semi-nars). Electronic posting of the final published version in connection withteaching/training at the Contributor’s institution/place of employment ispermitted subject to the implementation of reasonable access controlmechanisms, such as user name and password. Posting the final publishedversion on the open Internet is not permitted.
d. Oral presentations. The right to make oral presentations based on theContribution.
4. Article Abstracts, Figures, Tables, Data Sets, Artwork and SelectedText (up to 250 words).
a. Contributors may re-use unmodified abstracts for any non-commercialpurpose. For on-line uses of the abstracts, Wiley-Blackwell encourages butdoes not require linking back to the final published versions.
b. Contributors may re-use figures, tables, data sets, artwork, and selectedtext up to 250 words from their Contributions, provided the following conditions are met:
(i) Full and accurate credit must be given to the Contribution.(ii) Modifications to the figures, tables and data must be noted.
Otherwise, no changes may be made.(iii) The reuse may not be made for direct commercial purposes, or for
financial consideration to the Contributor.(iv) Nothing herein shall permit dual publication in violation of journal
ethical practices.
COPYRIGHT TRANSFER AGREEMENT
Date: Contributor name:
Contributor address:
Manuscript number (Editorial office only):
Re: Manuscript entitled
(the “Contribution”)
for publication in (the “Journal”)
published by (“Wiley-Blackwell”).
Dear Contributor(s):Thank you for submitting your Contribution for publication. In order to expedite the editing and publishing process and enable Wiley-Blackwell to disseminate your Contribution to the fullest extent, we need to have this Copyright Transfer Agreement signed and returned as directed in the Journal’sinstructions for authors as soon as possible. If the Contribution is not accepted for publication, or if the Contribution is subsequently rejected, this Agreement shall be null and void. Publication cannot proceed without a signed copy of this Agreement.
CTA-A
D. CONTRIBUTIONS OWNED BY EMPLOYER
1. If the Contribution was written by the Contributor in the course of the Contributor’s employment (as a “work-made-for-hire” in the course ofemployment), the Contribution is owned by the company/employer whichmust sign this Agreement (in addition to the Contributor’s signature) in thespace provided below. In such case, the company/employer hereby assigns toWiley-Blackwell, during the full term of copyright, all copyright in and to theContribution for the full term of copyright throughout the world as specified inparagraph A above.
2. In addition to the rights specified as retained in paragraph B above and therights granted back to the Contributor pursuant to paragraph C above, Wiley-Blackwell hereby grants back, without charge, to such company/employer, itssubsidiaries and divisions, the right to make copies of and distribute the finalpublished Contribution internally in print format or electronically on the Com-pany’s internal network. Copies so used may not be resold or distributed externally.However the company/employer may include information and text from theContribution as part of an information package included with software orother products offered for sale or license or included in patent applications.Posting of the final published Contribution by the institution on a public accesswebsite may only be done with Wiley-Blackwell’s written permission, and paymentof any applicable fee(s). Also, upon payment of Wiley-Blackwell’s reprint fee,the institution may distribute print copies of the published Contribution externally.
E. GOVERNMENT CONTRACTS
In the case of a Contribution prepared under U.S. Government contract orgrant, the U.S. Government may reproduce, without charge, all or portions ofthe Contribution and may authorize others to do so, for official U.S. Govern-
ment purposes only, if the U.S. Government contract or grant so requires. (U.S.Government, U.K. Government, and other government employees: see notesat end)
F. COPYRIGHT NOTICE
The Contributor and the company/employer agree that any and all copies ofthe final published version of the Contribution or any part thereof distributedor posted by them in print or electronic format as permitted herein will includethe notice of copyright as stipulated in the Journal and a full citation to theJournal as published by Wiley-Blackwell.
G. CONTRIBUTOR’S REPRESENTATIONS
The Contributor represents that the Contribution is the Contributor’s originalwork, all individuals identified as Contributors actually contributed to the Con-tribution, and all individuals who contributed are included. If the Contributionwas prepared jointly, the Contributor agrees to inform the co-Contributors ofthe terms of this Agreement and to obtain their signature to this Agreement ortheir written permission to sign on their behalf. The Contribution is submittedonly to this Journal and has not been published before. (If excerpts from copy-righted works owned by third parties are included, the Contributor will obtainwritten permission from the copyright owners for all uses as set forth in Wiley-Blackwell’s permissions form or in the Journal’s Instructions for Contributors,and show credit to the sources in the Contribution.) The Contributor also warrants that the Contribution contains no libelous or unlawful statements,does not infringe upon the rights (including without limitation the copyright,patent or trademark rights) or the privacy of others, or contain material orinstructions that might cause harm or injury.
CHECK ONE BOX:
Contributor-owned work
Contributor’s signature Date
Type or print name and title
Co-contributor’s signature Date
Type or print name and title
Company/Institution-owned work
Company or Institution (Employer-for-Hire) Date
Authorized signature of Employer Date
U.S. Government work Note to U.S. Government EmployeesA contribution prepared by a U.S. federal government employee as part of the employee’s official duties, orwhich is an official U.S. Government publication, is called a “U.S. Government work,” and is in the publicdomain in the United States. In such case, the employee may cross out Paragraph A.1 but must sign (in theContributor’s signature line) and return this Agreement. If the Contribution was not prepared as part of theemployee’s duties or is not an official U.S. Government publication, it is not a U.S. Government work.
U.K. Government work Note to U.K. Government Employees(Crown Copyright) The rights in a Contribution prepared by an employee of a U.K. government department, agency or other
Crown body as part of his/her official duties, or which is an official government publication, belong to theCrown. U.K. government authors should submit a signed declaration form together with this Agreement.The form can be obtained via http://www.opsi.gov.uk/advice/crown-copyright/copyright-guidance/publication-of-articles-written-by-ministers-and-civil-servants.htm
Other Government work Note to Non-U.S., Non-U.K. Government EmployeesIf your status as a government employee legally prevents you from signing this Agreement, please contactthe editorial office.
NIH Grantees Note to NIH GranteesPursuant to NIH mandate, Wiley-Blackwell will post the accepted version of Contributions authored by NIHgrant-holders to PubMed Central upon acceptance. This accepted version will be made publicly available 12 months after publication. For further information, see www.wiley.com/go/nihmandate.
ATTACH ADDITIONAL SIGNATURE
PAGES AS NECESSARY
(made-for-hire in thecourse of employment)
CTA-A
THE JOURNAL OF RESEARCH IN SCIENCE TEACHING
JOHN WILEY & SONS, INC.1 1 1 R I V E R S T R E E T , H O B O K E N , N J 0 7 0 3 0
Telephone Number: 201 748-6723 • Facsimile Number: 201-748-6052
To: Alyson Linefsky
Company:
Phone: 201 748-6723
Fax: 201-748-6052
From:
Date:
Re: The Journal of Research In Science Teaching, ms # ( DOI number )
Message:
Dear
Ms.
Alyson
Linefsky,
Attached Please find CTA for MS #.................... . Please contact me should you
have any difficulty reading this Fax at the numbers below.
Office
Phone : Email
:
Fax:
Thank you,
_____________________
Additional reprint and journal issue purchases
Should you wish to purchase additional copies of your article, please click on the link and follow the instructions provided: https://caesar.sheridan.com/reprints/redir.php?pub=10089&acro=TEA Corresponding authors are invited to inform their co‐authors of the reprint options available.
Please note that regardless of the form in which they are acquired, reprints should not be resold, nor further disseminated in electronic form, nor deployed in part or in whole in any marketing, promotional or educational contexts without authorization from Wiley. Permissions requests should be directed to mailto: [email protected]
For information about ‘Pay‐Per‐View and Article Select’ click on the following link: http://wileyonlinelibrary.com/ppv
Softproofing for advanced Adobe Acrobat Users - NOTES toolNOTE: ACROBAT READER FROM THE INTERNET DOES NOT CONTAIN THE NOTES TOOL USED IN THIS PROCEDURE.
Acrobat annotation tools can be very useful for indicating changes to the PDF proof of your article.By using Acrobat annotation tools, a full digital pathway can be maintained for your page proofs.
The NOTES annotation tool can be used with either Adobe Acrobat 4.0, 5.0 or 6.0. Other annotation tools are also available in Acrobat 4.0, but this instruction sheet will concentrateon how to use the NOTES tool. Acrobat Reader, the free Internet download software from Adobe,DOES NOT contain the NOTES tool. In order to softproof using the NOTES tool you must havethe full software suite Adobe Acrobat 4.0, 5.0 or 6.0 installed on your computer.
Steps for Softproofing using Adobe Acrobat NOTES tool:
1. Open the PDF page proof of your article using either Adobe Acrobat 4.0, 5.0 or 6.0. Proofyour article on-screen or print a copy for markup of changes.
2. Go to File/Preferences/Annotations (in Acrobat 4.0) or Document/Add a Comment (in Acrobat6.0 and enter your name into the “default user” or “author” field. Also, set the font size at 9 or 10point.
3. When you have decided on the corrections to your article, select the NOTES tool from theAcrobat toolbox and click in the margin next to the text to be changed.
4. Enter your corrections into the NOTES text box window. Be sure to clearly indicate where thecorrection is to be placed and what text it will effect. If necessary to avoid confusion, you canuse your TEXT SELECTION tool to copy the text to be corrected and paste it into the NOTEStext box window. At this point, you can type the corrections directly into the NOTES textbox window. DO NOT correct the text by typing directly on the PDF page.
5. Go through your entire article using the NOTES tool as described in Step 4.
6. When you have completed the corrections to your article, go to File/Export/Annotations (inAcrobat 4.0) or Document/Add a Comment (in Acrobat 6.0).
7. When closing your article PDF be sure NOT to save changes to original file.
8. To make changes to a NOTES file you have exported, simply re-open the original PDFproof file, go to File/Import/Notes and import the NOTES file you saved. Make changes and re-export NOTES file keeping the same file name.
9. When complete, attach your NOTES file to a reply e-mail message. Be sure to include yourname, the date, and the title of the journal your article will be printed in.

Color figures were included with the final manuscript files that we received for your article. Because of the high cost of color printing, we can only print figures in color if authors cover the expense. Please indicate if you would like your figures to be printed in color or black and white. Color images will be reproduced online in Wiley Online Library at no charge, whether or not you opt for color printing.
Failure to return this form will result in the publication of your figures in black and white. JOURNAL
VOLUME
ISSUE
TITLE OF MANUSCRIPT
MS. NO.
NO. OF COLOR PAGES
AUTHOR(S)
No. Color Pages Color Charges No. Color Pages Color Charges No. Color Pages Color Charges
1 950 5 3400 9 5850 2 1450 6 3900 10 6350 3 1950 7 4400 11 6850 4 2450 8 4900 12 7350
***Please contact the Production Editor for a quote if you have more than 12 pages of color***
Please print my figures in black and white
Please print my figures in color $ **International orders must be paid in currency and drawn on a U.S. bank Please check one: Check enclosed Bill me Credit Card If credit card order, charge to: American Express Visa MasterCard Credit Card No
Signature Exp. Date
BILL TO: Purchase Name Order No. Institution Phone Address Fax E-mail


