Download - SMALL PROJECT ANALYSIS LEVEL ASSESSMENT

SMALL PROJECT ANALYSIS LEVEL ASSESSMENT The Nicholson Group
Multi-Family Residential Project APN 497-010-94
Bakersfield, CA
Prepared By:
Ronald W. Hunter – Managing Principal Consultant Matt Daniel – Senior Consultant
INSIGHT ENVIRONMENTAL / TRINITY CONSULTANTS 5500 Ming Avenue, Suite 140
Bakersfield, CA 93309 661-282-2200
September 2019
Project 190505.0195
Environmental solutions delivered uncommonly well

The Nicholson Group | Small Project Analysis Level Assessment Insight Environmental Consultants i
TABLE OF CONTENTS
1. EXECUTIVE SUMMARY 1-1 1.1. Executive Summary ................................................................................................................................................. 1-1 1.2. Statement of Finding ............................................................................................................................................... 1-1
2. PROJECT INFORMATION 2-1 2.1. Introduction ................................................................................................................................................................ 2-1 2.2. General Project Description ................................................................................................................................. 2-1
3. SMALL PROJECT ANALYSIS LEVEL QUALIFICATION 3-1
4. AIR QUALITY IMPACTS AND EVALUATION 4-1
5. PROJECT-RELATED EMISSIONS 5-1 5.1. Short-Term Emissions ............................................................................................................................................ 5-1 5.2. Long-Term Emissions .............................................................................................................................................. 5-1 5.3. Greenhouse Gas Emissions .................................................................................................................................... 5-2 5.4. Potential Impact on Sensitive Receptors ......................................................................................................... 5-3 5.5. Potential Impacts to Visibility to Nearby Class 1 Areas .............................................................................. 5-3 5.6. Potential Odor Impacts ........................................................................................................................................... 5-3 5.7. Ambient Air Quality Impacts ................................................................................................................................ 5-3 5.8. Toxic Air Contaminant (TAC) Impacts .............................................................................................................. 5-3
6. CONCLUSIONS 6-1
7. REFERENCES 7-1
APPENDIX A: CALEEMOD EMISSIONS ESTIMATES OUTPUT FILES A-1
The Nicholson Group | Small Project Analysis Level Assessment Insight Environmental Consultants ii
LIST OF FIGURES
Figure 2-1. Location in Bakersfield, CA 2-1

The Nicholson Group | Small Project Analysis Level Assessment Insight Environmental Consultants iii
LIST OF TABLES
Table 3-1. Small Project Analysis Level in Units for Residential 3-1
Table 4-1. SJVAPCD Air Quality Thresholds of Significance - Criteria Pollutants 4-1
Table 5-1. Construction Emission Levels 5-1
Table 5-2. Total Project Operational Emissions 5-2
Table 5-3. Estimated Annual Greenhouse Gas Emissions 5-2

The Nicholson Group | Small Project Analysis Level Assessment Insight Environmental Consultants 1-1
1. EXECUTIVE SUMMARY
1.1. EXECUTIVE SUMMARY
Insight Environmental Consultants, Inc., a Trinity Consultants Company, has completed a limited air quality assessment for a multi-family residential project to be located on APN 497-010-94 (Project) near the intersection of Panama Lane and Old River Road in Bakersfield, California. The 16.89 acre Project includes the construction of multi-family dwellings with a maximum of 126 duplex dwelling units.
This limited air quality assessment uses the San Joaquin Valley Air Pollution Control District’s (SJVAPCD) screening tool, Small Project Analysis Level (SPAL) (SJVAPCD 2017). This SPAL assessment was prepared pursuant to the SJVAPCD’s Guide for Assessing and Mitigating Air Quality Impacts (GAMAQI) (SJVAPCD 2015), the California Environmental Quality Act (CEQA) (Public Resources Code 21000 to 21177) and CEQA Guidelines
(California Code of Regulations Title 14, Division 6, Chapter 3, Sections 15000 – 15387).
1.2. STATEMENT OF FINDING
Based on the criteria established by the SJVAPCD’s GAMAQI, the emissions estimates prepared pursuant to this SPAL assessment do not exceed the SJVAPCD’s established emissions and significance thresholds for all CEQA air quality determinations; this Project would therefore not pose a significant impact to the San Joaquin Valley Air Basin and would have a less than significant air quality impact.

The Nicholson Group | Small Project Analysis Level Assessment Insight Environmental Consultants 2-1
2. PROJECT INFORMATION
2.1. INTRODUCTION
The Project site is located in the City of Bakersfield north of the intersection Panama Lane and Old River Road on APN 497-010-94 and includes the construction of multi-family dwellings with a maximum of 126 duplex dwelling units. The Project was assessed as if it would be developed in one phase. This assessment examines the projected gross impacts to air quality posed by this Project to the San Joaquin Valley Air Basin to determine whether or not the Project remains below established air quality thresholds of significance.
2.2. GENERAL PROJECT DESCRIPTION
The Project is located in the City of Bakersfield, California northeast of the intersection Panama Lane and Old River Road. Figure 2-1 depicts the Project location within the City of Bakersfield.
Figure 2-1. Location in Bakersfield, CA
Project Location

The Nicholson Group | Small Project Analysis Level Assessment Insight Environmental Consultants 3-1
3. SMALL PROJECT ANALYSIS LEVEL QUALIFICATION
This assessment was prepared pursuant to the SJVAPCD’s GAMAQI (SJVAPCD 2015), the CEQA (Public Resources Code 21000 to 21177) and CEQA Guidelines (California Code of Regulations Title 14, Division 6, Chapter 3, Sections 15000 – 15387). The SJVAPCD created the screening tool, SPAL, to streamline air quality assessments of commonly encountered projects. According to GAMAQI, the SJVAPCD “pre-calculated the emissions on a large number and types of projects to identify the level at which they have no possibility of exceeding emissions thresholds”1.
The SJVAPCD SPAL process established review parameters to determine whether a project qualifies as a “small project.” A project that is found to be “less than” the established parameters, according to the SPAL review parameters, has “no possibility of exceeding criteria pollutant emissions thresholds.” Table 3-1 presents the SPAL size parameters for residential projects.
Table 3-1. Small Project Analysis Level in Units for Residential
Land Use Category - Retail Project Size (Units)* Single Family 390
Apartments, Low Rise 590 Apartments, High Rise 600
Condominiums, General 590 Condominiums, High Rise 590
Mobile Homes 760 Retirement Community 880
Proposed Project – Condominiums 126 SPAL Exceeded? No
Notes: * Project size based on SPAL Table 5-3(a), as posted on SJVAPCD webpage:
http://www.valleyair.org/transportation/CEQA Rules/GAMAQI-SPAL.pdf
As shown in Table 3-1, the proposed Project would not exceed the established SPAL limits for a “Condominiums, General” multi-family residential project. The Project would construct duplexes with a maximum of 126 units compared to the allowable project size for a Condominiums General project which is 590 units. Based on the above information, this Project qualifies for a limited air quality analysis applying the SPAL
guidance to determine air quality impacts.
Table 3-2 presents the SPAL vehicle trip parameters for projects.
1 SJVAPCD GAMAQI, Section 8.3.4, Page 85.

The Nicholson Group | Small Project Analysis Level Assessment Insight Environmental Consultants 3-2
Table 3-2 Small Project Analysis Level in Vehicle Trips
Land Use Category Project Size (trips/day)*
Residential Housing 1,453
Commercial 1,673
Office 1,628
Institutional 1,707
Industrial 1,506
Proposed Project 733
SPAL Exceeded? NO
Notes: * Project size based on SPAL Table 5-3(d), as posted on SJVAPCD webpage: https://www.valleyair.org/transportation/CEQA%20Rules/SPALTables61912.pdf
As shown in Table 3-2, the proposed Project would not exceed the established SPAL vehicle trip limits for Residential Housing. The Project would generate 733 average daily trips compared to the allowable project vehicle trips for a residential housing projects which is 1,453 average daily trips. Based on the above information, this Project qualifies for a limited air quality analysis applying the SPAL guidance to determine air quality impacts.

The Nicholson Group | Small Project Analysis Level Assessment Insight Environmental Consultants 4-1
4. AIR QUALITY IMPACTS AND EVALUATION
Significance thresholds are based on the CEQA Appendix G Environmental Checklist Form (not included herein) and SJVAPCD air quality thresholds (SJVAPCD 2015). A potentially significant impact to air quality, as defined by the CEQA Checklist, would occur if the project caused one or more of the following to occur:
Conflict with or obstruct implementation of the applicable air quality plan; Violation of any air quality standard or substantial contribution to an existing or projected air quality
standard; A cumulatively considerable net increase of any criteria pollutant for which the project region is designated
non-attainment under an applicable Federal or state ambient air quality standard (including emissions which exceed quantitative thresholds for ozone precursors);
Exposure of sensitive receptors to substantial pollutant concentrations; and/or The creation of objectionable odors affecting a substantial number of people.
The SJVAPCD has identified quantitative emission thresholds to determine whether the potential air quality impacts of a project require analysis in an Environmental Impact Report. The SJVAPCD air quality thresholds from the GAMAQI are presented in Table 4-1 (SJVAPCD 2015). The SJVAPCD separates construction emissions from operational emissions for determining significance thresholds for air pollutant emissions.
Table 4-1. SJVAPCD Air Quality Thresholds of Significance - Criteria Pollutants
Pollutant/Precursor
Construction Emissions
Operational Emissions
Permitted Equipment and Activities
Non-Permitted Equipment and Activities
Emissions (tpy) Emissions (tpy) Emissions (tpy) CO 100 100 100
NOx 10 10 10 ROG 10 10 10 SOx 27 27 27
PM10 15 15 15
PM2.5 15 15 15 Source: SJVAPCD 2015
Criteria pollutant) emissions were estimated using the California Emissions Estimator Model (CalEEMod) version 2016.3.2 (California Air Pollution Control Officers Association (CAPCOA) 2016). This project would
generate short-term construction emissions and long-term operational emissions.
An air quality evaluation also considers: 1) exposure of sensitive receptors to substantial pollutant concentrations; and 2) the creation of objectionable odors affecting a substantial number of people. The criteria for this evaluation are based on the Lead Agency’s determination of the proximity of the proposed Project and the sensitive receptors. A sensitive receptor is a location where human populations, especially children, senior citizens and sick persons, are present, and where there is a reasonable expectation of continuous human exposure to pollutants, according to the averaging period for ambient air quality standards, i.e. the 24-hour, 8-hour or 1-hour standards. Commercial and industrial sources are not considered sensitive receptors.

The Nicholson Group | Small Project Analysis Level Assessment Insight Environmental Consultants 5-1
5. PROJECT-RELATED EMISSIONS
This document was prepared pursuant to the SJVAPCD’s GAMAQI and SPAL guidelines and provides a cursory review of the Project emissions to demonstrate that it would not exceed established air quality emissions thresholds.
5.1. SHORT-TERM EMISSIONS
Table 5-1 shows the construction emission levels using default CalEEMod factors for construction of a 126 unit multi-family residential project (see Attachment A) except for the following:
Project site acres was changed from the default to the actual acreage of the Project site.
Construction emission estimates also included the following SJVAPCD’s required measures for all projects:
Water exposed area 3 times per day; and Reduce vehicle speed to less than 15 miles per hour.
Based on these anticipated activity levels, the Project construction activities would not exceed construction thresholds (Table 4-1). Construction emissions therefore were found to be less than significant and no further evaluation is required.
Table 5-1. Construction Emission Levels
Emissions Source
Pollutant ROG NOx CO SOx PM10 PM2.5
(tons/year) 2019 Construction Emissions 0.10 1.12 0.68 0.001 0.14 0.09 2020 Construction Emissions 0.33 2.75 2.56 0.005 0.26 0.17 2021 Construction Emissions 1.24 0.45 0.48 0.001 0.04 0.03 SJVAPCD Construction Emissions Thresholds 10 10 100 27 15 15 Is Threshold Exceeded? No No No No No No
5.2. LONG-TERM EMISSIONS
Table 5-2 presents the Project’s long-term operations emissions generated from mobile, energy, and area sources as well as from water use and waste generation emissions. Most of these emissions impacts are from mobile sources traveling to and from the Project area. The following changes to default values were incorporated during the CalEEMod analysis:
Fleet mix was changed from the default to match the SJVAPCD’s residential fleet mix for year 2021.
Operational emission estimates also included the following mitigation measures even though the project was
less than significant before mitigation:
Improved walkability design; Improved Destination Accessibility;

The Nicholson Group | Small Project Analysis Level Assessment Insight Environmental Consultants 5-2
Improved pedestrian network; No hearths; and
Use electric lawnmower, leaf blower, and chainsaw (3% per SJVAPCD).
Table 5-2. Total Project Operational Emissions
Emissions Source
Pollutant ROG NOx CO SOx PM10 PM2.5
(tons/year) Unmitigated Operational Emissions 0.88 1.02 3.60 0.01 0.81 0.23 SJVAPCD Operational Emissions Thresholds – non-permitted sources
10 10 100 27 15 15
Is Threshold Exceeded Before Mitigation? No No No No No No Mitigated Operational Emissions 0.85 0.83 2.98 0.01 0.57 0.17 SJVAPCD Operational Emissions Thresholds – non-permitted sources
10 10 100 27 15 15
Is Threshold Exceeded? No No No No No No
As calculated (see Attachment A), the long-term operational (mobile) emissions associated with the proposed Project would be less than SJVAPCD significance threshold levels and would, therefore, not pose a significant impact to criteria air pollutants. This finding is consistent with the SPAL screening thresholds.
5.3. GREENHOUSE GAS EMISSIONS
The Project’s greenhouse gas (GHG) emissions are primarily from mobile source activities. Not all GHGs exhibit the same ability to induce climate change; as a result, GHG contributions are commonly quantified as carbon dioxide equivalents (CO2e) (see Attachment A). The proposed Project’s operational CO2e emissions were estimated using CalEEMod. These emissions are summarized in Table 5-3.
Table 5-3. Estimated Annual Greenhouse Gas Emissions
CO2 Emissions CH4 Emissions N2O Emissions CO2e Emissions metric tons metric tons metric tons metric tons
2021 Project Operations 945.57 1.01 0.01 974.00
2005 BAU 1,440.67 1.18 0.01 1,473.60
BAU less Project emissions 33.9%
The current inventory and forecast for GHG emissions in the California Air Resources Board’s 2008 Climate Change Scoping Plan supports the 2011 IPPC estimates. The 2008 Climate Change Scoping Plan also indicates that GHG emissions will increase to 596.41 million metric tons by 2020. It is widely understood that climate change is a “global” issue and, as such, GHG emissions are a cumulative problem and can only be evaluated as such.
The amount of CO2 that would be generated by the project is so small in relation to the California CO2 equivalent estimates for 2011 and 2020 (3,144.94 CO2e) that it’s not possible for the contribution of the project to be cumulatively considerable. Additionally, the Project’s GHG emissions are less than the 2005 business as usual emissions for the Project by 499.6 metric tons CO2e, which is a 33.9% reduction. Therefore, the project would not generate a cumulatively considerable GHG impact nor would it conflict with any applicable plan, policy or

The Nicholson Group | Small Project Analysis Level Assessment Insight Environmental Consultants 5-3
regulation adopted for the purpose of reducing the emissions of GHGs. The project will also not conflict with any elements of the California Air Resources Board’s 2008 Climate Change Scoping Plan. Therefore, this potential
impact is less than significant.
5.4. POTENTIAL IMPACT ON SENSITIVE RECEPTORS
The proposed Project is located near the northeastern corner of Panama Lane and Old River Road. Sensitive receptors are defined as areas where young children, chronically ill individuals, the elderly or people who are more sensitive than the general population reside. Schools, hospitals, nursing homes and daycare centers are locations where sensitive receptors would likely reside. The closest schools are Independence High School at 0.81 miles to the south and Sing Lum Elementary School at 0.89 miles to the north. The closest hospital is Mercy Hospital Southwest at 3.48 miles north and the closest daycare facilities are Harris Family Child Care at 0.92 miles northwest and Rosie’s 24 Hour Child Care 0.83 miles north of the Project. There are no other known
schools, hospitals, or nursing homes within a one mile radius of the Project.
Based on the predicted operational emissions and activity types, the proposed Project is not expected to affect sensitive receptors and is not expected to have any adverse impacts on any known sensitive receptor.
5.5. POTENTIAL IMPACTS TO VISIBILITY TO NEARBY CLASS 1 AREAS
It should be noted that visibility impact analyses are not usually conducted for area sources. The recommended analysis methodology was initially intended for stationary sources of emissions which were subject to the Prevention of Significant Deterioration (PSD) requirements in 40 CFR Part 60. Since the Project’s emissions are predicted to be significantly less than the PSD threshold levels, an impact at either the Dome Land Wilderness or the Sequoia National Park Areas (the two nearest Class 1 areas to the Project) is extremely unlikely. Therefore, based on the Project’s predicted emissions, the Project is not expected to have any adverse impact to visibility at any Class 1 Area.
5.6. POTENTIAL ODOR IMPACTS
The proposed Project is a multi-family development near other residential or multi-family developments. Residential neighborhoods and multi-family developments are not known to be a source of nuisance odors. The Project is therefore not anticipated to have substantial odor impacts. The Project is therefore anticipated to have a less than significant odor impact.
5.7. AMBIENT AIR QUALITY IMPACTS
Table 4 of GAMAQI (2015, p 96), SJVAPCD has developed SPAL screening thresholds for Ambient Air Quality Analyses (AAQA). Multi-family residential projects of less than 590 units would meet the screening threshold for an AAQA (SJVAPCD 2015). Because the proposed Project consists of 126 units, the proposed Project meets the SPAL screening threshold for an AAQA. This screening threshold level represents the activity levels which would not exceed AAQA significance criteria. The proposed Project’s AAQA impacts would therefore be less than
significant and no further impact analysis is required.
5.8. TOXIC AIR CONTAMINANT (TAC) IMPACTS
TACs, as defined by the California Health & Safety Code (CH&SC) §44321, are listed in Appendices AI and AII in AB 2588 Air Toxic “Hot Spots” and Assessment Act’s Emissions Inventory Criteria and Guideline Regulation document. SJVAPCD’s risk management objectives for permitting and CEQA are as follows:

The Nicholson Group | Small Project Analysis Level Assessment Insight Environmental Consultants 5-4
Minimize health risks from new and modified sources of air pollution. Health risks from new and modified sources shall not be significant relative to the background risk levels
and other risk levels that are typically accepted throughout the community. Avoid unreasonable restrictions on permitting.
The proposed Project is a multi-family residential Project and not expected to generate any TAC emissions. The Project would therefore not generate a health risk impact due to TAC emissions. Its potential health risk impacts would therefore be considered less than significant and no further health risk assessment is required.

The Nicholson Group | Small Project Analysis Level Assessment Insight Environmental Consultants 6-1
6. CONCLUSIONS
Based on the criteria established by the SJVAPCD’s GAMAQI and SPAL guidelines, the proposed Project does not meet the minimum standards to require a full Air Quality Impact Analysis. Furthermore, the Project as proposed would not exceed the SJVAPCD’s criteria air pollutant emission levels and would generate less than significant air quality impacts.
The Nicholson Group | Small Project Analysis Level Assessment Insight Environmental Consultants 7-1
7. REFERENCES
California Environmental Protection Agency, Air Toxics Hot Spots Program Risk Assessment Guidelines – The Air Toxics Hot Spots Program Guidance Manual for the Preparation of Health Risk Assessments, August 2003.
California Environmental Quality Act (CEQA). 2012. (Public Resources Code 21000 to 21177) and CEQA Guidelines (California Code of Regulations Title 14, Division 6, Chapter 3, Sections 15000 – 15387).
---------. 2009. CEQA, Appendix G – Environmental Checklist Form, Final Text.
California Air Pollution Control Officers Association (CAPCOA). 2016. California Emissions Estimator Model tm (CalEEMod), version 2016.3.2.
----------. 1997. “Air Toxics Hot Spots” Program Risk Assessment Guidelines, Revised 1992.
San Joaquin Valley Air Pollution Control District (SJVAPCD). 2009. Guidance for Valley Land-use Agencies in
Addressing GHG Emission Impacts for New Projects under CEQA. December 17, 2009.
-----------. 2015. Small Project Analysis Level. June 2012.
San Joaquin Valley Air Pollution Control District (SJVAPCD). 2015. Guidance for Assessing and Mitigating Air Quality Impacts (GAMAQI). March 19, 2015
-----------. 2017, Small Project Analysis Level (SPAL) Memorandum. March 1, 2017.

The Nicholson Group | Small Project Analysis Level Assessment Insight Environmental Consultants A-1
APPENDIX A: CALEEMOD EMISSIONS ESTIMATES OUTPUT FILES

Project Characteristics -
Land Use - Actual Lot Acreage
Construction Phase -
Fleet Mix - Year 2021 Residential Fleet Mix
Construction Off-road Equipment Mitigation -
Mobile Land Use Mitigation -
Area Mitigation -
1.1 Land Usage
Land Uses Size Metric Lot Acreage Floor Surface Area Population
Condo/Townhouse 126.00 Dwelling Unit 16.89 126,000.00 360
1.2 Other Project Characteristics
Urbanization
Climate Zone
Urban
3
Wind Speed (m/s) Precipitation Freq (Days)2.7 32
1.3 User Entered Comments & Non-Default Data
1.0 Project Characteristics
Utility Company Pacific Gas & Electric Company
2021Operational Year
CO2 Intensity (lb/MWhr)
641.35 0.029CH4 Intensity (lb/MWhr)
0.006N2O Intensity (lb/MWhr)
Nicholoson SPALKern-San Joaquin County, Annual
CalEEMod Version: CalEEMod.2016.3.2 Date: 9/12/2019 10:07 AMPage 1 of 34
Nicholoson SPAL - Kern-San Joaquin County, Annual

2.0 Emissions Summary
Table Name Column Name Default Value New Value
tblConstDustMitigation WaterUnpavedRoadVehicleSpeed 0 15
tblFleetMix HHD 0.15 0.02
tblFleetMix LDA 0.48 0.54
tblFleetMix LDT1 0.03 0.20
tblFleetMix LDT2 0.17 0.17
tblFleetMix LHD1 0.02 1.4000e-003
tblFleetMix LHD2 6.3210e-003 9.0000e-004
tblFleetMix MCY 5.9160e-003 2.6000e-003
tblFleetMix MDV 0.12 0.05
tblFleetMix MH 8.7700e-004 1.6000e-003
tblFleetMix MHD 0.02 9.0000e-003
tblFleetMix OBUS 1.6260e-003 0.00
tblFleetMix SBUS 9.5000e-004 9.0000e-004
tblFleetMix UBUS 1.7240e-003 4.4000e-003
tblLandUse LotAcreage 7.88 16.89
tblWoodstoves NumberCatalytic 16.89 0.00
tblWoodstoves NumberNoncatalytic 16.89 0.00
CalEEMod Version: CalEEMod.2016.3.2 Date: 9/12/2019 10:07 AMPage 2 of 34
Nicholoson SPAL - Kern-San Joaquin County, Annual

2.1 Overall Construction
ROG NOx CO SO2 Fugitive PM10
Exhaust PM10
PM10 Total
Fugitive PM2.5
Exhaust PM2.5
PM2.5 Total Bio- CO2 NBio- CO2 Total CO2 CH4 N2O CO2e
Year tons/yr MT/yr
2019 0.1028 1.1161 0.6828 1.2700e-003
0.2260 0.0516 0.2777 0.1051 0.0476 0.1527 0.0000 113.8331 113.8331 0.0338 0.0000 114.6780
2020 0.3305 2.7529 2.5559 4.9900e-003
0.1074 0.1482 0.2556 0.0288 0.1393 0.1681 0.0000 438.3727 438.3727 0.0800 0.0000 440.3736
2021 1.2348 0.4504 0.4763 8.9000e-004
0.0158 0.0232 0.0390 4.2200e-003
0.0218 0.0260 0.0000 78.0482 78.0482 0.0163 0.0000 78.4564
Maximum 1.2348 2.7529 2.5559 4.9900e-003
0.2260 0.1482 0.2777 0.1051 0.1393 0.1681 0.0000 438.3727 438.3727 0.0800 0.0000 440.3736
Unmitigated Construction
ROG NOx CO SO2 Fugitive PM10
Exhaust PM10
PM10 Total
Fugitive PM2.5
Exhaust PM2.5
PM2.5 Total Bio- CO2 NBio- CO2 Total CO2 CH4 N2O CO2e
Year tons/yr MT/yr
2019 0.1028 1.1161 0.6828 1.2700e-003
0.0916 0.0516 0.1432 0.0419 0.0476 0.0895 0.0000 113.8330 113.8330 0.0338 0.0000 114.6779
2020 0.3305 2.7529 2.5559 4.9900e-003
0.1074 0.1482 0.2556 0.0288 0.1393 0.1681 0.0000 438.3723 438.3723 0.0800 0.0000 440.3732
2021 1.2348 0.4504 0.4763 8.9000e-004
0.0158 0.0232 0.0390 4.2200e-003
0.0218 0.0260 0.0000 78.0481 78.0481 0.0163 0.0000 78.4563
Maximum 1.2348 2.7529 2.5559 4.9900e-003
0.1074 0.1482 0.2556 0.0419 0.1393 0.1681 0.0000 438.3723 438.3723 0.0800 0.0000 440.3732
Mitigated Construction
CalEEMod Version: CalEEMod.2016.3.2 Date: 9/12/2019 10:07 AMPage 3 of 34
Nicholoson SPAL - Kern-San Joaquin County, Annual

ROG NOx CO SO2 Fugitive PM10
Exhaust PM10
PM10 Total
Fugitive PM2.5
Exhaust PM2.5
PM2.5 Total
Bio- CO2 NBio-CO2 Total CO2 CH4 N20 CO2e
Percent Reduction
0.00 0.00 0.00 0.00 38.50 0.00 23.50 45.76 0.00 18.22 0.00 0.00 0.00 0.00 0.00 0.00
Quarter Start Date End Date Maximum Unmitigated ROG + NOX (tons/quarter) Maximum Mitigated ROG + NOX (tons/quarter)
1 10-1-2019 12-31-2019 1.2155 1.2155
2 1-1-2020 3-31-2020 0.7661 0.7661
3 4-1-2020 6-30-2020 0.7653 0.7653
4 7-1-2020 9-30-2020 0.7738 0.7738
5 10-1-2020 12-31-2020 0.7745 0.7745
6 1-1-2021 3-31-2021 1.1802 1.1802
7 4-1-2021 6-30-2021 0.5148 0.5148
Highest 1.2155 1.2155
CalEEMod Version: CalEEMod.2016.3.2 Date: 9/12/2019 10:07 AMPage 4 of 34
Nicholoson SPAL - Kern-San Joaquin County, Annual

2.2 Overall Operational
ROG NOx CO SO2 Fugitive PM10
Exhaust PM10
PM10 Total
Fugitive PM2.5
Exhaust PM2.5
PM2.5 Total Bio- CO2 NBio- CO2 Total CO2 CH4 N2O CO2e
Category tons/yr MT/yr
Area 0.6443 0.0580 0.9577 3.5000e-004
8.9800e-003
8.9800e-003
8.9800e-003
8.9800e-003
0.0000 56.1124 56.1124 2.5300e-003
1.0000e-003
56.4738
Energy 0.0122 0.1043 0.0444 6.7000e-004
8.4300e-003
8.4300e-003
8.4300e-003
8.4300e-003
0.0000 322.6962 322.6962 0.0114 4.1000e-003
324.2052
Mobile 0.2199 0.8541 2.6009 8.8700e-003
0.7833 7.6200e-003
0.7909 0.2096 7.1000e-003
0.2167 0.0000 813.7574 813.7574 0.0434 0.0000 814.8416
Waste 0.0000 0.0000 0.0000 0.0000 11.7654 0.0000 11.7654 0.6953 0.0000 29.1482
Water 0.0000 0.0000 0.0000 0.0000 2.6045 18.1923 20.7967 0.2683 6.4900e-003
29.4379
Total 0.8764 1.0163 3.6029 9.8900e-003
0.7833 0.0250 0.8083 0.2096 0.0245 0.2341 14.3698 1,210.7583
1,225.1281
1.0210 0.0116 1,254.1065
Unmitigated Operational
CalEEMod Version: CalEEMod.2016.3.2 Date: 9/12/2019 10:07 AMPage 5 of 34
Nicholoson SPAL - Kern-San Joaquin County, Annual

2.2 Overall Operational
ROG NOx CO SO2 Fugitive PM10
Exhaust PM10
PM10 Total
Fugitive PM2.5
Exhaust PM2.5
PM2.5 Total Bio- CO2 NBio- CO2 Total CO2 CH4 N2O CO2e
Category tons/yr MT/yr
Area 0.6384 0.0108 0.9308 5.0000e-005
5.1300e-003
5.1300e-003
5.1300e-003
5.1300e-003
0.0000 1.5145 1.5145 1.4600e-003
0.0000 1.5510
Energy 0.0122 0.1043 0.0444 6.7000e-004
8.4300e-003
8.4300e-003
8.4300e-003
8.4300e-003
0.0000 322.6962 322.6962 0.0114 4.1000e-003
324.2052
Mobile 0.2001 0.7113 2.0040 6.4100e-003
0.5516 5.6200e-003
0.5573 0.1476 5.2400e-003
0.1529 0.0000 588.7997 588.7997 0.0344 0.0000 589.6593
Waste 0.0000 0.0000 0.0000 0.0000 11.7654 0.0000 11.7654 0.6953 0.0000 29.1482
Water 0.0000 0.0000 0.0000 0.0000 2.6045 18.1923 20.7967 0.2683 6.4900e-003
29.4379
Total 0.8507 0.8263 2.9792 7.1300e-003
0.5516 0.0192 0.5708 0.1476 0.0188 0.1664 14.3698 931.2027 945.5725 1.0109 0.0106 974.0015
Mitigated Operational
3.0 Construction Detail
Construction Phase
ROG NOx CO SO2 Fugitive PM10
Exhaust PM10
PM10 Total
Fugitive PM2.5
Exhaust PM2.5
PM2.5 Total
Bio- CO2 NBio-CO2 Total CO2 CH4 N20 CO2e
Percent Reduction
2.94 18.70 17.31 27.91 29.57 23.37 29.38 29.58 23.30 28.91 0.00 23.09 22.82 0.99 8.63 22.34
CalEEMod Version: CalEEMod.2016.3.2 Date: 9/12/2019 10:07 AMPage 6 of 34
Nicholoson SPAL - Kern-San Joaquin County, Annual

Phase Number
Phase Name Phase Type Start Date End Date Num Days Week
Num Days Phase Description
1 Site Preparation Site Preparation 10/29/2019 11/11/2019 5 10
2 Grading Grading 11/12/2019 12/23/2019 5 30
3 Building Construction Building Construction 12/24/2019 2/15/2021 5 300
4 Paving Paving 2/16/2021 3/15/2021 5 20
5 Architectural Coating Architectural Coating 3/16/2021 4/12/2021 5 20
OffRoad Equipment
Residential Indoor: 255,150; Residential Outdoor: 85,050; Non-Residential Indoor: 0; Non-Residential Outdoor: 0; Striped Parking Area: 0 (Architectural Coating – sqft)
Acres of Grading (Site Preparation Phase): 0
Acres of Grading (Grading Phase): 75
Acres of Paving: 0
CalEEMod Version: CalEEMod.2016.3.2 Date: 9/12/2019 10:07 AMPage 7 of 34
Nicholoson SPAL - Kern-San Joaquin County, Annual

Phase Name Offroad Equipment Type Amount Usage Hours Horse Power Load Factor
Architectural Coating Air Compressors 1 6.00 78 0.48
Grading Excavators 2 8.00 158 0.38
Building Construction Cranes 1 7.00 231 0.29
Building Construction Forklifts 3 8.00 89 0.20
Building Construction Generator Sets 1 8.00 84 0.74
Paving Pavers 2 8.00 130 0.42
Paving Rollers 2 8.00 80 0.38
Grading Rubber Tired Dozers 1 8.00 247 0.40
Building Construction Tractors/Loaders/Backhoes 3 7.00 97 0.37
Grading Graders 1 8.00 187 0.41
Grading Tractors/Loaders/Backhoes 2 8.00 97 0.37
Paving Paving Equipment 2 8.00 132 0.36
Site Preparation Tractors/Loaders/Backhoes 4 8.00 97 0.37
Site Preparation Rubber Tired Dozers 3 8.00 247 0.40
Grading Scrapers 2 8.00 367 0.48
Building Construction Welders 1 8.00 46 0.45
Trips and VMT
Phase Name Offroad Equipment Count
Worker Trip Number
Vendor Trip Number
Hauling Trip Number
Worker Trip Length
Vendor Trip Length
Hauling Trip Length
Worker Vehicle Class
Vendor Vehicle Class
Hauling Vehicle Class
Architectural Coating 1 18.00 0.00 0.00 10.80 7.30 20.00 LD_Mix HDT_Mix HHDT
Building Construction 9 91.00 13.00 0.00 10.80 7.30 20.00 LD_Mix HDT_Mix HHDT
Grading 8 20.00 0.00 0.00 10.80 7.30 20.00 LD_Mix HDT_Mix HHDT
Paving 6 15.00 0.00 0.00 10.80 7.30 20.00 LD_Mix HDT_Mix HHDT
Site Preparation 7 18.00 0.00 0.00 10.80 7.30 20.00 LD_Mix HDT_Mix HHDT
CalEEMod Version: CalEEMod.2016.3.2 Date: 9/12/2019 10:07 AMPage 8 of 34
Nicholoson SPAL - Kern-San Joaquin County, Annual
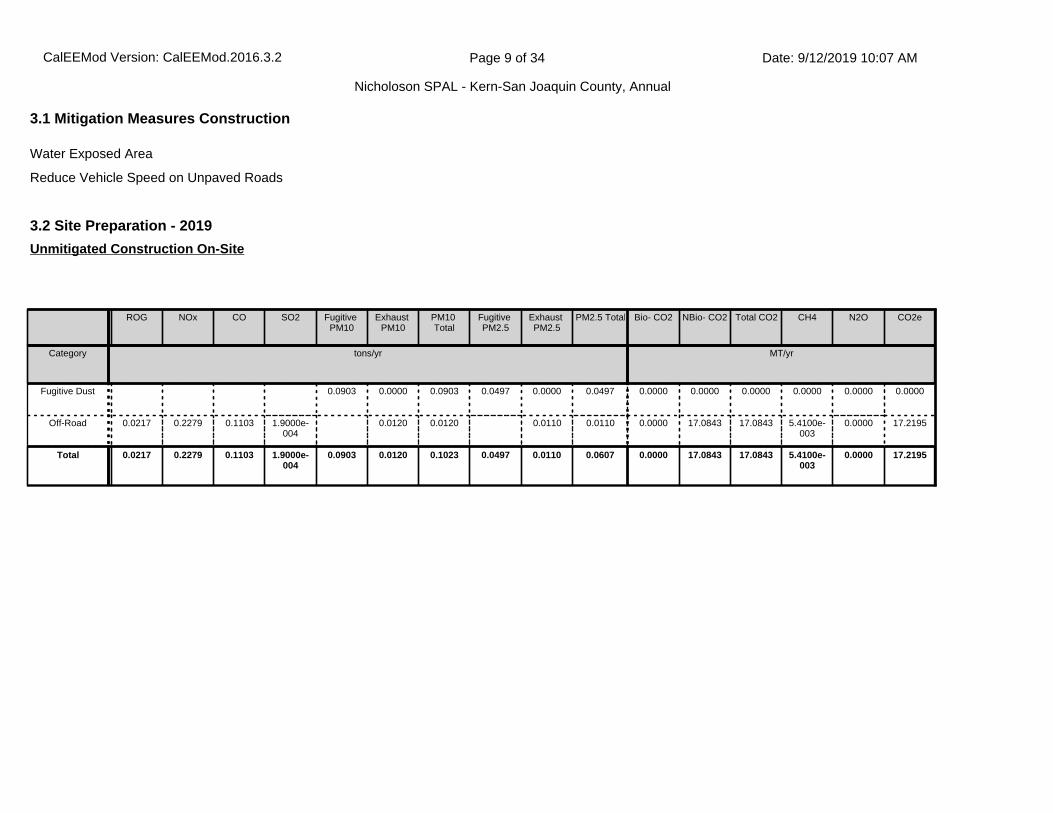
3.2 Site Preparation - 2019
ROG NOx CO SO2 Fugitive PM10
Exhaust PM10
PM10 Total
Fugitive PM2.5
Exhaust PM2.5
PM2.5 Total Bio- CO2 NBio- CO2 Total CO2 CH4 N2O CO2e
Category tons/yr MT/yr
Fugitive Dust 0.0903 0.0000 0.0903 0.0497 0.0000 0.0497 0.0000 0.0000 0.0000 0.0000 0.0000 0.0000
Off-Road 0.0217 0.2279 0.1103 1.9000e-004
0.0120 0.0120 0.0110 0.0110 0.0000 17.0843 17.0843 5.4100e-003
0.0000 17.2195
Total 0.0217 0.2279 0.1103 1.9000e-004
0.0903 0.0120 0.1023 0.0497 0.0110 0.0607 0.0000 17.0843 17.0843 5.4100e-003
0.0000 17.2195
Unmitigated Construction On-Site
3.1 Mitigation Measures Construction
Water Exposed Area
Reduce Vehicle Speed on Unpaved Roads
CalEEMod Version: CalEEMod.2016.3.2 Date: 9/12/2019 10:07 AMPage 9 of 34
Nicholoson SPAL - Kern-San Joaquin County, Annual
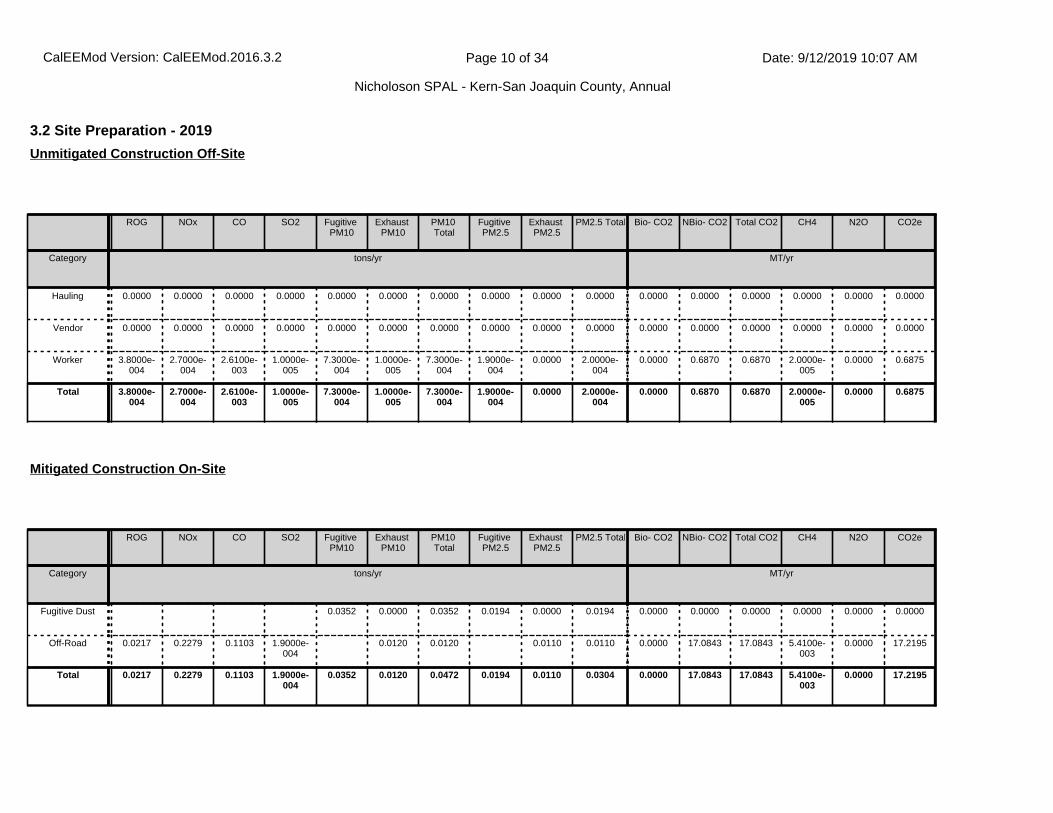
3.2 Site Preparation - 2019
ROG NOx CO SO2 Fugitive PM10
Exhaust PM10
PM10 Total
Fugitive PM2.5
Exhaust PM2.5
PM2.5 Total Bio- CO2 NBio- CO2 Total CO2 CH4 N2O CO2e
Category tons/yr MT/yr
Hauling 0.0000 0.0000 0.0000 0.0000 0.0000 0.0000 0.0000 0.0000 0.0000 0.0000 0.0000 0.0000 0.0000 0.0000 0.0000 0.0000
Vendor 0.0000 0.0000 0.0000 0.0000 0.0000 0.0000 0.0000 0.0000 0.0000 0.0000 0.0000 0.0000 0.0000 0.0000 0.0000 0.0000
Worker 3.8000e-004
2.7000e-004
2.6100e-003
1.0000e-005
7.3000e-004
1.0000e-005
7.3000e-004
1.9000e-004
0.0000 2.0000e-004
0.0000 0.6870 0.6870 2.0000e-005
0.0000 0.6875
Total 3.8000e-004
2.7000e-004
2.6100e-003
1.0000e-005
7.3000e-004
1.0000e-005
7.3000e-004
1.9000e-004
0.0000 2.0000e-004
0.0000 0.6870 0.6870 2.0000e-005
0.0000 0.6875
Unmitigated Construction Off-Site
ROG NOx CO SO2 Fugitive PM10
Exhaust PM10
PM10 Total
Fugitive PM2.5
Exhaust PM2.5
PM2.5 Total Bio- CO2 NBio- CO2 Total CO2 CH4 N2O CO2e
Category tons/yr MT/yr
Fugitive Dust 0.0352 0.0000 0.0352 0.0194 0.0000 0.0194 0.0000 0.0000 0.0000 0.0000 0.0000 0.0000
Off-Road 0.0217 0.2279 0.1103 1.9000e-004
0.0120 0.0120 0.0110 0.0110 0.0000 17.0843 17.0843 5.4100e-003
0.0000 17.2195
Total 0.0217 0.2279 0.1103 1.9000e-004
0.0352 0.0120 0.0472 0.0194 0.0110 0.0304 0.0000 17.0843 17.0843 5.4100e-003
0.0000 17.2195
Mitigated Construction On-Site
CalEEMod Version: CalEEMod.2016.3.2 Date: 9/12/2019 10:07 AMPage 10 of 34
Nicholoson SPAL - Kern-San Joaquin County, Annual

3.2 Site Preparation - 2019
ROG NOx CO SO2 Fugitive PM10
Exhaust PM10
PM10 Total
Fugitive PM2.5
Exhaust PM2.5
PM2.5 Total Bio- CO2 NBio- CO2 Total CO2 CH4 N2O CO2e
Category tons/yr MT/yr
Hauling 0.0000 0.0000 0.0000 0.0000 0.0000 0.0000 0.0000 0.0000 0.0000 0.0000 0.0000 0.0000 0.0000 0.0000 0.0000 0.0000
Vendor 0.0000 0.0000 0.0000 0.0000 0.0000 0.0000 0.0000 0.0000 0.0000 0.0000 0.0000 0.0000 0.0000 0.0000 0.0000 0.0000
Worker 3.8000e-004
2.7000e-004
2.6100e-003
1.0000e-005
7.3000e-004
1.0000e-005
7.3000e-004
1.9000e-004
0.0000 2.0000e-004
0.0000 0.6870 0.6870 2.0000e-005
0.0000 0.6875
Total 3.8000e-004
2.7000e-004
2.6100e-003
1.0000e-005
7.3000e-004
1.0000e-005
7.3000e-004
1.9000e-004
0.0000 2.0000e-004
0.0000 0.6870 0.6870 2.0000e-005
0.0000 0.6875
Mitigated Construction Off-Site
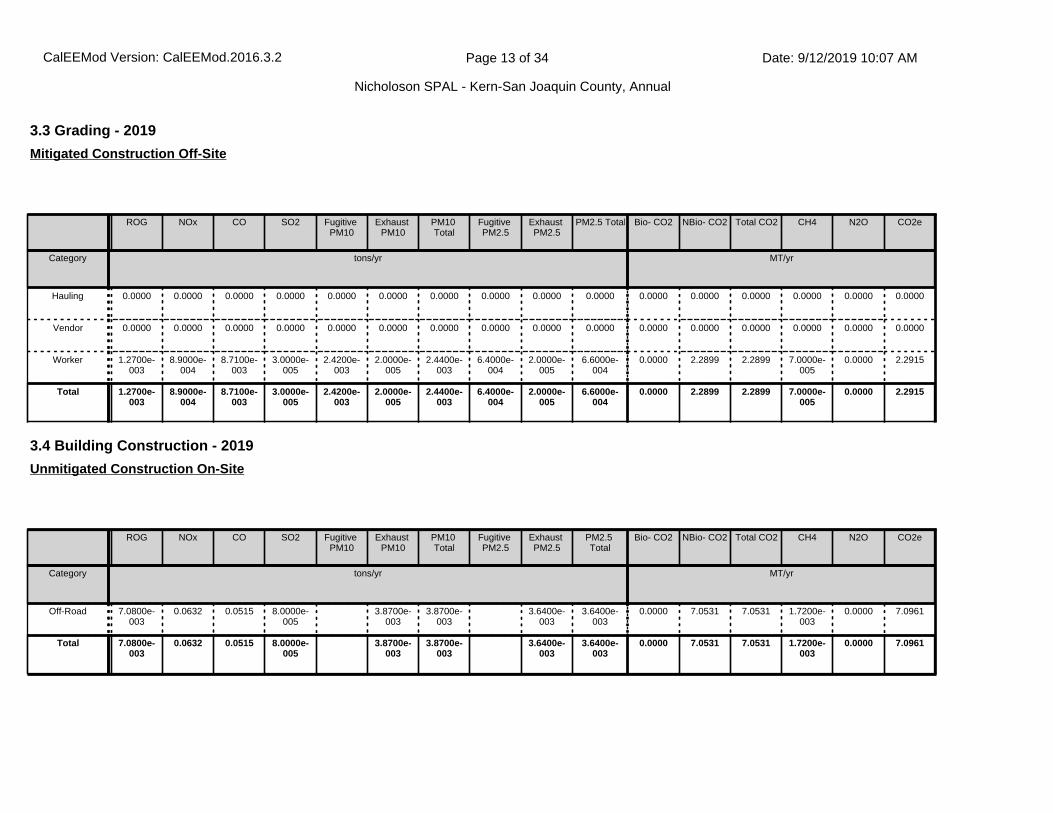
3.3 Grading - 2019
ROG NOx CO SO2 Fugitive PM10
Exhaust PM10
PM10 Total
Fugitive PM2.5
Exhaust PM2.5
PM2.5 Total Bio- CO2 NBio- CO2 Total CO2 CH4 N2O CO2e
Category tons/yr MT/yr
Fugitive Dust 0.1301 0.0000 0.1301 0.0540 0.0000 0.0540 0.0000 0.0000 0.0000 0.0000 0.0000 0.0000
Off-Road 0.0711 0.8178 0.5007 9.3000e-004
0.0357 0.0357 0.0329 0.0329 0.0000 83.5520 83.5520 0.0264 0.0000 84.2129
Total 0.0711 0.8178 0.5007 9.3000e-004
0.1301 0.0357 0.1658 0.0540 0.0329 0.0868 0.0000 83.5520 83.5520 0.0264 0.0000 84.2129
Unmitigated Construction On-Site
CalEEMod Version: CalEEMod.2016.3.2 Date: 9/12/2019 10:07 AMPage 11 of 34
Nicholoson SPAL - Kern-San Joaquin County, Annual

3.3 Grading - 2019
ROG NOx CO SO2 Fugitive PM10
Exhaust PM10
PM10 Total
Fugitive PM2.5
Exhaust PM2.5
PM2.5 Total Bio- CO2 NBio- CO2 Total CO2 CH4 N2O CO2e
Category tons/yr MT/yr
Hauling 0.0000 0.0000 0.0000 0.0000 0.0000 0.0000 0.0000 0.0000 0.0000 0.0000 0.0000 0.0000 0.0000 0.0000 0.0000 0.0000
Vendor 0.0000 0.0000 0.0000 0.0000 0.0000 0.0000 0.0000 0.0000 0.0000 0.0000 0.0000 0.0000 0.0000 0.0000 0.0000 0.0000
Worker 1.2700e-003
8.9000e-004
8.7100e-003
3.0000e-005
2.4200e-003
2.0000e-005
2.4400e-003
6.4000e-004
2.0000e-005
6.6000e-004
0.0000 2.2899 2.2899 7.0000e-005
0.0000 2.2915
Total 1.2700e-003
8.9000e-004
8.7100e-003
3.0000e-005
2.4200e-003
2.0000e-005
2.4400e-003
6.4000e-004
2.0000e-005
6.6000e-004
0.0000 2.2899 2.2899 7.0000e-005
0.0000 2.2915
Unmitigated Construction Off-Site
ROG NOx CO SO2 Fugitive PM10
Exhaust PM10
PM10 Total
Fugitive PM2.5
Exhaust PM2.5
PM2.5 Total Bio- CO2 NBio- CO2 Total CO2 CH4 N2O CO2e
Category tons/yr MT/yr
Fugitive Dust 0.0507 0.0000 0.0507 0.0210 0.0000 0.0210 0.0000 0.0000 0.0000 0.0000 0.0000 0.0000
Off-Road 0.0711 0.8178 0.5007 9.3000e-004
0.0357 0.0357 0.0329 0.0329 0.0000 83.5519 83.5519 0.0264 0.0000 84.2128
Total 0.0711 0.8178 0.5007 9.3000e-004
0.0507 0.0357 0.0865 0.0210 0.0329 0.0539 0.0000 83.5519 83.5519 0.0264 0.0000 84.2128
Mitigated Construction On-Site
CalEEMod Version: CalEEMod.2016.3.2 Date: 9/12/2019 10:07 AMPage 12 of 34
Nicholoson SPAL - Kern-San Joaquin County, Annual
3.3 Grading - 2019
ROG NOx CO SO2 Fugitive PM10
Exhaust PM10
PM10 Total
Fugitive PM2.5
Exhaust PM2.5
PM2.5 Total Bio- CO2 NBio- CO2 Total CO2 CH4 N2O CO2e
Category tons/yr MT/yr
Hauling 0.0000 0.0000 0.0000 0.0000 0.0000 0.0000 0.0000 0.0000 0.0000 0.0000 0.0000 0.0000 0.0000 0.0000 0.0000 0.0000
Vendor 0.0000 0.0000 0.0000 0.0000 0.0000 0.0000 0.0000 0.0000 0.0000 0.0000 0.0000 0.0000 0.0000 0.0000 0.0000 0.0000
Worker 1.2700e-003
8.9000e-004
8.7100e-003
3.0000e-005
2.4200e-003
2.0000e-005
2.4400e-003
6.4000e-004
2.0000e-005
6.6000e-004
0.0000 2.2899 2.2899 7.0000e-005
0.0000 2.2915
Total 1.2700e-003
8.9000e-004
8.7100e-003
3.0000e-005
2.4200e-003
2.0000e-005
2.4400e-003
6.4000e-004
2.0000e-005
6.6000e-004
0.0000 2.2899 2.2899 7.0000e-005
0.0000 2.2915
Mitigated Construction Off-Site
3.4 Building Construction - 2019
ROG NOx CO SO2 Fugitive PM10
Exhaust PM10
PM10 Total
Fugitive PM2.5
Exhaust PM2.5
PM2.5 Total
Bio- CO2 NBio- CO2 Total CO2 CH4 N2O CO2e
Category tons/yr MT/yr
Off-Road 7.0800e-003
0.0632 0.0515 8.0000e-005
3.8700e-003
3.8700e-003
3.6400e-003
3.6400e-003
0.0000 7.0531 7.0531 1.7200e-003
0.0000 7.0961
Total 7.0800e-003
0.0632 0.0515 8.0000e-005
3.8700e-003
3.8700e-003
3.6400e-003
3.6400e-003
0.0000 7.0531 7.0531 1.7200e-003
0.0000 7.0961
Unmitigated Construction On-Site
CalEEMod Version: CalEEMod.2016.3.2 Date: 9/12/2019 10:07 AMPage 13 of 34
Nicholoson SPAL - Kern-San Joaquin County, Annual

3.4 Building Construction - 2019
ROG NOx CO SO2 Fugitive PM10
Exhaust PM10
PM10 Total
Fugitive PM2.5
Exhaust PM2.5
PM2.5 Total Bio- CO2 NBio- CO2 Total CO2 CH4 N2O CO2e
Category tons/yr MT/yr
Hauling 0.0000 0.0000 0.0000 0.0000 0.0000 0.0000 0.0000 0.0000 0.0000 0.0000 0.0000 0.0000 0.0000 0.0000 0.0000 0.0000
Vendor 1.9000e-004
5.2300e-003
1.0500e-003
1.0000e-005
2.6000e-004
4.0000e-005
3.0000e-004
8.0000e-005
4.0000e-005
1.1000e-004
0.0000 1.0830 1.0830 9.0000e-005
0.0000 1.0853
Worker 1.1600e-003
8.1000e-004
7.9300e-003
2.0000e-005
2.2000e-003
2.0000e-005
2.2200e-003
5.8000e-004
1.0000e-005
6.0000e-004
0.0000 2.0838 2.0838 6.0000e-005
0.0000 2.0853
Total 1.3500e-003
6.0400e-003
8.9800e-003
3.0000e-005
2.4600e-003
6.0000e-005
2.5200e-003
6.6000e-004
5.0000e-005
7.1000e-004
0.0000 3.1668 3.1668 1.5000e-004
0.0000 3.1706
Unmitigated Construction Off-Site
ROG NOx CO SO2 Fugitive PM10
Exhaust PM10
PM10 Total
Fugitive PM2.5
Exhaust PM2.5
PM2.5 Total Bio- CO2 NBio- CO2 Total CO2 CH4 N2O CO2e
Category tons/yr MT/yr
Off-Road 7.0800e-003
0.0632 0.0515 8.0000e-005
3.8700e-003
3.8700e-003
3.6400e-003
3.6400e-003
0.0000 7.0531 7.0531 1.7200e-003
0.0000 7.0961
Total 7.0800e-003
0.0632 0.0515 8.0000e-005
3.8700e-003
3.8700e-003
3.6400e-003
3.6400e-003
0.0000 7.0531 7.0531 1.7200e-003
0.0000 7.0961
Mitigated Construction On-Site
CalEEMod Version: CalEEMod.2016.3.2 Date: 9/12/2019 10:07 AMPage 14 of 34
Nicholoson SPAL - Kern-San Joaquin County, Annual

3.4 Building Construction - 2019
ROG NOx CO SO2 Fugitive PM10
Exhaust PM10
PM10 Total
Fugitive PM2.5
Exhaust PM2.5
PM2.5 Total Bio- CO2 NBio- CO2 Total CO2 CH4 N2O CO2e
Category tons/yr MT/yr
Hauling 0.0000 0.0000 0.0000 0.0000 0.0000 0.0000 0.0000 0.0000 0.0000 0.0000 0.0000 0.0000 0.0000 0.0000 0.0000 0.0000
Vendor 1.9000e-004
5.2300e-003
1.0500e-003
1.0000e-005
2.6000e-004
4.0000e-005
3.0000e-004
8.0000e-005
4.0000e-005
1.1000e-004
0.0000 1.0830 1.0830 9.0000e-005
0.0000 1.0853
Worker 1.1600e-003
8.1000e-004
7.9300e-003
2.0000e-005
2.2000e-003
2.0000e-005
2.2200e-003
5.8000e-004
1.0000e-005
6.0000e-004
0.0000 2.0838 2.0838 6.0000e-005
0.0000 2.0853
Total 1.3500e-003
6.0400e-003
8.9800e-003
3.0000e-005
2.4600e-003
6.0000e-005
2.5200e-003
6.6000e-004
5.0000e-005
7.1000e-004
0.0000 3.1668 3.1668 1.5000e-004
0.0000 3.1706
Mitigated Construction Off-Site
3.4 Building Construction - 2020
ROG NOx CO SO2 Fugitive PM10
Exhaust PM10
PM10 Total
Fugitive PM2.5
Exhaust PM2.5
PM2.5 Total Bio- CO2 NBio- CO2 Total CO2 CH4 N2O CO2e
Category tons/yr MT/yr
Off-Road 0.2777 2.5134 2.2072 3.5300e-003
0.1463 0.1463 0.1376 0.1376 0.0000 303.4091 303.4091 0.0740 0.0000 305.2596
Total 0.2777 2.5134 2.2072 3.5300e-003
0.1463 0.1463 0.1376 0.1376 0.0000 303.4091 303.4091 0.0740 0.0000 305.2596
Unmitigated Construction On-Site
CalEEMod Version: CalEEMod.2016.3.2 Date: 9/12/2019 10:07 AMPage 15 of 34
Nicholoson SPAL - Kern-San Joaquin County, Annual

3.4 Building Construction - 2020
ROG NOx CO SO2 Fugitive PM10
Exhaust PM10
PM10 Total
Fugitive PM2.5
Exhaust PM2.5
PM2.5 Total Bio- CO2 NBio- CO2 Total CO2 CH4 N2O CO2e
Category tons/yr MT/yr
Hauling 0.0000 0.0000 0.0000 0.0000 0.0000 0.0000 0.0000 0.0000 0.0000 0.0000 0.0000 0.0000 0.0000 0.0000 0.0000 0.0000
Vendor 6.9000e-003
0.2085 0.0403 4.9000e-004
0.0114 1.1700e-003
0.0125 3.2800e-003
1.1200e-003
4.4000e-003
0.0000 46.8740 46.8740 3.7400e-003
0.0000 46.9676
Worker 0.0459 0.0310 0.3084 9.7000e-004
0.0961 6.8000e-004
0.0967 0.0255 6.3000e-004
0.0261 0.0000 88.0897 88.0897 2.2700e-003
0.0000 88.1464
Total 0.0528 0.2396 0.3488 1.4600e-003
0.1074 1.8500e-003
0.1093 0.0288 1.7500e-003
0.0305 0.0000 134.9636 134.9636 6.0100e-003
0.0000 135.1140
Unmitigated Construction Off-Site
ROG NOx CO SO2 Fugitive PM10
Exhaust PM10
PM10 Total
Fugitive PM2.5
Exhaust PM2.5
PM2.5 Total Bio- CO2 NBio- CO2 Total CO2 CH4 N2O CO2e
Category tons/yr MT/yr
Off-Road 0.2777 2.5134 2.2072 3.5300e-003
0.1463 0.1463 0.1376 0.1376 0.0000 303.4087 303.4087 0.0740 0.0000 305.2592
Total 0.2777 2.5134 2.2072 3.5300e-003
0.1463 0.1463 0.1376 0.1376 0.0000 303.4087 303.4087 0.0740 0.0000 305.2592
Mitigated Construction On-Site
CalEEMod Version: CalEEMod.2016.3.2 Date: 9/12/2019 10:07 AMPage 16 of 34
Nicholoson SPAL - Kern-San Joaquin County, Annual

3.4 Building Construction - 2020
ROG NOx CO SO2 Fugitive PM10
Exhaust PM10
PM10 Total
Fugitive PM2.5
Exhaust PM2.5
PM2.5 Total Bio- CO2 NBio- CO2 Total CO2 CH4 N2O CO2e
Category tons/yr MT/yr
Hauling 0.0000 0.0000 0.0000 0.0000 0.0000 0.0000 0.0000 0.0000 0.0000 0.0000 0.0000 0.0000 0.0000 0.0000 0.0000 0.0000
Vendor 6.9000e-003
0.2085 0.0403 4.9000e-004
0.0114 1.1700e-003
0.0125 3.2800e-003
1.1200e-003
4.4000e-003
0.0000 46.8740 46.8740 3.7400e-003
0.0000 46.9676
Worker 0.0459 0.0310 0.3084 9.7000e-004
0.0961 6.8000e-004
0.0967 0.0255 6.3000e-004
0.0261 0.0000 88.0897 88.0897 2.2700e-003
0.0000 88.1464
Total 0.0528 0.2396 0.3488 1.4600e-003
0.1074 1.8500e-003
0.1093 0.0288 1.7500e-003
0.0305 0.0000 134.9636 134.9636 6.0100e-003
0.0000 135.1140
Mitigated Construction Off-Site
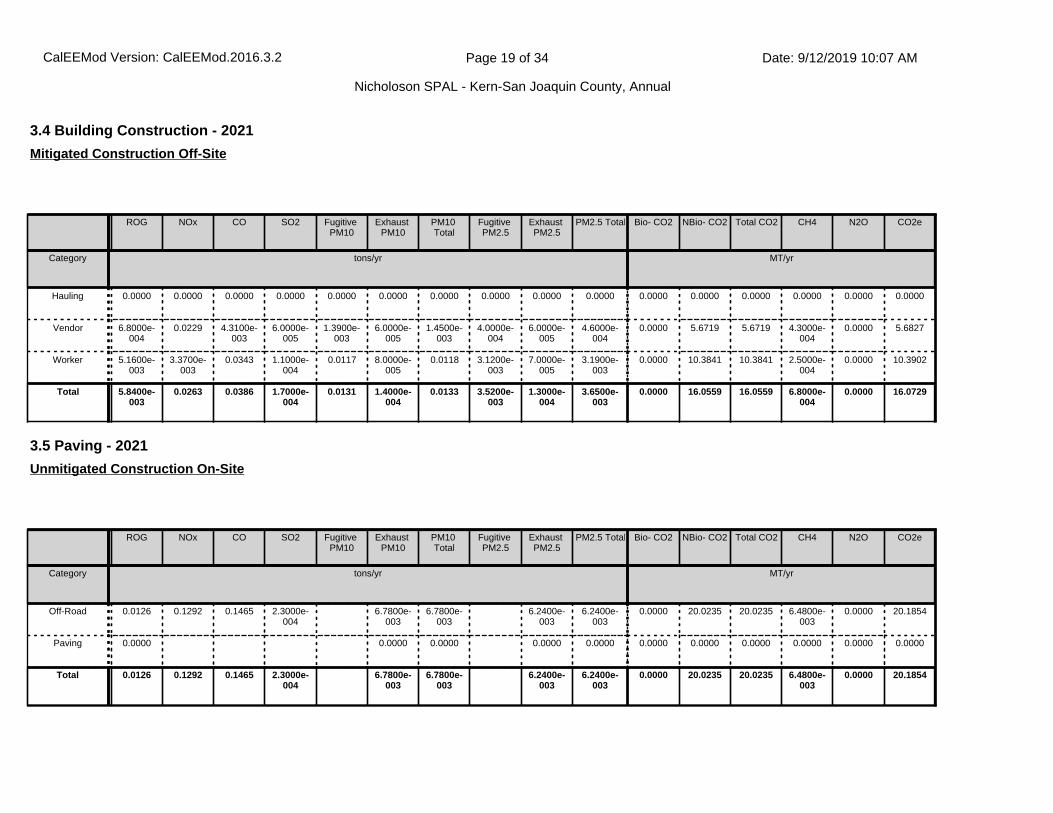
3.4 Building Construction - 2021
ROG NOx CO SO2 Fugitive PM10
Exhaust PM10
PM10 Total
Fugitive PM2.5
Exhaust PM2.5
PM2.5 Total Bio- CO2 NBio- CO2 Total CO2 CH4 N2O CO2e
Category tons/yr MT/yr
Off-Road 0.0304 0.2789 0.2652 4.3000e-004
0.0153 0.0153 0.0144 0.0144 0.0000 37.0620 37.0620 8.9400e-003
0.0000 37.2855
Total 0.0304 0.2789 0.2652 4.3000e-004
0.0153 0.0153 0.0144 0.0144 0.0000 37.0620 37.0620 8.9400e-003
0.0000 37.2855
Unmitigated Construction On-Site
CalEEMod Version: CalEEMod.2016.3.2 Date: 9/12/2019 10:07 AMPage 17 of 34
Nicholoson SPAL - Kern-San Joaquin County, Annual

3.4 Building Construction - 2021
ROG NOx CO SO2 Fugitive PM10
Exhaust PM10
PM10 Total
Fugitive PM2.5
Exhaust PM2.5
PM2.5 Total Bio- CO2 NBio- CO2 Total CO2 CH4 N2O CO2e
Category tons/yr MT/yr
Hauling 0.0000 0.0000 0.0000 0.0000 0.0000 0.0000 0.0000 0.0000 0.0000 0.0000 0.0000 0.0000 0.0000 0.0000 0.0000 0.0000
Vendor 6.8000e-004
0.0229 4.3100e-003
6.0000e-005
1.3900e-003
6.0000e-005
1.4500e-003
4.0000e-004
6.0000e-005
4.6000e-004
0.0000 5.6719 5.6719 4.3000e-004
0.0000 5.6827
Worker 5.1600e-003
3.3700e-003
0.0343 1.1000e-004
0.0117 8.0000e-005
0.0118 3.1200e-003
7.0000e-005
3.1900e-003
0.0000 10.3841 10.3841 2.5000e-004
0.0000 10.3902
Total 5.8400e-003
0.0263 0.0386 1.7000e-004
0.0131 1.4000e-004
0.0133 3.5200e-003
1.3000e-004
3.6500e-003
0.0000 16.0559 16.0559 6.8000e-004
0.0000 16.0729
Unmitigated Construction Off-Site
ROG NOx CO SO2 Fugitive PM10
Exhaust PM10
PM10 Total
Fugitive PM2.5
Exhaust PM2.5
PM2.5 Total Bio- CO2 NBio- CO2 Total CO2 CH4 N2O CO2e
Category tons/yr MT/yr
Off-Road 0.0304 0.2789 0.2652 4.3000e-004
0.0153 0.0153 0.0144 0.0144 0.0000 37.0619 37.0619 8.9400e-003
0.0000 37.2855
Total 0.0304 0.2789 0.2652 4.3000e-004
0.0153 0.0153 0.0144 0.0144 0.0000 37.0619 37.0619 8.9400e-003
0.0000 37.2855
Mitigated Construction On-Site
CalEEMod Version: CalEEMod.2016.3.2 Date: 9/12/2019 10:07 AMPage 18 of 34
Nicholoson SPAL - Kern-San Joaquin County, Annual
3.4 Building Construction - 2021
ROG NOx CO SO2 Fugitive PM10
Exhaust PM10
PM10 Total
Fugitive PM2.5
Exhaust PM2.5
PM2.5 Total Bio- CO2 NBio- CO2 Total CO2 CH4 N2O CO2e
Category tons/yr MT/yr
Hauling 0.0000 0.0000 0.0000 0.0000 0.0000 0.0000 0.0000 0.0000 0.0000 0.0000 0.0000 0.0000 0.0000 0.0000 0.0000 0.0000
Vendor 6.8000e-004
0.0229 4.3100e-003
6.0000e-005
1.3900e-003
6.0000e-005
1.4500e-003
4.0000e-004
6.0000e-005
4.6000e-004
0.0000 5.6719 5.6719 4.3000e-004
0.0000 5.6827
Worker 5.1600e-003
3.3700e-003
0.0343 1.1000e-004
0.0117 8.0000e-005
0.0118 3.1200e-003
7.0000e-005
3.1900e-003
0.0000 10.3841 10.3841 2.5000e-004
0.0000 10.3902
Total 5.8400e-003
0.0263 0.0386 1.7000e-004
0.0131 1.4000e-004
0.0133 3.5200e-003
1.3000e-004
3.6500e-003
0.0000 16.0559 16.0559 6.8000e-004
0.0000 16.0729
Mitigated Construction Off-Site
3.5 Paving - 2021
ROG NOx CO SO2 Fugitive PM10
Exhaust PM10
PM10 Total
Fugitive PM2.5
Exhaust PM2.5
PM2.5 Total Bio- CO2 NBio- CO2 Total CO2 CH4 N2O CO2e
Category tons/yr MT/yr
Off-Road 0.0126 0.1292 0.1465 2.3000e-004
6.7800e-003
6.7800e-003
6.2400e-003
6.2400e-003
0.0000 20.0235 20.0235 6.4800e-003
0.0000 20.1854
Paving 0.0000 0.0000 0.0000 0.0000 0.0000 0.0000 0.0000 0.0000 0.0000 0.0000 0.0000
Total 0.0126 0.1292 0.1465 2.3000e-004
6.7800e-003
6.7800e-003
6.2400e-003
6.2400e-003
0.0000 20.0235 20.0235 6.4800e-003
0.0000 20.1854
Unmitigated Construction On-Site
CalEEMod Version: CalEEMod.2016.3.2 Date: 9/12/2019 10:07 AMPage 19 of 34
Nicholoson SPAL - Kern-San Joaquin County, Annual

3.5 Paving - 2021
ROG NOx CO SO2 Fugitive PM10
Exhaust PM10
PM10 Total
Fugitive PM2.5
Exhaust PM2.5
PM2.5 Total Bio- CO2 NBio- CO2 Total CO2 CH4 N2O CO2e
Category tons/yr MT/yr
Hauling 0.0000 0.0000 0.0000 0.0000 0.0000 0.0000 0.0000 0.0000 0.0000 0.0000 0.0000 0.0000 0.0000 0.0000 0.0000 0.0000
Vendor 0.0000 0.0000 0.0000 0.0000 0.0000 0.0000 0.0000 0.0000 0.0000 0.0000 0.0000 0.0000 0.0000 0.0000 0.0000 0.0000
Worker 5.3000e-004
3.5000e-004
3.5300e-003
1.0000e-005
1.2100e-003
1.0000e-005
1.2200e-003
3.2000e-004
1.0000e-005
3.3000e-004
0.0000 1.0698 1.0698 3.0000e-005
0.0000 1.0704
Total 5.3000e-004
3.5000e-004
3.5300e-003
1.0000e-005
1.2100e-003
1.0000e-005
1.2200e-003
3.2000e-004
1.0000e-005
3.3000e-004
0.0000 1.0698 1.0698 3.0000e-005
0.0000 1.0704
Unmitigated Construction Off-Site
ROG NOx CO SO2 Fugitive PM10
Exhaust PM10
PM10 Total
Fugitive PM2.5
Exhaust PM2.5
PM2.5 Total Bio- CO2 NBio- CO2 Total CO2 CH4 N2O CO2e
Category tons/yr MT/yr
Off-Road 0.0126 0.1292 0.1465 2.3000e-004
6.7800e-003
6.7800e-003
6.2400e-003
6.2400e-003
0.0000 20.0235 20.0235 6.4800e-003
0.0000 20.1854
Paving 0.0000 0.0000 0.0000 0.0000 0.0000 0.0000 0.0000 0.0000 0.0000 0.0000 0.0000
Total 0.0126 0.1292 0.1465 2.3000e-004
6.7800e-003
6.7800e-003
6.2400e-003
6.2400e-003
0.0000 20.0235 20.0235 6.4800e-003
0.0000 20.1854
Mitigated Construction On-Site
CalEEMod Version: CalEEMod.2016.3.2 Date: 9/12/2019 10:07 AMPage 20 of 34
Nicholoson SPAL - Kern-San Joaquin County, Annual

3.5 Paving - 2021
ROG NOx CO SO2 Fugitive PM10
Exhaust PM10
PM10 Total
Fugitive PM2.5
Exhaust PM2.5
PM2.5 Total Bio- CO2 NBio- CO2 Total CO2 CH4 N2O CO2e
Category tons/yr MT/yr
Hauling 0.0000 0.0000 0.0000 0.0000 0.0000 0.0000 0.0000 0.0000 0.0000 0.0000 0.0000 0.0000 0.0000 0.0000 0.0000 0.0000
Vendor 0.0000 0.0000 0.0000 0.0000 0.0000 0.0000 0.0000 0.0000 0.0000 0.0000 0.0000 0.0000 0.0000 0.0000 0.0000 0.0000
Worker 5.3000e-004
3.5000e-004
3.5300e-003
1.0000e-005
1.2100e-003
1.0000e-005
1.2200e-003
3.2000e-004
1.0000e-005
3.3000e-004
0.0000 1.0698 1.0698 3.0000e-005
0.0000 1.0704
Total 5.3000e-004
3.5000e-004
3.5300e-003
1.0000e-005
1.2100e-003
1.0000e-005
1.2200e-003
3.2000e-004
1.0000e-005
3.3000e-004
0.0000 1.0698 1.0698 3.0000e-005
0.0000 1.0704
Mitigated Construction Off-Site
3.6 Architectural Coating - 2021
ROG NOx CO SO2 Fugitive PM10
Exhaust PM10
PM10 Total
Fugitive PM2.5
Exhaust PM2.5
PM2.5 Total Bio- CO2 NBio- CO2 Total CO2 CH4 N2O CO2e
Category tons/yr MT/yr
Archit. Coating 1.1826 0.0000 0.0000 0.0000 0.0000 0.0000 0.0000 0.0000 0.0000 0.0000 0.0000
Off-Road 2.1900e-003
0.0153 0.0182 3.0000e-005
9.4000e-004
9.4000e-004
9.4000e-004
9.4000e-004
0.0000 2.5533 2.5533 1.8000e-004
0.0000 2.5576
Total 1.1848 0.0153 0.0182 3.0000e-005
9.4000e-004
9.4000e-004
9.4000e-004
9.4000e-004
0.0000 2.5533 2.5533 1.8000e-004
0.0000 2.5576
Unmitigated Construction On-Site
CalEEMod Version: CalEEMod.2016.3.2 Date: 9/12/2019 10:07 AMPage 21 of 34
Nicholoson SPAL - Kern-San Joaquin County, Annual

3.6 Architectural Coating - 2021
ROG NOx CO SO2 Fugitive PM10
Exhaust PM10
PM10 Total
Fugitive PM2.5
Exhaust PM2.5
PM2.5 Total Bio- CO2 NBio- CO2 Total CO2 CH4 N2O CO2e
Category tons/yr MT/yr
Hauling 0.0000 0.0000 0.0000 0.0000 0.0000 0.0000 0.0000 0.0000 0.0000 0.0000 0.0000 0.0000 0.0000 0.0000 0.0000 0.0000
Vendor 0.0000 0.0000 0.0000 0.0000 0.0000 0.0000 0.0000 0.0000 0.0000 0.0000 0.0000 0.0000 0.0000 0.0000 0.0000 0.0000
Worker 6.4000e-004
4.2000e-004
4.2400e-003
1.0000e-005
1.4500e-003
1.0000e-005
1.4600e-003
3.9000e-004
1.0000e-005
3.9000e-004
0.0000 1.2837 1.2837 3.0000e-005
0.0000 1.2845
Total 6.4000e-004
4.2000e-004
4.2400e-003
1.0000e-005
1.4500e-003
1.0000e-005
1.4600e-003
3.9000e-004
1.0000e-005
3.9000e-004
0.0000 1.2837 1.2837 3.0000e-005
0.0000 1.2845
Unmitigated Construction Off-Site
ROG NOx CO SO2 Fugitive PM10
Exhaust PM10
PM10 Total
Fugitive PM2.5
Exhaust PM2.5
PM2.5 Total
Bio- CO2 NBio- CO2 Total CO2 CH4 N2O CO2e
Category tons/yr MT/yr
Archit. Coating 1.1826 0.0000 0.0000 0.0000 0.0000 0.0000 0.0000 0.0000 0.0000 0.0000 0.0000
Off-Road 2.1900e-003
0.0153 0.0182 3.0000e-005
9.4000e-004
9.4000e-004
9.4000e-004
9.4000e-004
0.0000 2.5533 2.5533 1.8000e-004
0.0000 2.5576
Total 1.1848 0.0153 0.0182 3.0000e-005
9.4000e-004
9.4000e-004
9.4000e-004
9.4000e-004
0.0000 2.5533 2.5533 1.8000e-004
0.0000 2.5576
Mitigated Construction On-Site
CalEEMod Version: CalEEMod.2016.3.2 Date: 9/12/2019 10:07 AMPage 22 of 34
Nicholoson SPAL - Kern-San Joaquin County, Annual

4.0 Operational Detail - Mobile
4.1 Mitigation Measures Mobile
Improve Walkability Design
Improve Destination Accessibility
Improve Pedestrian Network
3.6 Architectural Coating - 2021
ROG NOx CO SO2 Fugitive PM10
Exhaust PM10
PM10 Total
Fugitive PM2.5
Exhaust PM2.5
PM2.5 Total Bio- CO2 NBio- CO2 Total CO2 CH4 N2O CO2e
Category tons/yr MT/yr
Hauling 0.0000 0.0000 0.0000 0.0000 0.0000 0.0000 0.0000 0.0000 0.0000 0.0000 0.0000 0.0000 0.0000 0.0000 0.0000 0.0000
Vendor 0.0000 0.0000 0.0000 0.0000 0.0000 0.0000 0.0000 0.0000 0.0000 0.0000 0.0000 0.0000 0.0000 0.0000 0.0000 0.0000
Worker 6.4000e-004
4.2000e-004
4.2400e-003
1.0000e-005
1.4500e-003
1.0000e-005
1.4600e-003
3.9000e-004
1.0000e-005
3.9000e-004
0.0000 1.2837 1.2837 3.0000e-005
0.0000 1.2845
Total 6.4000e-004
4.2000e-004
4.2400e-003
1.0000e-005
1.4500e-003
1.0000e-005
1.4600e-003
3.9000e-004
1.0000e-005
3.9000e-004
0.0000 1.2837 1.2837 3.0000e-005
0.0000 1.2845
Mitigated Construction Off-Site
CalEEMod Version: CalEEMod.2016.3.2 Date: 9/12/2019 10:07 AMPage 23 of 34
Nicholoson SPAL - Kern-San Joaquin County, Annual
ROG NOx CO SO2 Fugitive PM10
Exhaust PM10
PM10 Total
Fugitive PM2.5
Exhaust PM2.5
PM2.5 Total Bio- CO2 NBio- CO2 Total CO2 CH4 N2O CO2e
Category tons/yr MT/yr
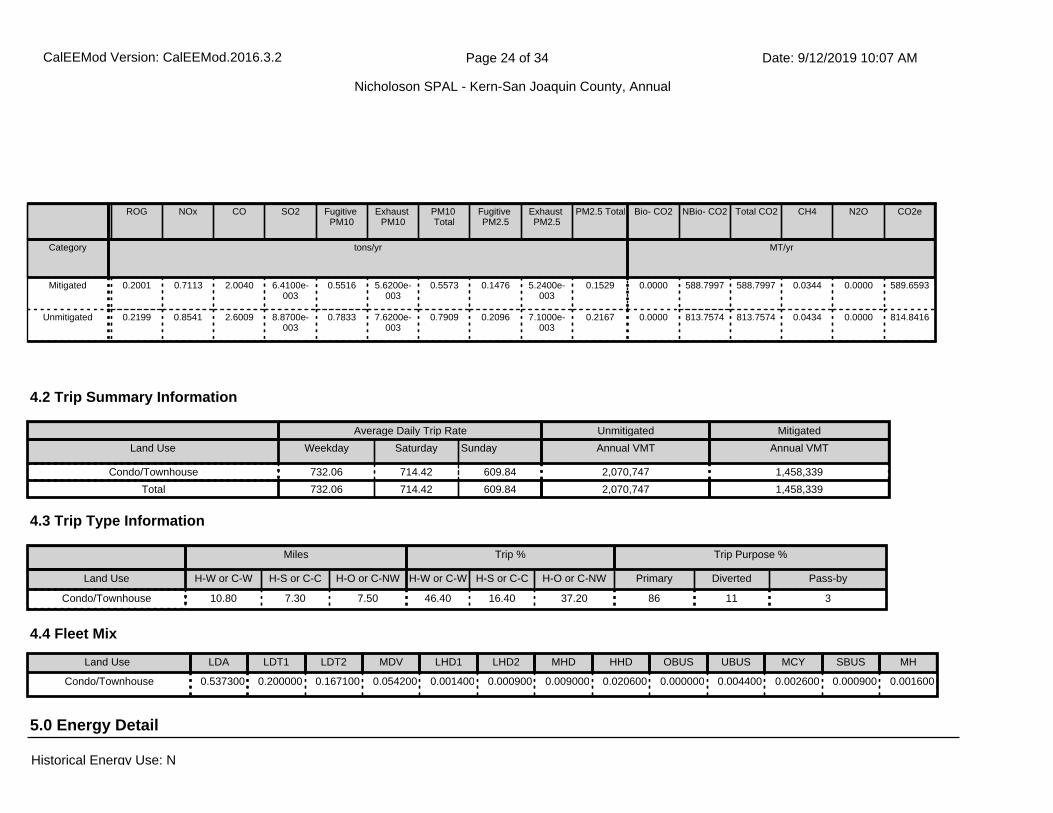
Mitigated 0.2001 0.7113 2.0040 6.4100e-003
0.5516 5.6200e-003
0.5573 0.1476 5.2400e-003
0.1529 0.0000 588.7997 588.7997 0.0344 0.0000 589.6593
Unmitigated 0.2199 0.8541 2.6009 8.8700e-003
0.7833 7.6200e-003
0.7909 0.2096 7.1000e-003
0.2167 0.0000 813.7574 813.7574 0.0434 0.0000 814.8416
4.2 Trip Summary Information
4.3 Trip Type Information
Average Daily Trip Rate Unmitigated Mitigated
Land Use Weekday Saturday Sunday Annual VMT Annual VMT
Condo/Townhouse 732.06 714.42 609.84 2,070,747 1,458,339
Total 732.06 714.42 609.84 2,070,747 1,458,339
Miles Trip % Trip Purpose %
Land Use H-W or C-W H-S or C-C H-O or C-NW H-W or C-W H-S or C-C H-O or C-NW Primary Diverted Pass-by
Condo/Townhouse 10.80 7.30 7.50 46.40 16.40 37.20 86 11 3
5.0 Energy Detail
4.4 Fleet Mix
Land Use LDA LDT1 LDT2 MDV LHD1 LHD2 MHD HHD OBUS UBUS MCY SBUS MH
Condo/Townhouse 0.537300 0.200000 0.167100 0.054200 0.001400 0.000900 0.009000 0.020600 0.000000 0.004400 0.002600 0.000900 0.001600
Historical Energy Use: N
CalEEMod Version: CalEEMod.2016.3.2 Date: 9/12/2019 10:07 AMPage 24 of 34
Nicholoson SPAL - Kern-San Joaquin County, Annual

ROG NOx CO SO2 Fugitive PM10
Exhaust PM10
PM10 Total
Fugitive PM2.5
Exhaust PM2.5
PM2.5 Total Bio- CO2 NBio- CO2 Total CO2 CH4 N2O CO2e
Category tons/yr MT/yr
Electricity Mitigated
0.0000 0.0000 0.0000 0.0000 0.0000 201.8986 201.8986 9.1300e-003
1.8900e-003
202.6897
Electricity Unmitigated
0.0000 0.0000 0.0000 0.0000 0.0000 201.8986 201.8986 9.1300e-003
1.8900e-003
202.6897
NaturalGas Mitigated
0.0122 0.1043 0.0444 6.7000e-004
8.4300e-003
8.4300e-003
8.4300e-003
8.4300e-003
0.0000 120.7977 120.7977 2.3200e-003
2.2100e-003
121.5155
NaturalGas Unmitigated
0.0122 0.1043 0.0444 6.7000e-004
8.4300e-003
8.4300e-003
8.4300e-003
8.4300e-003
0.0000 120.7977 120.7977 2.3200e-003
2.2100e-003
121.5155
5.2 Energy by Land Use - NaturalGas
NaturalGas Use
ROG NOx CO SO2 Fugitive PM10
Exhaust PM10
PM10 Total
Fugitive PM2.5
Exhaust PM2.5
PM2.5 Total Bio- CO2 NBio- CO2 Total CO2 CH4 N2O CO2e
Land Use kBTU/yr tons/yr MT/yr
Condo/Townhouse
2.26366e+006
0.0122 0.1043 0.0444 6.7000e-004
8.4300e-003
8.4300e-003
8.4300e-003
8.4300e-003
0.0000 120.7977 120.7977 2.3200e-003
2.2100e-003
121.5155
Total 0.0122 0.1043 0.0444 6.7000e-004
8.4300e-003
8.4300e-003
8.4300e-003
8.4300e-003
0.0000 120.7977 120.7977 2.3200e-003
2.2100e-003
121.5155
Unmitigated
5.1 Mitigation Measures Energy
CalEEMod Version: CalEEMod.2016.3.2 Date: 9/12/2019 10:07 AMPage 25 of 34
Nicholoson SPAL - Kern-San Joaquin County, Annual

5.2 Energy by Land Use - NaturalGas
NaturalGas Use
ROG NOx CO SO2 Fugitive PM10
Exhaust PM10
PM10 Total
Fugitive PM2.5
Exhaust PM2.5
PM2.5 Total Bio- CO2 NBio- CO2 Total CO2 CH4 N2O CO2e
Land Use kBTU/yr tons/yr MT/yr
Condo/Townhouse
2.26366e+006
0.0122 0.1043 0.0444 6.7000e-004
8.4300e-003
8.4300e-003
8.4300e-003
8.4300e-003
0.0000 120.7977 120.7977 2.3200e-003
2.2100e-003
121.5155
Total 0.0122 0.1043 0.0444 6.7000e-004
8.4300e-003
8.4300e-003
8.4300e-003
8.4300e-003
0.0000 120.7977 120.7977 2.3200e-003
2.2100e-003
121.5155
Mitigated
5.3 Energy by Land Use - Electricity
Electricity Use
Total CO2 CH4 N2O CO2e
Land Use kWh/yr MT/yr
Condo/Townhouse
694021 201.8986 9.1300e-003
1.8900e-003
202.6897
Total 201.8986 9.1300e-003
1.8900e-003
202.6897
Unmitigated
CalEEMod Version: CalEEMod.2016.3.2 Date: 9/12/2019 10:07 AMPage 26 of 34
Nicholoson SPAL - Kern-San Joaquin County, Annual

Use Electric Lawnmower
Use Electric Leafblower
Use Electric Chainsaw
No Hearths Installed
6.1 Mitigation Measures Area
6.0 Area Detail
5.3 Energy by Land Use - Electricity
Electricity Use
Total CO2 CH4 N2O CO2e
Land Use kWh/yr MT/yr
Condo/Townhouse
694021 201.8986 9.1300e-003
1.8900e-003
202.6897
Total 201.8986 9.1300e-003
1.8900e-003
202.6897
Mitigated
CalEEMod Version: CalEEMod.2016.3.2 Date: 9/12/2019 10:07 AMPage 27 of 34
Nicholoson SPAL - Kern-San Joaquin County, Annual

ROG NOx CO SO2 Fugitive PM10
Exhaust PM10
PM10 Total
Fugitive PM2.5
Exhaust PM2.5
PM2.5 Total Bio- CO2 NBio- CO2 Total CO2 CH4 N2O CO2e
Category tons/yr MT/yr
Mitigated 0.6384 0.0108 0.9308 5.0000e-005
5.1300e-003
5.1300e-003
5.1300e-003
5.1300e-003
0.0000 1.5145 1.5145 1.4600e-003
0.0000 1.5510
Unmitigated 0.6443 0.0580 0.9577 3.5000e-004
8.9800e-003
8.9800e-003
8.9800e-003
8.9800e-003
0.0000 56.1124 56.1124 2.5300e-003
1.0000e-003
56.4738
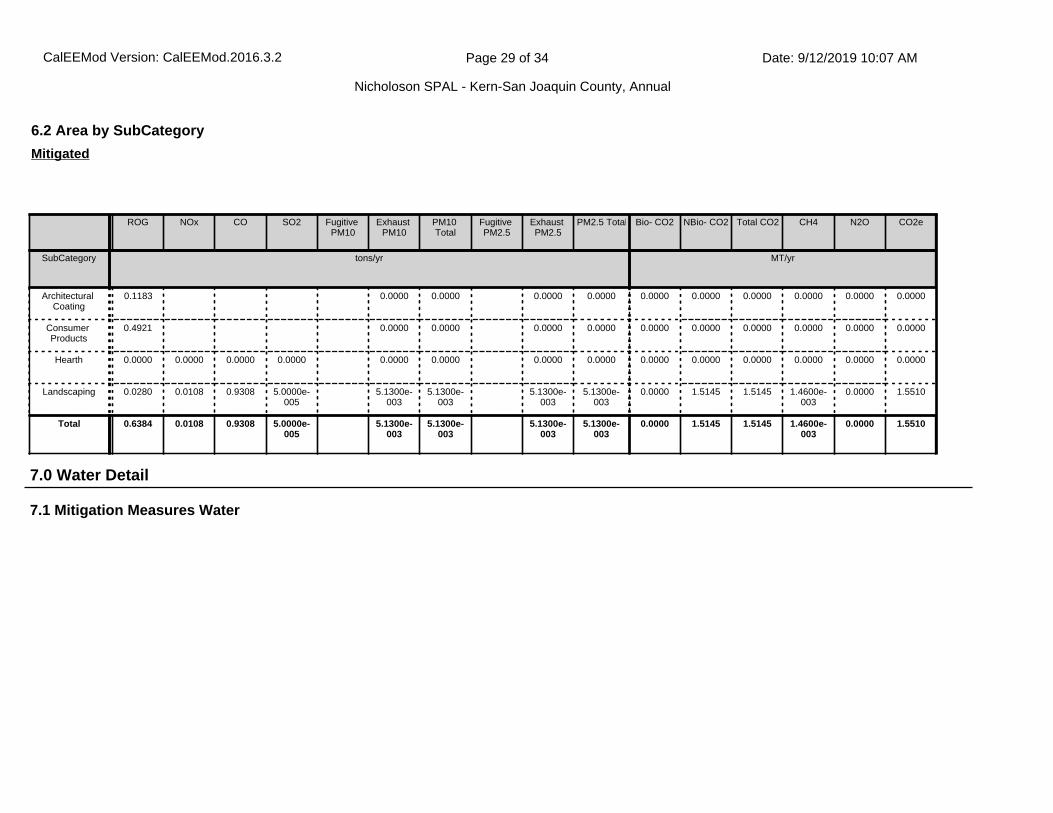
6.2 Area by SubCategory
ROG NOx CO SO2 Fugitive PM10
Exhaust PM10
PM10 Total
Fugitive PM2.5
Exhaust PM2.5
PM2.5 Total Bio- CO2 NBio- CO2 Total CO2 CH4 N2O CO2e
SubCategory tons/yr MT/yr
Architectural Coating
0.1183 0.0000 0.0000 0.0000 0.0000 0.0000 0.0000 0.0000 0.0000 0.0000 0.0000
Consumer Products
0.4921 0.0000 0.0000 0.0000 0.0000 0.0000 0.0000 0.0000 0.0000 0.0000 0.0000
Hearth 5.5200e-003
0.0471 0.0201 3.0000e-004
3.8100e-003
3.8100e-003
3.8100e-003
3.8100e-003
0.0000 54.5841 54.5841 1.0500e-003
1.0000e-003
54.9085
Landscaping 0.0284 0.0108 0.9376 5.0000e-005
5.1700e-003
5.1700e-003
5.1700e-003
5.1700e-003
0.0000 1.5282 1.5282 1.4800e-003
0.0000 1.5653
Total 0.6443 0.0580 0.9577 3.5000e-004
8.9800e-003
8.9800e-003
8.9800e-003
8.9800e-003
0.0000 56.1124 56.1124 2.5300e-003
1.0000e-003
56.4738
Unmitigated
CalEEMod Version: CalEEMod.2016.3.2 Date: 9/12/2019 10:07 AMPage 28 of 34
Nicholoson SPAL - Kern-San Joaquin County, Annual
7.1 Mitigation Measures Water
7.0 Water Detail
6.2 Area by SubCategory
ROG NOx CO SO2 Fugitive PM10
Exhaust PM10
PM10 Total
Fugitive PM2.5
Exhaust PM2.5
PM2.5 Total Bio- CO2 NBio- CO2 Total CO2 CH4 N2O CO2e
SubCategory tons/yr MT/yr
Architectural Coating
0.1183 0.0000 0.0000 0.0000 0.0000 0.0000 0.0000 0.0000 0.0000 0.0000 0.0000
Consumer Products
0.4921 0.0000 0.0000 0.0000 0.0000 0.0000 0.0000 0.0000 0.0000 0.0000 0.0000
Hearth 0.0000 0.0000 0.0000 0.0000 0.0000 0.0000 0.0000 0.0000 0.0000 0.0000 0.0000 0.0000 0.0000 0.0000
Landscaping 0.0280 0.0108 0.9308 5.0000e-005
5.1300e-003
5.1300e-003
5.1300e-003
5.1300e-003
0.0000 1.5145 1.5145 1.4600e-003
0.0000 1.5510
Total 0.6384 0.0108 0.9308 5.0000e-005
5.1300e-003
5.1300e-003
5.1300e-003
5.1300e-003
0.0000 1.5145 1.5145 1.4600e-003
0.0000 1.5510
Mitigated
CalEEMod Version: CalEEMod.2016.3.2 Date: 9/12/2019 10:07 AMPage 29 of 34
Nicholoson SPAL - Kern-San Joaquin County, Annual

Total CO2 CH4 N2O CO2e
Category MT/yr
Mitigated 20.7967 0.2683 6.4900e-003
29.4379
Unmitigated 20.7967 0.2683 6.4900e-003
29.4379
7.2 Water by Land Use
Indoor/Outdoor Use
Total CO2 CH4 N2O CO2e
Land Use Mgal MT/yr
Condo/Townhouse
8.20941 / 5.1755
20.7967 0.2683 6.4900e-003
29.4379
Total 20.7967 0.2683 6.4900e-003
29.4379
Unmitigated
CalEEMod Version: CalEEMod.2016.3.2 Date: 9/12/2019 10:07 AMPage 30 of 34
Nicholoson SPAL - Kern-San Joaquin County, Annual

8.1 Mitigation Measures Waste
7.2 Water by Land Use
Indoor/Outdoor Use
Total CO2 CH4 N2O CO2e
Land Use Mgal MT/yr
Condo/Townhouse
8.20941 / 5.1755
20.7967 0.2683 6.4900e-003
29.4379
Total 20.7967 0.2683 6.4900e-003
29.4379
Mitigated
8.0 Waste Detail
Total CO2 CH4 N2O CO2e
MT/yr
Mitigated 11.7654 0.6953 0.0000 29.1482
Unmitigated 11.7654 0.6953 0.0000 29.1482
Category/Year
CalEEMod Version: CalEEMod.2016.3.2 Date: 9/12/2019 10:07 AMPage 31 of 34
Nicholoson SPAL - Kern-San Joaquin County, Annual

8.2 Waste by Land Use
Waste Disposed
Total CO2 CH4 N2O CO2e
Land Use tons MT/yr
Condo/Townhouse
57.96 11.7654 0.6953 0.0000 29.1482
Total 11.7654 0.6953 0.0000 29.1482
Unmitigated
Waste Disposed
Total CO2 CH4 N2O CO2e
Land Use tons MT/yr
Condo/Townhouse
57.96 11.7654 0.6953 0.0000 29.1482
Total 11.7654 0.6953 0.0000 29.1482
Mitigated
9.0 Operational Offroad
Equipment Type Number Hours/Day Days/Year Horse Power Load Factor Fuel Type
CalEEMod Version: CalEEMod.2016.3.2 Date: 9/12/2019 10:07 AMPage 32 of 34
Nicholoson SPAL - Kern-San Joaquin County, Annual

11.0 Vegetation
10.0 Stationary Equipment
Fire Pumps and Emergency Generators
Equipment Type Number Hours/Day Hours/Year Horse Power Load Factor Fuel Type
Boilers
Equipment Type Number Heat Input/Day Heat Input/Year Boiler Rating Fuel Type
User Defined Equipment
Equipment Type Number
CalEEMod Version: CalEEMod.2016.3.2 Date: 9/12/2019 10:07 AMPage 33 of 34
Nicholoson SPAL - Kern-San Joaquin County, Annual

Project Characteristics -
Land Use - Actual Lot Acreage
Fleet Mix - Year 2013 Residential Fleet Mix
Construction Off-road Equipment Mitigation -
Area Mitigation -
Mobile Land Use Mitigation -
Construction Phase - Operational RUn Only
1.1 Land Usage
Land Uses Size Metric Lot Acreage Floor Surface Area Population
Condo/Townhouse 126.00 Dwelling Unit 16.89 126,000.00 360
1.2 Other Project Characteristics
Urbanization
Climate Zone
Urban
3
Wind Speed (m/s) Precipitation Freq (Days)2.7 32
1.3 User Entered Comments & Non-Default Data
1.0 Project Characteristics
Utility Company Pacific Gas & Electric Company
2005Operational Year
CO2 Intensity (lb/MWhr)
641.35 0.029CH4 Intensity (lb/MWhr)
0.006N2O Intensity (lb/MWhr)
Nicholson SPAL BAUKern-San Joaquin County, Annual
CalEEMod Version: CalEEMod.2016.3.2 Date: 9/12/2019 9:35 AMPage 1 of 18
Nicholson SPAL BAU - Kern-San Joaquin County, Annual

2.0 Emissions Summary
Table Name Column Name Default Value New Value
tblAreaCoating Area_EF_Nonresidential_Exterior 250 150
tblAreaCoating Area_EF_Nonresidential_Interior 250 150
tblAreaCoating Area_EF_Residential_Exterior 250 150
tblAreaCoating Area_EF_Residential_Interior 250 150
tblConstDustMitigation WaterUnpavedRoadVehicleSpeed 0 15
tblConstructionPhase NumDays 20.00 0.00
tblConstructionPhase PhaseEndDate 10/28/2005 9/30/2005
tblFleetMix HHD 0.14 0.02
tblFleetMix LDA 0.39 0.53
tblFleetMix LDT1 0.06 0.19
tblFleetMix LDT2 0.15 0.17
tblFleetMix LHD1 0.05 2.0000e-003
tblFleetMix LHD2 8.7770e-003 1.1000e-003
tblFleetMix MCY 6.1030e-003 3.2000e-003
tblFleetMix MDV 0.17 0.06
tblFleetMix MH 2.3920e-003 1.6000e-003
tblFleetMix MHD 0.02 9.7000e-003
tblFleetMix OBUS 1.2660e-003 0.00
tblFleetMix SBUS 9.5200e-004 1.2000e-003
tblFleetMix UBUS 1.2200e-003 4.7000e-003
tblLandUse LotAcreage 7.88 16.89
tblWoodstoves NumberCatalytic 16.89 0.00
tblWoodstoves NumberNoncatalytic 16.89 0.00
CalEEMod Version: CalEEMod.2016.3.2 Date: 9/12/2019 9:35 AMPage 2 of 18
Nicholson SPAL BAU - Kern-San Joaquin County, Annual

2.1 Overall Construction
ROG NOx CO SO2 Fugitive PM10
Exhaust PM10
PM10 Total
Fugitive PM2.5
Exhaust PM2.5
PM2.5 Total Bio- CO2 NBio- CO2 Total CO2 CH4 N2O CO2e
Year tons/yr MT/yr
2005 0.0000 0.0000 0.0000 0.0000 0.0000 0.0000
Maximum 0.0000 0.0000 0.0000 0.0000 0.0000 0.0000
Unmitigated Construction
ROG NOx CO SO2 Fugitive PM10
Exhaust PM10
PM10 Total
Fugitive PM2.5
Exhaust PM2.5
PM2.5 Total
Bio- CO2 NBio- CO2 Total CO2 CH4 N2O CO2e
Year tons/yr MT/yr
2005 0.0000 0.0000 0.0000 0.0000 0.0000 0.0000
Maximum 0.0000 0.0000 0.0000 0.0000 0.0000 0.0000
Mitigated Construction
ROG NOx CO SO2 Fugitive PM10
Exhaust PM10
PM10 Total
Fugitive PM2.5
Exhaust PM2.5
PM2.5 Total
Bio- CO2 NBio-CO2 Total CO2 CH4 N20 CO2e
Percent Reduction
0.00 0.00 0.00 0.00 0.00 0.00 0.00 0.00 0.00 0.00 0.00 0.00 0.00 0.00 0.00 0.00
CalEEMod Version: CalEEMod.2016.3.2 Date: 9/12/2019 9:35 AMPage 3 of 18
Nicholson SPAL BAU - Kern-San Joaquin County, Annual

2.2 Overall Operational
ROG NOx CO SO2 Fugitive PM10
Exhaust PM10
PM10 Total
Fugitive PM2.5
Exhaust PM2.5
PM2.5 Total Bio- CO2 NBio- CO2 Total CO2 CH4 N2O CO2e
Category tons/yr MT/yr
Area 0.0000 56.1124 56.1124 3.4900e-003
1.0000e-003
56.4979
Energy 0.0000 322.6962 322.6962 0.0114 4.1000e-003
324.2052
Mobile 0.0000 1,029.2978
1,029.2978
0.2004 0.0000 1,034.3084
Waste 11.7654 0.0000 11.7654 0.6953 0.0000 29.1482
Water 2.6045 18.1923 20.7967 0.2683 6.4900e-003
29.4379
Total 14.3698 1,426.2986
1,440.6684
1.1790 0.0116 1,473.5975
Unmitigated Operational
Quarter Start Date End Date Maximum Unmitigated ROG + NOX (tons/quarter) Maximum Mitigated ROG + NOX (tons/quarter)
Highest
CalEEMod Version: CalEEMod.2016.3.2 Date: 9/12/2019 9:35 AMPage 4 of 18
Nicholson SPAL BAU - Kern-San Joaquin County, Annual

2.2 Overall Operational
ROG NOx CO SO2 Fugitive PM10
Exhaust PM10
PM10 Total
Fugitive PM2.5
Exhaust PM2.5
PM2.5 Total
Bio- CO2 NBio- CO2 Total CO2 CH4 N2O CO2e
Category tons/yr MT/yr
Area 0.0000 56.1124 56.1124 3.4900e-003
1.0000e-003
56.4979
Energy 0.0000 322.6962 322.6962 0.0114 4.1000e-003
324.2052
Mobile 0.0000 1,029.2978
1,029.2978
0.2004 0.0000 1,034.3084
Waste 11.7654 0.0000 11.7654 0.6953 0.0000 29.1482
Water 2.6045 18.1923 20.7967 0.2683 6.4900e-003
29.4379
Total 14.3698 1,426.2986
1,440.6684
1.1790 0.0116 1,473.5975
Mitigated Operational
3.0 Construction Detail
Construction Phase
Phase Number
Phase Name Phase Type Start Date End Date Num Days Week
Num Days Phase Description
1 Demolition Demolition 10/1/2005 9/30/2005 5 0
ROG NOx CO SO2 Fugitive PM10
Exhaust PM10
PM10 Total
Fugitive PM2.5
Exhaust PM2.5
PM2.5 Total
Bio- CO2 NBio-CO2 Total CO2 CH4 N20 CO2e
Percent Reduction
0.00 0.00 0.00 0.00 0.00 0.00 0.00 0.00 0.00 0.00 0.00 0.00 0.00 0.00 0.00 0.00
Acres of Grading (Site Preparation Phase): 0
CalEEMod Version: CalEEMod.2016.3.2 Date: 9/12/2019 9:35 AMPage 5 of 18
Nicholson SPAL BAU - Kern-San Joaquin County, Annual

3.1 Mitigation Measures Construction
Water Exposed Area
Reduce Vehicle Speed on Unpaved Roads
OffRoad Equipment
Phase Name Offroad Equipment Type Amount Usage Hours Horse Power Load Factor
Demolition Excavators 3 8.00 158 0.38
Demolition Concrete/Industrial Saws 1 8.00 81 0.73
Demolition Rubber Tired Dozers 2 8.00 247 0.40
Trips and VMT
Phase Name Offroad Equipment Count
Worker Trip Number
Vendor Trip Number
Hauling Trip Number
Worker Trip Length
Vendor Trip Length
Hauling Trip Length
Worker Vehicle Class
Vendor Vehicle Class
Hauling Vehicle Class
Demolition 6 15.00 0.00 0.00 10.80 7.30 20.00 LD_Mix HDT_Mix HHDT
Residential Indoor: 0; Residential Outdoor: 0; Non-Residential Indoor: 0; Non-Residential Outdoor: 0; Striped Parking Area: 0 (Architectural Coating – sqft)
Acres of Grading (Grading Phase): 0
Acres of Paving: 0
CalEEMod Version: CalEEMod.2016.3.2 Date: 9/12/2019 9:35 AMPage 6 of 18
Nicholson SPAL BAU - Kern-San Joaquin County, Annual

3.2 Demolition - 2005
ROG NOx CO SO2 Fugitive PM10
Exhaust PM10
PM10 Total
Fugitive PM2.5
Exhaust PM2.5
PM2.5 Total Bio- CO2 NBio- CO2 Total CO2 CH4 N2O CO2e
Category tons/yr MT/yr
Off-Road 0.0000 0.0000 0.0000 0.0000 0.0000 0.0000 0.0000 0.0000 0.0000 0.0000 0.0000 0.0000 0.0000 0.0000 0.0000 0.0000
Total 0.0000 0.0000 0.0000 0.0000 0.0000 0.0000 0.0000 0.0000 0.0000 0.0000 0.0000 0.0000 0.0000 0.0000 0.0000 0.0000
Unmitigated Construction On-Site
ROG NOx CO SO2 Fugitive PM10
Exhaust PM10
PM10 Total
Fugitive PM2.5
Exhaust PM2.5
PM2.5 Total Bio- CO2 NBio- CO2 Total CO2 CH4 N2O CO2e
Category tons/yr MT/yr
Hauling 0.0000 0.0000 0.0000 0.0000 0.0000 0.0000 0.0000 0.0000 0.0000 0.0000 0.0000 0.0000 0.0000 0.0000 0.0000 0.0000
Vendor 0.0000 0.0000 0.0000 0.0000 0.0000 0.0000 0.0000 0.0000 0.0000 0.0000 0.0000 0.0000 0.0000 0.0000 0.0000 0.0000
Worker 0.0000 0.0000 0.0000 0.0000 0.0000 0.0000 0.0000 0.0000 0.0000 0.0000 0.0000 0.0000 0.0000 0.0000 0.0000 0.0000
Total 0.0000 0.0000 0.0000 0.0000 0.0000 0.0000 0.0000 0.0000 0.0000 0.0000 0.0000 0.0000 0.0000 0.0000 0.0000 0.0000
Unmitigated Construction Off-Site
CalEEMod Version: CalEEMod.2016.3.2 Date: 9/12/2019 9:35 AMPage 7 of 18
Nicholson SPAL BAU - Kern-San Joaquin County, Annual

4.0 Operational Detail - Mobile
3.2 Demolition - 2005
ROG NOx CO SO2 Fugitive PM10
Exhaust PM10
PM10 Total
Fugitive PM2.5
Exhaust PM2.5
PM2.5 Total Bio- CO2 NBio- CO2 Total CO2 CH4 N2O CO2e
Category tons/yr MT/yr
Off-Road 0.0000 0.0000 0.0000 0.0000 0.0000 0.0000 0.0000 0.0000 0.0000 0.0000 0.0000 0.0000 0.0000 0.0000 0.0000 0.0000
Total 0.0000 0.0000 0.0000 0.0000 0.0000 0.0000 0.0000 0.0000 0.0000 0.0000 0.0000 0.0000 0.0000 0.0000 0.0000 0.0000
Mitigated Construction On-Site
ROG NOx CO SO2 Fugitive PM10
Exhaust PM10
PM10 Total
Fugitive PM2.5
Exhaust PM2.5
PM2.5 Total Bio- CO2 NBio- CO2 Total CO2 CH4 N2O CO2e
Category tons/yr MT/yr
Hauling 0.0000 0.0000 0.0000 0.0000 0.0000 0.0000 0.0000 0.0000 0.0000 0.0000 0.0000 0.0000 0.0000 0.0000 0.0000 0.0000
Vendor 0.0000 0.0000 0.0000 0.0000 0.0000 0.0000 0.0000 0.0000 0.0000 0.0000 0.0000 0.0000 0.0000 0.0000 0.0000 0.0000
Worker 0.0000 0.0000 0.0000 0.0000 0.0000 0.0000 0.0000 0.0000 0.0000 0.0000 0.0000 0.0000 0.0000 0.0000 0.0000 0.0000
Total 0.0000 0.0000 0.0000 0.0000 0.0000 0.0000 0.0000 0.0000 0.0000 0.0000 0.0000 0.0000 0.0000 0.0000 0.0000 0.0000
Mitigated Construction Off-Site
CalEEMod Version: CalEEMod.2016.3.2 Date: 9/12/2019 9:35 AMPage 8 of 18
Nicholson SPAL BAU - Kern-San Joaquin County, Annual

ROG NOx CO SO2 Fugitive PM10
Exhaust PM10
PM10 Total
Fugitive PM2.5
Exhaust PM2.5
PM2.5 Total Bio- CO2 NBio- CO2 Total CO2 CH4 N2O CO2e
Category tons/yr MT/yr
Mitigated 0.0000 1,029.2978
1,029.2978
0.2004 0.0000 1,034.3084
Unmitigated 0.0000 1,029.2978
1,029.2978
0.2004 0.0000 1,034.3084
4.1 Mitigation Measures Mobile
4.2 Trip Summary Information
4.3 Trip Type Information
Average Daily Trip Rate Unmitigated Mitigated
Land Use Weekday Saturday Sunday Annual VMT Annual VMT
Condo/Townhouse 732.06 714.42 609.84 2,070,747 2,070,747
Total 732.06 714.42 609.84 2,070,747 2,070,747
Miles Trip % Trip Purpose %
Land Use H-W or C-W H-S or C-C H-O or C-NW H-W or C-W H-S or C-C H-O or C-NW Primary Diverted Pass-by
Condo/Townhouse 10.80 7.30 7.50 46.40 16.40 37.20 86 11 3
4.4 Fleet Mix
Land Use LDA LDT1 LDT2 MDV LHD1 LHD2 MHD HHD OBUS UBUS MCY SBUS MH
Condo/Townhouse 0.532200 0.190100 0.167100 0.062800 0.002000 0.001100 0.009700 0.024300 0.000000 0.004700 0.003200 0.001200 0.001600
CalEEMod Version: CalEEMod.2016.3.2 Date: 9/12/2019 9:35 AMPage 9 of 18
Nicholson SPAL BAU - Kern-San Joaquin County, Annual

5.0 Energy Detail
ROG NOx CO SO2 Fugitive PM10
Exhaust PM10
PM10 Total
Fugitive PM2.5
Exhaust PM2.5
PM2.5 Total Bio- CO2 NBio- CO2 Total CO2 CH4 N2O CO2e
Category tons/yr MT/yr
Electricity Mitigated
0.0000 201.8986 201.8986 9.1300e-003
1.8900e-003
202.6897
Electricity Unmitigated
0.0000 201.8986 201.8986 9.1300e-003
1.8900e-003
202.6897
NaturalGas Mitigated
0.0000 120.7977 120.7977 2.3200e-003
2.2100e-003
121.5155
NaturalGas Unmitigated
0.0000 120.7977 120.7977 2.3200e-003
2.2100e-003
121.5155
5.1 Mitigation Measures Energy
Historical Energy Use: N
CalEEMod Version: CalEEMod.2016.3.2 Date: 9/12/2019 9:35 AMPage 10 of 18
Nicholson SPAL BAU - Kern-San Joaquin County, Annual

5.2 Energy by Land Use - NaturalGas
NaturalGas Use
ROG NOx CO SO2 Fugitive PM10
Exhaust PM10
PM10 Total
Fugitive PM2.5
Exhaust PM2.5
PM2.5 Total Bio- CO2 NBio- CO2 Total CO2 CH4 N2O CO2e
Land Use kBTU/yr tons/yr MT/yr
Condo/Townhouse
2.26366e+006
0.0000 120.7977 120.7977 2.3200e-003
2.2100e-003
121.5155
Total 0.0000 120.7977 120.7977 2.3200e-003
2.2100e-003
121.5155
Unmitigated
NaturalGas Use
ROG NOx CO SO2 Fugitive PM10
Exhaust PM10
PM10 Total
Fugitive PM2.5
Exhaust PM2.5
PM2.5 Total Bio- CO2 NBio- CO2 Total CO2 CH4 N2O CO2e
Land Use kBTU/yr tons/yr MT/yr
Condo/Townhouse
2.26366e+006
0.0000 120.7977 120.7977 2.3200e-003
2.2100e-003
121.5155
Total 0.0000 120.7977 120.7977 2.3200e-003
2.2100e-003
121.5155
Mitigated
CalEEMod Version: CalEEMod.2016.3.2 Date: 9/12/2019 9:35 AMPage 11 of 18
Nicholson SPAL BAU - Kern-San Joaquin County, Annual

6.1 Mitigation Measures Area
6.0 Area Detail
5.3 Energy by Land Use - Electricity
Electricity Use
Total CO2 CH4 N2O CO2e
Land Use kWh/yr MT/yr
Condo/Townhouse
694021 201.8986 9.1300e-003
1.8900e-003
202.6897
Total 201.8986 9.1300e-003
1.8900e-003
202.6897
Unmitigated
Electricity Use
Total CO2 CH4 N2O CO2e
Land Use kWh/yr MT/yr
Condo/Townhouse
694021 201.8986 9.1300e-003
1.8900e-003
202.6897
Total 201.8986 9.1300e-003
1.8900e-003
202.6897
Mitigated
CalEEMod Version: CalEEMod.2016.3.2 Date: 9/12/2019 9:35 AMPage 12 of 18
Nicholson SPAL BAU - Kern-San Joaquin County, Annual

ROG NOx CO SO2 Fugitive PM10
Exhaust PM10
PM10 Total
Fugitive PM2.5
Exhaust PM2.5
PM2.5 Total Bio- CO2 NBio- CO2 Total CO2 CH4 N2O CO2e
Category tons/yr MT/yr
Mitigated 0.0000 56.1124 56.1124 3.4900e-003
1.0000e-003
56.4979
Unmitigated 0.0000 56.1124 56.1124 3.4900e-003
1.0000e-003
56.4979
6.2 Area by SubCategory
ROG NOx CO SO2 Fugitive PM10
Exhaust PM10
PM10 Total
Fugitive PM2.5
Exhaust PM2.5
PM2.5 Total Bio- CO2 NBio- CO2 Total CO2 CH4 N2O CO2e
SubCategory tons/yr MT/yr
Architectural Coating
0.0000 0.0000 0.0000 0.0000 0.0000 0.0000
Consumer Products
0.0000 0.0000 0.0000 0.0000 0.0000 0.0000
Hearth 0.0000 54.5841 54.5841 1.0500e-003
1.0000e-003
54.9085
Landscaping 0.0000 1.5282 1.5282 2.4500e-003
0.0000 1.5894
Total 0.0000 56.1124 56.1124 3.5000e-003
1.0000e-003
56.4979
Unmitigated
CalEEMod Version: CalEEMod.2016.3.2 Date: 9/12/2019 9:35 AMPage 13 of 18
Nicholson SPAL BAU - Kern-San Joaquin County, Annual

7.1 Mitigation Measures Water
7.0 Water Detail
6.2 Area by SubCategory
ROG NOx CO SO2 Fugitive PM10
Exhaust PM10
PM10 Total
Fugitive PM2.5
Exhaust PM2.5
PM2.5 Total Bio- CO2 NBio- CO2 Total CO2 CH4 N2O CO2e
SubCategory tons/yr MT/yr
Architectural Coating
0.0000 0.0000 0.0000 0.0000 0.0000 0.0000
Consumer Products
0.0000 0.0000 0.0000 0.0000 0.0000 0.0000
Hearth 0.0000 54.5841 54.5841 1.0500e-003
1.0000e-003
54.9085
Landscaping 0.0000 1.5282 1.5282 2.4500e-003
0.0000 1.5894
Total 0.0000 56.1124 56.1124 3.5000e-003
1.0000e-003
56.4979
Mitigated
CalEEMod Version: CalEEMod.2016.3.2 Date: 9/12/2019 9:35 AMPage 14 of 18
Nicholson SPAL BAU - Kern-San Joaquin County, Annual

Total CO2 CH4 N2O CO2e
Category MT/yr
Mitigated 20.7967 0.2683 6.4900e-003
29.4379
Unmitigated 20.7967 0.2683 6.4900e-003
29.4379
7.2 Water by Land Use
Indoor/Outdoor Use
Total CO2 CH4 N2O CO2e
Land Use Mgal MT/yr
Condo/Townhouse
8.20941 / 5.1755
20.7967 0.2683 6.4900e-003
29.4379
Total 20.7967 0.2683 6.4900e-003
29.4379
Unmitigated
CalEEMod Version: CalEEMod.2016.3.2 Date: 9/12/2019 9:35 AMPage 15 of 18
Nicholson SPAL BAU - Kern-San Joaquin County, Annual

8.1 Mitigation Measures Waste
7.2 Water by Land Use
Indoor/Outdoor Use
Total CO2 CH4 N2O CO2e
Land Use Mgal MT/yr
Condo/Townhouse
8.20941 / 5.1755
20.7967 0.2683 6.4900e-003
29.4379
Total 20.7967 0.2683 6.4900e-003
29.4379
Mitigated
8.0 Waste Detail
Total CO2 CH4 N2O CO2e
MT/yr
Mitigated 11.7654 0.6953 0.0000 29.1482
Unmitigated 11.7654 0.6953 0.0000 29.1482
Category/Year
CalEEMod Version: CalEEMod.2016.3.2 Date: 9/12/2019 9:35 AMPage 16 of 18
Nicholson SPAL BAU - Kern-San Joaquin County, Annual

8.2 Waste by Land Use
Waste Disposed
Total CO2 CH4 N2O CO2e
Land Use tons MT/yr
Condo/Townhouse
57.96 11.7654 0.6953 0.0000 29.1482
Total 11.7654 0.6953 0.0000 29.1482
Unmitigated
Waste Disposed
Total CO2 CH4 N2O CO2e
Land Use tons MT/yr
Condo/Townhouse
57.96 11.7654 0.6953 0.0000 29.1482
Total 11.7654 0.6953 0.0000 29.1482
Mitigated
9.0 Operational Offroad
Equipment Type Number Hours/Day Days/Year Horse Power Load Factor Fuel Type
CalEEMod Version: CalEEMod.2016.3.2 Date: 9/12/2019 9:35 AMPage 17 of 18
Nicholson SPAL BAU - Kern-San Joaquin County, Annual

11.0 Vegetation
10.0 Stationary Equipment
Fire Pumps and Emergency Generators
Equipment Type Number Hours/Day Hours/Year Horse Power Load Factor Fuel Type
Boilers
Equipment Type Number Heat Input/Day Heat Input/Year Boiler Rating Fuel Type
User Defined Equipment
Equipment Type Number
CalEEMod Version: CalEEMod.2016.3.2 Date: 9/12/2019 9:35 AMPage 18 of 18
Nicholson SPAL BAU - Kern-San Joaquin County, Annual


