
New Zealand’s EnergyScape
��������������� �������
1st Stakeholder Workshop
������ �������������� ������������� �������������� ������������� �������������� ������������� �������������� �������9 August 2007
New Zealand’s EnergyScape
�����
• Overview of overall project.• Overviews from individual projects:
• Hydrogen Economy.• Bioenergy Options.• Indigenous Energy Options and Energyscape.
• Questions and feedback.
We are developing a high level process to develop strategy …
Have we got it right?
New Zealand’s EnergyScape
��� ����� ��������� ������ �� ������� ���
• Background.• The linked projects• Project stages and timing.• Where to from here.
New Zealand’s EnergyScape
!��"� ���
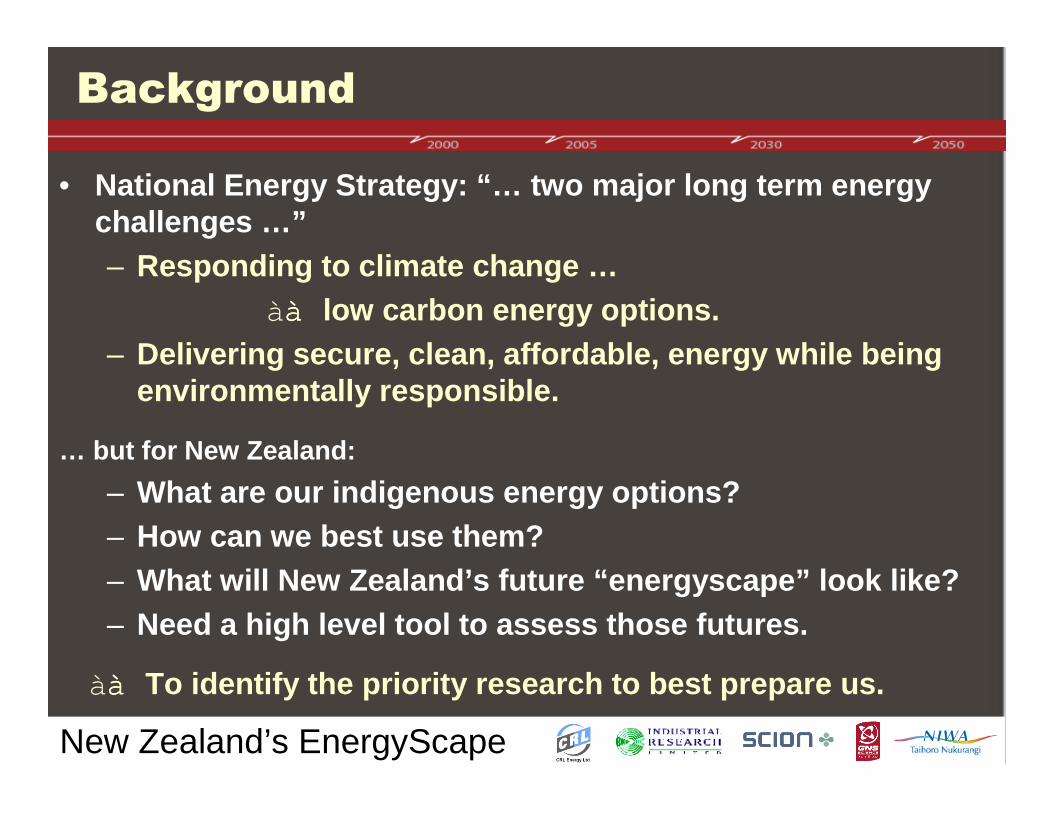
• National Energy Strategy: “… two major long term energy challenges …”– Responding to climate change …
ààà à low carbon energy options.– Delivering secure, clean, affordable, energy while being
environmentally responsible.
… but for New Zealand:
– What are our indigenous energy options?– How can we best use them?– What will New Zealand’s future “energyscape” look li ke?– Need a high level tool to assess those futures.
ààà à To identify the priority research to best prepare u s.
New Zealand’s EnergyScape
#�� �$��"��� ������
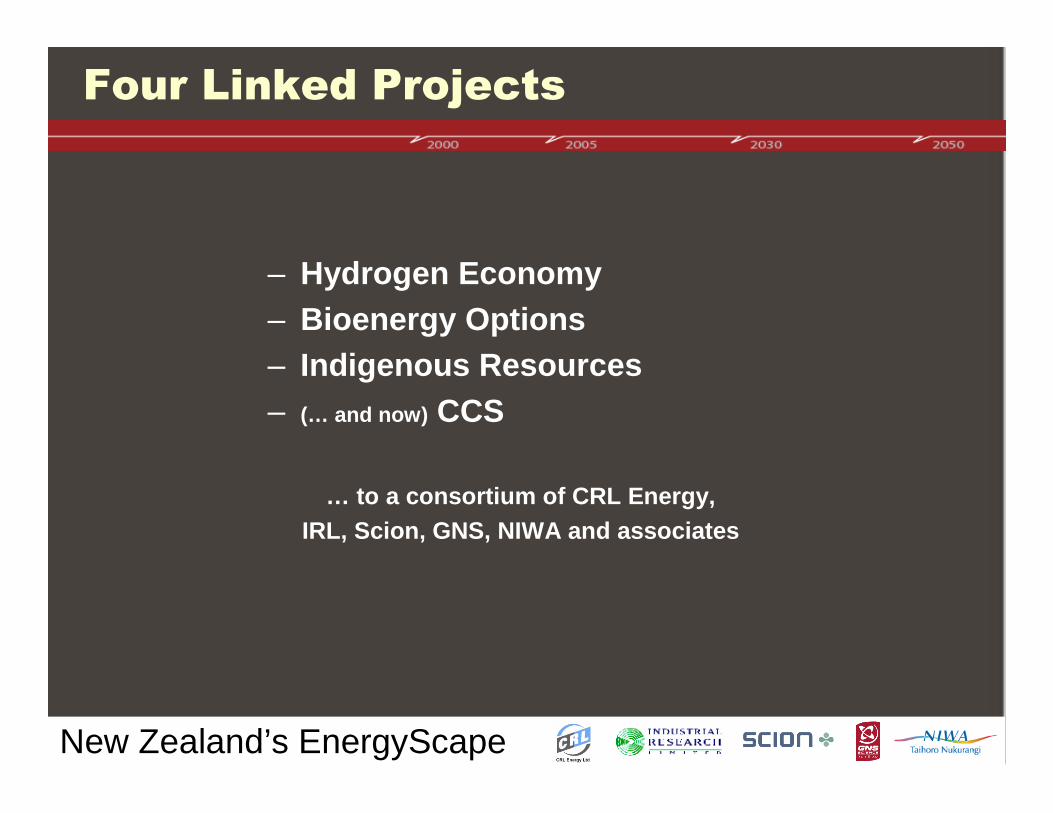
– Hydrogen Economy– Bioenergy Options– Indigenous Resources– (… and now) CCS
… to a consortium of CRL Energy,IRL, Scion, GNS, NIWA and associates
New Zealand’s EnergyScape
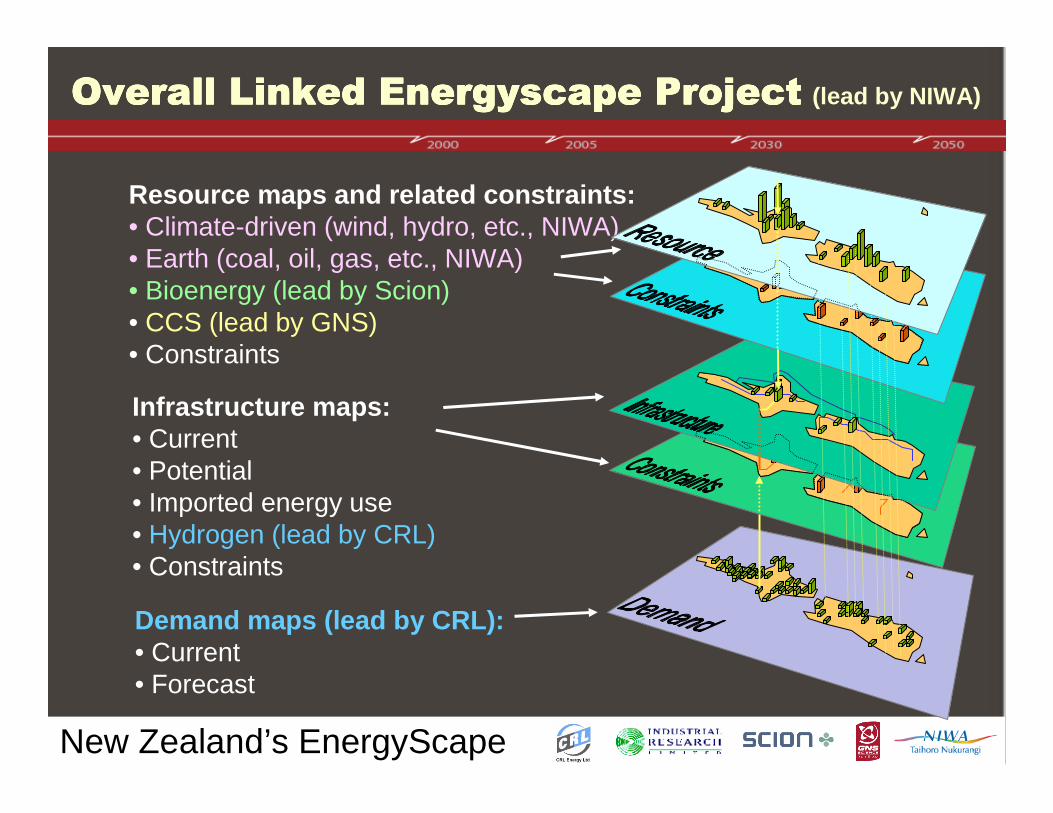
��� ����$��"����� ��������� �������� ����$��"����� ��������� �������� ����$��"����� ��������� �������� ����$��"����� ��������� ����� (lead by NIWA)
Resource maps and related constraints:• Climate-driven (wind, hydro, etc., NIWA)• Earth (coal, oil, gas, etc., NIWA)• Bioenergy (lead by Scion)• CCS (lead by GNS)• Constraints
Infrastructure maps:• Current• Potential• Imported energy use• Hydrogen (lead by CRL)• Constraints
Demand maps (lead by CRL):• Current• Forecast
New Zealand’s EnergyScape
� �������������� �������������� �������������� �������������
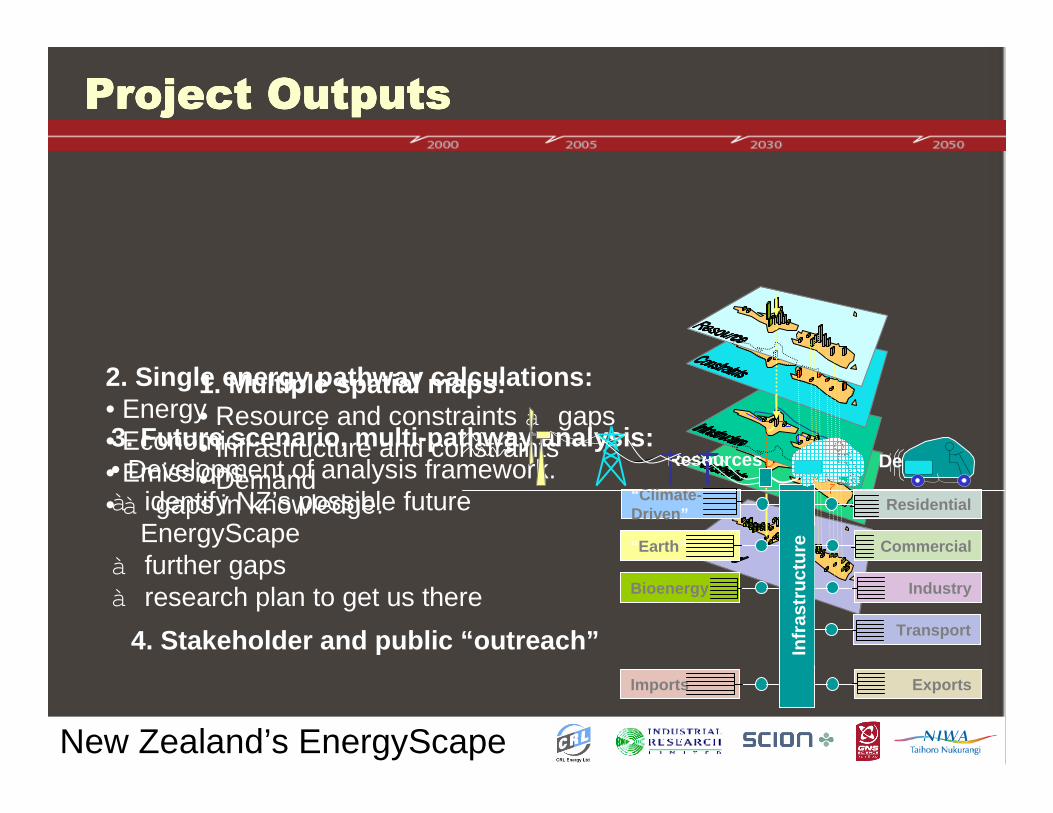
1. Multiple spatial maps:• Resource and constraints à gaps• Infrastructure and constraints• Demand
2. Single energy pathway calculations:• Energy• Economic• Emissions• à gaps in knowledge.
3. Future scenario, multi-pathway analysis:• Development of analysis framework.à identify NZ’s possible future
EnergyScapeà further gapsà research plan to get us there
“ Climate-Driven ”
“ Earth ”
Bioenergy
Imports
Residential
Commercial
Industry
Transport
Exports
Resources Demand
Infr
astr
uctu
re
4. Stakeholder and public “outreach”
New Zealand’s EnergyScape
# ����� "����� �������
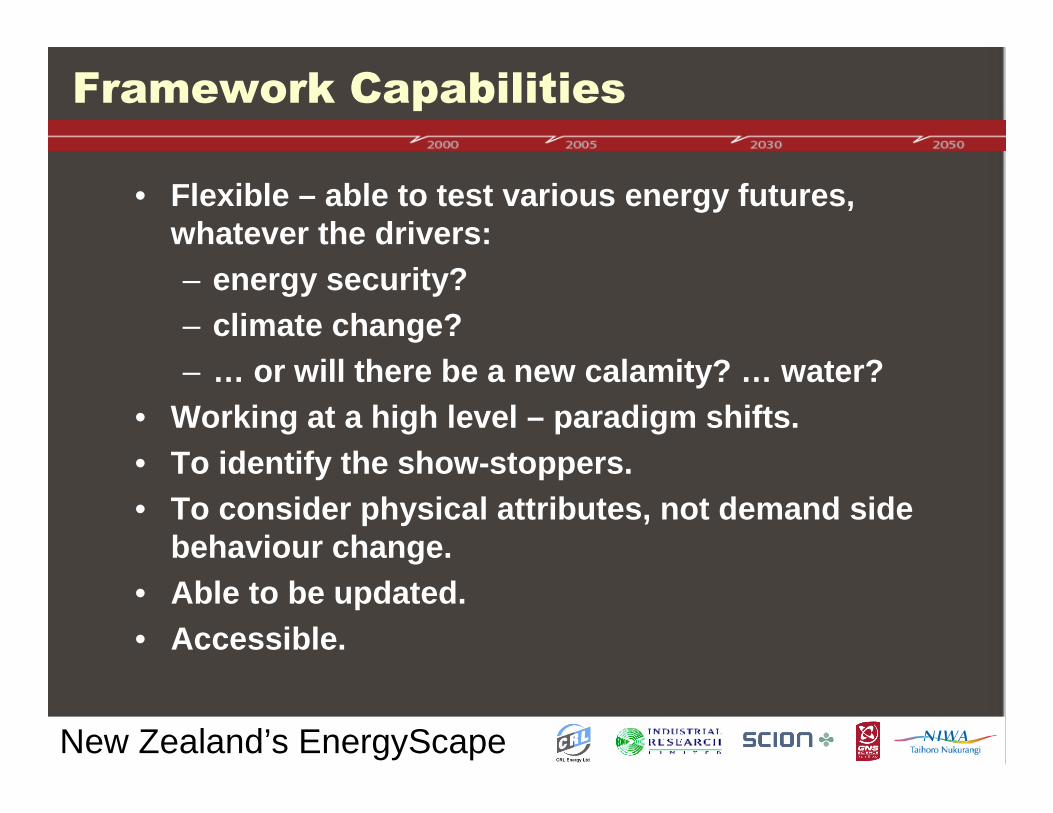
• Flexible – able to test various energy futures, whatever the drivers:– energy security?– climate change?– … or will there be a new calamity? … water?
• Working at a high level – paradigm shifts.• To identify the show-stoppers.• To consider physical attributes, not demand side
behaviour change. • Able to be updated.• Accessible.
New Zealand’s EnergyScape
#��� ������� ���
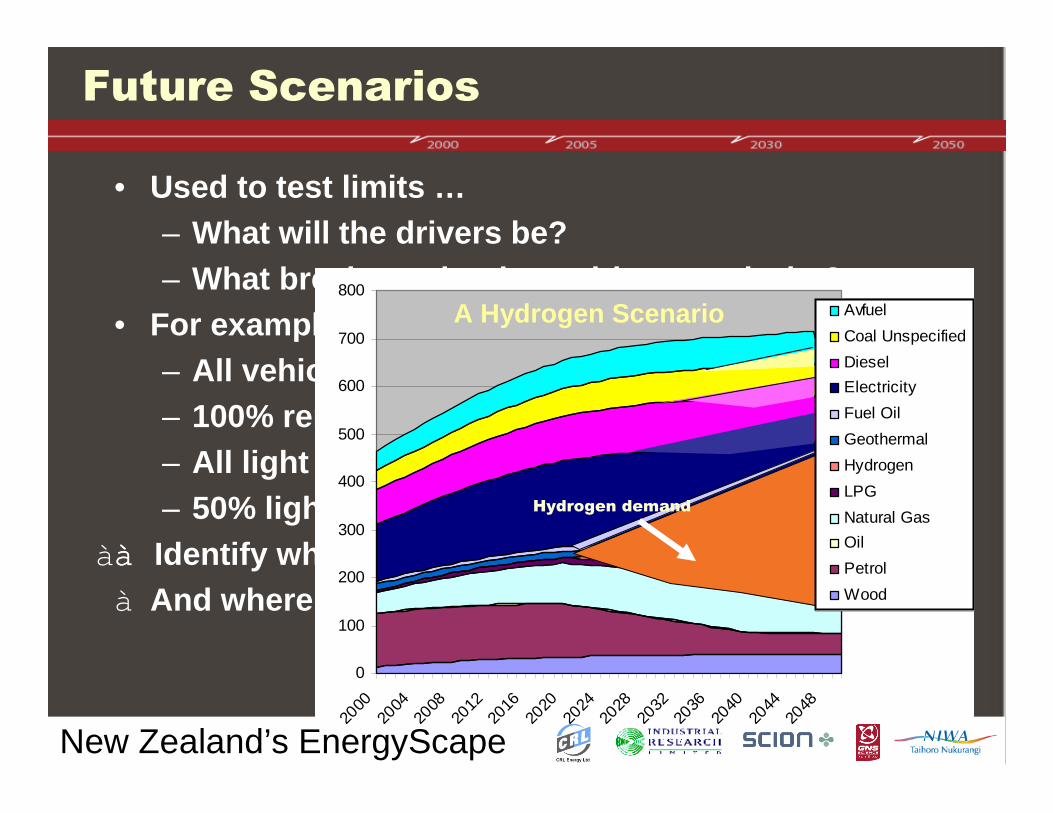
• Used to test limits …– What will the drivers be?– What breaks under these drivers and why?
• For example:– All vehicles biofuelled by 2050.– 100% renewable energy system by 2050.– All light vehicles fuelled by ethanol by 2030.– 50% light vehicles electric by 2030.
ààà à Identify where the risks are.à And where the research $$$ would optimally go.
à To aid the development of an integrated research plan for New Zealand.
0
100
200
300
400
500
600
700
800
2000
2004
2008
2012
2016
2020
2024
2028
2032
2036
2040
2044
2048
Avfuel
Coal Unspecified
Diesel
Electricity
Fuel Oil
Geothermal
Hydrogen
LPG
Natural Gas
Oil
Petrol
Wood
A Hydrogen Scenario
%� ����������
New Zealand’s EnergyScape
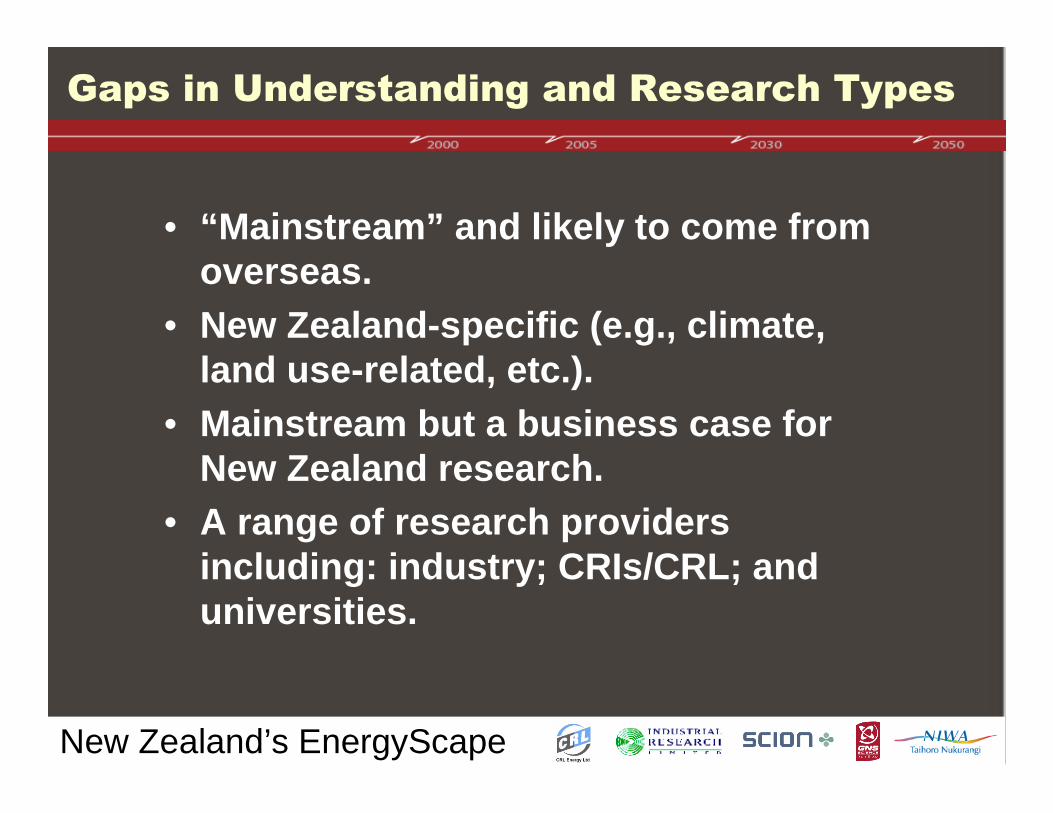
&�������'�� �����������(���� �)�*����
• “Mainstream” and likely to come from overseas.
• New Zealand-specific (e.g., climate, land use-related, etc.).
• Mainstream but a business case for New Zealand research.
• A range of research providers including: industry; CRIs/CRL; and universities.

New Zealand’s EnergyScape
� ������+��������
• “Steering” Committee– Leaders in industry and government.
• “Government Group”– MED, MoT/MfE, EECA and linkages to “whole of
government”.• Stakeholders
– Today’s introduction.– Two ½-day workshops – Nov ’07 and March ’08.– Specific meetings/requests for information/input.
• Other– Conferences and seminars.
New Zealand’s EnergyScape
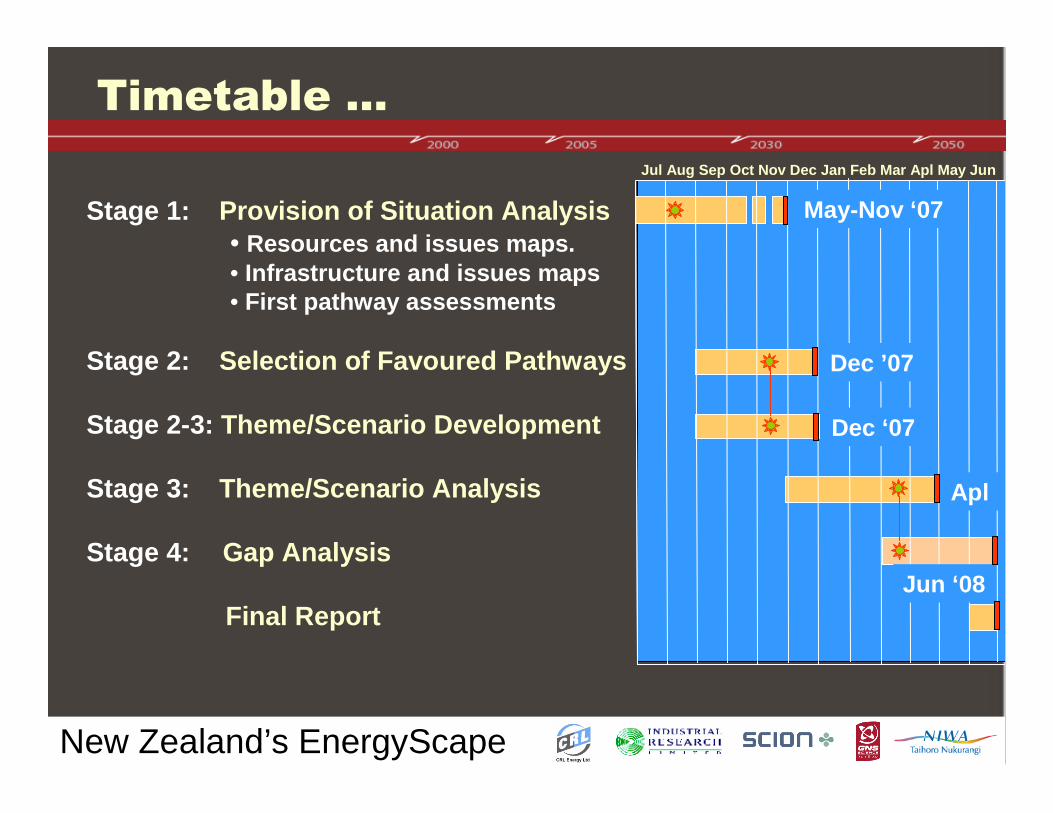
*����� ���,
Stage 1: Provision of Situation Analysis• Resources and issues maps.• Infrastructure and issues maps• First pathway assessments
Stage 2: Selection of Favoured Pathways
Stage 2-3: Theme/Scenario Development
Stage 3: Theme/Scenario Analysis
Stage 4: Gap Analysis
Final Report
Jul Aug Sep Oct Nov Dec Jan Feb Mar Apl May Jun
May-Nov ‘07
Dec ’07
Dec ‘07
Jun ‘08
Apl

New Zealand’s EnergyScape
%�������������� ��)�-
We are developing a high level process to develop strategy … including for the identification of energy research priorities for New Zealand:
• Have we got the methodology right? …• Have we got the scope right?• What do you see as the priority outputs?• Have we got the level of stakeholder
engagement right? • What changes would you suggest?

New Zealand’s EnergyScape
#� �)� �.��������-
New Zealand’s EnergyScape
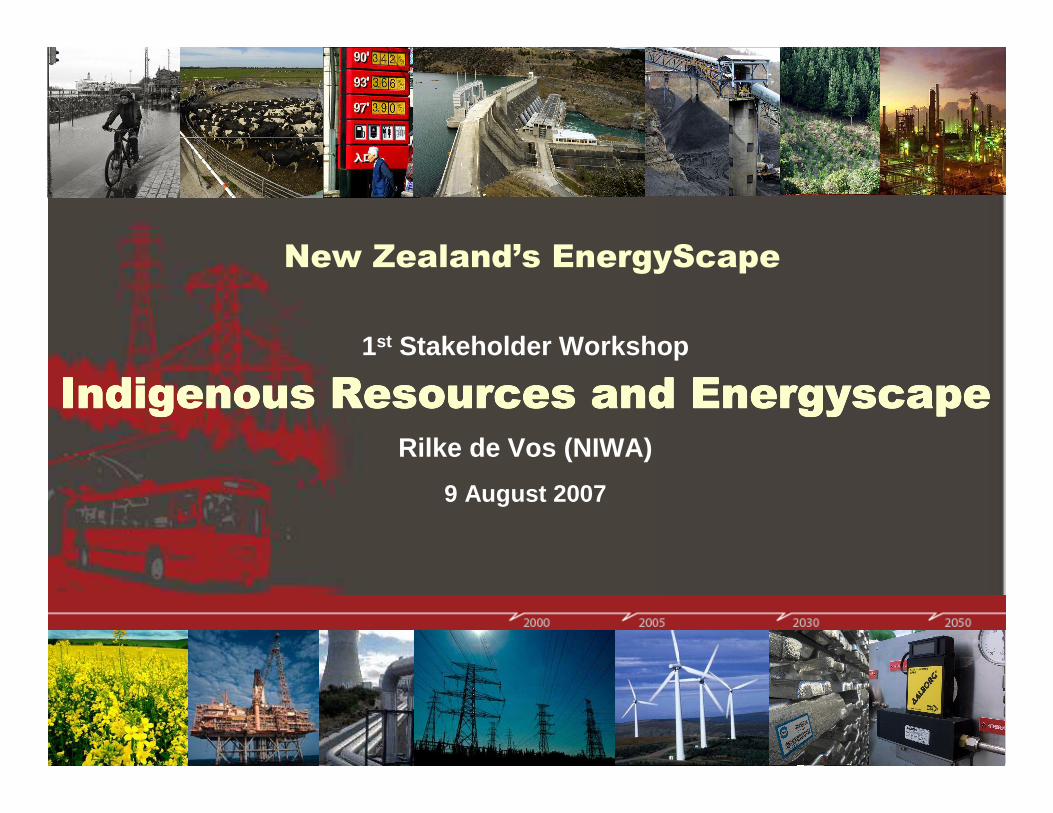
��������������� �������
1st Stakeholder Workshop
����������(���� ���������� �����������������(���� ���������� �����������������(���� ���������� �����������������(���� ���������� �������Rilke de Vos (NIWA)
9 August 2007
New Zealand’s EnergyScape
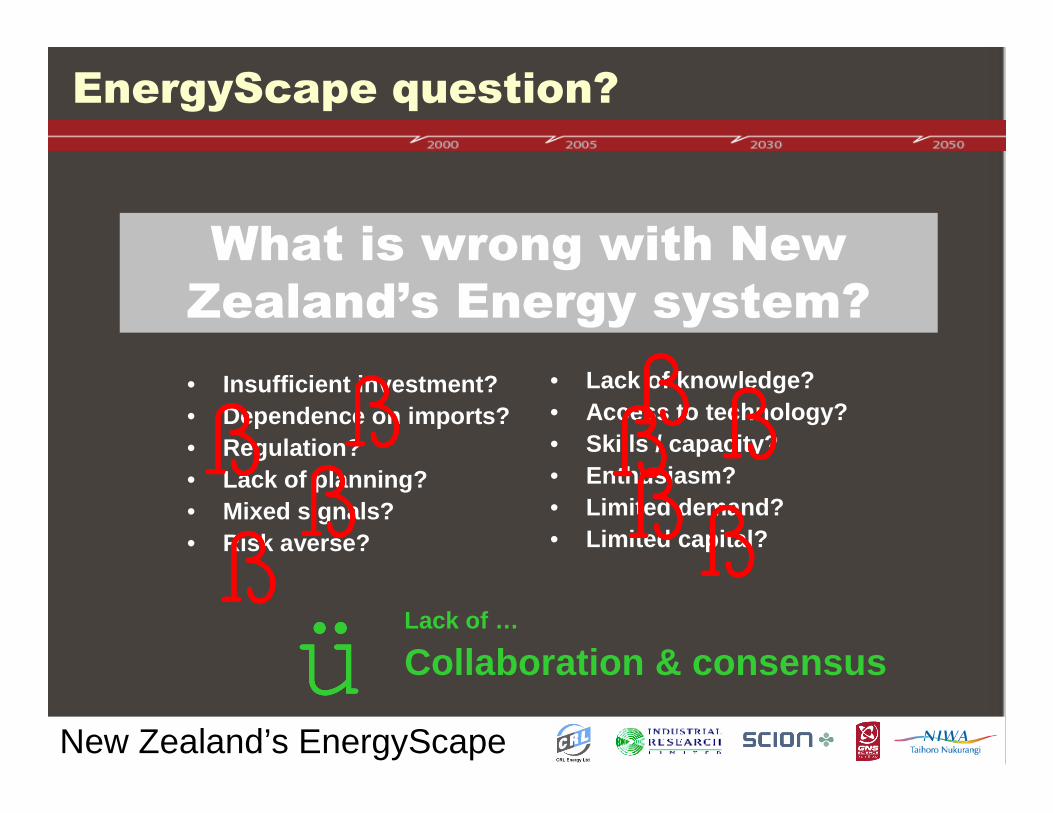
��� ��������/�������-
0)������� �������)�����
����������� ���������-
• Lack of knowledge?• Access to technology?• Skills / capacity?• Enthusiasm?• Limited demand?• Limited capital?
• Insufficient investment?• Dependence on imports?• Regulation?• Lack of planning?• Mixed signals?• Risk averse?
ßßßßßßßß ßßßßßßßß
ßßßßßßßßßßßßßßßßßßßß
Lack of …
Collaboration & consensusüüü ü
New Zealand’s EnergyScape
��������-
Common / shared filing system…
• Order of magnitude– Myth busting– No trade secrets– Manageable– Captures variability / uncertainty
• Built with an understanding of end-use– Energy system planning– Decision impact review– Order of magnitude cost, GHG, risk– Identify regional solutions
• Accessible & flexible– Self explanatory– Modifiable– Transparent
• Geospatial– Regional solutions– Infrastructure limitation
LEAP software with supporting databases
New Zealand’s EnergyScape
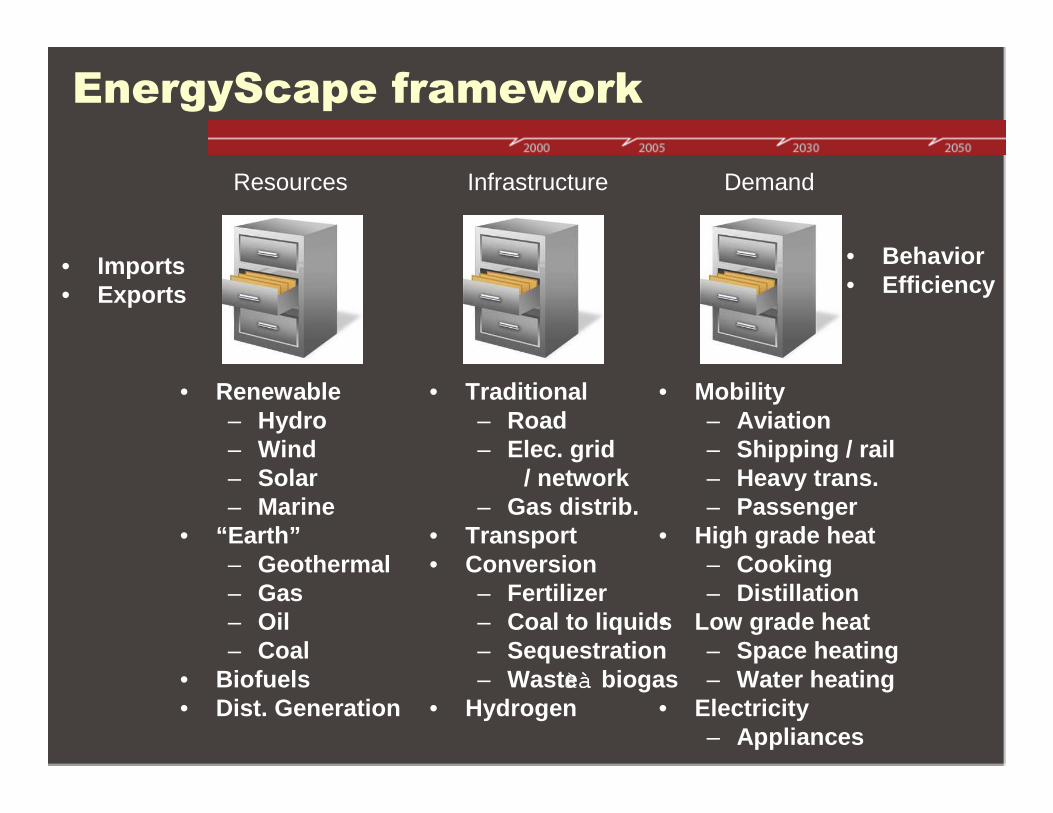
��� ��������1 ����� "
• Behavior• Efficiency
Resources
• Renewable– Hydro– Wind– Solar– Marine
• “Earth”– Geothermal– Gas– Oil– Coal
• Biofuels• Dist. Generation
• Imports• Exports
Infrastructure
• Traditional– Road– Elec. grid
/ network– Gas distrib.
• Transport• Conversion
– Fertilizer– Coal to liquids– Sequestration– Waste ààà à biogas
• Hydrogen
Demand
• Mobility– Aviation– Shipping / rail – Heavy trans.– Passenger
• High grade heat– Cooking– Distillation
• Low grade heat– Space heating– Water heating
• Electricity– Appliances
New Zealand’s EnergyScape
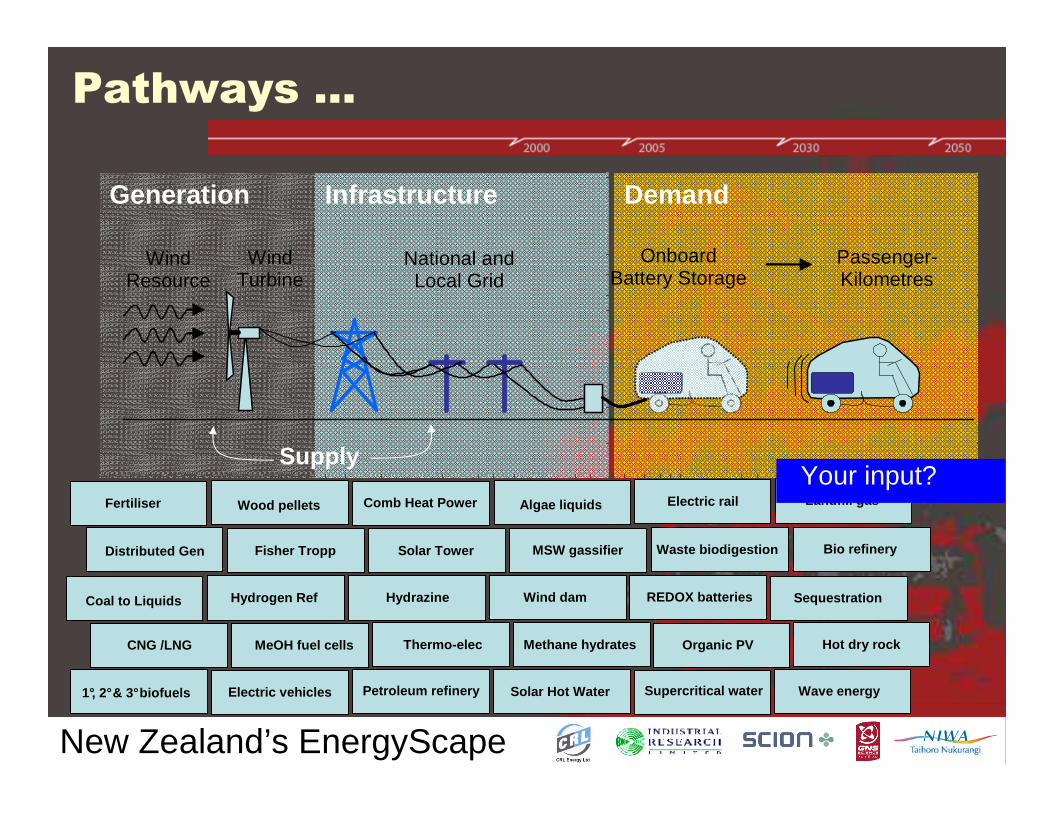
Demand
���)�����,
Generation Infrastructure
Wind Turbine
National and Local Grid
Onboard Battery Storage
Wind Resource
Passenger- Kilometres
Supply
Wave energyElectric vehicles
Waste biodigestionFisher Tropp
Fertiliser
Hydrogen Ref
Distributed Gen
Coal to Liquids
Supercritical water
CNG /LNG
REDOX batteries
Wood pellets
1°, 2°& 3°biofuels
MeOH fuel cells
Solar Hot Water
MSW gassifier
Comb Heat Power
Wind dam
Solar Tower
Hydrazine
Thermo-elec
Algae liquids
Petroleum refinery
Methane hydrates Organic PV Hot dry rock
Electric rail
Sequestration
Bio refinery
Landfill gas
Your input?
New Zealand’s EnergyScape
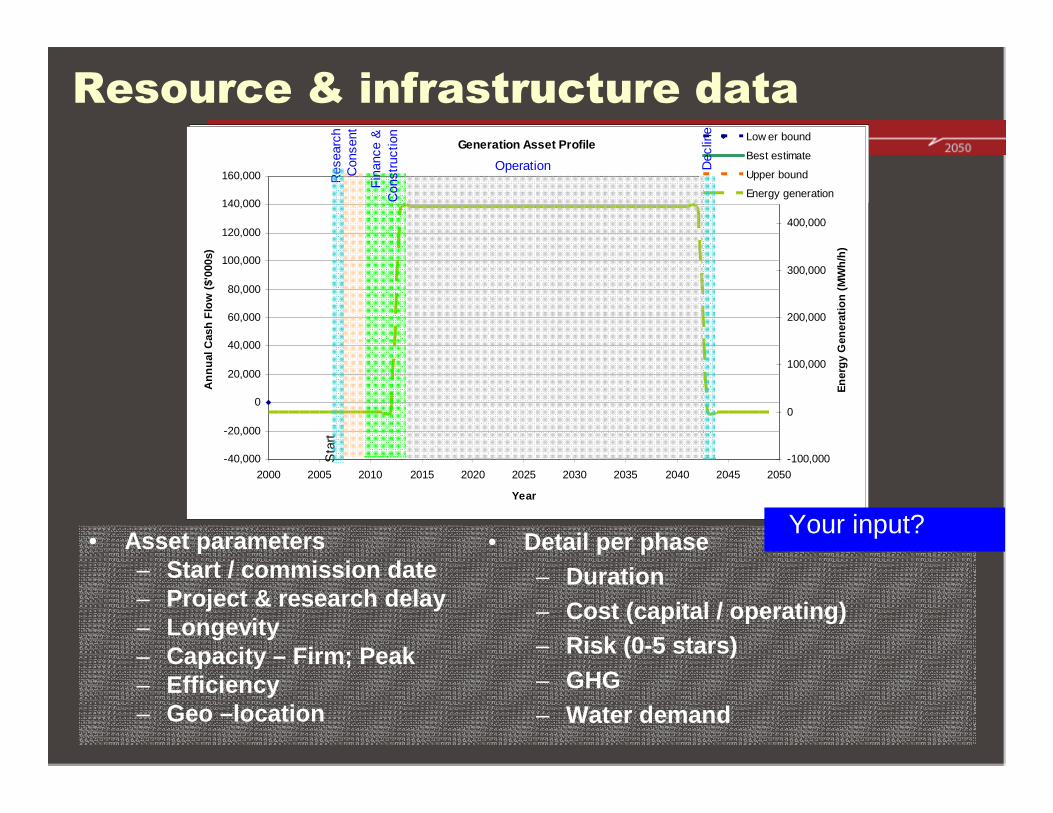
(���� ���2���1 ��� ���� �����
• Asset parameters – Start / commission date– Project & research delay – Longevity– Capacity – Firm; Peak– Efficiency– Geo –location
• Detail per phase– Duration– Cost (capital / operating)– Risk (0-5 stars)– GHG– Water demand
Simple database– All items treated as discrete assets– Phased behavior
Generation Asset Profile
-40,000
-20,000
0
20,000
40,000
60,000
80,000
100,000
120,000
140,000
160,000
2000 2005 2010 2015 2020 2025 2030 2035 2040 2045 2050
Year
Ann
ual C
ash
Flo
w (
$'00
0s)
0
0.2
0.4
0.6
0.8
1
1.2
Ene
rgy
Gen
erat
ion
(MW
h/h)
Low er bound
Best estimate
Upper bound
Energy generation
Sta
rtR
esea
rch
Con
sent
Fin
ance
&C
onst
ruct
ion
Operation Dec
line
Generation Asset Profile
-40,000
-20,000
0
20,000
40,000
60,000
80,000
100,000
120,000
140,000
160,000
2000 2005 2010 2015 2020 2025 2030 2035 2040 2045 2050
Year
Ann
ual C
ash
Flo
w (
$'00
0s)
-100,000
0
100,000
200,000
300,000
400,000
500,000
Ene
rgy
Gen
erat
ion
(MW
h/h)
Low er bound
Best estimate
Upper bound
Energy generation
Sta
rtR
esea
rch
Con
sent
Fin
ance
&C
onst
ruct
ion
Operation Dec
line
Your input?
New Zealand’s EnergyScape
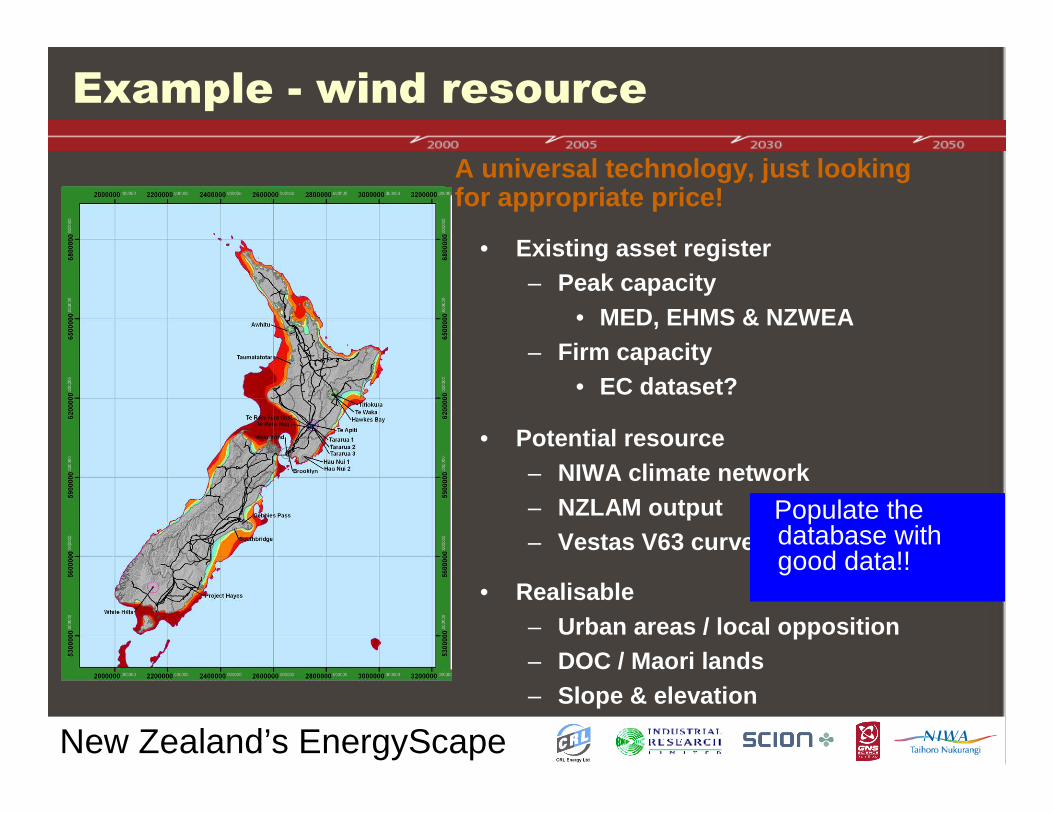
�3������4 ���� ���� ��
• Existing asset register– Peak capacity
• MED, EHMS & NZWEA– Firm capacity
• EC dataset?
• Potential resource– NIWA climate network– NZLAM output– Vestas V63 curve
• Realisable– Urban areas / local opposition– DOC / Maori lands– Slope & elevation
A universal technology, just looking for appropriate price!
Populate the database with good data!!
New Zealand’s EnergyScape
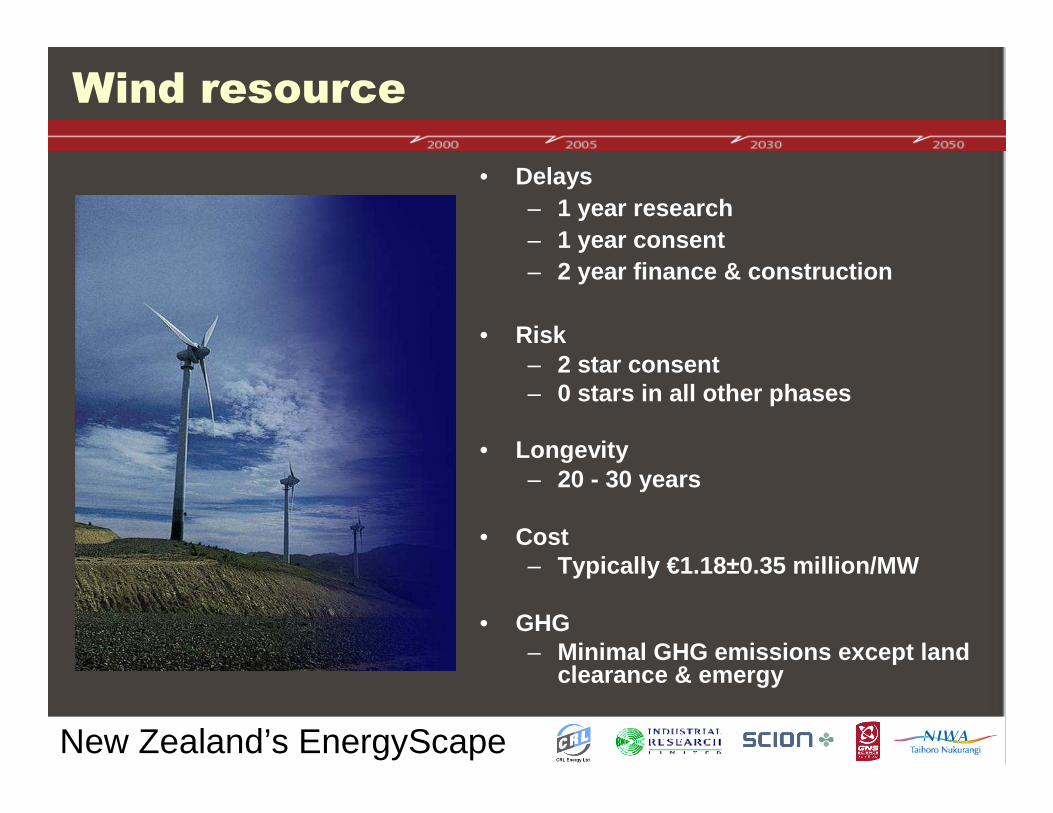
0��� ���� ��
• Delays– 1 year research– 1 year consent– 2 year finance & construction
• Risk– 2 star consent– 0 stars in all other phases
• Longevity– 20 - 30 years
• Cost– Typically €1.18±0.35 million/MW
• GHG– Minimal GHG emissions except land
clearance & emergy
New Zealand’s EnergyScape
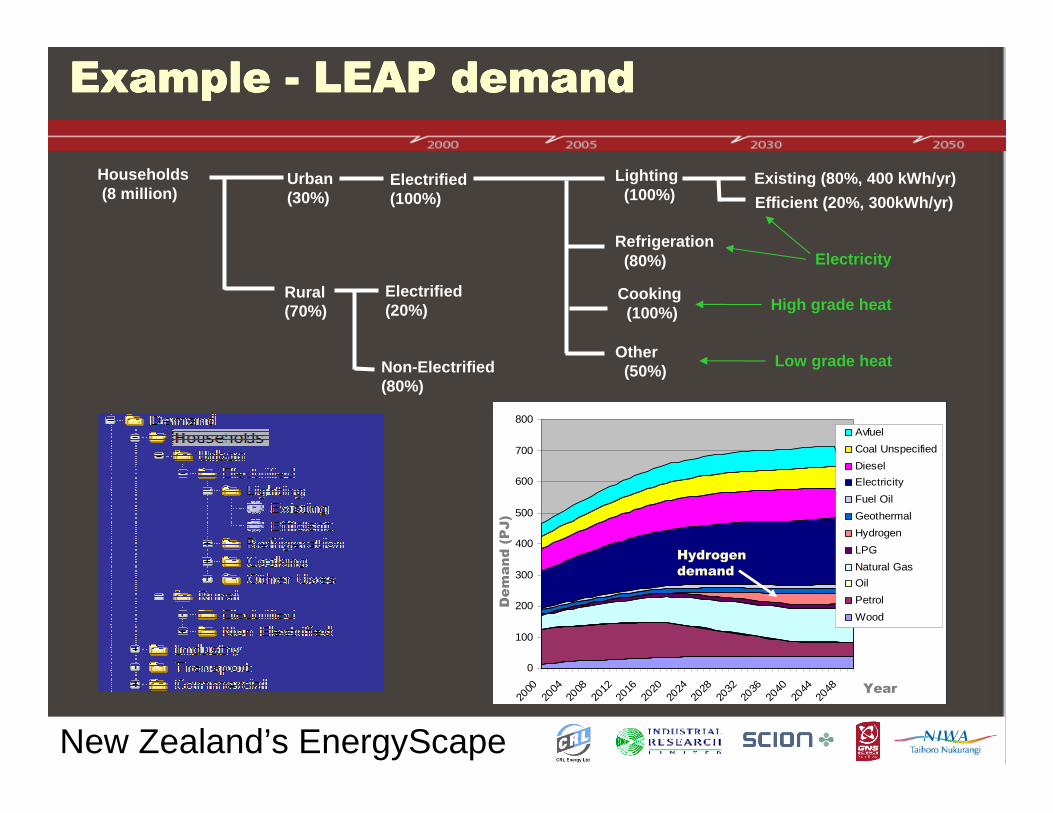
�3�������3�������3�������3������4444 $��������$��������$��������$��������
Households(8 million)
Cooking(100%)
Refrigeration(80%)
Lighting(100%)
Existing (80%, 400 kWh/yr)Urban(30%)
Rural(70%)
Efficient (20%, 300kWh/yr)
Other(50%)
Electrified(100%)
Electrified(20%)
Non-Electrified(80%)
High grade heat
Electricity
Low grade heat
0
100
200
300
400
500
600
700
800
2000
2004
2008
2012
2016
2020
2024
2028
2032
2036
2040
2044
2048
Avfuel
Coal Unspecified
Diesel
Electricity
Fuel Oil
Geothermal
Hydrogen
LPG
Natural Gas
Oil
Petrol
Wood
5�����6�78
9��
%� �����
�����
New Zealand’s EnergyScape
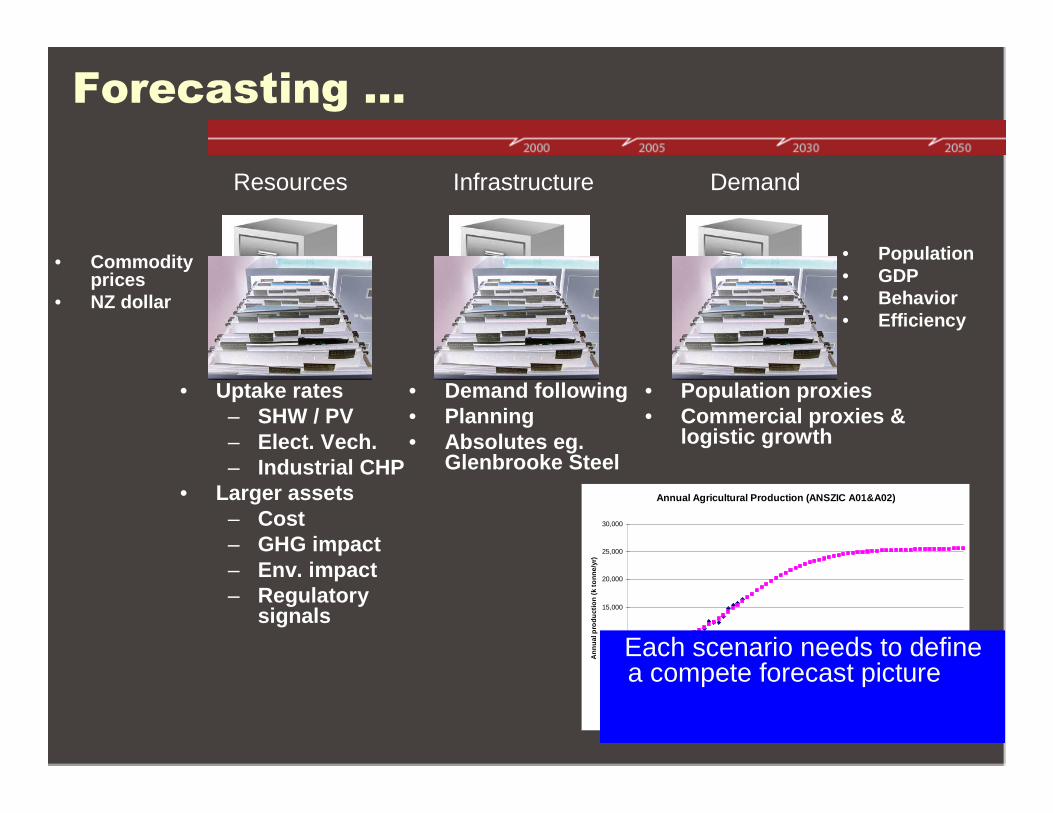
#� ���������,
• Population• GDP• Behavior• Efficiency
Resources
• Uptake rates– SHW / PV– Elect. Vech.– Industrial CHP
• Larger assets– Cost– GHG impact– Env. impact– Regulatory
signals
• Commodity prices
• NZ dollar
Infrastructure
• Demand following• Planning• Absolutes eg.
Glenbrooke Steel
Demand
• Population proxies• Commercial proxies &
logistic growth
Annual Agricultural Production (ANSZIC A01&A02)
0
5,000
10,000
15,000
20,000
25,000
30,000
1980
1990
2000
2010
2020
2030
2040
2050
Year
Ann
ual p
rodu
ctio
n (k
tonn
e/yr
)
Survey data
Projected
Each scenario needs to define a compete forecast picture

New Zealand’s EnergyScape
���"�� �������
����������:����� ��������!�����������������:����� ��������!�����������������:����� ��������!�����������������:����� ��������!�������
- December 2004 to December 2005
Import Indigenous Primary conversion Infrastructure End-use Export
Nett energy flow in petajoules (PJ)
Secondary conversion
$3 billion
$? billion
$2 billion
$5 billion pa
$12 billion
14,050 stars
1,250 tCO2 pa
New Zealand’s EnergyScape
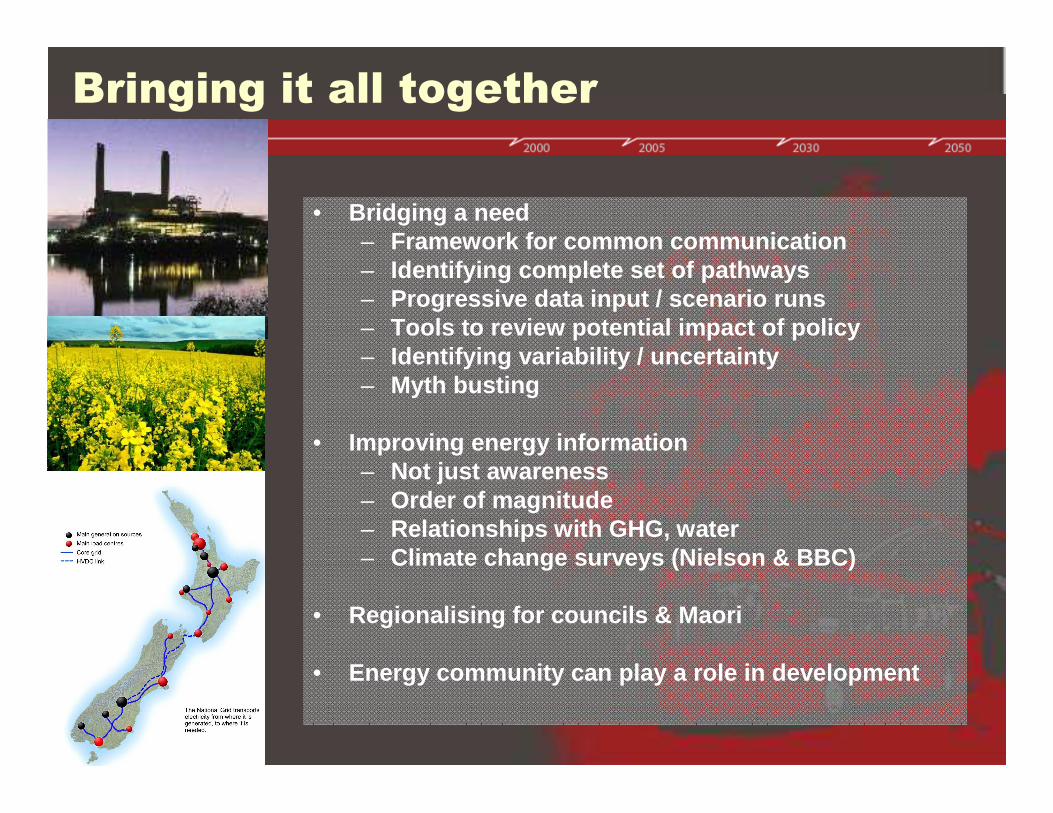
! �������������������)�
• Bridging a need– Framework for common communication– Identifying complete set of pathways– Progressive data input / scenario runs– Tools to review potential impact of policy– Identifying variability / uncertainty– Myth busting
• Improving energy information– Not just awareness– Order of magnitude– Relationships with GHG, water– Climate change surveys (Nielson & BBC)
• Regionalising for councils & Maori
• Energy community can play a role in development

New Zealand’s EnergyScape
�)� ��.��������-
New Zealand’s EnergyScape
������/��������-

New Zealand’s EnergyScape
%�������������� ��)�-
A high level process to develop strategy …
1. Have we got the methodology right? 2. Have we got the scope right?3. What do you see as the priority outputs?4. Have we got the level of stakeholder
engagement right? 5. What changes would you suggest?
Andrew [email protected] [email protected] [email protected] [email protected] [email protected]
New Zealand’s EnergyScape
��������������� �������
��� �������;����<��<�=��� �������;����<��<�=��� �������;����<��<�=��� �������;����<��<�=Andrew [email protected] [email protected] [email protected] [email protected] [email protected]


