Structural Engineering and Mechanics, Vol. 55, No. 4 (2015) 857-869
DOI: http://dx.doi.org/10.12989/sem.2015.55.4.857 857
Copyright © 2015 Techno-Press, Ltd.
http://www.techno-press.org/?journal=sem&subpage=8 ISSN: 1225-4568 (Print), 1598-6217 (Online)
Study of dynamic mechanical behavior of aluminum 7075-T6 with respect to diameters and L/D ratios using Split Hopkinson
Pressure Bar (SHPB)
Eunhye Kim1 and Hossein Changani2
1Department of Mining Engineering, Colorado School of Mines, Golden, CO, USA 2Department of Mining Engineering, University of Utah, Salt Lake City, UT, USA
(Received November 29, 2014, Revised July 10, 2015, Accepted August 4, 2015)
Abstract. The aluminum 7075-T6 is known as an alloy widely used in aircraft structural applications,
which does not exhibit strain rate sensitivity during dynamic compressive tests. Despite mechanical
importance of the material, there is not enough attention to determine appropriate sample dimensions such as
a sample diameter relative to the device bar diameter and sample length to diameter (L/D) ratio for dynamic
tests and how these two parameters can change mechanical behaviors of the sample under dynamic loading
condition. In this study, various samples which have different diameters of 31.8, 25.4, 15.9, and 9.5 mm and
sample L/D ratios of 2.0, 1.5, 1.0, 0.5, and 0.25 were tested using Split Hopkinson Pressure Bar (SHPB), as
this testing device is proper to characterize mechanical behaviors of solid materials at high strain rates. The
mechanical behavior of this alloy was examined under ~200–5,500 s-1
dynamic strain rate. Aluminum
samples of 2.0, 1.5 and 1.0 of L/D ratios were well fitted into the stress-strain curve, Madison and Green’s
diagram, regardless of the sample diameters. Also, the 0.5 and 0.25 L/D ratio samples having the diameter of
31.8 and 25.4 mm followed the stress-strain curve. As results, larger samples (31.8 and 25.4 mm) in
diameters followed the stress-strain curve regardless of the L/D ratios, whereas the 0.5 and 0.25 L/D ratios
of small diameter sample (15.9 and 9.5 mm) did not follow the stress-strain diagram but significantly deviate
from the diagram. Our results indicate that the L/D ratio is important determinant in stress-strain responses
under the SHPB test when the sample diameter is small relative to the test bar diameter (31.8 mm), but when
sample diameter is close to the bar diameter, L/D ratio does not significantly affect the stress-strain
responses. This suggests that the areal mismatch (non-contact area of the testing bar) between the sample
and the bar can misrepresent mechanical behaviors of the aluminum 7075-T6 at the dynamic loading
condition.
Keywords: aluminum 7075-T6; Split Hopkinson Pressure Bar; stress/strain response; strain rate
insensitivity; length to diameter ratio; sample diameter to the bar diameter
1. Introduction
The Split Hopkinson Pressure Bar (SHPB) was invented by Bertram Hopkinson in 1914 and
further developed by Kolsky (1949). For a few decades, many researchers have advanced SHPB to
Corresponding author, Assistant Professor, E-mail: [email protected]
Eunhye Kim and Hossein Changani
measure dynamic mechanical properties of many different materials. Especially, this technique is useful to examine dynamic responses of solid materials undergoing high strain rates between 102–104 s-1 (Kim and de Oliveira 2015a, Kim and de Oliveira 2015b). It has reported that dimension (length (L)/diameter (D) ratio) geomaterials is a critical determinant in obtaining accurate mechanical behaviors using SHPB (Dai et al. 2010, Changani et al. 2013). Although several researchers have tested various samples, it is not fully understood how sample dimensions relative to the device bar size can affect dynamic mechanical behaviors. Thus, it is important for understanding of the effect of the diameter of samples relative to SHPB diameter and the L/D ratio of samples on dynamic mechanical responses, since these two parameters can affect elastic behavior of solid materials mostly due to friction and inertia.
Davies and Hunter tested copper, aluminum, zinc, magnesium, and brass by using 25.4 mm diameter of SHPB. In order to remove friction effects, ~one specimen thickness (length) to radius ratio (~two L/D ratio) was suggested (Davies and Hunter 1963). They demonstrated that relationship between stress and length and sample density by defining applied stress with 1 / 2
sl2 where s is sample density, l is length, and is strain acceleration. Maiden and Green
investigated compressive strain rate effect on six different materials by using 9.5 mm SHPB and four samples (6AL-4V titanium, pyrolytic graphite, lucite, and micarta) showed that an increase of strain rate caused an increase of the stress, whereas two aluminum samples (6061-T6 and 7075-T6) did not reveal sensitive behavior different from that found by Hauser et al. (1960) (Hauser et al. 1960, Maiden and Green 1966).
Gorham et al. (1984) reported the friction effects between the interfaces on the material flow stress of ring shape samples and demonstrated the relationship between mean applied pressure and yield strength with diameter to square root of the sample height (Gorham et al. 1984). In this report, they suggested that very short length samples could cause the friction between specimen-SHPB interfaces, which can affect lateral strain flow of samples and produced artificial uniaxial compressive result, whereas the long samples can cause uniform stress-strain along the specimen due to axial inertial effect. Gorham (1991) also proposed that sample size (dimension) deformation velocity, wave propagation, friction, and inertia could affect the deviation from the ideal stress and strain diagram of a material. Also, he reported that a rise time of incident pulse in microsecond could be numerically approximated to the bar diameter in millimeter, and demonstrated that as an increase of diameters of copper specimens significantly decreased strain rate (Gorham 1991).
Gray (2000) reported that radial and axial inertia effects could be eliminated by zeroing the term inside the bracket when specimen length/diameter (L/D) is equal to 3 sv /2 or the strain rate is held in constant during the tests, thus, for the Poisson’s ratio of 0.33, L/D ratio of 0.5, could minimize the inertia effect (Gray 2000). Also, American standard testing method (ASTM) suggests L/D ratio of samples within the range of 1.5 to 2 for compression test on metallic sample at room temperature (ASTM 2013). The strain sensitivity of copper and other metals was interpreted as structural rearrangements of materials by strain (Follansbee and Kocks 1988, Klepaczko 1988), supported based on the observation of microstructure deformation (Chiem 1988, Haque et al. 1988). Some researchers reported that there were no significant effects of either L/D or geometry on compression stress under high strain loading rate (Woldesenbet and Vinson 1999) and argued that the optimum L/D ratio for SHPB compression tests suggested by Davies and Hunter (1963) does not seems to be present (Zencker and Clos 1999). Recently, the L/D ratios of various materials such as concrete, fiber-reinforced concrete, and magnesium alloy (AZ31B) have been studied (Sunny et al. 2007, Wang et al. 2011, Hao and Hao 2013, Hao et al. 2013, Xiao and Shu 2013). However, there was no good agreement in optimum L/D ratio for the SHPB dynamic
858

Study of dynamic mechanical behavior of aluminum 7075-T6 with respect to diameters...
compression test. In this paper, we examined the L/D ratio and diameter effects of the aluminum 7075-T6 on
dynamic compressive behaviors using SHPB. As the aluminum 7075-T6 hardly reveals strain rate sensitive responses under different loading rates enabling to remove one parameter (strain rate effect), this material is close to an ideal sample for the analysis of the sample size effect. Also, we compared our results with the stress/strain curve (Maiden and Green’s diagram) of the aluminum 7075-T6 (Maiden and Green 1966), also referred as Meyers' diagram (Meyers 1994). 2. Experimental setup
The SHPB test device shown in Fig. 1 illustrated the basic idea that the aluminum sample was placed between two bars (Changani et al. 2013). This device consists of an air gas gun, a striker, an incident bar, a transmitted bar, an energy absorber (stopper), an oscilloscope and laser indicators for measuring the striker velocity, strain gages, amplifiers, data acquisition system, and AC power supply. Each bar has 31.8 mm in diameter and 1,295 mm in length, 189.3 GPa Young’s modulus (E), 7.813 g/cm3 bulk density of the bar material, and 4,992 m/s wave velocity of bars (C), respectively (Kim 1993). The gas gun was designed to propel 10 cm long, 3 cm diameter, and 456 g of a striker bar with various gas pressures that determine the velocity of the striker. The velocity of the striker was measured with the oscilloscope (Nicolet 3091) and laser indicators. In this study, the striker was fired by a gun with 25 psi gas pressure and the average velocity of the striker was about 12.5 m/s. When the striker hit the incident bar, the impact creates a compressive stress wave into the incident bar as an incident pulse (I). This dynamic stress propagates through the incident bar. When the stress wave reaches to the interface between incident bar and specimen, due to different impedance between the sample and the bars, a part of this wave at the interface was reflected into incident bar as reflected pulse (R) and rest of the wave was dispersed to the transmitted bar as transmitted pulse (T). These pulses were measured by strain gages (EA-06-250TK-10C) that mounted on the middle of each bar with amplifiers. These all data were collected by the data acquisition system (Nicolet Odyssey XE) with 10 million samples per second rate.
Fig. 1 Schematic diagram of the SHPB device
859
Eunhye Kim and Hossein Changani
2.1 Sample preparation To examine the sample size and L/D ratio effects on dynamic behavior, the cylindrical shapes
of the aluminum 7075-T6 samples insensitive to strain rate under different loading rates were tested with SPHB. These alloy samples were prepared with four different diameters (31.8, 25.4, 15.9, and 9.5 mm) and five different L/D ratios (2.0, 1.5, 1.0, 0.5, and 0.25) with three replications (4×5×3=60). The sample diameters of 31.8, 25.4, 15.9, and 9.5 mm relative to the bar diameter (Db=31.8 mm) were indicated with 1Db, 0.8Db, 0.5Db, and 0.3Db, respectively. In other words, the samples of 100, 80, 50, and 30% relative to the bar diameter with different L/D ratios were tested to investigate areal mismatch effects on dynamic behaviors.
The mechanical behavior of the aluminum 7075-T6 specimens was obtained in the public website (Table 1) (http://asm.matweb.com). Also, we measured the mechanical properties of the aluminum samples using ultrasonic velocity, non-destructive and indirect testing method (Table 2). For all the tests, a thin layer of grease was applied in-between samples and bars to minimize friction effects at the interfaces. Each set up was tested for three times. Additionally, we aligned the bar and machines around 25.4 µm accuracy, and grinded each sample surface with 300 grit sandpaper to minimize sample variation for the surface finishes.
3. Theoretical background For the accurate analysis of SHPB, following assumptions or conditions should be met: (1) the
sample fails at one dimensional or uniaxial stress condition, (2) the specimen fails during the initial stress rise, and (3) stress wave reaches stress equilibrium (Anderson et al. 1992, Zhang and Zhao 2013).
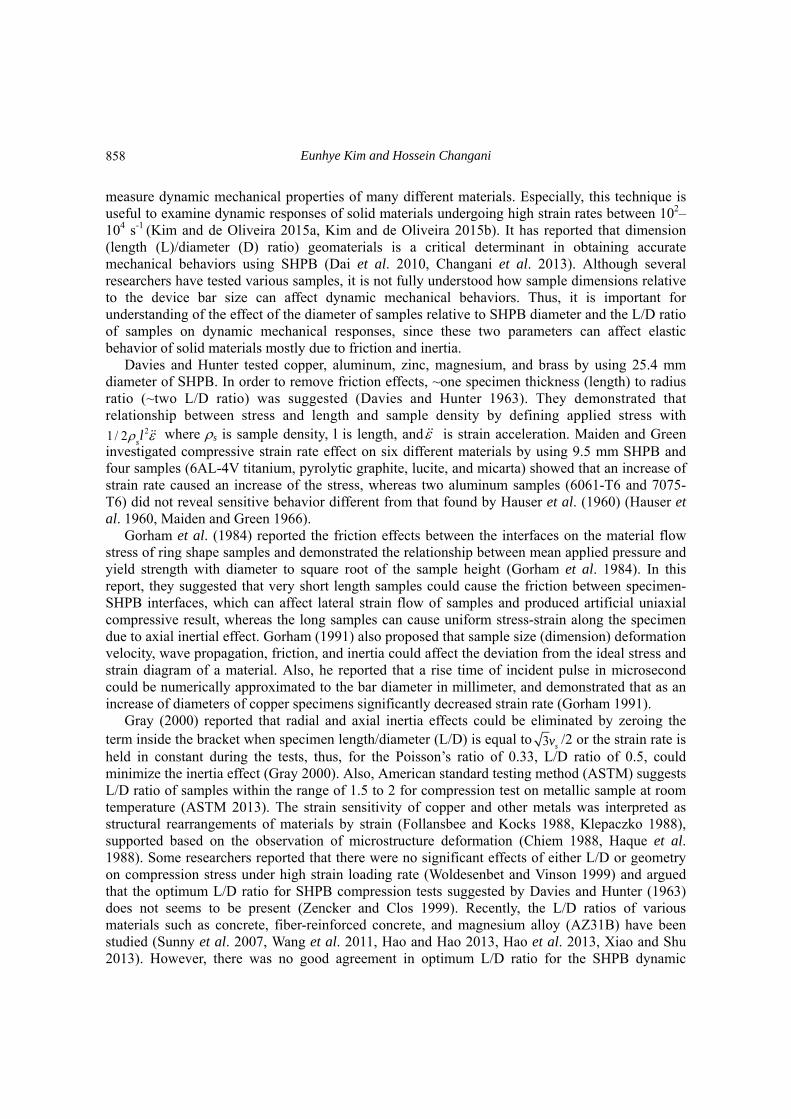
Table 1 Element and mechanical properties of the aluminum 7075-T6 (from material website: http://asm.matweb.com)
Component elements properties Aluminum, Al 87.1–91.4% Manganese, Mn <= 0.30% Chromium, Cr 0.18–0.28% Silicon, Si <= 0.40%
Copper, Cu 1.2–2.0% Titanium, Ti <= 0.20% Iron, Fe <= 0.50% Zinc, Zn 5.1–6.1%
Magnesium, Mg 2.1–2.9% Others <= 0.15% Mechanical Properties
Density (g/cm3)
Ultimate Tensile Strength (MPa)
Tensile Yield Strength (MPa)
Modulus of Elasticity
(GPa)
Poisson’s Ratio
Shear Modulus (GPa)
Shear Strength (MPa)
2.81 572 503 71.7 0.33 26.9 31
Table 2 Measured mechanical properties of the aluminum 7075-T6 using nondestructive testing method
Sample P Wave velocity
(m/s)
S Wave velocity
(m/s)
Density(g/cm3)
Young’s Modulus
(GPa) Poisson Ratio
Bulk Modulus (GPa)
Shear Modulus
(GPa)
AL-7075-T6 6,177.0 3112.7 2.7 69.4 0.33 68.0 26.1
860
Study of dynamic mechanical behavior of aluminum 7075-T6 with respect to diameters...
(a) (b)
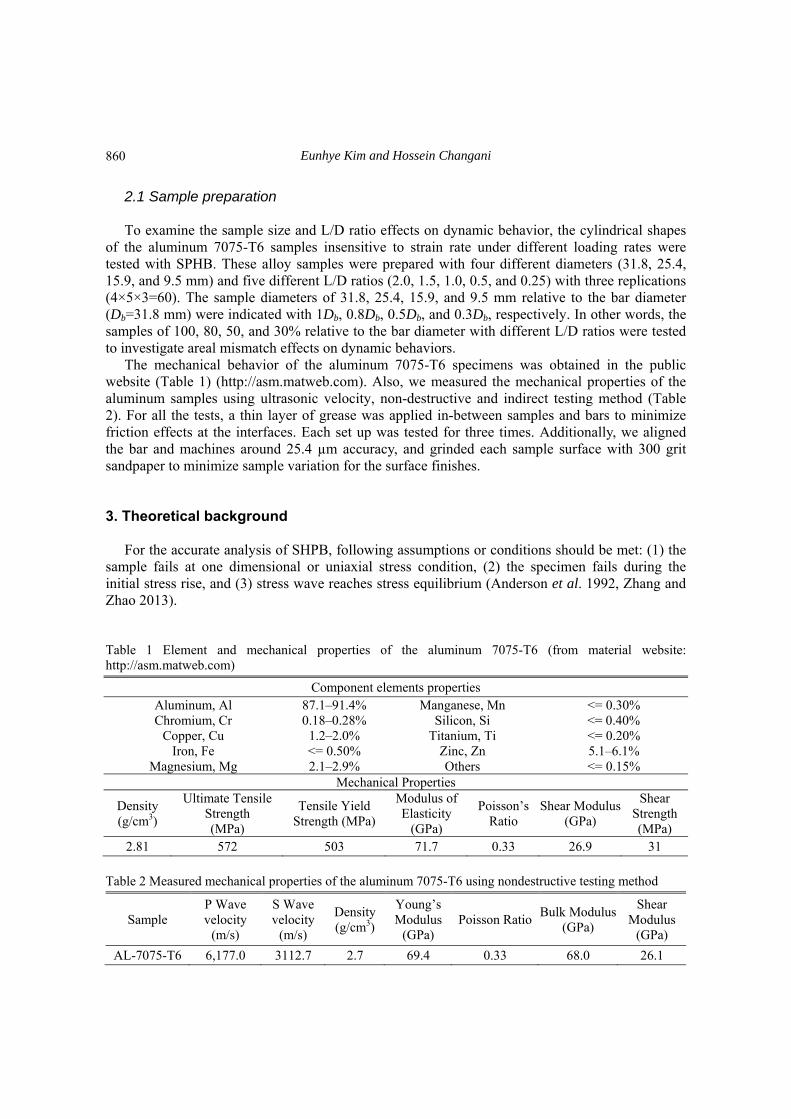
Fig. 2 Photo images of the aluminum 7075-T6 samples used for SHPB tests. (a) front view and (b) top view
Based on the recorded strain history of incident and reflected strains (I, R) and transmitted strain (T), the stress of sample’s interfaces is
)]()([)(1 tt
A
EAt RI
S
(1)
)()(2 t
A
EAt T
S
(2)
The strain rate (t) , strain (t), and average sample stress (t) can be calculated by Eqs. (1)-(5), respectively.
)]()()([)(
.
tttL
Ct TRI
ss
(3)
t
TRIs
s dttttL
Ct
0
)]()()([)(
(4)
)]()()([
2)( ttt
A
EAt TRI
Ss
(5)
Where A is the cross sectional area of the bars, and As and Ls are the cross sectional area and length of sample, respectively, and C is the longitudinal wave velocity in the bars, which is calculated by C E / where E and are the bars elastic modulus and density, respectively
(Kolsky 1949).
861
Eunhye Kim and Hossein Changani
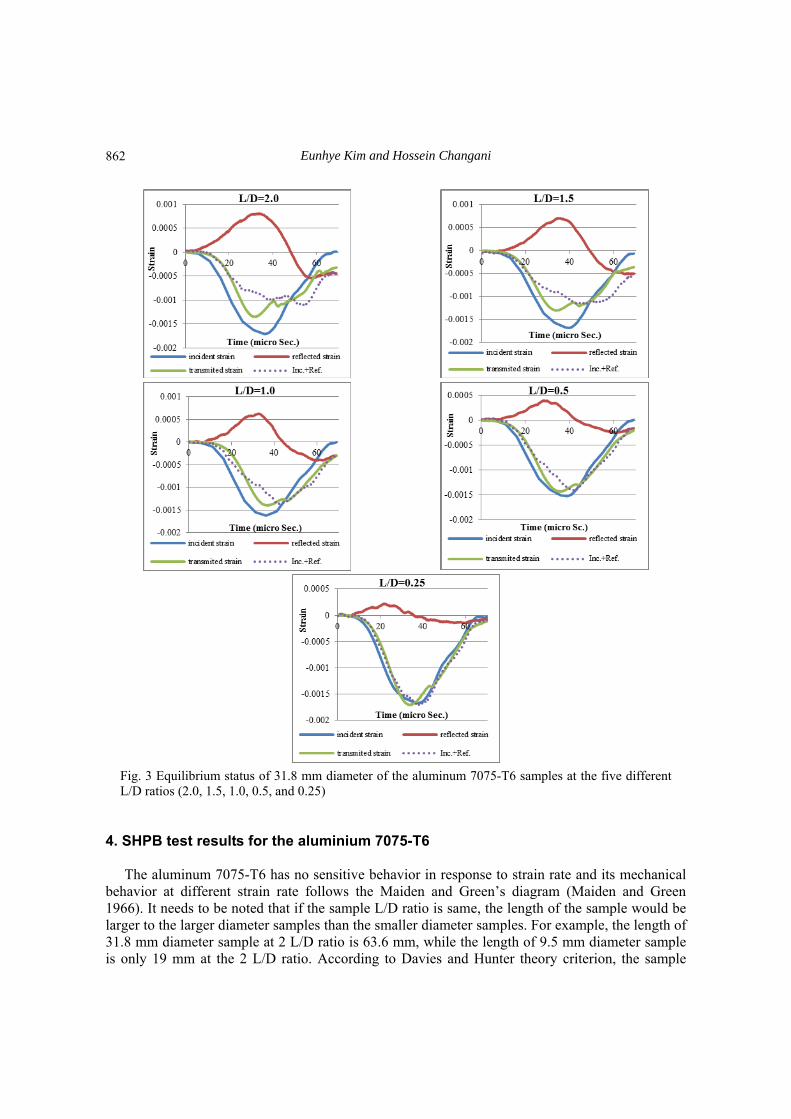
Fig. 3 Equilibrium status of 31.8 mm diameter of the aluminum 7075-T6 samples at the five different L/D ratios (2.0, 1.5, 1.0, 0.5, and 0.25)
4. SHPB test results for the aluminium 7075-T6
The aluminum 7075-T6 has no sensitive behavior in response to strain rate and its mechanical behavior at different strain rate follows the Maiden and Green’s diagram (Maiden and Green 1966). It needs to be noted that if the sample L/D ratio is same, the length of the sample would be larger to the larger diameter samples than the smaller diameter samples. For example, the length of 31.8 mm diameter sample at 2 L/D ratio is 63.6 mm, while the length of 9.5 mm diameter sample is only 19 mm at the 2 L/D ratio. According to Davies and Hunter theory criterion, the sample
862
Study of dynamic mechanical behavior of aluminum 7075-T6 with respect to diameters...
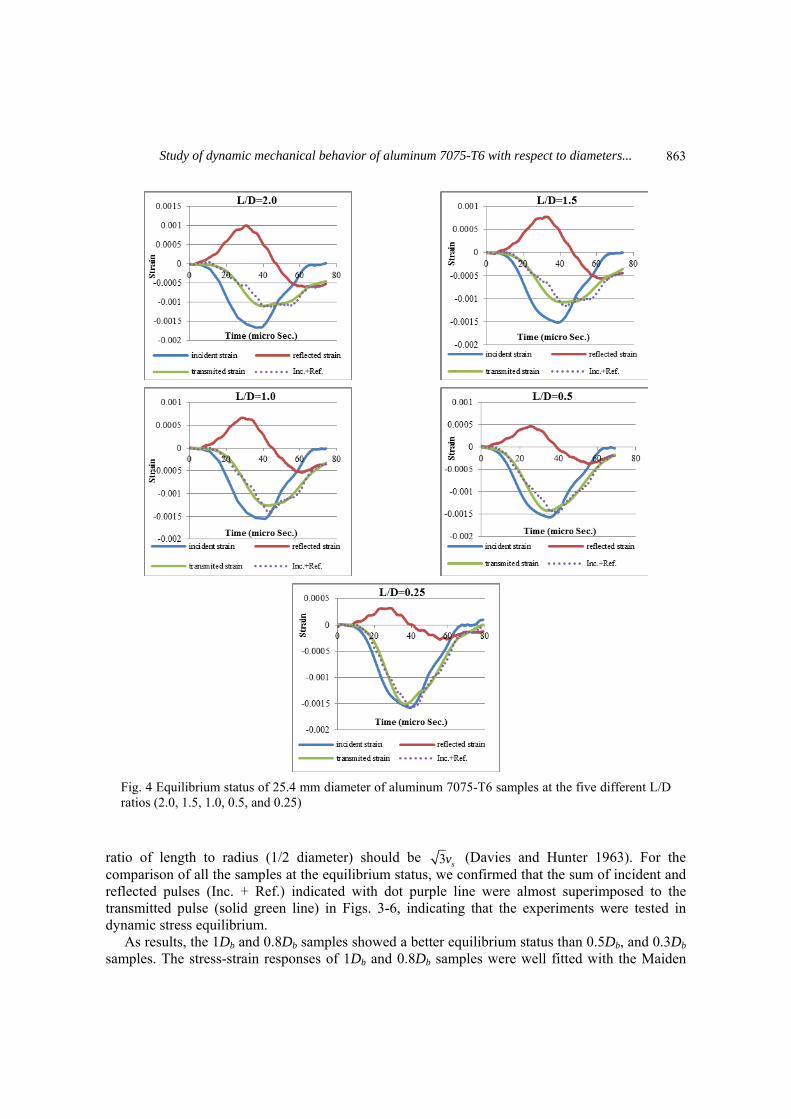
Fig. 4 Equilibrium status of 25.4 mm diameter of aluminum 7075-T6 samples at the five different L/D ratios (2.0, 1.5, 1.0, 0.5, and 0.25)
ratio of length to radius (1/2 diameter) should be 3 sv (Davies and Hunter 1963). For the comparison of all the samples at the equilibrium status, we confirmed that the sum of incident and reflected pulses (Inc. + Ref.) indicated with dot purple line were almost superimposed to the transmitted pulse (solid green line) in Figs. 3-6, indicating that the experiments were tested in dynamic stress equilibrium.
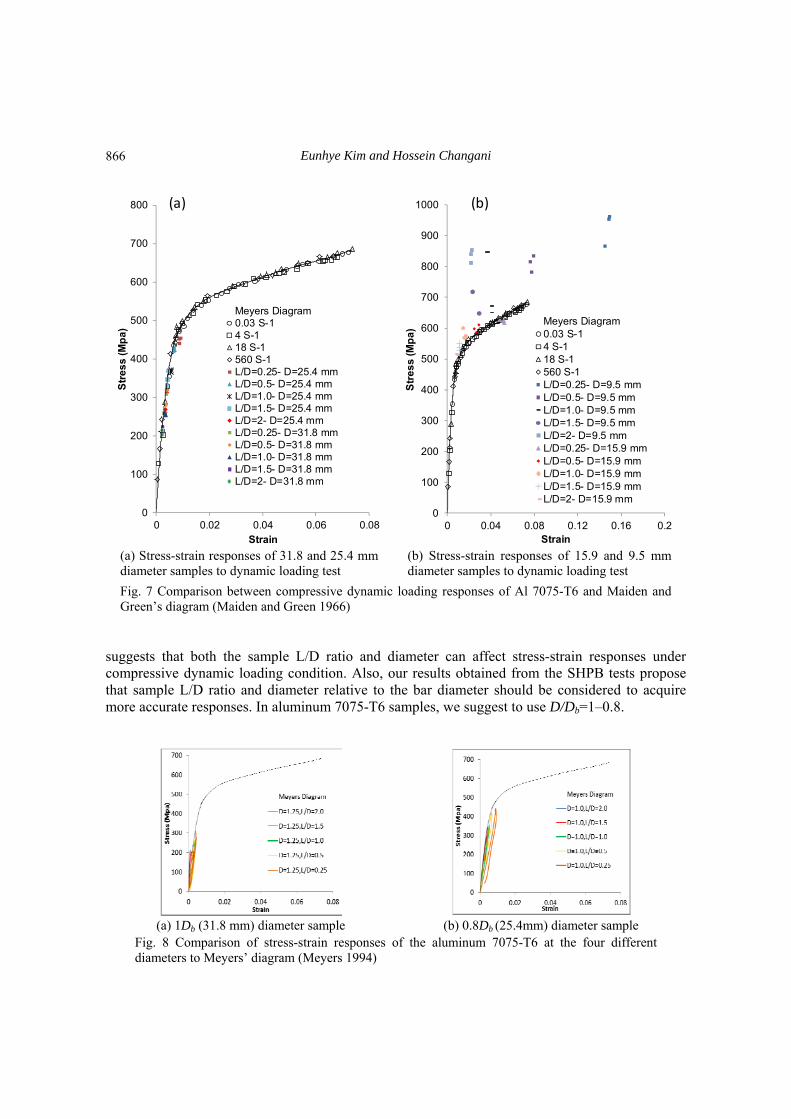
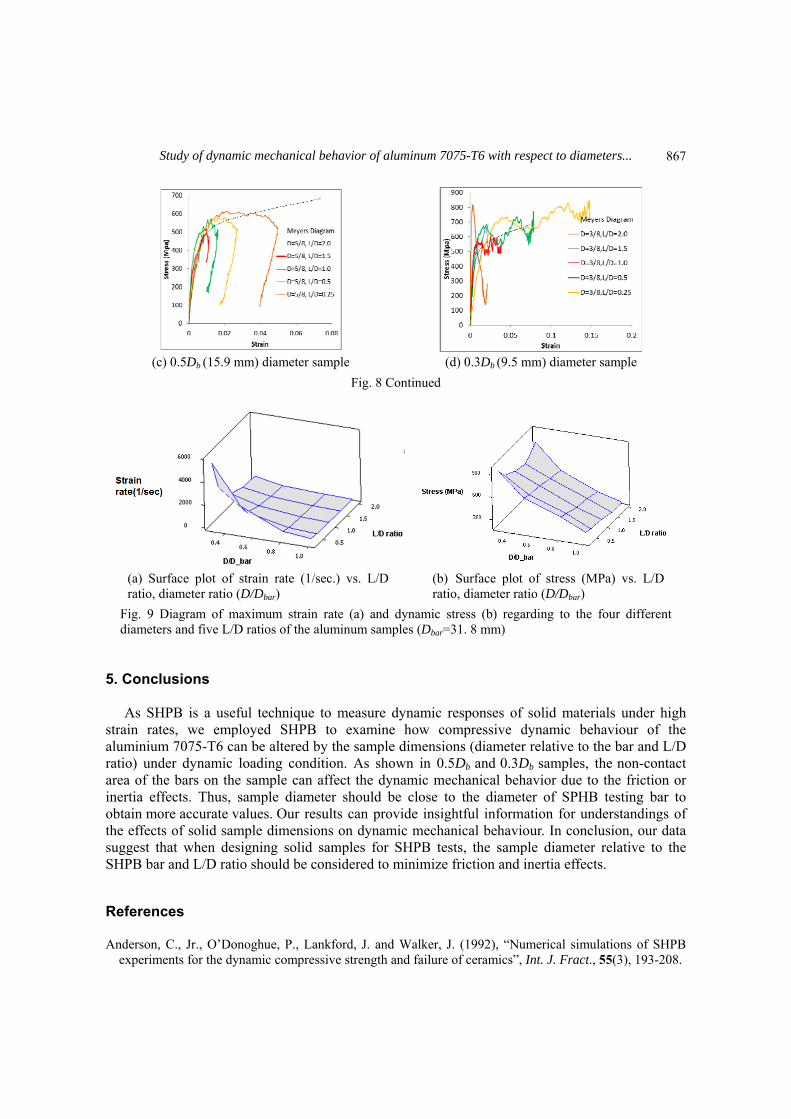
As results, the 1Db and 0.8Db samples showed a better equilibrium status than 0.5Db, and 0.3Db
samples. The stress-strain responses of 1Db and 0.8Db samples were well fitted with the Maiden
863
Eunhye Kim and Hossein Changani
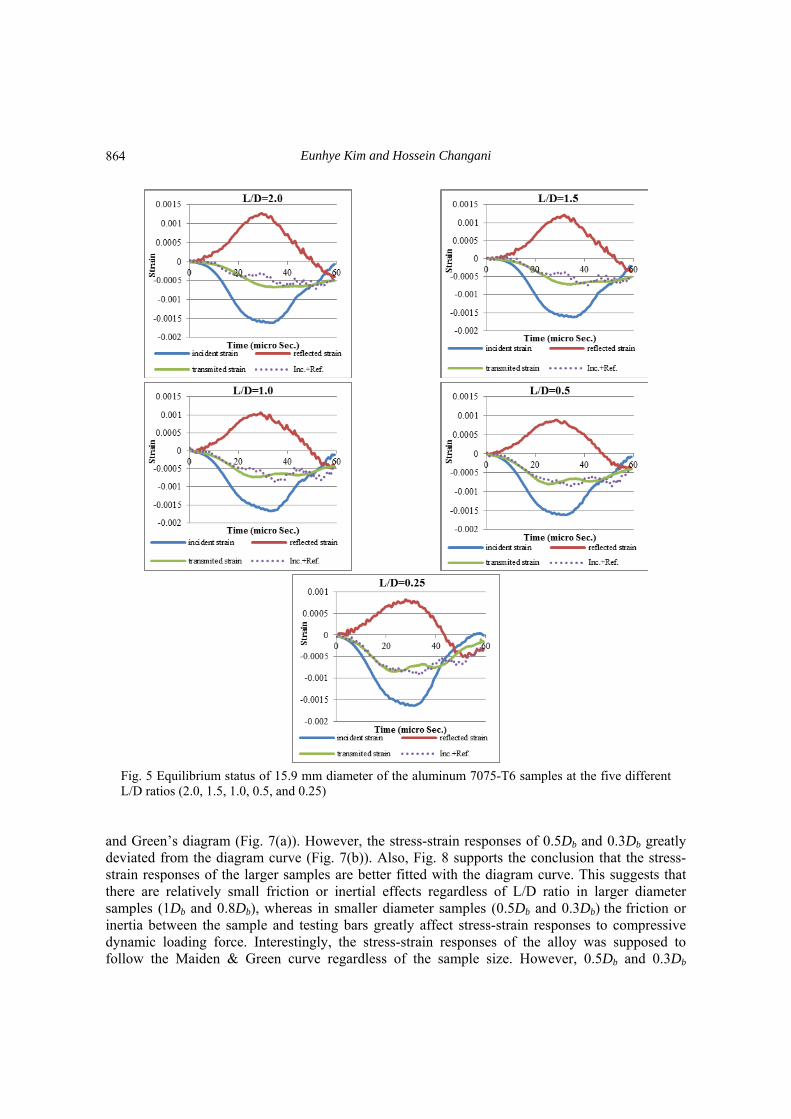
Fig. 5 Equilibrium status of 15.9 mm diameter of the aluminum 7075-T6 samples at the five different L/D ratios (2.0, 1.5, 1.0, 0.5, and 0.25)
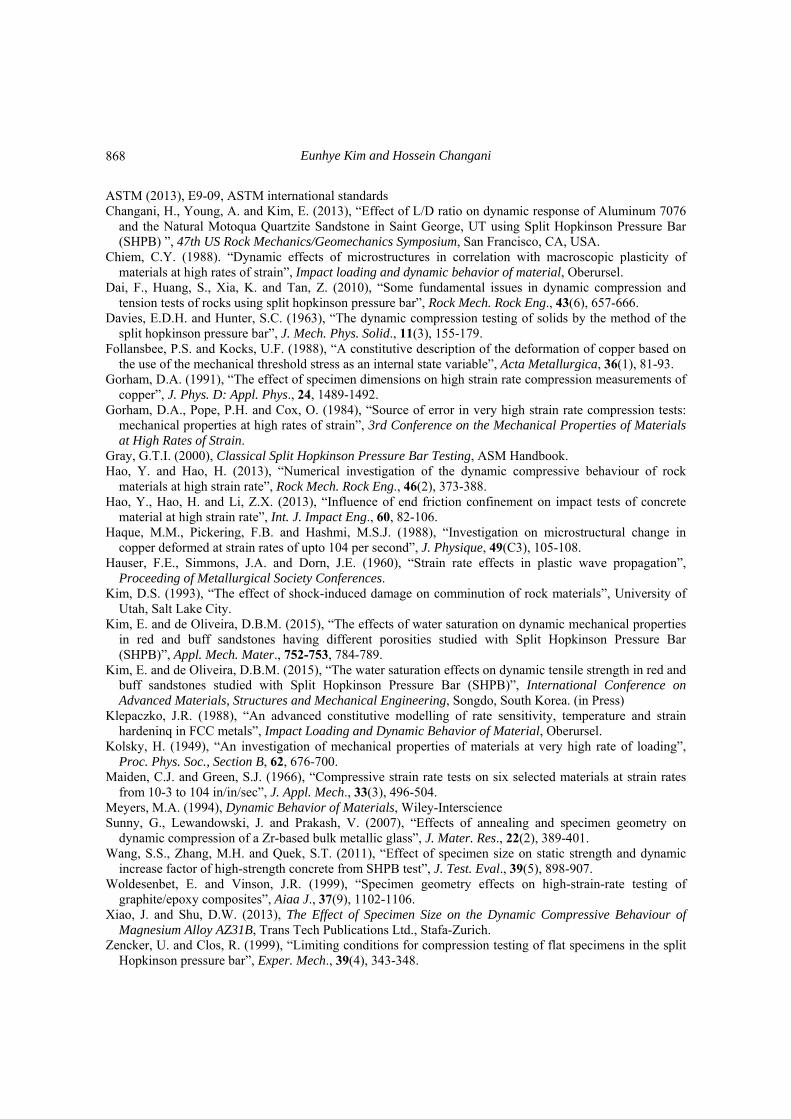
and Green’s diagram (Fig. 7(a)). However, the stress-strain responses of 0.5Db and 0.3Db greatly deviated from the diagram curve (Fig. 7(b)). Also, Fig. 8 supports the conclusion that the stress-strain responses of the larger samples are better fitted with the diagram curve. This suggests that there are relatively small friction or inertial effects regardless of L/D ratio in larger diameter samples (1Db and 0.8Db), whereas in smaller diameter samples (0.5Db and 0.3Db) the friction or inertia between the sample and testing bars greatly affect stress-strain responses to compressive dynamic loading force. Interestingly, the stress-strain responses of the alloy was supposed to follow the Maiden & Green curve regardless of the sample size. However, 0.5Db and 0.3Db
864
Study of dynamic mechanical behavior of aluminum 7075-T6 with respect to diameters...
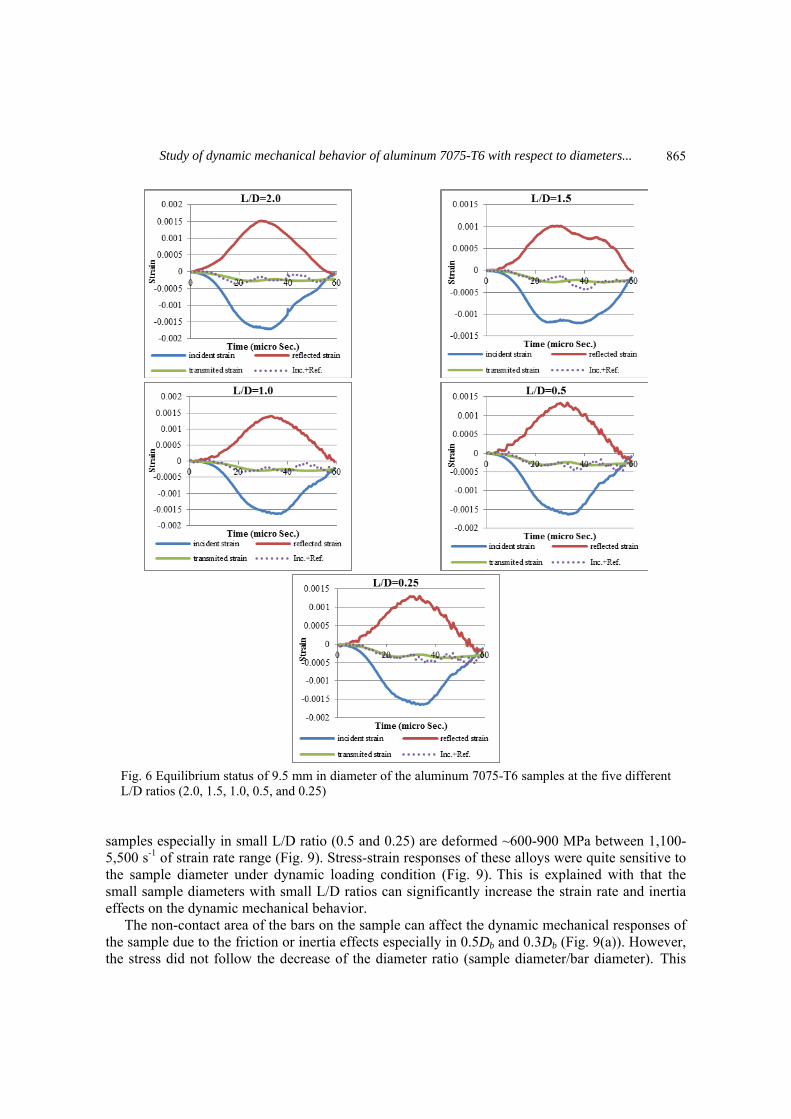
Fig. 6 Equilibrium status of 9.5 mm in diameter of the aluminum 7075-T6 samples at the five different L/D ratios (2.0, 1.5, 1.0, 0.5, and 0.25)
samples especially in small L/D ratio (0.5 and 0.25) are deformed ~600-900 MPa between 1,100-5,500 s-1 of strain rate range (Fig. 9). Stress-strain responses of these alloys were quite sensitive to the sample diameter under dynamic loading condition (Fig. 9). This is explained with that the small sample diameters with small L/D ratios can significantly increase the strain rate and inertia effects on the dynamic mechanical behavior.
The non-contact area of the bars on the sample can affect the dynamic mechanical responses of the sample due to the friction or inertia effects especially in 0.5Db and 0.3Db (Fig. 9(a)). However, the stress did not follow the decrease of the diameter ratio (sample diameter/bar diameter). This
865
Eunhye Kim and Hossein Changani
0
100
200
300
400
500
600
700
800
0 0.02 0.04 0.06 0.08
Str
es
s (
Mp
a)
Strain
Meyers Diagram0.03 S-14 S-118 S-1560 S-1L/D=0.25- D=25.4 mmL/D=0.5- D=25.4 mmL/D=1.0- D=25.4 mmL/D=1.5- D=25.4 mmL/D=2- D=25.4 mmL/D=0.25- D=31.8 mmL/D=0.5- D=31.8 mmL/D=1.0- D=31.8 mmL/D=1.5- D=31.8 mmL/D=2- D=31.8 mm
(a)
0
100
200
300
400
500
600
700
800
900
1000
0 0.04 0.08 0.12 0.16 0.2
Str
es
s (M
pa
)
Strain
Meyers Diagram0.03 S-14 S-118 S-1560 S-1L/D=0.25- D=9.5 mmL/D=0.5- D=9.5 mmL/D=1.0- D=9.5 mmL/D=1.5- D=9.5 mmL/D=2- D=9.5 mmL/D=0.25- D=15.9 mmL/D=0.5- D=15.9 mmL/D=1.0- D=15.9 mmL/D=1.5- D=15.9 mmL/D=2- D=15.9 mm
(b)
(a) Stress-strain responses of 31.8 and 25.4 mm diameter samples to dynamic loading test
(b) Stress-strain responses of 15.9 and 9.5 mm diameter samples to dynamic loading test
Fig. 7 Comparison between compressive dynamic loading responses of Al 7075-T6 and Maiden and Green’s diagram (Maiden and Green 1966)
suggests that both the sample L/D ratio and diameter can affect stress-strain responses under compressive dynamic loading condition. Also, our results obtained from the SHPB tests propose that sample L/D ratio and diameter relative to the bar diameter should be considered to acquire more accurate responses. In aluminum 7075-T6 samples, we suggest to use D/Db=1–0.8.
(a) 1Db (31.8 mm) diameter sample (b) 0.8Db (25.4mm) diameter sample
Fig. 8 Comparison of stress-strain responses of the aluminum 7075-T6 at the four different diameters to Meyers’ diagram (Meyers 1994)
866
Study of dynamic mechanical behavior of aluminum 7075-T6 with respect to diameters...
(c) 0.5Db (15.9 mm) diameter sample (d) 0.3Db (9.5 mm) diameter sample
Fig. 8 Continued
(a) Surface plot of strain rate (1/sec.) vs. L/D ratio, diameter ratio (D/Dbar)
(b) Surface plot of stress (MPa) vs. L/D ratio, diameter ratio (D/Dbar)
Fig. 9 Diagram of maximum strain rate (a) and dynamic stress (b) regarding to the four different diameters and five L/D ratios of the aluminum samples (Dbar=31. 8 mm)
5. Conclusions
As SHPB is a useful technique to measure dynamic responses of solid materials under high strain rates, we employed SHPB to examine how compressive dynamic behaviour of the aluminium 7075-T6 can be altered by the sample dimensions (diameter relative to the bar and L/D ratio) under dynamic loading condition. As shown in 0.5Db and 0.3Db samples, the non-contact area of the bars on the sample can affect the dynamic mechanical behavior due to the friction or inertia effects. Thus, sample diameter should be close to the diameter of SPHB testing bar to obtain more accurate values. Our results can provide insightful information for understandings of the effects of solid sample dimensions on dynamic mechanical behaviour. In conclusion, our data suggest that when designing solid samples for SHPB tests, the sample diameter relative to the SHPB bar and L/D ratio should be considered to minimize friction and inertia effects. References Anderson, C., Jr., O’Donoghue, P., Lankford, J. and Walker, J. (1992), “Numerical simulations of SHPB
experiments for the dynamic compressive strength and failure of ceramics”, Int. J. Fract., 55(3), 193-208.
867
Eunhye Kim and Hossein Changani
ASTM (2013), E9-09, ASTM international standards Changani, H., Young, A. and Kim, E. (2013), “Effect of L/D ratio on dynamic response of Aluminum 7076
and the Natural Motoqua Quartzite Sandstone in Saint George, UT using Split Hopkinson Pressure Bar (SHPB) ”, 47th US Rock Mechanics/Geomechanics Symposium, San Francisco, CA, USA.
Chiem, C.Y. (1988). “Dynamic effects of microstructures in correlation with macroscopic plasticity of materials at high rates of strain”, Impact loading and dynamic behavior of material, Oberursel.
Dai, F., Huang, S., Xia, K. and Tan, Z. (2010), “Some fundamental issues in dynamic compression and tension tests of rocks using split hopkinson pressure bar”, Rock Mech. Rock Eng., 43(6), 657-666.
Davies, E.D.H. and Hunter, S.C. (1963), “The dynamic compression testing of solids by the method of the split hopkinson pressure bar”, J. Mech. Phys. Solid., 11(3), 155-179.
Follansbee, P.S. and Kocks, U.F. (1988), “A constitutive description of the deformation of copper based on the use of the mechanical threshold stress as an internal state variable”, Acta Metallurgica, 36(1), 81-93.
Gorham, D.A. (1991), “The effect of specimen dimensions on high strain rate compression measurements of copper”, J. Phys. D: Appl. Phys., 24, 1489-1492.
Gorham, D.A., Pope, P.H. and Cox, O. (1984), “Source of error in very high strain rate compression tests: mechanical properties at high rates of strain”, 3rd Conference on the Mechanical Properties of Materials at High Rates of Strain.
Gray, G.T.I. (2000), Classical Split Hopkinson Pressure Bar Testing, ASM Handbook. Hao, Y. and Hao, H. (2013), “Numerical investigation of the dynamic compressive behaviour of rock
materials at high strain rate”, Rock Mech. Rock Eng., 46(2), 373-388. Hao, Y., Hao, H. and Li, Z.X. (2013), “Influence of end friction confinement on impact tests of concrete
material at high strain rate”, Int. J. Impact Eng., 60, 82-106. Haque, M.M., Pickering, F.B. and Hashmi, M.S.J. (1988), “Investigation on microstructural change in
copper deformed at strain rates of upto 104 per second”, J. Physique, 49(C3), 105-108. Hauser, F.E., Simmons, J.A. and Dorn, J.E. (1960), “Strain rate effects in plastic wave propagation”,
Proceeding of Metallurgical Society Conferences. Kim, D.S. (1993), “The effect of shock-induced damage on comminution of rock materials”, University of
Utah, Salt Lake City. Kim, E. and de Oliveira, D.B.M. (2015), “The effects of water saturation on dynamic mechanical properties
in red and buff sandstones having different porosities studied with Split Hopkinson Pressure Bar (SHPB)”, Appl. Mech. Mater., 752-753, 784-789.
Kim, E. and de Oliveira, D.B.M. (2015), “The water saturation effects on dynamic tensile strength in red and buff sandstones studied with Split Hopkinson Pressure Bar (SHPB)”, International Conference on Advanced Materials, Structures and Mechanical Engineering, Songdo, South Korea. (in Press)
Klepaczko, J.R. (1988), “An advanced constitutive modelling of rate sensitivity, temperature and strain hardeninq in FCC metals”, Impact Loading and Dynamic Behavior of Material, Oberursel.
Kolsky, H. (1949), “An investigation of mechanical properties of materials at very high rate of loading”, Proc. Phys. Soc., Section B, 62, 676-700.
Maiden, C.J. and Green, S.J. (1966), “Compressive strain rate tests on six selected materials at strain rates from 10-3 to 104 in/in/sec”, J. Appl. Mech., 33(3), 496-504.
Meyers, M.A. (1994), Dynamic Behavior of Materials, Wiley-Interscience Sunny, G., Lewandowski, J. and Prakash, V. (2007), “Effects of annealing and specimen geometry on
dynamic compression of a Zr-based bulk metallic glass”, J. Mater. Res., 22(2), 389-401. Wang, S.S., Zhang, M.H. and Quek, S.T. (2011), “Effect of specimen size on static strength and dynamic
increase factor of high-strength concrete from SHPB test”, J. Test. Eval., 39(5), 898-907. Woldesenbet, E. and Vinson, J.R. (1999), “Specimen geometry effects on high-strain-rate testing of
graphite/epoxy composites”, Aiaa J., 37(9), 1102-1106. Xiao, J. and Shu, D.W. (2013), The Effect of Specimen Size on the Dynamic Compressive Behaviour of
Magnesium Alloy AZ31B, Trans Tech Publications Ltd., Stafa-Zurich. Zencker, U. and Clos, R. (1999), “Limiting conditions for compression testing of flat specimens in the split
Hopkinson pressure bar”, Exper. Mech., 39(4), 343-348.
868

Study of dynamic mechanical behavior of aluminum 7075-T6 with respect to diameters...
Zhang, Q.B. and Zhao, J. (2013), “A review of dynamic experimental techniques and mechanical behaviour of rock materials”, Rock Mech. Rock Eng., 47(4), 1-68.
CC
869


