Download - Taxes and Financing Decisions

Taxes and Financing Decisions
Jonathan Lewellen & Katharina Lewellen

2
Overview Taxes and corporate decisions What are the tax effects of capital structure choices?
How do taxes affect the cost of capital?
How do taxes affect payout decisions?
How do taxes affect firms’ real investment decisions?

3
Trade-off theory
Leverage
Firm value
Target capital structure
VU + tax shields
VU + tax shields – distress costs
Debt vs. equity: (1 – τd) vs. (1 – τc)(1 – τe)
4
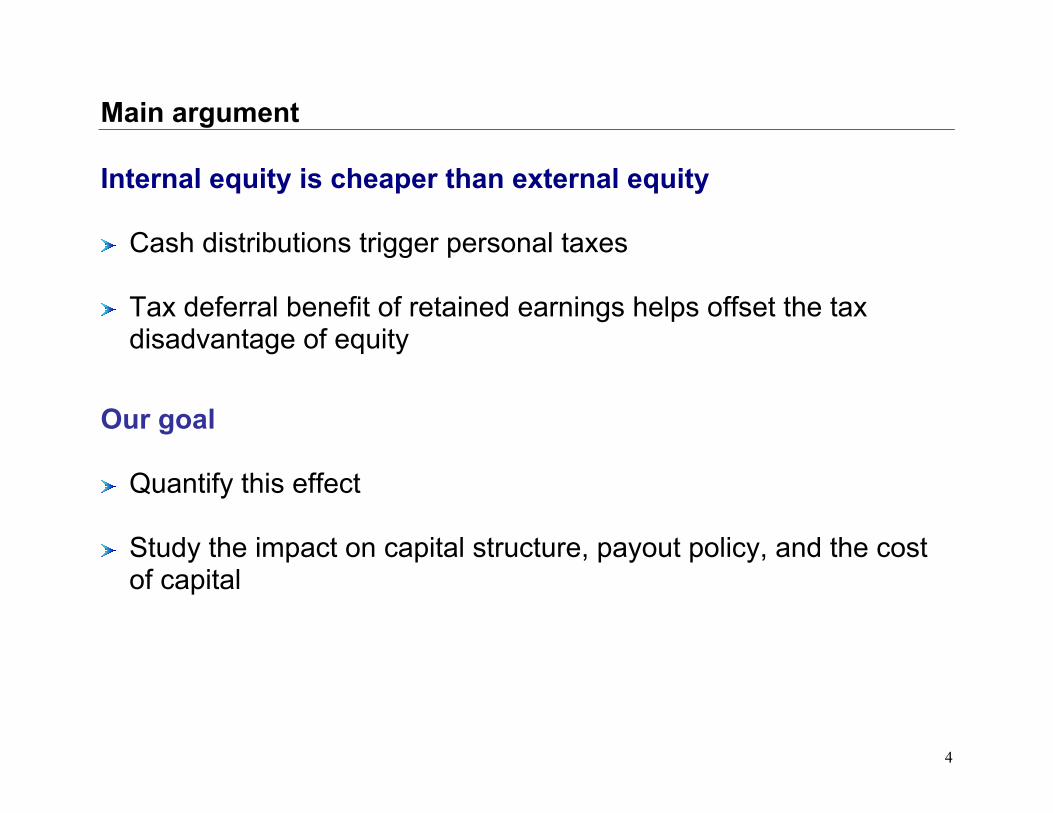
Main argument Internal equity is cheaper than external equity Cash distributions trigger personal taxes
Tax deferral benefit of retained earnings helps offset the tax disadvantage of equity
Our goal Quantify this effect
Study the impact on capital structure, payout policy, and the cost of capital
5
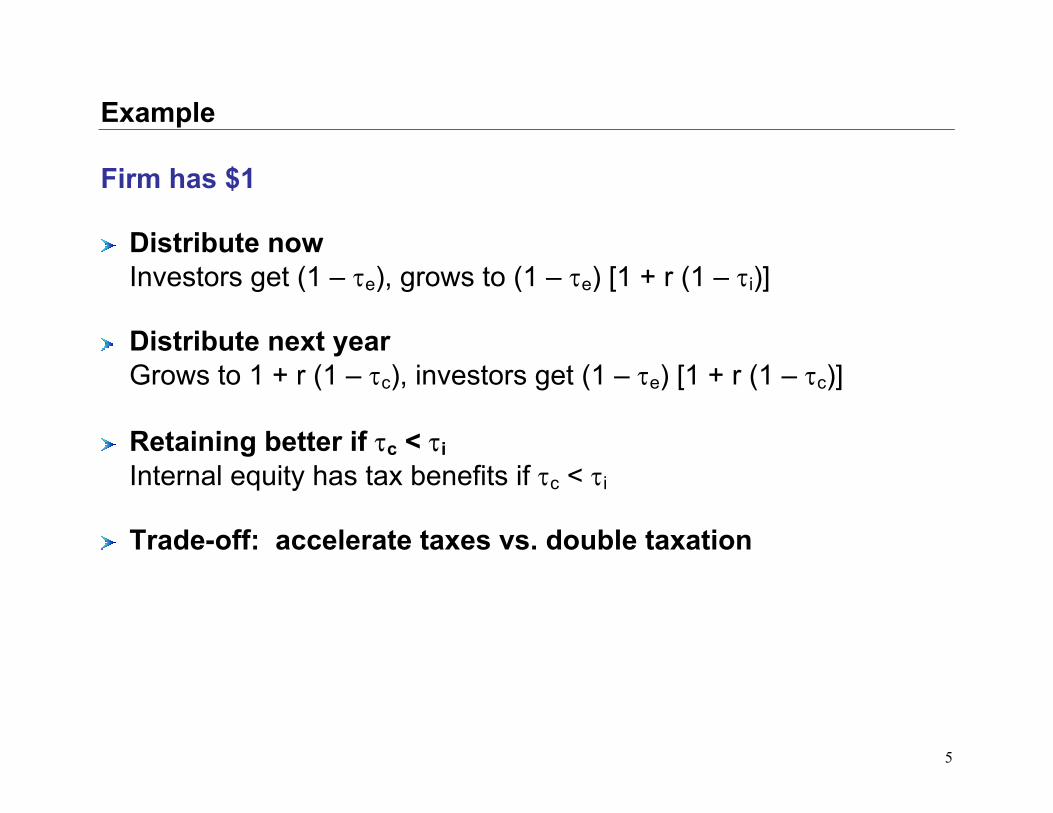
Example Firm has $1 Distribute now Investors get (1 – τe), grows to (1 – τe) [1 + r (1 – τi)]
Distribute next year Grows to 1 + r (1 – τc), investors get (1 – τe) [1 + r (1 – τc)]
Retaining better if τc < τi
Internal equity has tax benefits if τc < τi
Trade-off: accelerate taxes vs. double taxation

6
Example This paper Clarify and generalize this idea (the example makes strong implicit assumptions)
Miller (1977): (1 – τc) (1 – τe) > (1 – τi)?
Understand the implications for a firm’s capital structure, payout policy, and cost of capital

7
Overview Clarify the literature Capital structure Miller (1977), Hennessy and Whited (2004)
Dividend taxes King (1974), Auerbach (1979), Poterba and Summers (1985)

8
Outline Simple model with two periods
Discuss the literature
Implications for corporate behavior
Empirical estimates of the tax costs of equity

9
Model Study tax effects No agency conflicts, information asymmetries, or distress costs
t = 0
Investment opportunity, Y Raise D0, S0 Cash: C0 = D0 + S0 – Y
t = 1
Project pays Y + P1 Repay debt Equity distribution, δ1 Raise D1, S1 Invest cash in riskless asset
t = 2
Liquidation
10
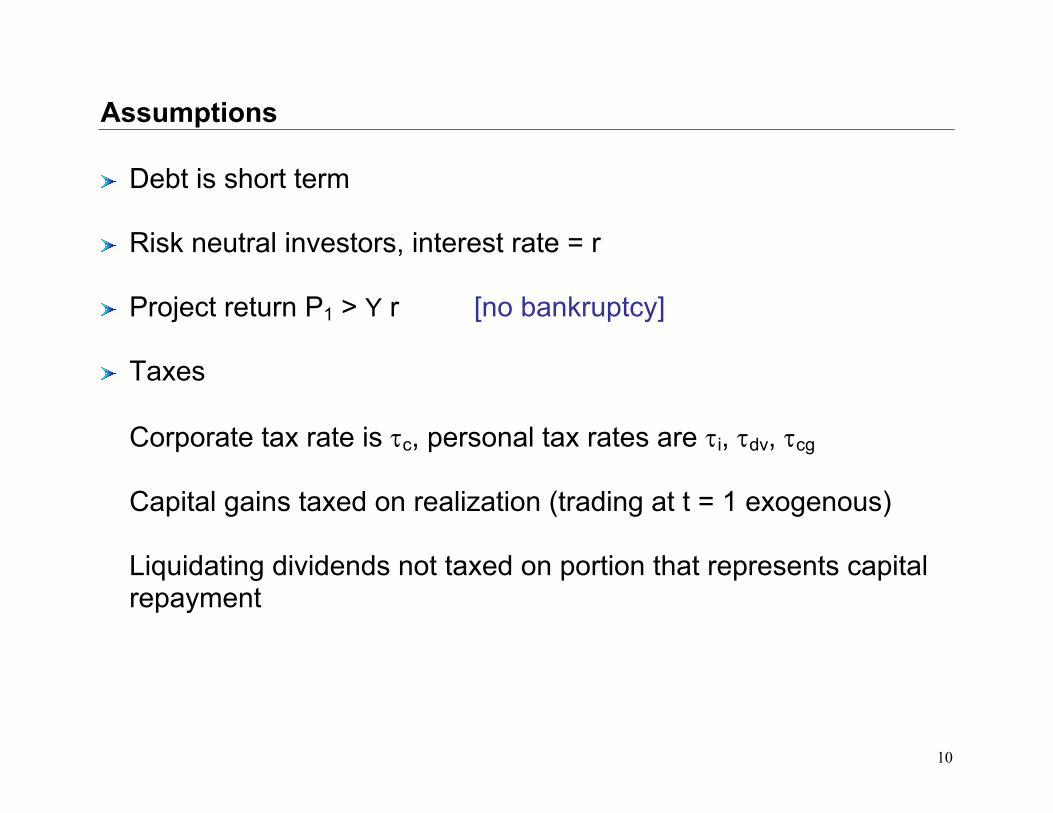
Assumptions Debt is short term
Risk neutral investors, interest rate = r
Project return P1 > Y r [no bankruptcy]
Taxes
Corporate tax rate is τc, personal tax rates are τi, τdv, τcg
Capital gains taxed on realization (trading at t = 1 exogenous)
Liquidating dividends not taxed on portion that represents capital repayment

11
Assumptions Classic tax system
Corporate profits, after interest, taxed at τc
Personal income taxed at τi, τdv, τcg
Imputation system
Personal tax credit for corporate taxes already paid on dividends
Effectively: τdv = 1 – (1 – τi) / (1 – τc)

12
Model Exogenous trading
t = 0 t = 1 t = 2
Investors: Trade α of their shares Realize gains of α (V1 – S0) Tax basis = (1 – α) S0 + α V1

13
Model Taxes
t = 0 t = 1 t = 2
Corporate tax Capital gains tax on a fraction of shares Personal tax on dividends / repurchases
No taxes Corporate tax Personal tax on dividends / liquidating repurchase

14
Tax effects Debt financing
New external equity
Internal equity / retained earnings

15
Cashflows Firm’s cashflows Arrival to date 1: C1 = Y + P1 (1 – τc) + (C0 – D0) [1 + r (1 – τc)]
Exit from date 1: C1′ = C1 + D1 + S1 – δ1
Arrival to date 2: C2 = (C1′ – D1) [1 + r (1 – τc)]
16
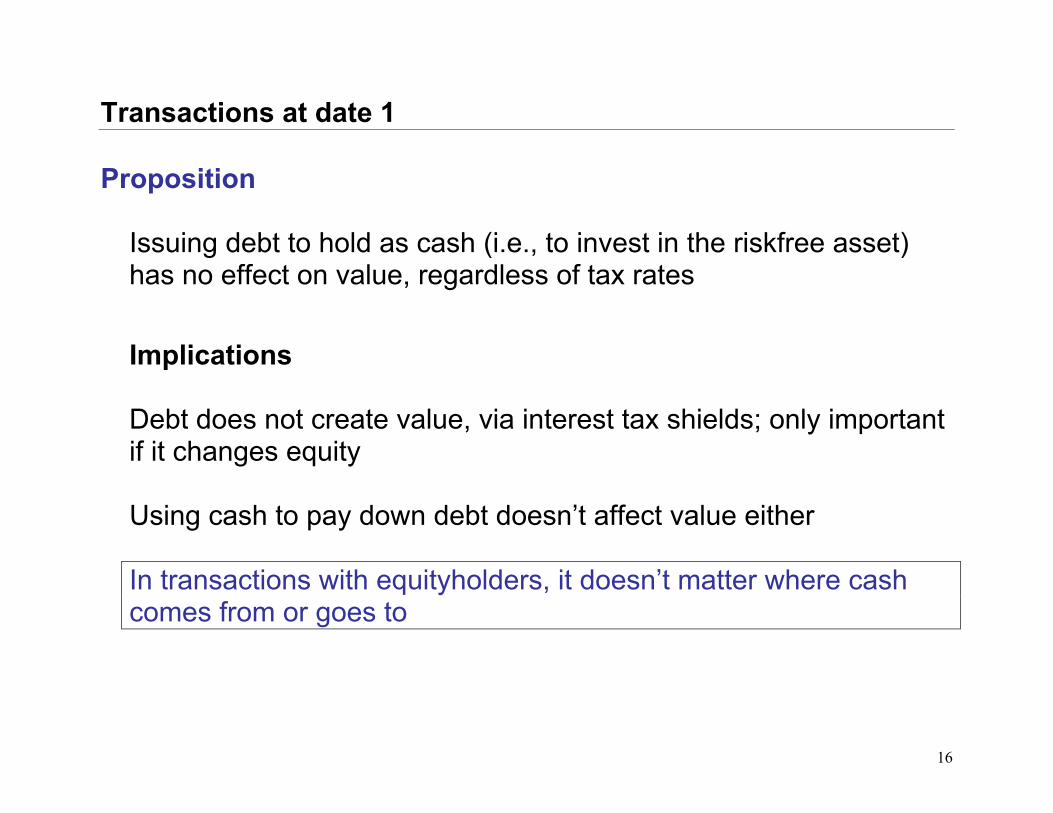
Transactions at date 1 Proposition
Issuing debt to hold as cash (i.e., to invest in the riskfree asset) has no effect on value, regardless of tax rates
Implications
Debt does not create value, via interest tax shields; only important if it changes equity
Using cash to pay down debt doesn’t affect value either
In transactions with equityholders, it doesn’t matter where cash comes from or goes to

17
Equity financing at date 1 External equity
Raise S1 at date 1
Shareholders’ CF2 = π2 + S1 [1 + r (1 – τc)(1 – τe)] τe is either τcg or τdv
NPV
Invest S1 = $1 in the firm: 1 + r (1 – τc)(1 – τe)
Invest $1 outside the firm: 1 + r (1 – τi)

18
Equity financing at date 1 Proposition 2 (Miller)* If the firm uses repurchases, the tax benefit of external equity is:
PV(S1) = S1 )1(r1r
iτ−+[(1 – τc)(1 – τcg) – (1 – τi)]
If the firm uses dividends, the tax benefit of external equity is:
PV(S1) = S1 )1(r1r
iτ−+[(1 – τc)(1 – τdv) – (1 – τi)]

19
Equity financing at date 1 Internal equity: retained earnings vs. repurchases Distribute all cash at date 1
t = 1: CF1 = C1 – τcg (C1 – S0)
Fully retain, distribute at date 2
t = 1: CF1 = – α τcg (V1 – S0) t = 2: CF2 = C2 – τcg (C2 – TB1)
[V1 = PV(CF2)]

20
Equity financing at date 1 Proposition 3
The tax benefit of internal equity at date 1, or the PV of retained cash vis-à-vis a share repurchase, is
PV(RE1) = RE1 cgi
cg
)1(r1)1(rβτ−τ−+
τ−[(1 – τc)(1 – βτcg) – (1 – τi)]
where β = TB1 / V1, the tax basis relative to current price when the firm doesn’t repurchase
β determines how much tax is triggered by repurchase at t = 1

21
Equity financing at date 1 Case 1: β = 0 [α = 0, S0 = 0] Internal equity has tax benefit (better than debt) if τc < τi
PV(RE1) = RE1 )1(r1)1(r
i
cg
τ−+τ−
[(1 – τc) – (1 – τi)]
Trade-off
If firm distributes at date 1, shareholders get C1 (1 – τcg), grows to C1 (1 – τcg) [1 + r (1 – τi)]
If firm retains the cash, it grows to C1 [1 + r (1 – τc)], shareholders get C1 (1 – τcg) [1 + r (1 – τc)]

22
Equity financing at date 1 Case 2: β = 1 [accrual taxation, α = 1] Internal and external equity are equivalent
PV(RE1) = RE1 cgi
cg
)1(r1)1(rτ−τ−+
τ−[(1 – τc)(1 – τcg) – (1 – τi)]
≈ RE1 )1(r1r
iτ−+[(1 – τc)(1 – τcg) – (1 – τi)]
Intuition
Payout triggers no new taxes → no deferral benefit
Shareholders pay tax on first-period earnings regardless of payout decision

23
Equity financing at date 1 Proposition 4: Retained earnings vs. dividends
With dividends, the tax benefit of internal equity at date 1, or the PV of retained cash vis-à-vis dividends, is
PV(RE1) = RE1 cgi
dv
)1(r1)1(rατ−τ−+
τ− [(1 – τc)(1 – ατcg) – (1 – τi)]
Observations
1 – τdv in numerator not 1 – τcg
α not β in brackets
Tax cost of dividends depends, in sign, on τcg not τdv

24
Equity financing at date 1 Why is ατcg important? Suppose α = 0
Example from introduction: dividend tax is a sunk cost
PV(RE1) = RE1 )1(r1)1(ri
dv
τ−+τ− [(1 – τc) – (1 – τi)]
If α > 0
Same except shareholders also pay capital gains taxes at t = 1 determined by α τcg

25
Interpretation Impact on capital structure? Impact on payout policy? Impact on the cost of capital and investment?

26
Capital structure Trade-off theory No distinction between internal and external equity
Target leverage ratio
Tax cost of equity depends on (1 – τc)(1 – τe) – (1 – τi)
[τe ambiguous; avg. of τdv and τcg]

27
Capital structure Our results Internal equity generally less costly than external equity
Equivalent only if α = β = 1 and either 1: Firms use repurchases 2: Firms use dividends and τcg = τdv
[with dividends, internal equity is cheaper if α τcg < τdv] [King, 1974; Auerbach, 1979]

28
Capital structure Our results Incentives to lever up smaller than often assumed
For firms with internal cash, trade-off between debt and retained earnings, not debt and new equity
Dividends: (1 – τc)(1 – ατcg) – (1 – τi) Repurch: (1 – τc)(1 – βτcg) – (1 – τi)
Profitable firms (w/ internal cash) should have lower leverage Internal equity may have tax benefits even if firms never want to issue new equity
Neither depends on τdv

29
Capital structure Our results No target debt ratio
Debt ratio should be a function of internal cashflows
Leverage up when the firm has a cash deficit, down when it has a cash surplus
Pecking order?

30
Payout policy Dividend puzzle Form: why do firms use dividends not repurchases?
Timing: why do firms pay dividends vs. retain the cash?
τdv vs. τcg
Observation 1 Retaining good if (1 – τc)(1 – ατcg) – (1 – τi), which doesn’t depend on dividend taxes
Observation 2
Inconsistent with view that profitable firms have too little leverage
31
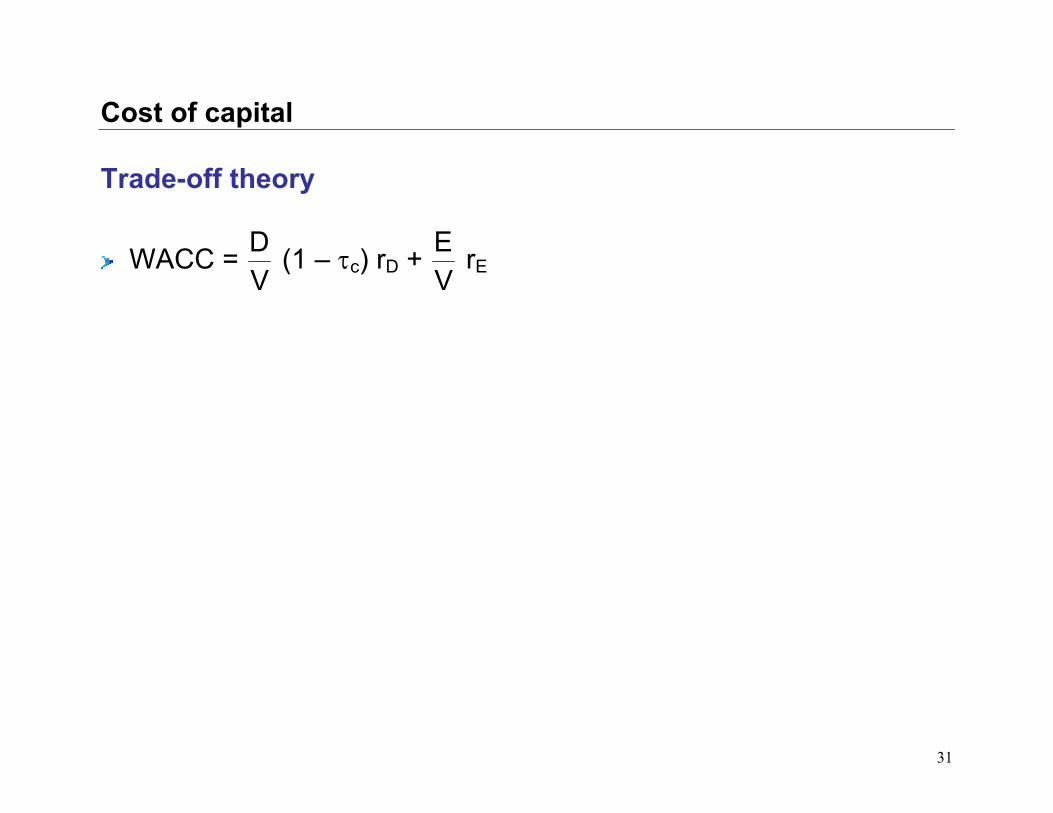
Cost of capital Trade-off theory
WACC = VD (1 – τc) rD +
VE rE

32
Cost of capital Our results Cost of capital also depends on the firm’s mix of internal and external equity
Dividends Repurchases External equity r (1 – τi) / (1 – τdv) r (1 – τi) / (1 – τcg) Internal equity r (1 – τi) / (1 – ατcg) r (1 – τi) / (1 – βτcg)
Cost of internal equity doesn’t depend on τdv
Investment-to-cashflow sensitivity
Cost of capital ≠ expected stock return
33
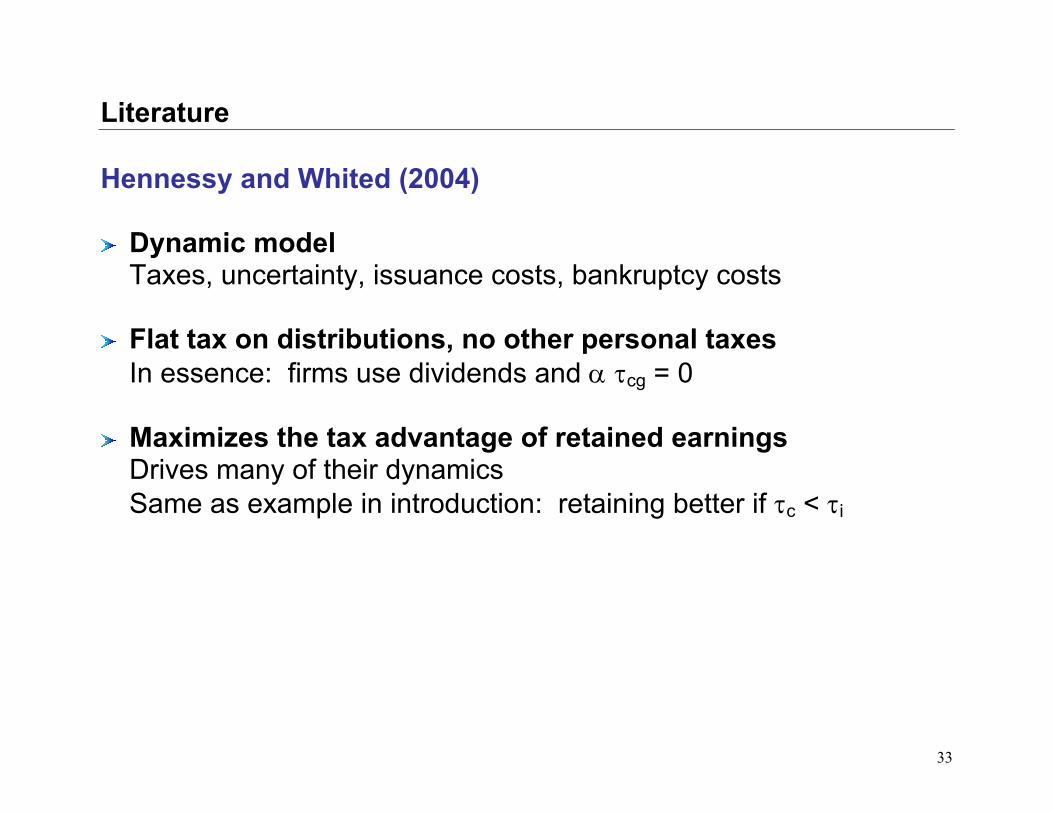
Literature Hennessy and Whited (2004) Dynamic model
Taxes, uncertainty, issuance costs, bankruptcy costs Flat tax on distributions, no other personal taxes
In essence: firms use dividends and α τcg = 0 Maximizes the tax advantage of retained earnings
Drives many of their dynamics Same as example in introduction: retaining better if τc < τi

34
Literature Trapped equity Auerbach (1979), Poterba and Summers (1985)
Dividend policy is irrelevant even with taxes
Equity value = )DA(11
ttcg
dv −τ−τ−
If pay $1 today, shareholders get 1 – τdv
If retain, value goes up by cg
dv
11
τ−τ− ; after capital gains taxes = 1 – τdv
Implication: τdv doesn’t affect cost of capital or investment
35
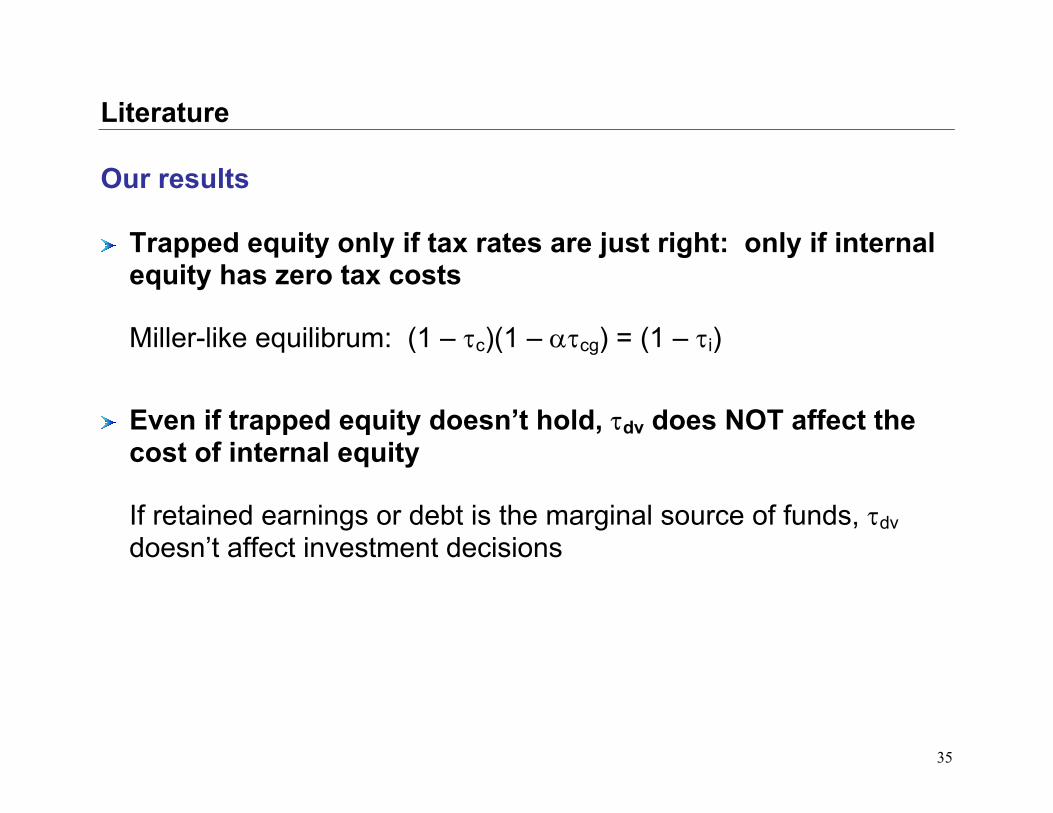
Literature Our results Trapped equity only if tax rates are just right: only if internal equity has zero tax costs
Miller-like equilibrum: (1 – τc)(1 – ατcg) = (1 – τi)
Even if trapped equity doesn’t hold, τdv does NOT affect the cost of internal equity
If retained earnings or debt is the marginal source of funds, τdv doesn’t affect investment decisions
36
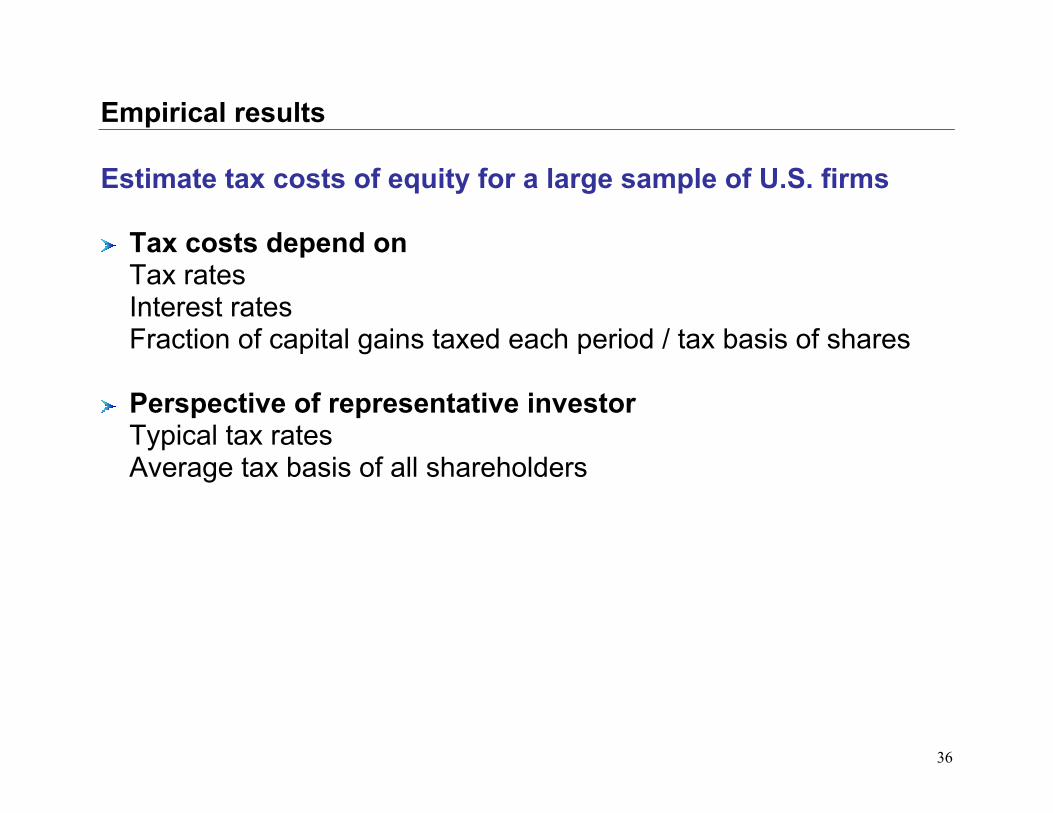
Empirical results Estimate tax costs of equity for a large sample of U.S. firms Tax costs depend on Tax rates Interest rates Fraction of capital gains taxed each period / tax basis of shares
Perspective of representative investor
Typical tax rates Average tax basis of all shareholders
37
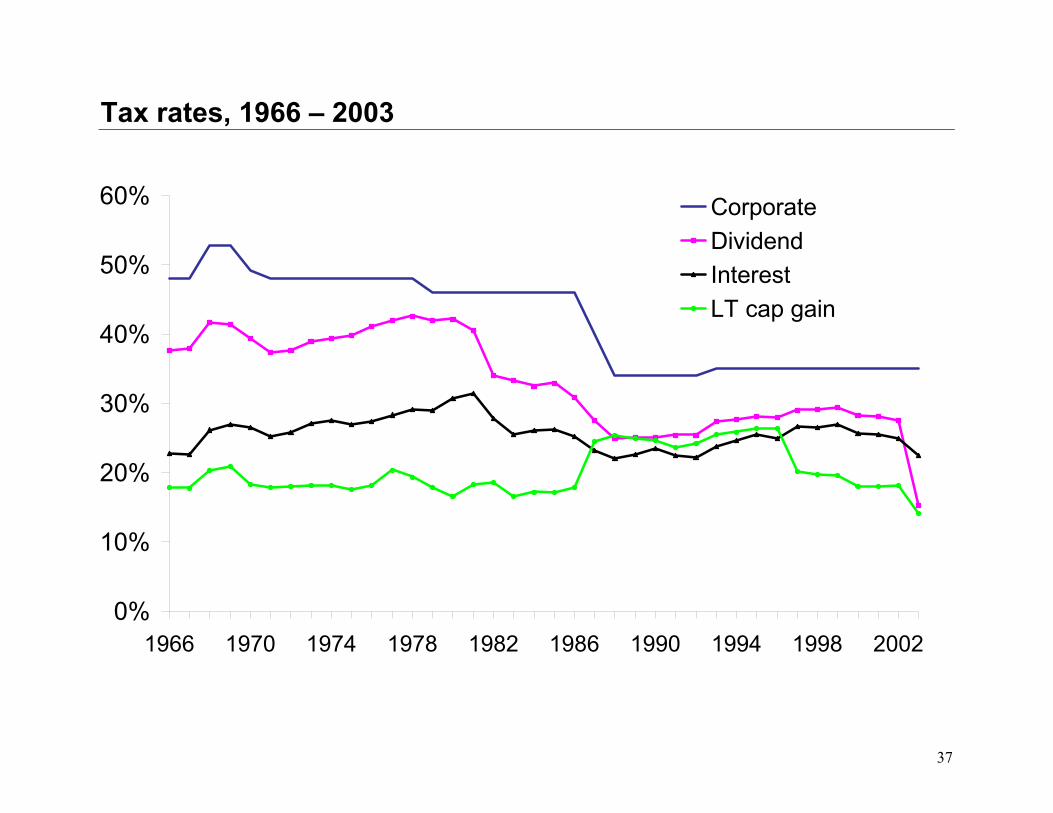
Tax rates, 1966 – 2003
0%
10%
20%
30%
40%
50%
60%
1966 1970 1974 1978 1982 1986 1990 1994 1998 2002
CorporateDividendInterestLT cap gain

38
Tax basis of shares Tax basis = average purchase price Estimate using prices and trading volume
Proportional trading All investors holding a stock are equally likely to sell
Different propensities to trade
Recent purchasers are more likely to sell than long-time investors

39
Trading probabilities Ivkovic, Poterba, and Weisbenner (2004)
0%
10%
20%
30%
40%
50%
60%
70%
1 4 7 10 13 16 19 22 25 28 31 34Month after buying
Cumulative prob. of sale
Hazard rate (prob of a sale conditionalon holding to month t)

40
Tax basis of shares Proportional trading Tax basis evolves as TBt = vt Pt + (1 – vt) TBt-1
Recursively substituting:
TBt = ∑ −
−i it
itt Pw
∏−
= −−− −= 1i
0j jtitit
t )v1(vw
Examples
TB1 = v1 P1 + (1 – v1) TB0 TB2 = v2 P2 + (1 – v2) v1 P1 + (1 – v2)(1 – v1) TB0 :

41
Tax basis of shares IPW hazard rates Hazard rates, hi, imply that trading volume evolves as v1′ = h1 v2′ = h1 v1′ + h2 (1 – v1′) v3′ = h1 v2′ + h2 (1 – h1) v1′ + h3 (1 – h2) (1 – v1′),
Infer the fraction of shares held today that were bought last month, the month before, and so on
Treat abnormal trading volume in three ways
Ignore completely
Scale hazard rates up and down Scale hazard rates down, truncate volume at predicted level

42
Data 1966 – 2003 7,066 NYSE and Amex stocks on CRSP Daily (proportional) and monthly (IPW hazard rates) data α is annual trading volume Truncate estimates of α and β at one
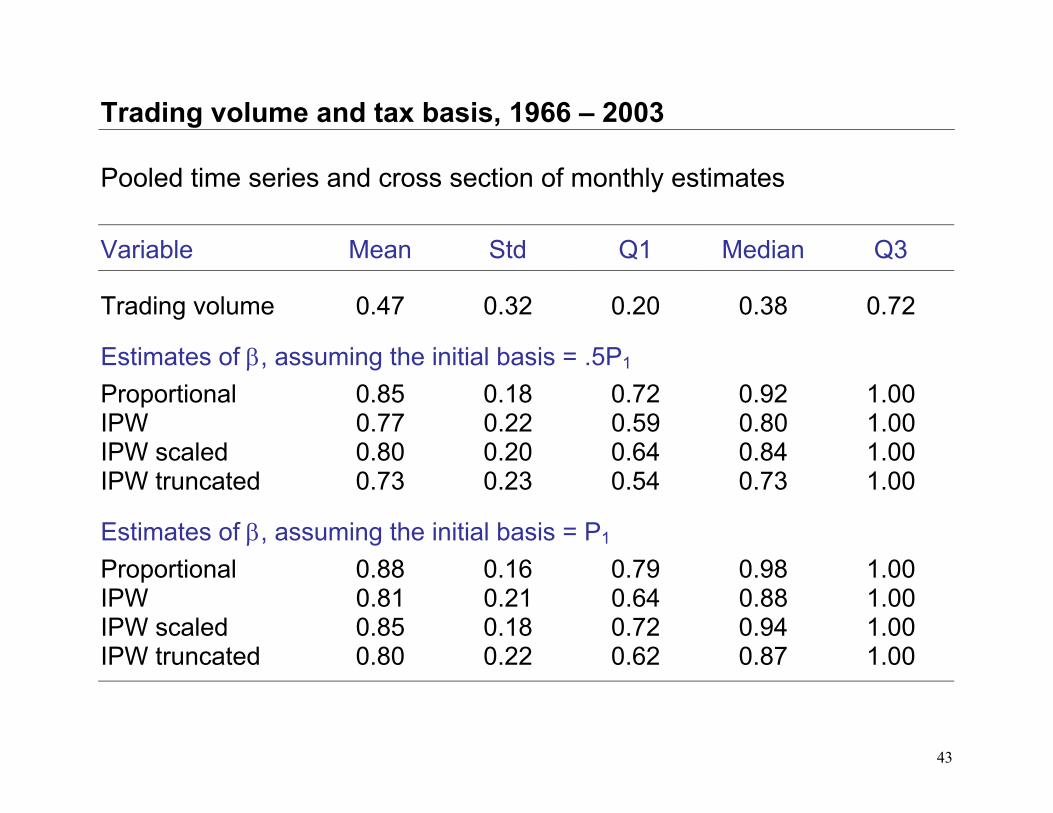
43
Trading volume and tax basis, 1966 – 2003 Pooled time series and cross section of monthly estimates Variable Mean Std Q1 Median Q3
Trading volume 0.47 0.32 0.20 0.38 0.72
Estimates of β, assuming the initial basis = .5P1 Proportional 0.85 0.18 0.72 0.92 1.00 IPW 0.77 0.22 0.59 0.80 1.00 IPW scaled 0.80 0.20 0.64 0.84 1.00 IPW truncated 0.73 0.23 0.54 0.73 1.00
Estimates of β, assuming the initial basis = P1 Proportional 0.88 0.16 0.79 0.98 1.00 IPW 0.81 0.21 0.64 0.88 1.00 IPW scaled 0.85 0.18 0.72 0.94 1.00 IPW truncated 0.80 0.22 0.62 0.87 1.00

44
Tax basis, 1966 – 2003
0.45
0.55
0.65
0.75
0.85
0.95
1.05
1966 1970 1974 1978 1982 1986 1990 1994 1998 2002
PROP IPW truncated

45
Trading volume, 1966 – 2003
0.00
0.20
0.40
0.60
0.80
1966 1970 1974 1978 1982 1986 1990 1994 1998 2002

46
Tax costs of equity If firms use dividends
External: )1(r1
riτ−+
[(1 – τc)(1 –τdv) – (1 – τi)]
Internal: cgi
dv
)1(r1)1(rατ−τ−+
τ− [(1 – τc)(1 – ατcg) – (1 – τi)]
If firms use repurchases
External: )1(r1
riτ−+
[(1 – τc)(1 –τcg) – (1 – τi)]
Internal: cgi
cg
)1(r1)1(rβτ−τ−+
τ−[(1 – τc)(1 – βτcg) – (1 – τi)]

47
Tax costs of equity, 1966 – 2003 Pooled time series and cross section τc = top τc = .66 top τc = .33 top τc = 0
β est. Mean Std Mean Std Mean Std Mean Std
Tax costs if firms use dividends (%) External -- -2.31 1.07 -1.70 0.82 -1.11 0.59 -0.52 0.39Internal -- -1.02 0.45 -0.42 0.30 0.17 0.32 0.76 0.49 Tax costs if firms use repurchases (%) External -- -1.80 0.72 -1.05 0.39 -0.31 0.23 0.42 0.45Internal Prop -1.62 0.68 -0.87 0.38 -0.15 0.29 0.58 0.52 IPW -1.54 0.68 -0.80 0.39 -0.07 0.31 0.66 0.53 IPW-scale -1.57 0.67 -0.82 0.38 -0.10 0.30 0.63 0.53 IPW-trunc -1.51 0.67 -0.76 0.38 -0.03 0.32 0.69 0.54

48
Tax costs of equity, 1966 – 2003
-3.0%
-2.5%
-2.0%
-1.5%
-1.0%
-0.5%
0.0%
1966 1970 1974 1978 1982 1986 1990 1994 1998 2002
External equity
Internal equity

49
Summary Debt vs. internal equity vs. external equity
Tax advantage of internal equity depends on capital gains taxation
Implications for capital structure, payout policy, and cost of capital


