Technology Venture Capital Financing in Canada
H1 2016
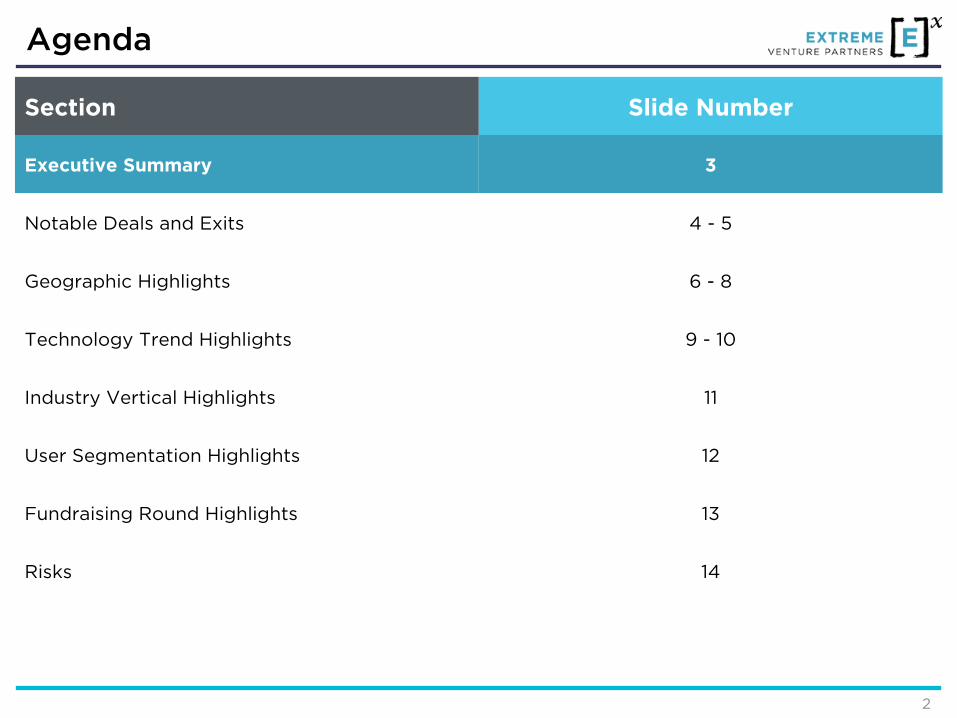
Agenda
Section Slide Number
Executive Summary 3
Notable Deals and Exits 4 - 5
Geographic Highlights 6 - 8
Technology Trend Highlights 9 - 10
Industry Vertical Highlights 11
User Segmentation Highlights 12
Fundraising Round Highlights 13
Risks 14
2
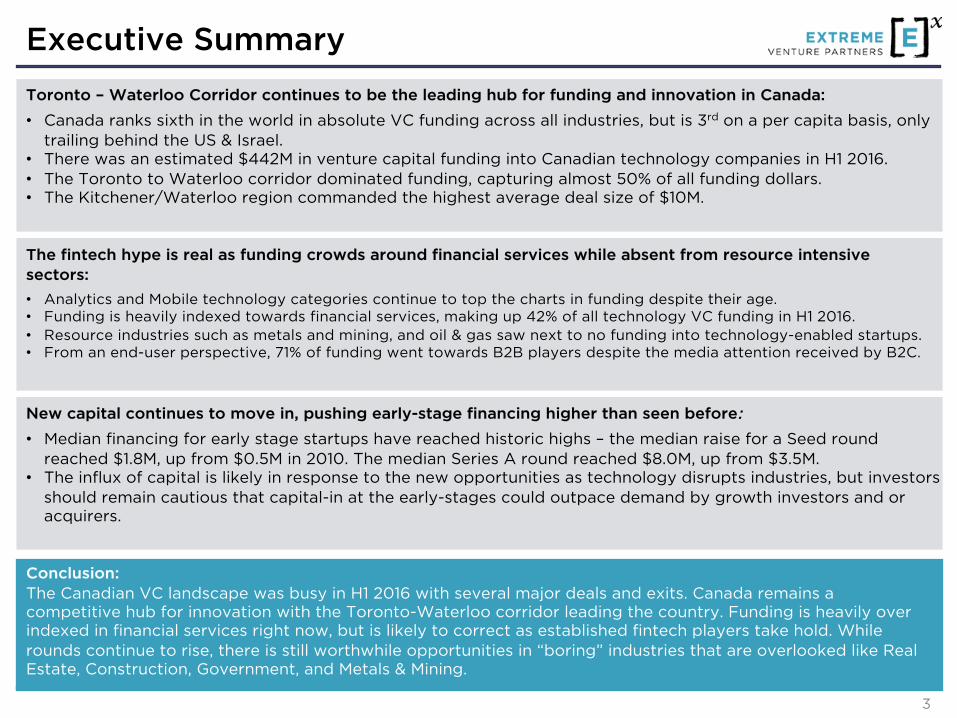
Executive Summary
Conclusion:The Canadian VC landscape was busy in H1 2016 with several major deals and exits. Canada remains a competitive hub for innovation with the Toronto-Waterloo corridor leading the country. Funding is heavily over indexed in financial services right now, but is likely to correct as established fintech players take hold. While rounds continue to rise, there is still worthwhile opportunities in “boring” industries that are overlooked like Real Estate, Construction, Government, and Metals & Mining.
Toronto – Waterloo Corridor continues to be the leading hub for funding and innovation in Canada:
• Canada ranks sixth in the world in absolute VC funding across all industries, but is 3rd on a per capita basis, only trailing behind the US & Israel.
• There was an estimated $442M in venture capital funding into Canadian technology companies in H1 2016.• The Toronto to Waterloo corridor dominated funding, capturing almost 50% of all funding dollars.• The Kitchener/Waterloo region commanded the highest average deal size of $10M.
The fintech hype is real as funding crowds around financial services while absent from resource intensive sectors:
• Analytics and Mobile technology categories continue to top the charts in funding despite their age.• Funding is heavily indexed towards financial services, making up 42% of all technology VC funding in H1 2016.• Resource industries such as metals and mining, and oil & gas saw next to no funding into technology-enabled startups.• From an end-user perspective, 71% of funding went towards B2B players despite the media attention received by B2C.
New capital continues to move in, pushing early-stage financing higher than seen before:
• Median financing for early stage startups have reached historic highs – the median raise for a Seed round reached $1.8M, up from $0.5M in 2010. The median Series A round reached $8.0M, up from $3.5M.
• The influx of capital is likely in response to the new opportunities as technology disrupts industries, but investors should remain cautious that capital-in at the early-stages could outpace demand by growth investors and or acquirers.
3
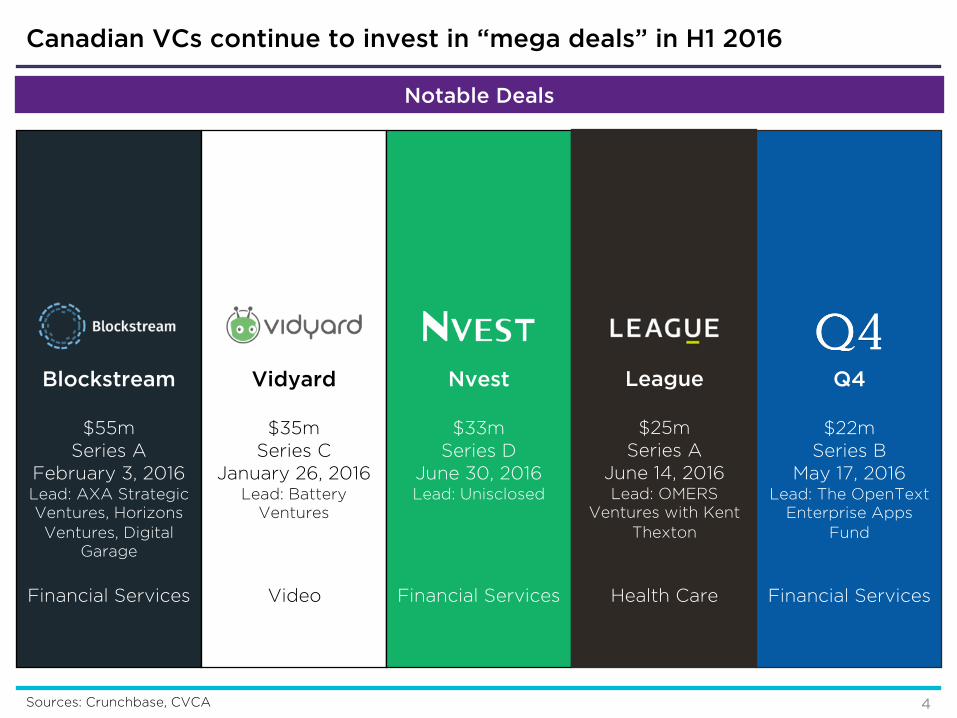
Sources: Crunchbase, CVCA
Notable Deals
Blockstream
$55mSeries A
February 3, 2016Lead: AXA Strategic Ventures, Horizons Ventures, Digital
Garage
Vidyard
$35mSeries C
January 26, 2016Lead: Battery
Ventures
Nvest
$33mSeries D
June 30, 2016Lead: Unisclosed
Canadian VCs continue to invest in “mega deals” in H1 2016
Financial Services Video Financial Services
League
$25mSeries A
June 14, 2016Lead: OMERS
Ventures with Kent Thexton
Health Care
4
Q4
$22mSeries B
May 17, 2016Lead: The OpenText
Enterprise Apps Fund
Financial Services
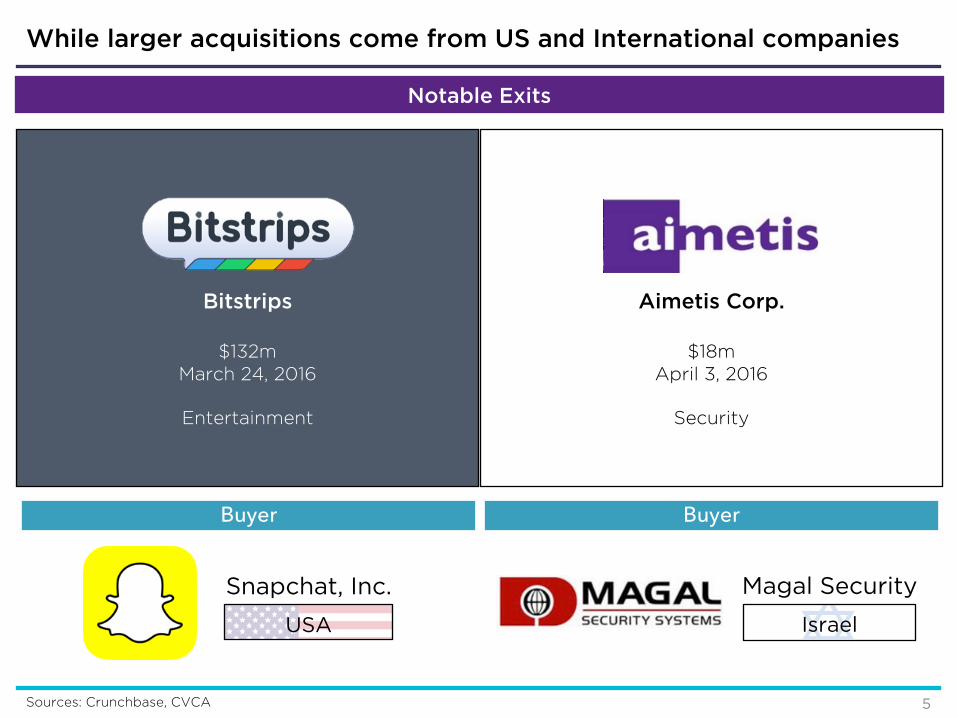
Notable Exits
Bitstrips
$132mMarch 24, 2016
Entertainment
Buyer
Aimetis Corp.
$18mApril 3, 2016
Security
Buyer
Sources: Crunchbase, CVCA
While larger acquisitions come from US and International companies
Snapchat, Inc.
USA
Magal Security
Israel
5
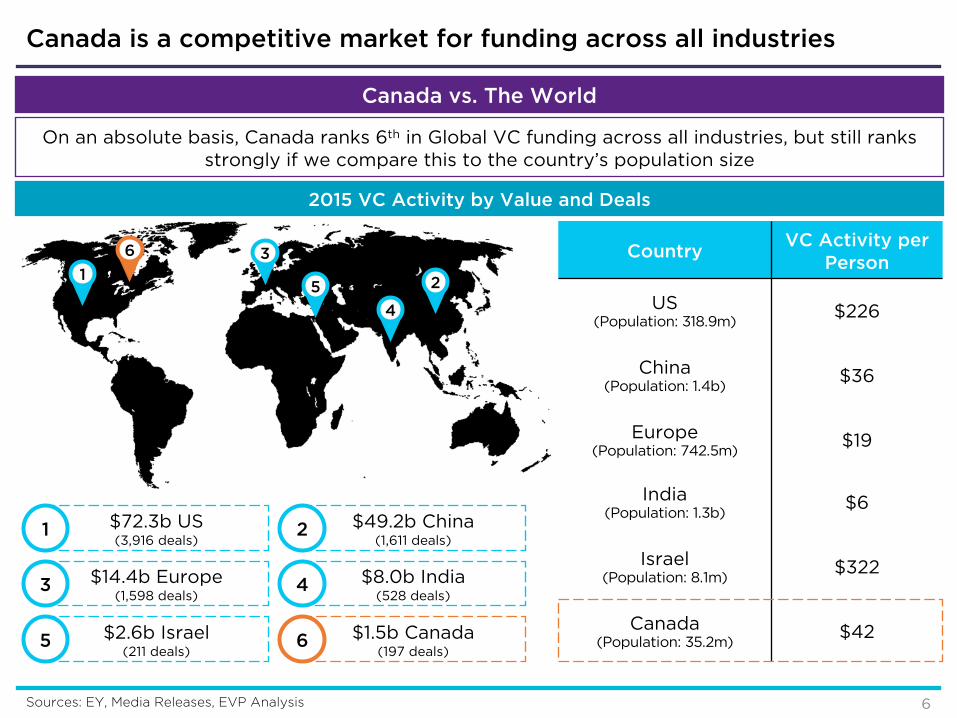
On an absolute basis, Canada ranks 6th in Global VC funding across all industries, but still ranks strongly if we compare this to the country’s population size
2015 VC Activity by Value and Deals
1 2
3
4
5
6
$72.3b US(3,916 deals)
1 $49.2b China(1,611 deals)
2
$14.4b Europe(1,598 deals)
3 $8.0b India(528 deals)
4
$2.6b Israel(211 deals)
5 $1.5b Canada(197 deals)
6
CountryVC Activity per
Person
US(Population: 318.9m)
$226
China(Population: 1.4b)
$36
Europe(Population: 742.5m)
$19
India(Population: 1.3b)
$6
Israel(Population: 8.1m)
$322
Canada(Population: 35.2m)
$42
Sources: EY, Media Releases, EVP Analysis
Canada vs. The World
Canada is a competitive market for funding across all industries
6
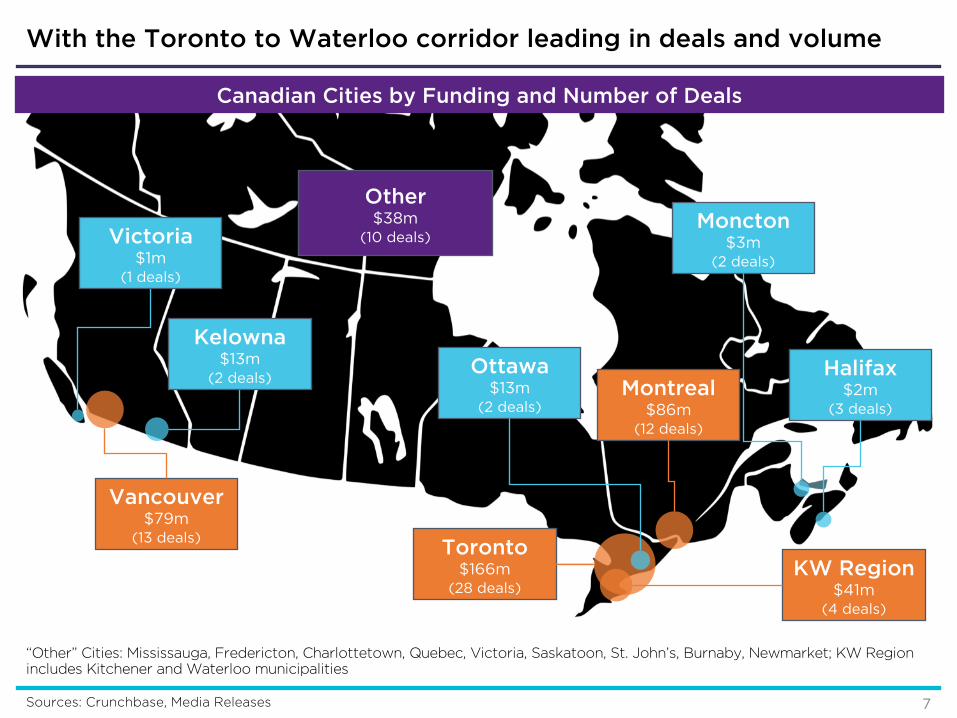
“Other” Cities: Mississauga, Fredericton, Charlottetown, Quebec, Victoria, Saskatoon, St. John’s, Burnaby, Newmarket; KW Region includes Kitchener and Waterloo municipalities
Sources: Crunchbase, Media Releases
Canadian Cities by Funding and Number of Deals
Toronto$166m
(28 deals)
Montreal$86m
(12 deals)
Vancouver$79m
(13 deals)
KW Region$41m
(4 deals)
Ottawa$13m
(2 deals)
Moncton$3m
(2 deals)
Kelowna$13m
(2 deals) Halifax$2m
(3 deals)
Victoria$1m
(1 deals)
Other$38m
(10 deals)
With the Toronto to Waterloo corridor leading in deals and volume
7
Sources: Crunchbase, Media Releases, EVP Analysis
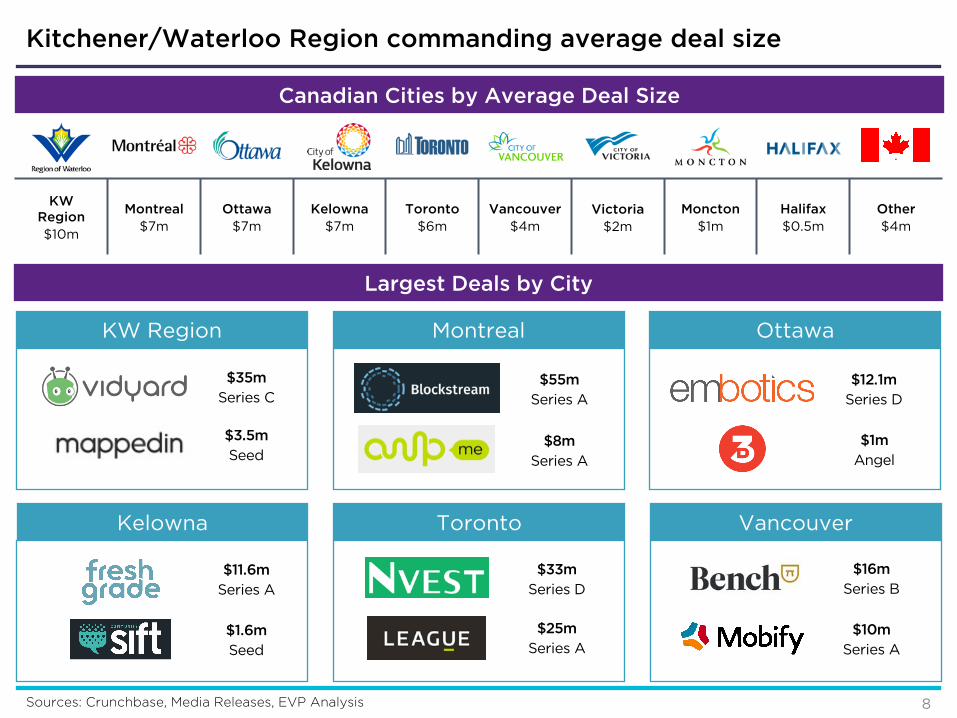
Canadian Cities by Average Deal Size
KW Region$10m
Montreal$7m
Ottawa$7m
Kelowna$7m
Toronto$6m
Vancouver$4m
Victoria$2m
Moncton$1m
Halifax$0.5m
Other$4m
KW Region
$35mSeries C
$3.5mSeed
Montreal
$55mSeries A
$8mSeries A
Ottawa
$12.1mSeries D
$1mAngel
Kelowna
$11.6mSeries A
$1.6mSeed
Toronto
$33mSeries D
$25mSeries A
Vancouver
$16mSeries B
Largest Deals by City
Kitchener/Waterloo Region commanding average deal size
8
$10mSeries A
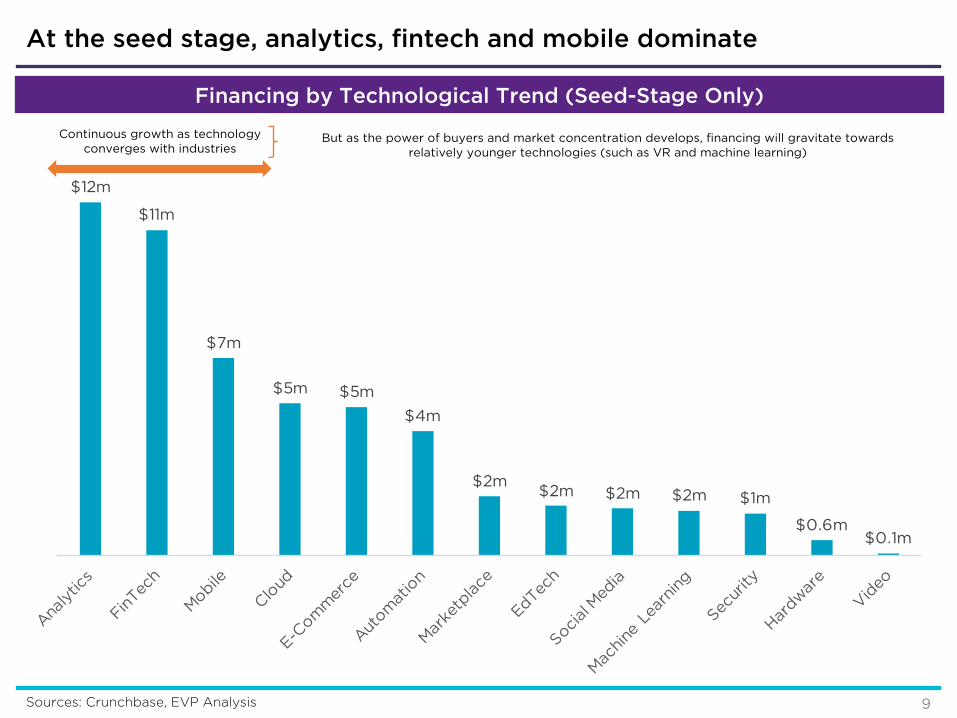
$12m
$11m
$7m
$5m $5m
$4m
$2m$2m $2m $2m $1m
$0.6m$0.1m
Sources: Crunchbase, EVP Analysis
Financing by Technological Trend (Seed-Stage Only)
Continuous growth as technology converges with industries
But as the power of buyers and market concentration develops, financing will gravitate towards relatively younger technologies (such as VR and machine learning)
At the seed stage, analytics, fintech and mobile dominate
9
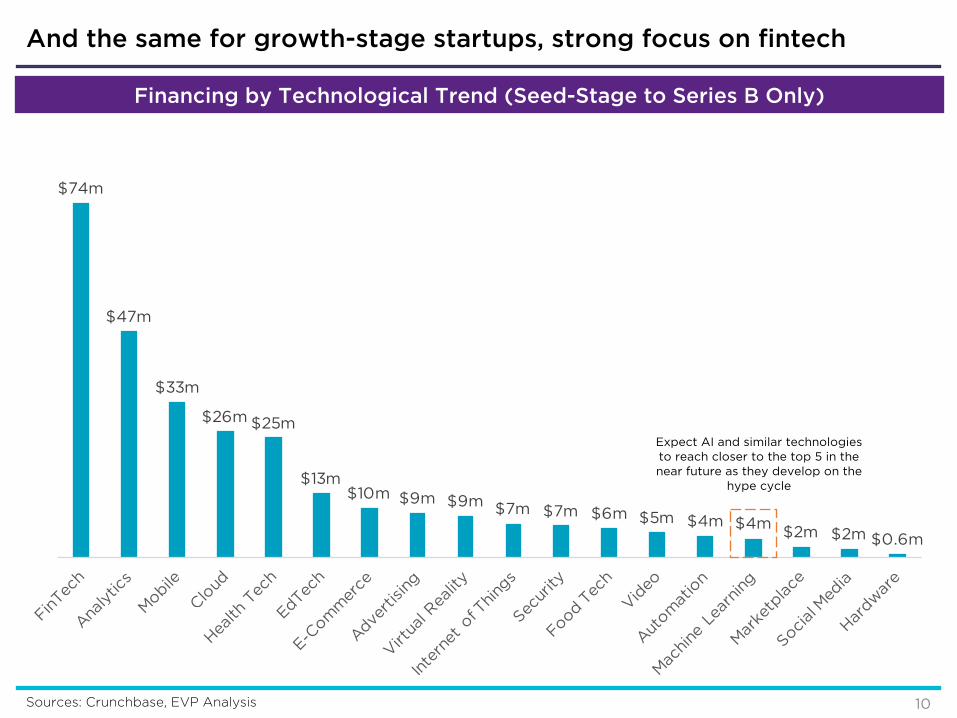
$74m
$47m
$33m
$26m $25m
$13m$10m $9m $9m $7m $7m $6m $5m $4m $4m
$2m $2m $0.6m
Sources: Crunchbase, EVP Analysis
Financing by Technological Trend (Seed-Stage to Series B Only)
Expect AI and similar technologies to reach closer to the top 5 in the near future as they develop on the
hype cycle
And the same for growth-stage startups, strong focus on fintech
10
4% 3%4%
42%
8%
2%0%
26%
3%
7%
0% 0% 0% 0% 0%2%
1%
5%7% 7%
2%
10%
19%
5% 5%
8%
2%
7%
13%
7%
Agriculture Arts, Entertainment, & Recreation
Education Financial Services
Health Care Hospitality & Food
Manufacturing Others Retail Technology Metals, Mining, Oil & Gas
Utilities Construction Real Estate Government
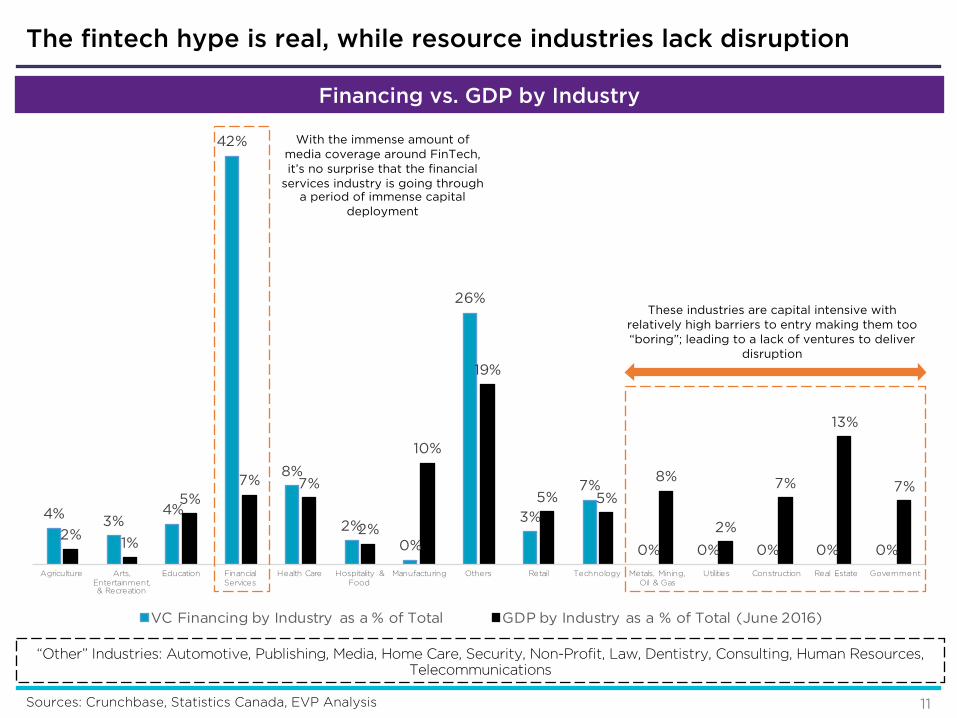
VC Financing by Industry as a % of Total GDP by Industry as a % of Total (June 2016)
Sources: Crunchbase, Statistics Canada, EVP Analysis
“Other” Industries: Automotive, Publishing, Media, Home Care, Security, Non-Profit, Law, Dentistry, Consulting, Human Resources,Telecommunications
Financing vs. GDP by Industry
These industries are capital intensive with relatively high barriers to entry making them too “boring”; leading to a lack of ventures to deliver
disruption
With the immense amount of media coverage around FinTech, it’s no surprise that the financial
services industry is going through a period of immense capital
deployment
The fintech hype is real, while resource industries lack disruption
11
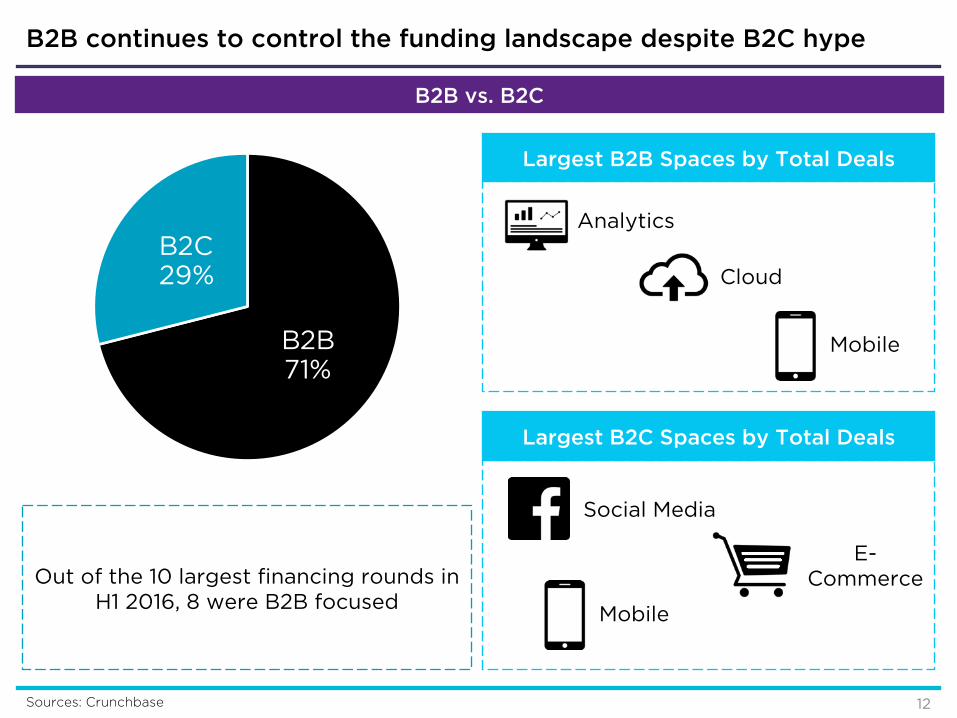
Out of the 10 largest financing rounds in H1 2016, 8 were B2B focused
Largest B2C Spaces by Total Deals
Largest B2B Spaces by Total Deals
Analytics
Cloud
Mobile
Mobile
Social Media
E-Commerce
Sources: Crunchbase
B2B vs. B2C
B2B continues to control the funding landscape despite B2C hype
12
B2B71%
B2C29%
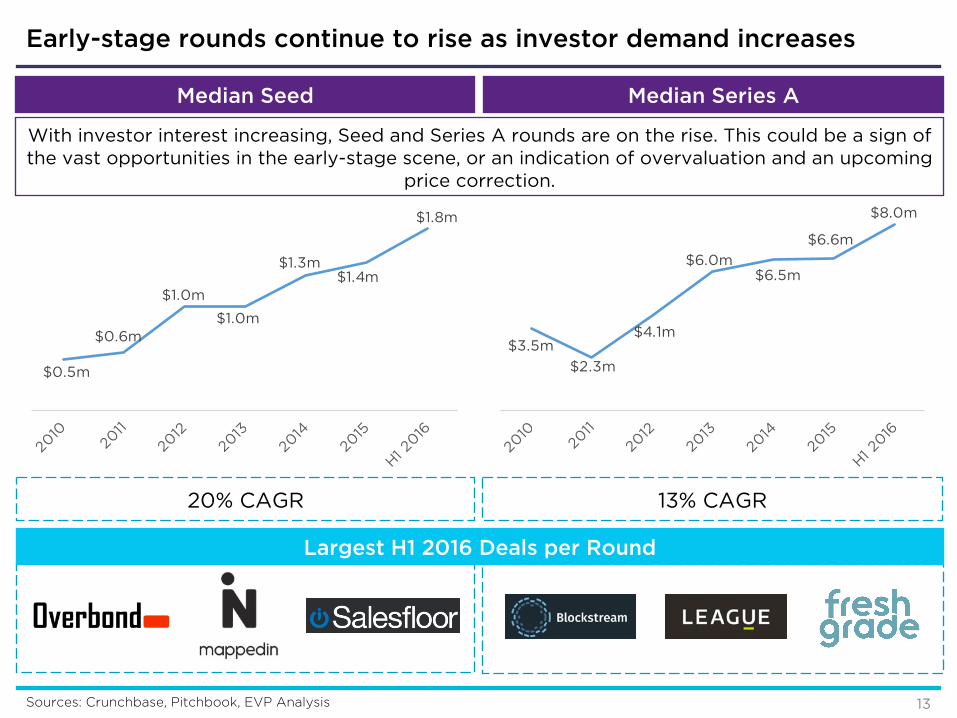
$0.5m
$0.6m
$1.0m
$1.0m
$1.3m$1.4m
$1.8m
$3.5m
$2.3m
$4.1m
$6.0m$6.5m
$6.6m
$8.0m
With investor interest increasing, Seed and Series A rounds are on the rise. This could be a sign of the vast opportunities in the early-stage scene, or an indication of overvaluation and an upcoming
price correction.
Largest H1 2016 Deals per Round
Sources: Crunchbase, Pitchbook, EVP Analysis
Median Seed
20% CAGR 13% CAGR
Median Series A
Early-stage rounds continue to rise as investor demand increases
13
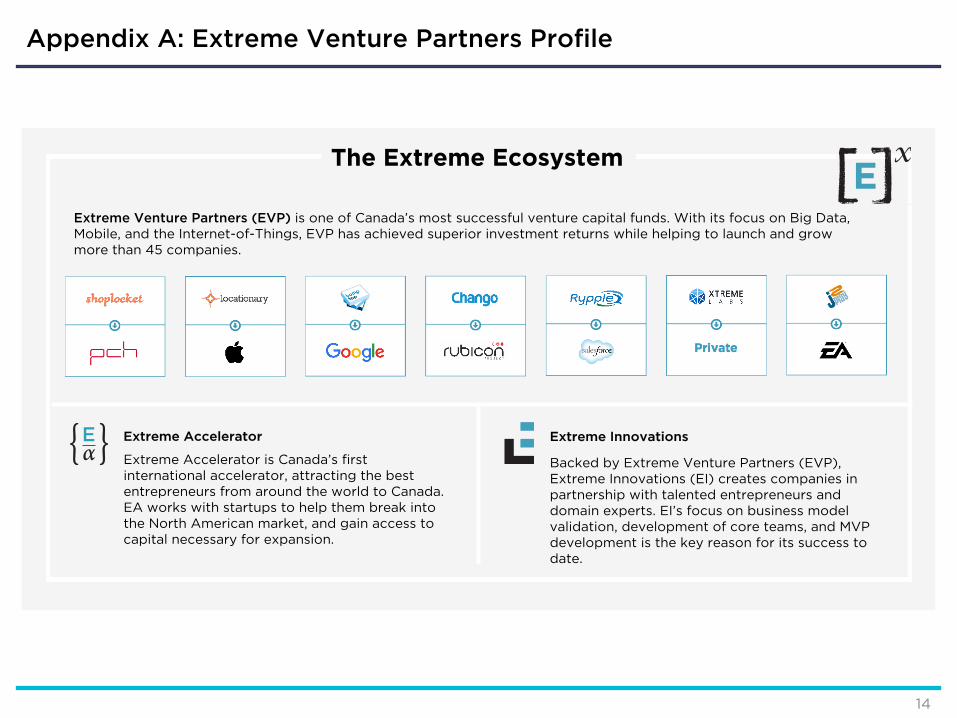
The Extreme Ecosystem
Extreme Venture Partners (EVP) is one of Canada’s most successful venture capital funds. With its focus on Big Data, Mobile, and the Internet-of-Things, EVP has achieved superior investment returns while helping to launch and grow more than 45 companies.
Extreme Accelerator
Extreme Accelerator is Canada’s first international accelerator, attracting the best entrepreneurs from around the world to Canada. EA works with startups to help them break into the North American market, and gain access to capital necessary for expansion.
Extreme Innovations
Backed by Extreme Venture Partners (EVP), Extreme Innovations (EI) creates companies in partnership with talented entrepreneurs and domain experts. EI’s focus on business model validation, development of core teams, and MVP development is the key reason for its success to date.
Appendix A: Extreme Venture Partners Profile
14
• Information was collected from public sources such as Crunchbase, BetaKit, and other media sources. That being said, not all information from every venture capital deal was collected (as a result of disclosure agreements) - making this a not perfect picture of the Canadian venture capital landscape.
• H2 2015 considers funding rounds from January 1st, 2016 to June 30th 2016
• A technology category was assigned to each company based on where most value was extracted. For instance, a company may operate as an analytics firm that uses cloud based software. If the major value proposition for said company is analytics, then analytics is the assigned technology category. This methodology was also applied when considering what vertical each company belongs to.
• The calculation for determining median funding by rounds (slide 13) was determined by taking a sample set of the most active venture capital funds in Canada. Only the disclosed deals from these funds were used to calculate the median funding per round.
Appendix B: Disclosures
15


