Download - The 2001 National Household Travel Survey: A look into the travel patterns of older Americans
www.nsc.orgwww.elsevier.com/locate/jsr
Journal of Safety Research 34 (2003) 461–470
Special Report: New Statistical Data Source
The 2001 national household travel survey: A look into the travel
patterns of older Americans
Demetra V. Collia*, Joy Sharp, Lee Giesbrecht
Bureau of Transportation Statistics, U.S. Department of Transportation, 400 Seventh Street, S.W., Washington, D.C. 20590, USA
Abstract
Introduction: The main objective of this paper is to highlight travel patterns of older adults living in the United States as depicted in the
2001 National Household Travel Survey (NHTS). The NHTS is a national data collection program sponsored by the Bureau of
Transportation Statistics and the Federal Highway Administration. It is the first national comprehensive household survey of both daily and
long-distance travel, allowing for analysis of the full continuum of personal travel by Americans. To better understand the transportation
needs of older Americans, it is useful to examine how travel patterns differ across age groups. The intent is to present basic travel
characteristics of older adults (age 65+) and allow for comparisons with younger adults (ages 19–64). Travel-related characteristics of older
adults in the United States: Results of the 2001 survey showed that older Americans travel extensively and rely on personal vehicles as
heavily as their younger counterparts. Older Americans conduct 89% of their travel in personal vehicles. Characteristics of daily trips taken
by older adults: Older adults tend to be less mobile in that they take fewer trips, travel shorter distances, and have shorter travel times. This
pattern is even more pronounced among older women. They are also more likely to suffer from self-reported medical conditions that further
limit their travel. Characteristics of long-distance travel by older adults: Older men and women take long-distance trips at about the same
rates and show a strong preference for using personal vehicles. And, while men and women take an equal percentage of their trips by air,
older women show a strong preference for bus travel. Conclusions: Although older Americans travel extensively, they are less mobile than
their younger counterparts. This pattern is more pronounced among older women and among those with self-reported medical conditions that
affect their ability to travel outside their home. Older women consistently take the least number of trips per day, have the lowest driving rates,
travel the shortest distances, and are more likely to report medical conditions that limit their travel. For men and women who have to give up
driving, alternative means of transportation becomes a necessity. Yet, use of alternative transportation is relatively low; excluding personal
vehicle and walking, all other means of transportation account for about 2% of daily travel. Further, of those with medical conditions that
affect their travel, only about 12% use special transportation services such as dial-a-ride.
D 2003 National Safety Council and Elsevier Science Ltd. All rights reserved.
Keywords: Daily travel; Long-distance travel; elderly; older drivers; aging
1. Introduction 30 years, the number of older drivers on the road is expected
Almost every person in the United States is affected in
some way by the quality of the nation’s transportation
system. An accessible, affordable, and reliable transporta-
tion system increases the mobility of Americans, thereby
providing opportunities for work, education, shopping and
personal errands, social interaction, medical access, rest and
relaxation, and all other transportation needs. Transportation
planners and policy makers are sure to face special chal-
lenges in the next few decades as the older population
continues to increase at a rapid rate of growth. In the next
0022-4375/$ - see front matter D 2003 National Safety Council and Elsevier Sci
doi:10.1016/j.jsr.2003.10.001
* Corresponding author. Tel.: +1-202-366-1610; fax: +1-202-493-
0568.
E-mail address: [email protected] (D.V. Collia).
to at least double (Administration on Aging, 1998). This
increase is attributable to both the overall increase in the
older population, as well as the anticipated trend for older
women to drive in greater proportions than their previous
cohorts.
In order to understand and improve the mobility of our
nation’s older population, policymakers and transportation
planners require data that answer questions about current
travel behavior, that is, who is traveling and how, why,
when, where, and how far. The process of improving our
transportation system also requires a deeper understanding
of the unique travel behavior and challenges affecting the
mobility of the older population.
One of the primary sources of data on current travel
behavior and patterns of the U.S. population is the 2001
ence Ltd. All rights reserved.
1 Proxy interviews were conducted for 23.4% of the respondents 16
and older.
Table 1
2001 National Household Travel Survey: Annualized daily and long
distance tripsa,b,c
Age Daily travel Long-distance travel
groupsNumber
tripsdSE Percent
trips
SE Number
tripsdSE Percent
trips
SE
0–18 98,916 917 24.1 0.16 522 13 20.0 0.42
19–64 270,300 1158 65.7 0.16 1875 31 71.6 0.47
65 + 41,997 539 10.2 0.12 220 7 8.4 0.25
Total 411,213 1888 100.0 – 2617 38 100.0 –
a Represents the number and percent of trips taken by each age group in
the U.S. population.b SE denotes standard error.c Source: The 2001 National Household Travel Survey, Daily Trip File
and Person File, U.S. Department of Transportation.d Numbers rounded to the nearest million.
2 All household members were interviewed in approximately 85% of
the sample households.
D.V. Collia et al. / Journal of Safety Research 34 (2003) 461–470462
National Household Travel Survey (NHTS), sponsored
jointly by the Bureau of Labor Statistics and the Federal
Highway Administration in the Department of Transporta-
tion. In this paper, we highlight the travel characteristics of
the older population, using results from the NHTS. In most
instances, comparisons are made to younger adults aged 19
to 64 years old to illustrate how the travel behavior of older
Americans compares to the travel behavior of younger
adults.
1.1. Background on the National Household Travel Survey
(NHTS)
For several decades, the Department of Transportation
gathered information on travel characteristics through the
Nationwide Personal Transportation Survey (NPTS) and the
American Travel Survey (ATS). The NPTS was conducted
in 1969, 1977, 1983, 1990, and 1995 and the ATS was
conducted in 1977 and 1995. The NPTS, sponsored by the
Federal Highway Administration, primarily focused on
daily travel, with an abbreviated long-distance component.
The 1995 ATS, sponsored by the Bureau of Transportation
Statistics, provided a detailed look at long-distance travel
defined as trips of 100 miles or more from home. In 2001,
these two prior data collection series were joined and the
2001 NHTS was created to provide the full continuum of
American travel, daily and long-distance. This national
survey provides data about current traveler and trip-making
characteristics and includes information on the following:
� travel-related household characteristics, such as the
number of drivers and types of vehicles in U.S.
households;� demographic characteristics of U.S. travelers (e.g., age,
gender, income);� characteristics of daily trip-making, including mode of
transportation used, travel times, purpose of trip, etc.; and� characteristics of long-distance travel (i.e., trips of 50
miles or more away from home), including mode of
transportation used, purpose of trip, trip duration in days,
etc.
For each individual, data were collected on daily and
long-distance trips taken during pre-assigned time frames.
For daily trips, data were collected on the number of trips
taken during a randomly assigned day (labeled the ‘‘travel
day’’), and associated trip times, means of transportation,
which household vehicle was used, if any, trip purpose, and
presence of household and non-household members on
these trips. For long-distance trips of 50 miles or more
away from home to the farthest destination, information was
collected on the number of trips made during a specified
four-week period (labeled the ‘‘travel period), along with the
dates of these trips, purpose and destination, type of lodging
used at the destination, primary means of transportation,
overnight stops, etc. This resulted in a sample of approxi-
mately a quarter of a million daily trips and approximately
45,000 long-distance trips.
1.2. Survey methodology, source and accuracy
The 2001 NHTS is a household survey of nationally
representative households in the United States and was
conducted from March 2001 to May 2002. Data were
collected through telephone interviews with approximately
60,000 individuals (approximately 9,000 of the respondents
were at least 65 years old) from about 26,000 households.
Attempts were made to include the travel of all household
members either directly from the respondent or through a
proxy.1 A household where 50% of the adults completed the
survey was considered a responding household and included
in the data file.2 Individuals from households were asked to
complete a travel diary documenting their daily trips in
order to aid in the recall process when responding to the
interviewer. The overall response rate was 41%. (The
household screener interview rate was 58%, and the useable
household rate was 71%.)
To produce national estimates from the 2001 NHTS
data, the sample data were weighted. Weighting the data
adjusts for selection probabilities at the household level and
adjusts for household and individual nonresponse. Trip
weights also include a factor for annualizing both the daily
and long-distance trips. All estimates in this report are
weighted. In addition to properly weighting the responses,
special procedures for estimating the statistical significance
of the estimates were employed because the data were
collected using a complex sample design. Comparisons
made in the text were tested for statistical significance to
ensure that the differences are larger than might be expected
due to sampling variation. Testing for statistical significance
was done using a two-sided test. All differences described
Table 2
Distribution of daily trips by mode of transportationa,b
Mode Age: 19–64 Age: 65 +
Percent SE Percent SE
Personal vehicle (POV) 89.5 0.20 89.3 0.34
POV-single occupant 48.2 0.29 44.4 0.69
POV-multiple occupants 41.3 0.30 44.9 0.66
Transit 1.8 0.07 1.2 0.14
Walk 7.5 0.15 8.4 0.29
Otherc 1.2 0.07 1.2 0.13
Total 100.0 – 100.0 –
a Source: The 2001 National Household Travel Survey, Daily Trip File,
U.S. Department of Transportation.b SE denotes standard error.c ‘‘Other’’ includes riding a bike.
Table 4
Daily travel: Percent travelers by age and sexa,b,c
Age Male SE Female SE Total SE
19–64 92.3 0.25 89.9 0.26 91.1 0.20
65 + 80.6 0.81 71.6 0.74 75.4 0.63
a Source: The 2001 National Household Travel Survey, Daily File, U.S.
Department of Transportation.b SE denotes standard error.c Includes those who reported at least one trip during their randomly
assigned ‘‘travel day.’’
D.V. Collia et al. / Journal of Safety Research 34 (2003) 461–470 463
in the text were found to be statistically significant at a 0.05
alpha level.
2. Travel-related characteristics of older travelers in the
United States
The main objective of this paper is to highlight travel
patterns of older adults at the national level as depicted in
the 2001 NHTS. The intent is to present basic travel
characteristics of older Americans and allow for compar-
isons between older adults and younger adults. Older adults
are defined to be individuals who are at least 65 years old
and younger adults are individuals between the ages of 19
and 64. Comparisons between older and younger adults, as
defined above, are most often made because daily travel
patterns of children and teenagers (18 and younger) are
considerably different. Therefore, including children and
teenagers in the analysis pool can potentially confound the
underlying contributing factors in the observed patterns
among American adults.
Results from the 2001 National Household Travel Survey
estimated that Americans took approximately 411 billion
daily trips and 2.6 billion long-distance trips (Table 1).
Proportionally, older adults take a lower percentage of trips
than the rest of the U.S. population. In 2001, 12.6% of the
U.S. population was 65 years old or older (U.S. Bureau of
Census, 2003) and, yet, they took approximately 10% of all
daily trips and 8% of the long-distance trips. Whereas,
younger adults (19–64), comprising 62% of the U.S.
Table 3
Daily travel: Percent drivers by age and sexa,b,c
Age Male SE Female SE Total SE
19–64 94.8 0.23 91.5 0.26 93.1 0.18
65 + 90.0 0.61 72.4 0.68 79.8 0.49
a Source: The 2001 National Household Travel Survey, Person File,
U.S. Department of Transportation.b Based on responses to the survey question ‘‘Are you a driver?’’c SE denotes standard error.
population, took 68% of all daily trips and 72% of long-
distance trips.
As shown in Tables 2 and 16, travel by personal
vehicle remains the dominant mode of transportation
across age groups for both daily and long distance travel.
Younger and older adults conduct about 90% of both their
daily and long-distance travel in a personal vehicle.
However, there are significant differences based on age
and gender regarding the driver status of these groups.
Overall, a significantly lower percentage of older adults
report to be drivers as compared to adults younger that 65.
Moreover, older women represent the lowest percentage of
drivers among the groups. Table 3 shows that, overall,
93% of adults younger than 65 reported to be drivers, as
compared to 80% among older adults. Although women,
in general, report to be drivers at a lower percentage than
men within each age group, the difference in driving rates
between men and women is far greater between older
adults as compared to their younger cohort. Younger
women trail their male cohort by approximately 3% (95
vs. 92), whereas older women trail their cohort by 18%
(90 vs. 72).
A similar pattern is revealed when examining the
demographic characteristics of those who reported taking
at least one trip on their ‘‘travel day’’ (for daily travel) or
during their assigned four-week ‘‘travel period’’ (for long
distance travel). Tables 4 and 5 show that, for daily trips
and long-distance trips, a significantly lower percentage of
older travelers report having traveled as compared to
younger travelers. Participation in daily travel was 75%
for older adults and 91% for younger adults. Participation
in long distance travel was 35% for older adults and 48%
for younger adults. Further, the percentage of older women
taking at least one daily trip or at least one long-distance
Table 5
Long-distance travel: Percent travelers by age and sexa,b,c
Age Male SE Female SE Total SE
19–64 49.8 0.49 46.1 0.38 47.9 0.36
65 + 39.7 0.86 30.9 0.77 34.6 0.64
a Source: The 2001 National Household Travel Survey, Daily Person
File, U.S. Department of Transportation.b SE denotes standard error.c Includes those who reported at least one long-distance trip during their
assigned four week ‘‘travel period’’.
Table 6
Mean number of trips by age and sexa
Type of Travel Age: 19–64 Age: 65 +
Male Female All Male Female All
Daily tripsb 4.3 4.6 4.4 3.9 3.2 3.4
Std. error 0.03 0.03 0.02 0.06 0.05 0.04
Long distance tripsc 1.3 0.9 0.1 0.8 0.5 0.6
Std. error 0.03 0.01 0.02 0.03 0.02 0.02
a Source: The 2001 National Household Travel Survey, Person File,
Daily File, and Preliminary Long Distance Trip File, U.S. Department of
Transportation.b Estimated mean number of trips per day.c Estimated mean number of trips per four-week reporting period.
Table 8
Daily travel: Percent trips taken as driversa,b,c
Age Group Male SE Female SE All SE
19–64 89.2 0.28 76.1 0.34 82.4 0.22
65 + 87.5 0.60 62.0 1.06 74.1 0.54
a For Private Vehicle Trips only; respondents were asked to specify
whether they were the driver; each table cell represents the percent drivers
in that category.b SE denotes standard error.c Source: The 2001 National Household Travel Survey, Daily Trip File,
U.S. Department of Transportation.
D.V. Collia et al. / Journal of Safety Research 34 (2003) 461–470464
trip was the lowest as compared to the other age-by-gender
groups.
3. Characteristics of daily trips taken in the nation by
older adults
Data collected on daily trips include topics such as the
purpose of the trip, the means or mode of transportation
used, the duration and length of the trip, the time of day
and day of the week when the trip took place, and the
number of people in the vehicle during the trip. In the
2001 NHTS, a daily trip is one that occurred on the
randomly selected travel day regardless of mode or dis-
tance traveled, so long as the person went from one
address to another.
3.1. Who is traveling?
Frequency, length, and travel time for daily travel vary
considerably across age and gender groups. Older adults
take a significantly lower number of trips per day than
younger adults. Older adults take an average of 3.4 trips per
day and younger adults take an average of 4.4 trips per day
(Table 6). Further analysis by gender within age groups also
shows a significant difference in the number of trips taken.
Older women take the least number of daily trips. Older
Table 7
Mean time and distance traveled daily by age category and sexa,b
Age Male Female
groupMean
daily
travel
timec
SE Mean
miles
traveledc
SE Mean
daily
travel
timed
SE Mean
miles
traveled
SE
19–64 73.4 0.73 42.1 0.62 50.1 0.51 25.0 0.35
65+ 57.2 1.44 27.2 0.95 26.2 0.66 9.5 0.36
ALL 51.7 0.46 28.9 0.39 34.6 0.33 16.8 0.22
a Source: The 2001 National Household Travel Survey, Daily Trip File
and Person File, U.S. Department of Transportation.b SE denotes standard error.c Mean travel distance is expressed in miles.d Mean travel time is expressed in minutes.
women take 3.2 trips as compared to older men who take
3.9 trips per day. In contrast, younger women take more
trips per day than do younger men – 4.6 trips versus 4.3
trips, respectively.
Further, as shown in Table 7, there is a distinct pattern
with respect to average distance traveled and average
travel time with respect to age and gender. Older men
travel shorter distances than younger men (27 miles vs. 42
miles), and older women travel shorter distances than
younger women (10 miles vs. 25 miles). Also, when
comparing daily travel between men and women within
an age group, women consistently travel shorter distances
than men. There is nearly a three-fold difference in
distance traveled between older men and older women
and an almost two-fold difference in distance traveled
between younger men and younger women. It is worth
noting that, on a daily basis, older women travel the
shortest distance as compared to the other age-by-gender
groups (about 10 miles per day).
3.2. How do they travel?
As shown in Table 2, the majority of daily trips occur
in personal vehicles such as a car, pickup truck, van, or
sport utility vehicle (SUV; Table 2). Both age groups
report using a personal vehicle for almost 9 out of 10 of
their daily trips. Similarly, for both age groups, use of
transit remains relatively low (less than 2% of trips), as
is use of ‘‘other’’ means, including riding a bike.
However, older Americans walk a higher percentage of
Table 9
Percent daily trips by type of personal vehicle for driversa,b
Personal vehicle Age: 19–64 Age: 65 +
Percent SE Percent SE
Car 57.8 0.39 77.3 0.66
Van 12.2 0.25 8.2 0.51
SUV 13.7 0.30 4.4 0.34
Truck 16.0 0.29 10.2 0.42
RV or motorcycle 0.3 0.03 0.1 0.03
Total 100.0 – 100.0 –
a Source: The 2001 National Household Travel Survey, Daily Trip File,
U.S. Department of Transportation.b SE denotes standard error.
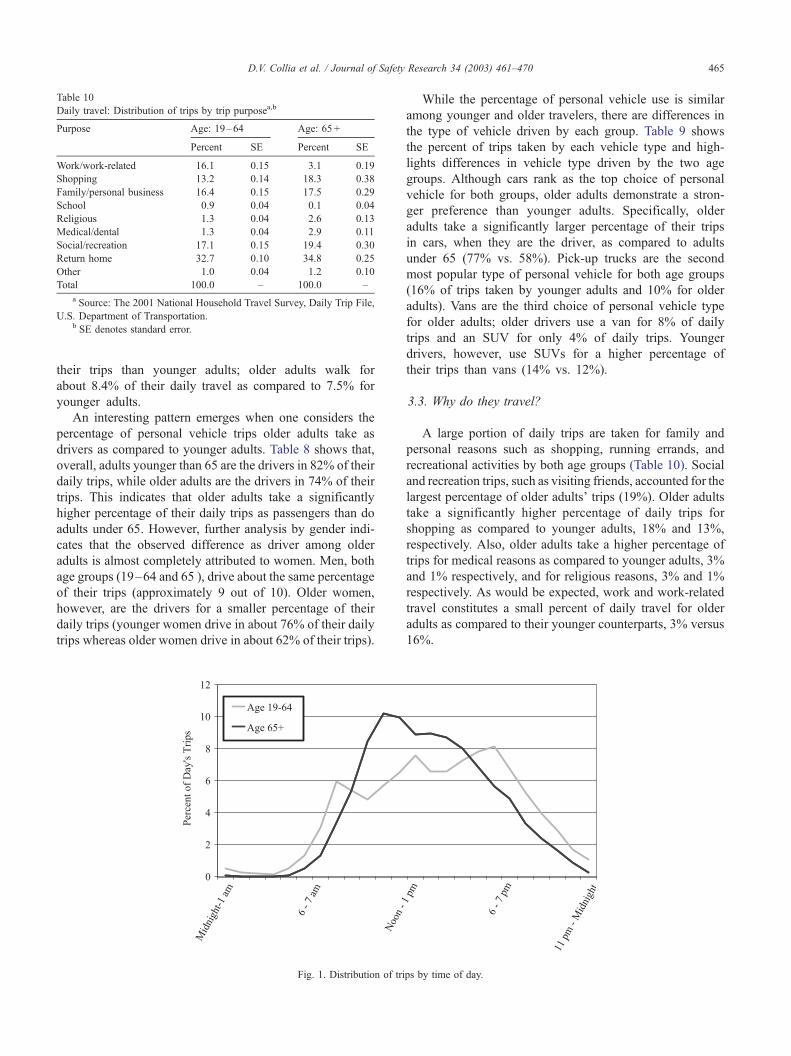
Table 10
Daily travel: Distribution of trips by trip purposea,b
Purpose Age: 19–64 Age: 65 +
Percent SE Percent SE
Work/work-related 16.1 0.15 3.1 0.19
Shopping 13.2 0.14 18.3 0.38
Family/personal business 16.4 0.15 17.5 0.29
School 0.9 0.04 0.1 0.04
Religious 1.3 0.04 2.6 0.13
Medical/dental 1.3 0.04 2.9 0.11
Social/recreation 17.1 0.15 19.4 0.30
Return home 32.7 0.10 34.8 0.25
Other 1.0 0.04 1.2 0.10
Total 100.0 – 100.0 –
a Source: The 2001 National Household Travel Survey, Daily Trip File,
U.S. Department of Transportation.b SE denotes standard error.
D.V. Collia et al. / Journal of Safety Research 34 (2003) 461–470 465
their trips than younger adults; older adults walk for
about 8.4% of their daily travel as compared to 7.5% for
younger adults.
An interesting pattern emerges when one considers the
percentage of personal vehicle trips older adults take as
drivers as compared to younger adults. Table 8 shows that,
overall, adults younger than 65 are the drivers in 82% of their
daily trips, while older adults are the drivers in 74% of their
trips. This indicates that older adults take a significantly
higher percentage of their daily trips as passengers than do
adults under 65. However, further analysis by gender indi-
cates that the observed difference as driver among older
adults is almost completely attributed to women. Men, both
age groups (19–64 and 65 ), drive about the same percentage
of their trips (approximately 9 out of 10). Older women,
however, are the drivers for a smaller percentage of their
daily trips (younger women drive in about 76% of their daily
trips whereas older women drive in about 62% of their trips).
Fig. 1. Distribution of tri
While the percentage of personal vehicle use is similar
among younger and older travelers, there are differences in
the type of vehicle driven by each group. Table 9 shows
the percent of trips taken by each vehicle type and high-
lights differences in vehicle type driven by the two age
groups. Although cars rank as the top choice of personal
vehicle for both groups, older adults demonstrate a stron-
ger preference than younger adults. Specifically, older
adults take a significantly larger percentage of their trips
in cars, when they are the driver, as compared to adults
under 65 (77% vs. 58%). Pick-up trucks are the second
most popular type of personal vehicle for both age groups
(16% of trips taken by younger adults and 10% for older
adults). Vans are the third choice of personal vehicle type
for older adults; older drivers use a van for 8% of daily
trips and an SUV for only 4% of daily trips. Younger
drivers, however, use SUVs for a higher percentage of
their trips than vans (14% vs. 12%).
3.3. Why do they travel?
A large portion of daily trips are taken for family and
personal reasons such as shopping, running errands, and
recreational activities by both age groups (Table 10). Social
and recreation trips, such as visiting friends, accounted for the
largest percentage of older adults’ trips (19%). Older adults
take a significantly higher percentage of daily trips for
shopping as compared to younger adults, 18% and 13%,
respectively. Also, older adults take a higher percentage of
trips for medical reasons as compared to younger adults, 3%
and 1% respectively, and for religious reasons, 3% and 1%
respectively. As would be expected, work and work-related
travel constitutes a small percent of daily travel for older
adults as compared to their younger counterparts, 3% versus
16%.
ps by time of day.
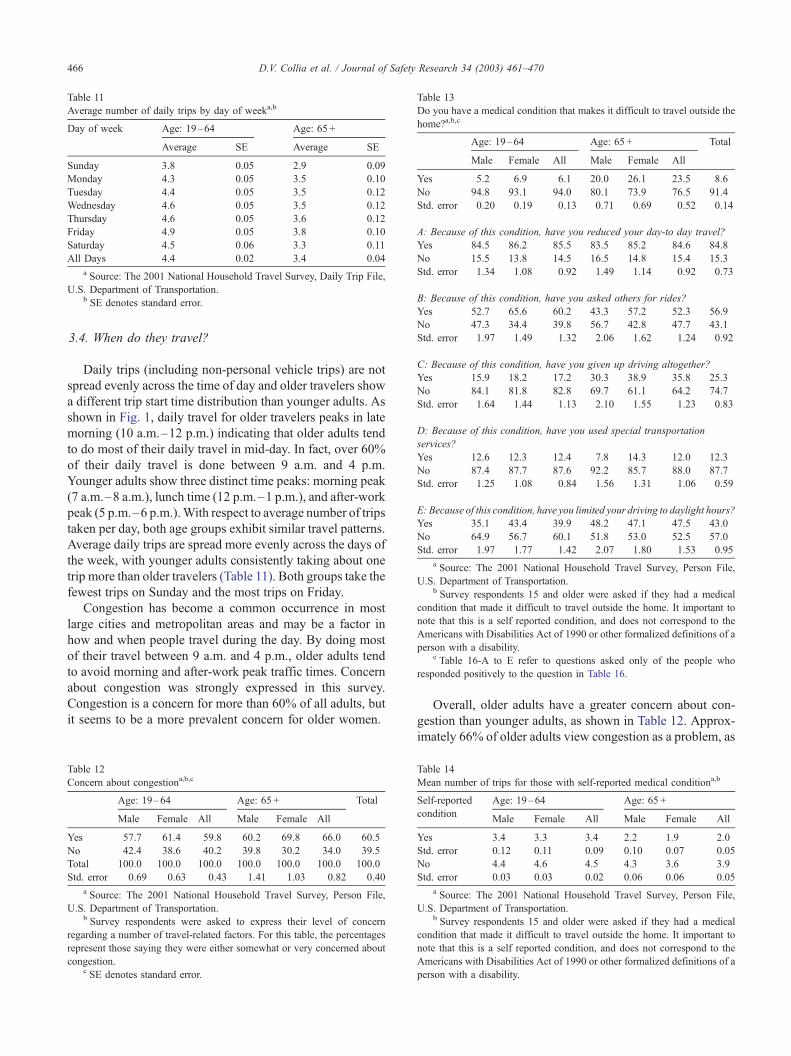
Table 13
Do you have a medical condition that makes it difficult to travel outside the
home?a,b,c
Age: 19–64 Age: 65 + Total
Male Female All Male Female All
Yes 5.2 6.9 6.1 20.0 26.1 23.5 8.6
No 94.8 93.1 94.0 80.1 73.9 76.5 91.4
Std. error 0.20 0.19 0.13 0.71 0.69 0.52 0.14
A: Because of this condition, have you reduced your day-to day travel?
Yes 84.5 86.2 85.5 83.5 85.2 84.6 84.8
No 15.5 13.8 14.5 16.5 14.8 15.4 15.3
Std. error 1.34 1.08 0.92 1.49 1.14 0.92 0.73
B: Because of this condition, have you asked others for rides?
Yes 52.7 65.6 60.2 43.3 57.2 52.3 56.9
No 47.3 34.4 39.8 56.7 42.8 47.7 43.1
Std. error 1.97 1.49 1.32 2.06 1.62 1.24 0.92
C: Because of this condition, have you given up driving altogether?
Yes 15.9 18.2 17.2 30.3 38.9 35.8 25.3
No 84.1 81.8 82.8 69.7 61.1 64.2 74.7
Std. error 1.64 1.44 1.13 2.10 1.55 1.23 0.83
D: Because of this condition, have you used special transportation
services?
Yes 12.6 12.3 12.4 7.8 14.3 12.0 12.3
No 87.4 87.7 87.6 92.2 85.7 88.0 87.7
Std. error 1.25 1.08 0.84 1.56 1.31 1.06 0.59
E: Because of this condition, have you limited your driving to daylight hours?
Yes 35.1 43.4 39.9 48.2 47.1 47.5 43.0
No 64.9 56.7 60.1 51.8 53.0 52.5 57.0
Std. error 1.97 1.77 1.42 2.07 1.80 1.53 0.95
a Source: The 2001 National Household Travel Survey, Person File,
U.S. Department of Transportation.b Survey respondents 15 and older were asked if they had a medical
condition that made it difficult to travel outside the home. It important to
note that this is a self reported condition, and does not correspond to the
Americans with Disabilities Act of 1990 or other formalized definitions of a
person with a disability.c Table 16-A to E refer to questions asked only of the people who
responded positively to the question in Table 16.
Table 11
Average number of daily trips by day of weeka,b
Day of week Age: 19–64 Age: 65 +
Average SE Average SE
Sunday 3.8 0.05 2.9 0.09
Monday 4.3 0.05 3.5 0.10
Tuesday 4.4 0.05 3.5 0.12
Wednesday 4.6 0.05 3.5 0.12
Thursday 4.6 0.05 3.6 0.12
Friday 4.9 0.05 3.8 0.10
Saturday 4.5 0.06 3.3 0.11
All Days 4.4 0.02 3.4 0.04
a Source: The 2001 National Household Travel Survey, Daily Trip File,
U.S. Department of Transportation.b
D.V. Collia et al. / Journal of Safety Research 34 (2003) 461–470466
3.4. When do they travel?
Daily trips (including non-personal vehicle trips) are not
spread evenly across the time of day and older travelers show
a different trip start time distribution than younger adults. As
shown in Fig. 1, daily travel for older travelers peaks in late
morning (10 a.m.–12 p.m.) indicating that older adults tend
to do most of their daily travel in mid-day. In fact, over 60%
of their daily travel is done between 9 a.m. and 4 p.m.
Younger adults show three distinct time peaks: morning peak
(7 a.m.–8 a.m.), lunch time (12 p.m.–1 p.m.), and after-work
peak (5 p.m.–6 p.m.).With respect to average number of trips
taken per day, both age groups exhibit similar travel patterns.
Average daily trips are spread more evenly across the days of
the week, with younger adults consistently taking about one
trip more than older travelers (Table 11). Both groups take the
fewest trips on Sunday and the most trips on Friday.
Congestion has become a common occurrence in most
large cities and metropolitan areas and may be a factor in
how and when people travel during the day. By doing most
of their travel between 9 a.m. and 4 p.m., older adults tend
to avoid morning and after-work peak traffic times. Concern
about congestion was strongly expressed in this survey.
Congestion is a concern for more than 60% of all adults, but
it seems to be a more prevalent concern for older women.
SE denotes standard error.
Table 12
Concern about congestiona,b,c
Age: 19–64 Age: 65 + Total
Male Female All Male Female All
Yes 57.7 61.4 59.8 60.2 69.8 66.0 60.5
No 42.4 38.6 40.2 39.8 30.2 34.0 39.5
Total 100.0 100.0 100.0 100.0 100.0 100.0 100.0
Std. error 0.69 0.63 0.43 1.41 1.03 0.82 0.40
a Source: The 2001 National Household Travel Survey, Person File,
U.S. Department of Transportation.b Survey respondents were asked to express their level of concern
regarding a number of travel-related factors. For this table, the percentages
represent those saying they were either somewhat or very concerned about
congestion.c SE denotes standard error.
Overall, older adults have a greater concern about con-
gestion than younger adults, as shown in Table 12. Approx-
imately 66% of older adults view congestion as a problem, as
Table 14
Mean number of trips for those with self-reported medical conditiona,b
Self-reported Age: 19–64 Age: 65 +
conditionMale Female All Male Female All
Yes 3.4 3.3 3.4 2.2 1.9 2.0
Std. error 0.12 0.11 0.09 0.10 0.07 0.05
No 4.4 4.6 4.5 4.3 3.6 3.9
Std. error 0.03 0.03 0.02 0.06 0.06 0.05
a Source: The 2001 National Household Travel Survey, Person File,
U.S. Department of Transportation.b Survey respondents 15 and older were asked if they had a medical
condition that made it difficult to travel outside the home. It important to
note that this is a self reported condition, and does not correspond to the
Americans with Disabilities Act of 1990 or other formalized definitions of a
person with a disability.
Table 15
Long distance: Percent of trips taken by age and gendera,b,c
Age group Male Female SE Total
19–64 59.2 40.8 0.59 100.0
65 + 53.4 46.6 1.18 100.0
Total percent by gender 57.3 42.7 0.48 100.0
a Percents are estimated based on annualized population estimates of
long-distance trips taken.b SE denotes standard error.c Source: The 2001 National Household Travel Survey, Daily Trip File,
U.S. Department of Transportation.
D.V. Collia et al. / Journal of Safety Research 34 (2003) 461–470 467
compared to 60% of younger adults. But, as the data in Table
12 indicate, a significantly higher percentage of older women
view congestion as a problem than older men (70% vs. 60%),
which accounts for the observed difference between the age
groups.3 Older men express concern about congestion at the
same rate as younger men and younger women (60% for older
men, 58% for younger men, and 61% for younger women4).
3.5. Older adults with self-reported medical condition(s)
that impact their ability to travel
The 2001 NHTS also collected information on the travel
behavior of persons 15 or older who have a self-reported
medical condition that affects their ability to travel (Table
13). Specifically, individuals 15 and older were asked if they
had a medical condition that made it difficult to travel
outside the home5. Nearly 24% of older adults report having
a medical condition that potentially limits their travel
outside the home, compared with 6% for younger adults.
This analysis indicates older adults have a four-fold greater
likelihood to experience a medical condition that inhibits
their travel than younger adults. Or, based on the 2001
Census Population figures, more than 8 million older adults
(2.9 million older men and 5.3 million older women) can
experience decreased mobility due to a self-reported med-
ical condition. As would be expected, these older individ-
uals take fewer trips than those who do not report such
medical conditions. As shown in Table 14, the average
number of trips drops to 2 per day for those with self-
reported medical conditions, whereas older adults without
self-reported medical conditions average 3.9 trips per day.
Further, when asked whether this condition has reduced
their day-to-travel, a similar percentage of younger and
older adults reported it did–approximately 85% for older
adults and 86% for younger adults (Table 13-A). While both
age groups report a reduction in travel in the presence of a
self-reported medical condition (i.e., they reduce their day-
to-day travel by the same percentage,) it has a greater impact
on the elderly as a whole, due to the higher prevalence of
disabilities among older adults. This is also evident by the
observed reduction in the average number of daily trips.
Having a self-reported medical condition that makes it
difficult to travel outside the home affects all the groups
differently:
� A significantly lower percentage of older adults reported
asking others for rides (Table 13-B). Overall, 52% of
5 It is important to note that this is a self reported condition, and does
not correspond to the Americans with Disabilities Act of 1990 or other
formalized definitions of a person with a disability.
3 Survey respondents were asked to express their level of concern
regarding a number of travel-related factors. For this particular item, the
percentages represent those saying they were either somewhat or very
concerned about congestion.4 These percentages are not statistically different at the .05 significance
level.
older adults reported asking others for rides as compared
to 60% for younger adults. Similarly, a significantly
higher percent of women ask others for rides within each
age group. Fifty-seven percent of older women ask others
for rides as compared to 43% for older men.� A significantly higher percentage of older adults have
given up driving altogether. As shown in Table 13-C,
twice as many older adults give up driving as a result of a
self-reported medical condition. Further, older women
are more likely to give up driving than older men. The
percentage of older women having given up driving is 39
as compared to 30 for older men.� Older women are twice as likely to use special
transportation services than older men. As shown in
Table 13-D, the same percentage of both age groups
(12%) reported using special transportation services such
as dial-a-ride. However, while there is not a significant
difference between men and women among young
adults, a significantly higher percentage of older women
reported having used special transportation services as
compared to older men, 14.3% and 7.8% respectively.� Older drivers are more likely to limit their driving to
daytime only than younger drivers. Of those with a self-
reported medical condition, a significantly higher
percentage of older adults reported limiting their driving
to daytime only as compared to younger adults, 48% and
40% respectively (Table 13-E).
4. Characteristics of long-distance travel by older adults
Long-distance trips in the 2001 NHTS are defined as trips
of 50 miles or more from home to the farthest destination
traveled.6 For a long-distance trip, this includes both the
6 Although the definitions for daily trips and long-distance trips differ,
it is important to note that trips made as part of daily travel are not mutually
exclusive from long-distance travel. That is, daily trips- or combinations of
daily trips into home-to-home journeys-can result in travel of more than 50
miles or more away from home. Therefore, these trips would be included in
both the estimates for daily travel, as well as long-distance travel. Care
should therefore be exercised when using estimates for daily and long-
distance travel together. This is especially true of trip rates and trip miles
since simply combining would provide an overestimation of total household
travel. For this paper, data for daily travel and long-distance travel were
analyzed separately.
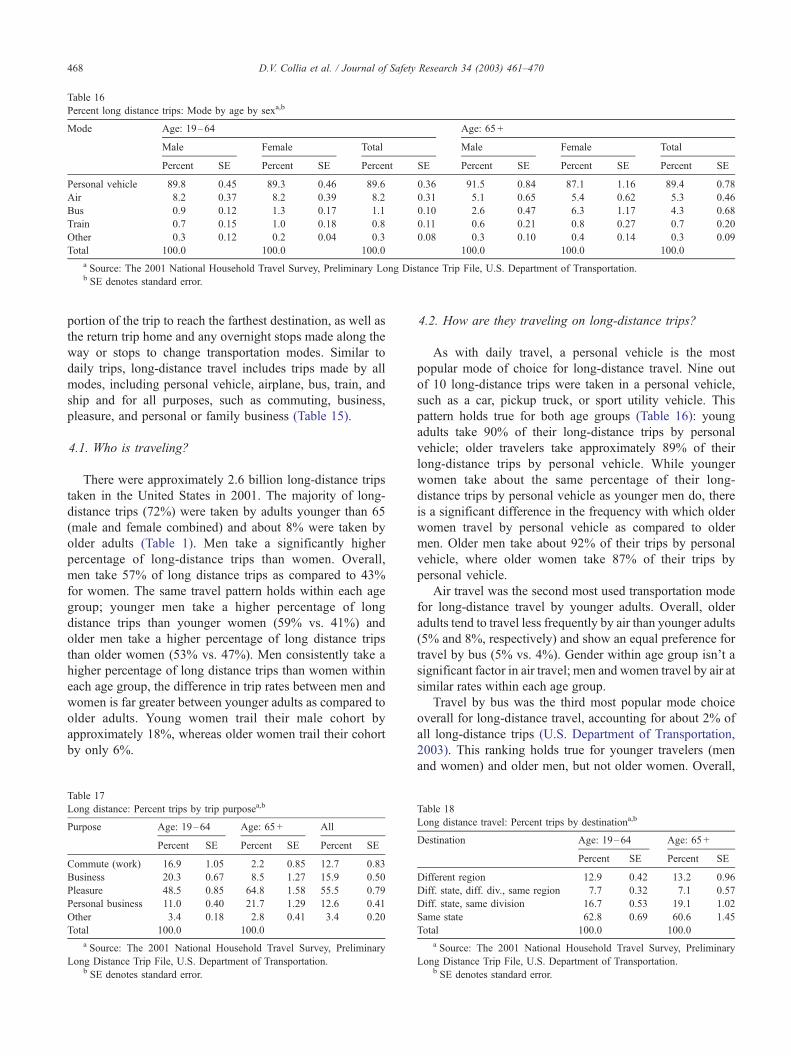
Table 16
Percent long distance trips: Mode by age by sexa,b
Mode Age: 19–64 Age: 65 +
Male Female Total Male Female Total
Percent SE Percent SE Percent SE Percent SE Percent SE Percent SE
Personal vehicle 89.8 0.45 89.3 0.46 89.6 0.36 91.5 0.84 87.1 1.16 89.4 0.78
Air 8.2 0.37 8.2 0.39 8.2 0.31 5.1 0.65 5.4 0.62 5.3 0.46
Bus 0.9 0.12 1.3 0.17 1.1 0.10 2.6 0.47 6.3 1.17 4.3 0.68
Train 0.7 0.15 1.0 0.18 0.8 0.11 0.6 0.21 0.8 0.27 0.7 0.20
Other 0.3 0.12 0.2 0.04 0.3 0.08 0.3 0.10 0.4 0.14 0.3 0.09
Total 100.0 100.0 100.0 100.0 100.0 100.0
a Source: The 2001 National Household Travel Survey, Preliminary Long Distance Trip File, U.S. Department of Transportation.b SE denotes standard error.
D.V. Collia et al. / Journal of Safety Research 34 (2003) 461–470468
portion of the trip to reach the farthest destination, as well as
the return trip home and any overnight stops made along the
way or stops to change transportation modes. Similar to
daily trips, long-distance travel includes trips made by all
modes, including personal vehicle, airplane, bus, train, and
ship and for all purposes, such as commuting, business,
pleasure, and personal or family business (Table 15).
4.1. Who is traveling?
There were approximately 2.6 billion long-distance trips
taken in the United States in 2001. The majority of long-
distance trips (72%) were taken by adults younger than 65
(male and female combined) and about 8% were taken by
older adults (Table 1). Men take a significantly higher
percentage of long-distance trips than women. Overall,
men take 57% of long distance trips as compared to 43%
for women. The same travel pattern holds within each age
group; younger men take a higher percentage of long
distance trips than younger women (59% vs. 41%) and
older men take a higher percentage of long distance trips
than older women (53% vs. 47%). Men consistently take a
higher percentage of long distance trips than women within
each age group, the difference in trip rates between men and
women is far greater between younger adults as compared to
older adults. Young women trail their male cohort by
approximately 18%, whereas older women trail their cohort
by only 6%.
Table 17
Long distance: Percent trips by trip purposea,b
Purpose Age: 19–64 Age: 65 + All
Percent SE Percent SE Percent SE
Commute (work) 16.9 1.05 2.2 0.85 12.7 0.83
Business 20.3 0.67 8.5 1.27 15.9 0.50
Pleasure 48.5 0.85 64.8 1.58 55.5 0.79
Personal business 11.0 0.40 21.7 1.29 12.6 0.41
Other 3.4 0.18 2.8 0.41 3.4 0.20
Total 100.0 100.0
a Source: The 2001 National Household Travel Survey, Preliminary
Long Distance Trip File, U.S. Department of Transportation.b SE denotes standard error.
4.2. How are they traveling on long-distance trips?
As with daily travel, a personal vehicle is the most
popular mode of choice for long-distance travel. Nine out
of 10 long-distance trips were taken in a personal vehicle,
such as a car, pickup truck, or sport utility vehicle. This
pattern holds true for both age groups (Table 16): young
adults take 90% of their long-distance trips by personal
vehicle; older travelers take approximately 89% of their
long-distance trips by personal vehicle. While younger
women take about the same percentage of their long-
distance trips by personal vehicle as younger men do, there
is a significant difference in the frequency with which older
women travel by personal vehicle as compared to older
men. Older men take about 92% of their trips by personal
vehicle, where older women take 87% of their trips by
personal vehicle.
Air travel was the second most used transportation mode
for long-distance travel by younger adults. Overall, older
adults tend to travel less frequently by air than younger adults
(5% and 8%, respectively) and show an equal preference for
travel by bus (5% vs. 4%). Gender within age group isn’t a
significant factor in air travel; men and women travel by air at
similar rates within each age group.
Travel by bus was the third most popular mode choice
overall for long-distance travel, accounting for about 2% of
all long-distance trips (U.S. Department of Transportation,
2003). This ranking holds true for younger travelers (men
and women) and older men, but not older women. Overall,
Table 18
Long distance travel: Percent trips by destinationa,b
Destination Age: 19–64 Age: 65 +
Percent SE Percent SE
Different region 12.9 0.42 13.2 0.96
Diff. state, diff. div., same region 7.7 0.32 7.1 0.57
Diff. state, same division 16.7 0.53 19.1 1.02
Same state 62.8 0.69 60.6 1.45
Total 100.0 100.0
a Source: The 2001 National Household Travel Survey, Preliminary
Long Distance Trip File, U.S. Department of Transportation.b SE denotes standard error.
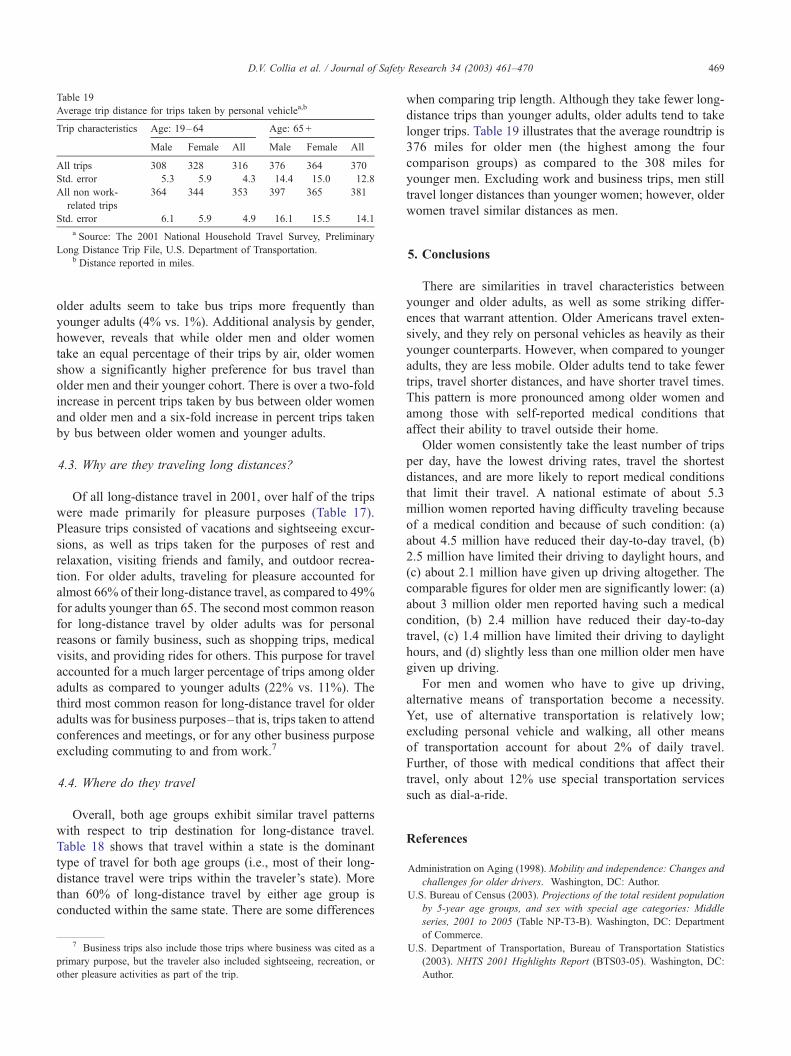
Table 19
Average trip distance for trips taken by personal vehiclea,b
Trip characteristics Age: 19–64 Age: 65 +
Male Female All Male Female All
All trips 308 328 316 376 364 370
Std. error 5.3 5.9 4.3 14.4 15.0 12.8
All non work-
related trips
364 344 353 397 365 381
Std. error 6.1 5.9 4.9 16.1 15.5 14.1
a Source: The 2001 National Household Travel Survey, Preliminary
Long Distance Trip File, U.S. Department of Transportation.b Distance reported in miles.
D.V. Collia et al. / Journal of Safety Research 34 (2003) 461–470 469
older adults seem to take bus trips more frequently than
younger adults (4% vs. 1%). Additional analysis by gender,
however, reveals that while older men and older women
take an equal percentage of their trips by air, older women
show a significantly higher preference for bus travel than
older men and their younger cohort. There is over a two-fold
increase in percent trips taken by bus between older women
and older men and a six-fold increase in percent trips taken
by bus between older women and younger adults.
4.3. Why are they traveling long distances?
Of all long-distance travel in 2001, over half of the trips
were made primarily for pleasure purposes (Table 17).
Pleasure trips consisted of vacations and sightseeing excur-
sions, as well as trips taken for the purposes of rest and
relaxation, visiting friends and family, and outdoor recrea-
tion. For older adults, traveling for pleasure accounted for
almost 66% of their long-distance travel, as compared to 49%
for adults younger than 65. The second most common reason
for long-distance travel by older adults was for personal
reasons or family business, such as shopping trips, medical
visits, and providing rides for others. This purpose for travel
accounted for a much larger percentage of trips among older
adults as compared to younger adults (22% vs. 11%). The
third most common reason for long-distance travel for older
adults was for business purposes–that is, trips taken to attend
conferences and meetings, or for any other business purpose
excluding commuting to and from work.7
4.4. Where do they travel
Overall, both age groups exhibit similar travel patterns
with respect to trip destination for long-distance travel.
Table 18 shows that travel within a state is the dominant
type of travel for both age groups (i.e., most of their long-
distance travel were trips within the traveler’s state). More
than 60% of long-distance travel by either age group is
conducted within the same state. There are some differences
7 Business trips also include those trips where business was cited as a
primary purpose, but the traveler also included sightseeing, recreation, or
other pleasure activities as part of the trip.
when comparing trip length. Although they take fewer long-
distance trips than younger adults, older adults tend to take
longer trips. Table 19 illustrates that the average roundtrip is
376 miles for older men (the highest among the four
comparison groups) as compared to the 308 miles for
younger men. Excluding work and business trips, men still
travel longer distances than younger women; however, older
women travel similar distances as men.
5. Conclusions
There are similarities in travel characteristics between
younger and older adults, as well as some striking differ-
ences that warrant attention. Older Americans travel exten-
sively, and they rely on personal vehicles as heavily as their
younger counterparts. However, when compared to younger
adults, they are less mobile. Older adults tend to take fewer
trips, travel shorter distances, and have shorter travel times.
This pattern is more pronounced among older women and
among those with self-reported medical conditions that
affect their ability to travel outside their home.
Older women consistently take the least number of trips
per day, have the lowest driving rates, travel the shortest
distances, and are more likely to report medical conditions
that limit their travel. A national estimate of about 5.3
million women reported having difficulty traveling because
of a medical condition and because of such condition: (a)
about 4.5 million have reduced their day-to-day travel, (b)
2.5 million have limited their driving to daylight hours, and
(c) about 2.1 million have given up driving altogether. The
comparable figures for older men are significantly lower: (a)
about 3 million older men reported having such a medical
condition, (b) 2.4 million have reduced their day-to-day
travel, (c) 1.4 million have limited their driving to daylight
hours, and (d) slightly less than one million older men have
given up driving.
For men and women who have to give up driving,
alternative means of transportation become a necessity.
Yet, use of alternative transportation is relatively low;
excluding personal vehicle and walking, all other means
of transportation account for about 2% of daily travel.
Further, of those with medical conditions that affect their
travel, only about 12% use special transportation services
such as dial-a-ride.
References
Administration on Aging (1998).Mobility and independence: Changes and
challenges for older drivers. Washington, DC: Author.
U.S. Bureau of Census (2003). Projections of the total resident population
by 5-year age groups, and sex with special age categories: Middle
series, 2001 to 2005 (Table NP-T3-B). Washington, DC: Department
of Commerce.
U.S. Department of Transportation, Bureau of Transportation Statistics
(2003). NHTS 2001 Highlights Report (BTS03-05). Washington, DC:
Author.

D.V. Collia et al. / Journal of Safety Research 34 (2003) 461–470470
Demetra V. Collia, M.S., M.H.S. is a Mathematical Statistician in the
Office of Advanced Studies at the Bureau of Transportation Statistics, U.S.
Department of Transportation. Ms Collia’s research interests are in the areas
of transportation safety for special groups and injury epidemiology.
Joy Sharp, M.S. is a Statistician in the Office of Survey Programs at the
Bureau of Transportation Statistics, U.S. Department of Transportation. Ms
Sharp is the co-manager of the 2001 National Household Travel Survey.
She has 15 years experience working on various health, housing, and
income surveys in the private sector and the federal government.
Lee Giesbrecht, M.S., is a Statistician in the Office of Survey Programs at
the Bureau of Transportation Statistics, U.S. Department of Transportation.
Mr. Giesbrecht has 15 years of experience working on demographic surveys
in both the private sector and federal government.


