MASTER’S THESIS
INTERNATIONAL ADMINISTRATION
AND GLOBAL GOVERNANCE
The Effect of Intergenerational Social Mobility on Tolerance to
Corruption An Analysis for OECD Countries
Author: Viktoriya Chuikina
Advisor: Stefan Dahlberg
15 October 2014

Abstract
This study aims to provide the answer to the question if intergenerational social
mobility has an effect on tolerance to corruption. By merging together two fields of
literature in social science – corruption and equality of opportunities offered in a society
and performing statistical analysis this paper provides some evidences that societal
mobility and tolerance to corruption are correlated.
The question of intergenerational social mobility has not been thoroughly investigated
due to the limitations in the data availability. However recent studies in OECD countries
allowed looking more in-depth into the phenomenon, giving an opportunity to fill in the
gap in the theories. Analyzing tolerance to corruption effects of social mobility with
measurement of actual social mobility was rarely employed in the quantitative analysis
earlier. Using the data obtained from the World Value Review (Wave 6) for almost
22 000 individuals from the OECD countries, including their socio-demographic
characteristics and perceived social mobility parameters, combined with the OECD
dataset on the intergenerational educational attainment and earning elasticity, the
study indicates that individual’s perception of society as mobile leads to lower tolerance
of corruption. This relation holds regardless the level of societal trust and general
satisfaction with life. Moreover, study concludes that educational mobility may also
have negative effect on tolerance to corruption.
This study contributes to the understanding why some countries succeeded in
maintaining high quality of governance with low level of corruption whereas others
trapped with dysfunctional political institutions.
Key words: tolerance to corruption, corruption, intergenerational social mobility, equal
opportunities, inequality
Word Count: 10798
Table of Contents
1. Introduction ............................................................................................................................................ 1
1.1 Research aim and question ............................................................................................................ 3
1.2 Disposition ............................................................................................................................................ 4
2. Theoretical Framework ...................................................................................................................... 4
2.1 Quality of Government and Corruption ..................................................................................... 4
2.2 Tolerance to Corruption and Social Trust ................................................................................ 7
2.3 Social Mobility ..................................................................................................................................... 8
2.3.1 Social Mobility and Institutions .......................................................................................... 12
2.3 Research Hypotheses ...................................................................................................................... 12
3. Data and Methodology ...................................................................................................................... 13
3.1 Data Description ......................................................................................................................... 13
3.1.1 Dependent Variable - Tolerance to Corruption ............................................................ 13
3.1.2 Independent Variables ........................................................................................................... 15
3.1.2.1Perceived Social Mobility ............................................................................................... 15
3.1.2.2 Actual Social Mobility ..................................................................................................... 16
3.1.3 Control Variables ...................................................................................................................... 17
3.1.3.1 Social Trust ......................................................................................................................... 17
3.1.3.2 General Satisfaction with Life ...................................................................................... 18
3.1.3.3 Net National Income ........................................................................................................ 19
3.1.3.4 Other Control Variables ................................................................................................. 19
3.2 Model Specification .................................................................................................................... 21
4. Empirical Analysis .............................................................................................................................. 23
4.1 Individual-level Analysis ............................................................................................................... 23
4.2 Country-level Analysis ................................................................................................................... 29
4.3 Discussion of the Results ............................................................................................................... 30
4.4 Limitations .......................................................................................................................................... 32
5. Conclusion .............................................................................................................................................. 33
References: ..................................................................................................................................................... 36
Appendices ..................................................................................................................................................... 40
1
1. Introduction
“Once social change begins, it cannot be reversed. You cannot uneducate the person who
has learned to read. You cannot humiliate the person who feels pride. You cannot oppress
the people who are not afraid anymore. We have seen the future, and the future is ours”
(Cezar Chavez, 1984)
The recent studies on the quality of government and the effectiveness of bureaucratic
institutions proven that these are the key aspects to economic growth and social
welfare. Good governance is a prerequisite for well-functioning institutions and low
level of corruption. Even though the concept of quality of government is still new to the
researchers, one can conclude that impartiality of institutions is a basic principle in
defining the good governance. Hence equal opportunities of different groups of society
can provide both social and economic progress in a country. In other words how power
is exercised first of all depends on how the access to the power is provided (Rothstein &
Teorell, 2008).
Moreover equality of opportunities lies at the core of democratic principles which
ensures high development of state growth and reduction of corruption consequently.
For example, Fischer (2009) argues that fair and impartial government decisions have
direct impact on country’s welfare if they are provided by strong rule of law and
institutional efficiency (Fischer, 2009). At the same time, Roemer (2002) shows that
equal opportunities refer often to equal set of choices offered to the individual in the
society whereas the core concept of human preferences, his way of perception and
resources available are ignored in the egalitarian theories. As Dworkin (1981) argued
individual cannot be responsible for the resources available but rather for the set of
individual preferences. In other words individuals are to be held accountable for the
actions and choices society entitles him to be responsible (Dworkin 1981 as cited in
Roemer, 2002). Hence, the equality of opportunities regardless individual’s background
should ideally provide equal access to resources and in societies. In other words,
societies where these opportunities are offered can be considered as mobile. But does
this necessarily provide better functioning institutions in a country?
2
However, inequality of income distribution and the initial welfare of an individual, often
determine the avenues open for intergenerational social mobility regardless of the
opportunities offered by the governmental institutions. On the other hand, persistence
in occupation across generations creates certain pattern on the labor market and
economic development shaping socio-economic institutions of a country in the long
time perspective. Empirical testing proved that high income inequality has direct impact
on low intergenerational social mobility (D’Addio, 2007).
Other scholars emphasize that intergenerational social mobility often arises from the
inequality of opportunities provided to the individuals in a society when personal talent
and achievements are correlated and opposed to the family background and social
status obtained by an individual at birth (Corak, 2013). Moreover, raising income
inequality leads to the stronger bonds with family background making it more difficult
for an individual to achieve higher income and move “between classes” due to his/her
personal talents (OECD 2011 cited at Corak, 2013). On the other hand, corruption is
often defined as a “hierarchical phenomenon” when individuals with access to power
exercise this power through obtaining personal benefits. In other words, in corrupted
societies hierarchy (or social class) is a way of establishing order and structure as a
coordination mechanism (Bac, 1996).
Contrary, intergenerational social mobility is a mechanism of assessing policies
implemented by the country’s government identifying socio-economic factors for which
an individual cannot be held responsible. However the mechanism by itself cannot be
used as a policy recommendation tool because social mobility only contributing to a
part of inequality problem solution and therefore does not identify how intergeneration
social mobility should function and how it affects quality of institutions in a country
(D’Addio, 2007). On the other hand measuring intergenerational social mobility can
help to identify and reduce inequalities of opportunities given to an individual at birth
and with this to shape lower tolerance towards corruption and provide development of
good governance as a consequence.
From the discussion above can one conclude that impartiality of government decisions
and equality of opportunities engage individuals to be responsible for the social and
political welfare and level of corruption in the country consequently? Put it in other way
3
can intergenerational social mobility/immobility affect tolerance to corruption? The
social scientists discussed thoroughly the impact of economic welfare on corruption
(Kaufmann 2007; Kurtz 2007; Charron & Lapuente 2010) at the same time the
connection between social mobility and economic welfare of a country is relatively
recent research area and it was mainly tested from economic point of view (Fischer
2009; D’Addio 2007).
From one point of view economic inequality establishes a greater degree of social
inequality as different groups of society cannot benefit from the full and universal
access to the country’s welfare. Low-income groups tend to believe that access to the
economic resources is limited and therefore “rich” groups benefit more from the access
to power. Therefore, a society with a high level of economic inequality enters a circle of
“causal chain” when citizens stop trusting the groups in-power, and as a consequence,
the government (in-power groups) is unable to establish better social welfare programs
as citizens do not entrust them with resources (Rothstein, 2011).
The causal relation between the quality of government and how corruption may
prevent an economic growth and equal access to resources in a country was discussed
by the Social and Economic Science Schools (Rothstein 2011; Fischer 2009; D’Addio
2007). On the contrary the impact of social mobility on the attitude to corruption, and
the level of corruption a country consequently, are not in the focus of the social
researchers and therefore reveal a gap of analyses on the inequality of opportunities
and corruption in a society.
1.1 Research aim and question
This study aims to fulfill the research gap in quality of government field and evaluate
the tolerance to corruption effect of intergenerational social mobility in a country. The
paper covers different theories and approaches on equality, intergenerational social
mobility and corruption in order to assess the relationship between mechanisms of
social inequalities persistence over time and tolerance to bad governance. It should be
noted, that measurement of social mobility lacks the common definition among the
researchers, therefore this paper explores Organization for Economic Co-operation and
Development (OECD) countries as a representative sample where most of the previous
4
studies in the field of social mobility were conducted and actual data can be obtained.
Hence, the objective of this research is to identify the effect of the intergenerational
social mobility in conjunction with the tolerance to corruption in the OECD countries.
Thus, this research addresses the following questions:
Does intergenerational social mobility affect the tolerance to corruption in the
OECD countries?
What is the tolerance to corruption effects of the intergenerational social
mobility in the OECD countries?
1.2 Disposition
First the existing explanation of corruption in connection with inequality issues and
intergenerational social mobility are critically discussed based on the previous
empirical and theoretical studies. Then, the concepts of actual and perceived
intergenerational social mobility are introduced. Hence this research paper is organized
as following: the existing literature on corruption, impartiality and social mobility are
discussed in Section 2, Section 3 includes the description of research method and data
description; followed by the empirical analysis and testing of research hypothesis in
Section 4. Finally, study limitations and conclusion are presented.
2. Theoretical Framework
2.1 Quality of Government and Corruption
The concept of quality of government developed by the social scientists determines
impartiality as a fundamental principle of institutional activity. The existing literature
argues that impartiality provides economic development, social welfare and low
corruption as a consequence. For example Rothstein and Teorell (2008) suggest that
well performing countries apply and follow the principle of impartiality in the areas of
public administration and public choice which in its turn provides establishment of the
rule of law and government effectiveness and accountability. Therefore authors point
out that good governance depends not only on the equal access to the power but on the
way this power is exercised by the authorities. However input (access) and output
(exercise) side of exercising political power shall be distinguished and hence equality
5
and impartiality are interdependent concepts. Moreover authors emphasize that
democratic political regime is one of the main conditions for high quality of government
although it cannot be sufficient condition all alone. Nonetheless democracy provide
regulatory basis of equal access to power and establishes laws on decreasing incentive
to corruption. The normative limits established by the legitimate democratic regimes
enable both impartiality and equality. Thus democracy is a prerequisite for accessing
power whereas exercising power is affected directly by impartiality (Rothstein &
Teorell, 2008).
Other scholars also follow the idea of importance of the institutional structure and
political regime in high quality of government and decreasing corruption. For example,
Olsson (1993) suggests that uncertainty implied by dictatorships often prevent state
from providing good governance and economic welfare. According to him the cost of
public goods in autocratic regimes devaluates with time any benefits received from
them, at the same time autocrats act in their own interests aiming by limiting access to
power of certain groups of society with this diminishing possibility for establishing
impartial political and economic institutions. Thus the idea of impartiality together with
democratic regimes discussed more thoroughly by Rothstein and Teorell (2008) secure
decreasing of corruption and establishing stability in rule of law over generations
instead of insuring stability for short-terms (Olsson, 1993).
However existing literature on political regimes and corruption is not fully supported
by empirical findings, and therefore cannot explain the mechanisms of corruption and
why some societies have higher degree of tolerance towards it. On the contrary
corruption remains a threat to democratic institutions and values of equality and
impartiality through decreasing social trust in political institutions. Therefore
corruption is an opposite concept to impartiality and defined by Mungiu - Pippidi
(2006) as “particularism” to certain individuals or groups of society contradicting with
idea of equal distribution of good in a country. Hence corruption becomes more difficult
to control when majority of individuals tolerate existing bad governance. In other words
corrupted governments are built in highly hierarchical societies and equal treatment is
guaranteed not to every individual or citizens as a whole but on the contrary - to
individuals belonging to the same social group. The major solution of addressing
corruption by implementing principle of impartiality does not work in these societies
6
and shifts to identifying corrupted privileged groups and solve this dilemma instead
(Mungiu - Pippidi, 2006).
Corruption therefore depends highly on social fractionalization and hierarchies among
people. Bac (1996) argues that the problem of corruption can be addressed be the
mechanism of check and monitoring from individuals belonging to the different social
segments (groups). In his article author takes different prospective and suggests that
hierarchically structured society can benefit directly in decreasing corruption
developing a system of independent control. Nonetheless, structurally independent
segments are prerequisites for creating controlling system moreover the success
depends highly on monitoring costs (Bac, 1996).
On the contrary some scholars suggest that high fragmentation of society and significant
inequalities in economic wealth increase the level of corruption. Sanjeev (2005) argues
that inequality creates social groups without access to power and therefore they have
fewer instruments to participate in the system of check and monitoring of corrupted
institutions. Hence inequality contributes to establishing social norms of higher degree
of acceptance and tolerance towards bad governance as a logical part of economic
growth. In democratic regimes this negative effect can be more severe as privileged
groups which have access to power tend to generate policies protecting their interests
rather than interests of majority of individuals in society. On the other hand corruption
exacerbates the existing welfare gap between the different groups of society. Therefore
inequalities paired with corruption decrease possibility of good governance
development (Sanjeev & You, 2005).
Another widely accepted approach in addressing the relation between country’s welfare
and quality of government deals with the “power resource” theory. The welfare
societies are seen as a byproduct of the industrial development and thus, the role of an
individual is determined by his occupation or social class as a whole. As a consequence,
the development of a state is therefore determined by the social class structure in a
country. Moreover, distribution of resources in a country becomes predetermined by
the class structure in a society. From this perspective demands of a class can further
influence the political and economic structure of a state (Korpi, 2006). However
Rothstein (2011) argues that class structure of a society does not necessarily reveal
7
increase in political corruption but on the contrary the state itself may have a leading
role in mobilizing classes and providing better opportunities and more equality among
different groups of a society (Rothstein, 2011).
From the discussion above one can conclude that non-corrupt states acknowledge the
fact of heterogeneity in society and existence of classes with different set of
opportunities. Theoretically, these issues can be addressed by impartiality and offering
equal access to the opportunities. Or, on the contrary, corruption can be monitored
through a clear hierarchy and a system of control at different levels of a societal
structure (Bac, 1996).
The analysis of corruption often focuses on the macro level studies comparing the cross-
country data. On the other hand, recent studies on corruption also try to grasp the
concept of individual characteristics and their role in the tolerance to corruption in
society. For example, Gatti et al. (2003) built their study of corruption based on the
micro-economic determinants of a society and conclude that gender, age, employment
status and income level can be determinants in attitude to corruption and as a
consequence are closely associated with the tolerance to corruption in a country (Gatti
et al., 2003).
To sum up, existing studies on the high quality of government and level of corruption
explain the connection between good institutions and their impact on country’s growth
whereas the studies on the individual’s impact in building better institutions are quite
limited. Moreover, the theories on quality of government and corruption often omit the
issue of class fragmentation in society and intergenerational social mobility. At the same
time great amount of literature analyzes inequality in terms of higher degree of
tolerance towards corruption. However, only indirect theoretical evidences were
presented by the researchers on the effect of intergenerational social mobility on the
average tolerance to corruption.
2.2 Tolerance to Corruption and Social Trust
Attitude to corruption in a society, on the other hand, reflects the social norms
acceptable in a country which often can be a mirroring factor of culture and reveal the
causal relation between the interpersonal trust and tolerance to nepotism, clientelism
8
(components of corruption). Thus, social trust is often seen as a defining factor in
establishing non-material capital in a country and provides higher degree of interaction
between the individuals in a society. For example Svendsen (2003) tests the value of
social trust in terms of transaction costs in a society and further concludes that even
economic growth of a state is strongly correlated with the level of social trust. In other
words, micro-level interactions based on trust provide the base for macro-level growth
through the societal structure and collective contribution to social capital as a
consequence (Svedsen and Svedsen, 2003).
Similarly, Rothstein (2011) argues that social trust as a major way of interaction among
the individuals establishes an “informal institution” or a form of mutually beneficial
cooperation for all level of actors. But on the other hand, in the corrupted societies elite
groups, or those who are close to the resource distribution, may benefit the most in this
situation when corruption is perceived in terms of other people’s beliefs (Rothstein,
2011). This leads to the assumption that corruption can be overcome if the strong
informal institutions like social trust can be established as a form of checks and controls.
On the other hand, Widmalm (2008) tests if corruption can become a trap to a society,
i.e. once institutions in a country are classified as corrupted it implies lower moral
norms and standards to the whole society and the system of checks and controls does
not function. In other words, corruption and social norms become a vicious circle, when
corruption is seen as an acceptable norm. However, author concludes that corruption by
itself does not correlate with individual’s attitude towards corrupted practices like
accepting bribes among the officials (Widmaml, 2008). This indicates that cultural
acceptance of corruption and tolerance to the corrupted institutions does not
necessarily reveals direct positive correlation between two variables, but at the same
time may have impact in individual understanding and acceptance of societal norms.
2.3 Social Mobility
Existing literature addresses the problem of social mobility mostly from economic point
of view measuring inequality of opportunities and its effect on the economic growth and
welfare development. For example Fischer (2009) develops studies to discuss the
relationship between the intergeneration social mobility and subjective well-being
9
measured by earning differences of parent and child pair. However author identifies
that actual and perceived intergenerational social mobility may have different effect on
income inequalities, economic development, and individual satisfaction with socio-
economic wellbeing (Fischer, 2009).
It is important to distinguish here between two major types of intergenerational social
mobility – actual and perceived defined by the scientists. D’Addio (2009) identifies that
actual social mobility is measured in terms of intergenerational earnings gap and
therefore varies highly among households’ income. At the same time actual social
mobility depends often on the income and education inequalities (D’Addio, 2009). On
the other hand perceived social mobility is more complex concept and deals with
individual perception of equal opportunities for education and possibility to escape
poverty offered by society in this country. Therefore perceived social mobility is seen as
a moderate tool of lowering subjective wellbeing and providing higher tolerance
towards inequalities in society contrary to the actual social mobility. However Fischer
identifies that inequalities are easier tolerated in intergenerational immobile societies
(Fischer, 2009).
Low social mobility has direct impact on inefficient economic development of a state
diminishing satisfaction in political institutions. Even though economic theories
suggests that inequalities in society provide higher incentive to move from one social
class to another and with this effect economic growth, Breen (1997) argues that
individual abilities do not often meet the actual social position and creates higher
degree of social dissatisfaction. Therefore in his study author provides statistical proves
that social mobility and economic growth do not have linearly positive relation but on
the contrary increasing welfare gap in society generates lower productivity, decreasing
trust and satisfaction in government institutions. This economic gap and prospect of
higher social mobility may be an ineffective socio-economic policy for improving social
and economic performance of a state (Breen, 1997).
Nonetheless, social mobility is not only a mechanism of overcoming economic
inequalities but on the other hand might be used as a tool of justifying and maintaining
bad institutions. For example, Mungiu-Pippidi (2006) argues that government promises
of high social mobility can be used as a mechanism of control in authoritarian and
10
corrupted regimes. These open channels of migrating from a lower social group to the
privileged one enables individuals to use these upward mobility channels which are
often easy and fast way to succeed contrary to the idea of changing the whole system
and establishing functioning institutions. Therefore corrupted regimes prefer to engage
individuals from lower social groups into their “game” with this insuring higher
tolerance towards corruption and support to the existing system as a whole (Mungiu-
Pippidi, 2006).
Social mobility and questions of inequality are especially observable in the competitive
market economies. Similar to the analysis performed by Mungiu-Pippidi, Kolankiewicz
(1996) also addresses the issue of the equal access and control over power and
distribution of income. However author suggests in his article that existing social
mobility in corrupted countries is provided by market forces and mechanisms
generating communication and interdependence of social groups within one country. At
the same time well-functioning economy is forced to provide equal opportunities due to
the higher demand for educated and experienced labor establishing with this social
networking and connections with governmental institutions (Kolankiewicz, 1996).
However, intergenerational social mobility can also be seen as a by-pass of economic
and social policies implemented in a country. In other words, if social mobility is treated
as a combined measurement of two components – educational attainments of
child/parent pair and wage mobility through generations, then education often shows
direct impact on wage persistence. At the same time policies implemented in a state
(resource access and distribution) are positively correlated with the wage mobility
(Causa et al., 2009).
Nonetheless low social mobility and inequality is not only used as a tool of maintaining
corrupted institutions out of fear of being overthrown in authoritarian regimes but it
also creates certain social norms and beliefs tolerating bad governance. Sanjeev (2005)
suggests that easier acceptance of corrupted institutions can be explained both by
economic and normative mechanisms when in a long period of time corruption
becomes a social norm accepted by the individuals in society. However contrary to
Mungiu-Pippidi theory, author believes that individuals with higher income have better
opportunities to enter government institutions and therefore being engaged in
11
corruption whereas people excluded from access to political institutions are also limited
in their rights to monitor and control bad governance increasing with this
intergenerational social immobility. Therefore the impact of low social mobility and
inequality on corruption is not just direct but also reverse because in a long run
corrupted institutions and bad governance promotes higher immobility and wealfare
gap (Sanjeev & You, 2005).
At this point it is interesting to refer to the egalitarian theory where the basic and one of
the major principles of equal opportunities emphasizes not only the equality of set of
choices made by individual but what is more important - equality of responsibilities that
shall be considered by individuals in society. Roemer (2002) discusses that
responsibilities taken by individual for the choices he made can ensure more equal
treatment both on economic and social level. Nonetheless this aspect is often left
ignored by the economists arguing for utilitarian redistribution of income which in its
turn involve less effective socio-economic policies developed by dysfunctional
institutions. At the same time changes in policies have direct impact on decreasing or
increasing welfare gap and social mobility opportunities (Roemer, 2002). Therefore
individual taking responsibility for his actions is held accountable for institutional
choices he makes and quality of government consequently.
On the other hand being accountable for the set of choices cannot create or increase the
trust of an individual in governmental institutions especially if they are proved to be
dysfunctional and highly corrupted. Morris and Klesner (2010) suggest that trust is a
major and most effective mechanism to involve society in eliminating corruption.
Therefore one can conclude that perceived corruption in a country depends first of all
on normative believes in institutions of the social groups excluded from access to power.
Similar to Sajeev & You (2005) arguments, this study shows that corruption creates
reverse causal effect generating mistrust among poor groups of society and increasing
with this heterogeneity within the society. However being a part of corrupted group
neither provides trust in governmental organizations nor helps to get rid of corruption
(Morris & Klesner, 2010). Hence, from the egalitarian prospective, individual decreases
the level of personal responsibility in fight against corruption.
12
2.3.1 Social Mobility and Institutions
From the discussion above, it can be argued that social mobility can be used as a
mechanism of improving economic efficiency and developing good governance.
However the concepts of social mobility, impartiality and good governance are closely
interrelated and can compound each other (Pearce, 2011). Hence, the combination may
lead to the negative effect as well and corrupted institutions creating lower trust in
governance and growing economic gap promote among individuals incentive to have
access to the power rather than changing the system as a whole which increases
tolerance towards corruption. Therefore the relation between intergenerational social
mobility and tolerance to corruption shall be assessed more thoroughly as one of the
direct way of ensuring better governance, promoting equal opportunities and
impartiality.
2.3 Research Hypotheses
This research aims to test whether tolerance to corruption is correlated with the
intergenerational social mobility based on the data available for the OECD countries. For
this purpose ordinary least squares (OLS) regression analysis is performed. Estimators
identified in the regression analysis help to explain the effects of independent variable
(social mobility) on dependent variable (tolerance to corruption) and answer the
question if there is a causal relation between the level of social mobility in a country and
attitude (tolerance) to corruption in a society.
In order address the research questions the following hypotheses were drawn:
Hypothesis 1: Intergenerational social mobility is negatively correlated with the
tolerance towards corruption in a country.
Hypothesis 2: Intergenerational social mobility and higher life satisfaction have
negative effect on the tolerance to corruption.
Based on the existing studies in the field of quality of government, tolerance to
corruption and intergenerational social mobility it can be suggested that other societal
and individual factors, like socio-demographic characteristics, social trust and life
satisfaction, must be taken into consideration when testing the relation between two

13
variables. Moreover, existing studies on the intergenerational social mobility distinguish
between the perceived and actual social mobility. This assumption is taken into
consideration when testing the relationship between intergenerational social mobility
and tolerance to corruption. Therefore, this research includes data both on the micro
(individual) and macro (country) level.
Hypothesis 3: Intergenerational social mobility and higher societal welfare are
negatively correlated with the tolerance to corruption.
These aspects are taken later into consideration in model specification (See Section 3.2)
and defined in more details in data description section (See Section 3.1).
3. Data and Methodology
In order to answer the research question quantitative method analysis is applied as a
preferable when working with and analyzing numerical data (Saunders et al., 2009).
The quantitative research method allows collecting data both on micro (individual) and
macro (country) levels and explaining the causal relationship between two variables. By
running regression with numerical observations, the theories presented above and
relationship between two variables outlined in the literature review part of this
research are tested (Field, 2013). Moreover, the cross-sectional design of study allows
identifying the differences between the groups included in the study and therefore to
establish patterns in data analysis, drawing a conclusion as a result (Vaus, 2010). As
previous studies lay the ground for testing the correlation between the tolerance to
corruption and intergenerational social mobility, it is required to specify the definitions
of variables included in this study and give explanation how they were converted into
meaningful data. In this research data on social mobility and tolerance to corruption are
used as explanatory and response variables respectively.
3.1 Data Description
3.1.1 Dependent Variable - Tolerance to Corruption
The concept of corruption itself is arguable and not easy to measure due to the limited
access to the reliable data. Therefore measuring of corruption represents often a
complex set of policies and criteria combined in an average score which are highly
14
questionable by a number of scholars. For example, Keller and Sik (2009) argue that
measurement of corruption use unreliable data and this limit analysis to very narrow
version of corruption (Keller & Sik, 2009). Moreover, Morris (2010) believes that the
actual experience of corruption by civil groups is much lower than the perception of
corruption and trust in political and bureaucratic institutions. On the contrary lack of
trust prevent society from taking steps towards fighting corruption and increases
tolerance towards the existing low quality of institutions at some extent (Morris &
Klesner, 2010). At the same time Ko et al. (2012) argue that corruption index is not
defined only by country’s laws but rather depends on people’s attitude and expectations
of how bureaucratic institution should function (Ko et at., 2012). Thus, in corrupted
societies more resources are spent by the officials for the personal use which creates
decrease in confidence in governmental institutions among the population. Moreover,
the belief that institutions and government are corrupted is seen as the main barrier in
creating equal opportunities to succeed through life regardless the family background.
In other words if corruption is seen as the best and fastest way to higher achievements
in life it may create the perception that joining the group close to the resources
distribution is the only option (Rothstein, 2011).
Due to the arguments presented above the concept of corruption is limited in this
research by the public tolerance towards corruption. Keller and Sik (2009) distinguish
active and passive tolerance towards corruption where passive corruption is defined as
individual’s attitude towards officials accepting bribes whereas active corruption
measured as officials asking for bribe. In order to measure the active corruption Keller
and Sik (2009) recommend to use European Value Survey measuring if it is acceptable
for officials to ask for favor or bribe (Keller & Sik, 2009). However, as this research aims
to identify the correlation between the public tolerance to corruption and social
mobility, the definition is limited to the passive corruption. Therefore the measure of
tolerance to passive corruption is based on the responses received from the citizens in
the World Value Survey, Wave 6 (2010-2014):
V202: Please tell me for each of the following actions whether you think it can always be
justified (10), never be justified (1), or something in between, using this card:
Someone accepting a bribe in the course of their duties
15
3.1.2 Independent Variables
3.1.2.1Perceived Social Mobility
As this paper aims to evaluate the effect of intergenerational social mobility on the
tolerance to corruption in OECD countries it is important to specify the definition of
social mobility per se. For this purpose the recent OECD publications on
intergenerational social mobility (Alesina, 2004; Fischer, 2009; Causa & Johansson,
2010) were exploited and the definition was adapted. Social mobility is used in this
study as an explanatory variable of tolerance towards corruption. However social
mobility is difficult to measure due to the limitation in available information over time
and across generations. Therefore the definition of the concept is adapted from the
research implemented in OECD countries and was defined as “life experiences of
individuals differ from those of their parents”. In countries offering equal opportunities
parent’s background cannot have direct significant impact on their children
performance.
Perceived social mobility can be measured by standard questionnaire containing
questions about equal possibility perceptions in education and escape from poverty. For
example Alesina, Glaeser and Sacerdote (cited at Fischer, 2009) used this type of
analysis to measure perceived social mobility in the US and European countries. The
data obtained contained information of people’s believe to escape poverty throughout
their life time, equal access to education and laziness as an actual cause of low income.
The perceived social mobility is measured based on the World Values Survey (WVS,
Wave 6, 2010-2014) and includes the following factors -confidence in the education
system (universities) –
V 119: I am going to name a number of organizations. For each one, could you tell me how
much confidence you have in them: is it a great deal of confidence (1), quite a lot of
confidence (2), not very much confidence (3) or none at all (4)?
Another variable that captures the level of the perceived social mobility is a belief that
better life can be achieved through a personal effort (not luck).

16
Now I'd like you to tell me your views on various issues. How would you place your views
on this scale? 1 means you agree completely with the statement on the left; 10 means you
agree completely with the statement on the right; and if your views fall somewhere in
between, you can choose any number in between.
V96: Incomes should be made more equal VS We need larger income differences as
incentives for individual effort
V100: In the long run, hard work usually brings a better life VS Hard work doesn’t
generallybring success—it’s more a matterof luck and connections.
3.1.2.2 Actual Social Mobility
In countries offering equal opportunities parent’s background cannot have direct
significant impact on their children performance. However intergenerational mobility
can be measured numerically by comparing the difference between parent’s and child’s
income in a long run, i.e. intergenerational earnings elasticity (Becker and Tomes
(1979) cited at D’Addio, 2007). This helps to assess the impact of parent’s income on
future child’s economic performance and consequently the actual degree of
generational income mobility in a country (D’Addio, 2007).
On the other hand perceived intergenerational social mobility is different from the
actual social mobility measured by improvement income and social statuses differ from
their parents. (Fischer, 2009).
However intergeneration earning elasticity is an average index and cannot measure the
degree of variations in income mobility ranges and its categories. Moreover
intergeneration earning elasticity measures father-son rather than total family income
ignoring earning from mother’s side. Nevertheless the changes in today’s world and
high involvement of women in labor market may have statistically significant impact on
the social mobility findings (D’Addio, 2007). However, other scholars argue that in
empirical testing father’s educational background has higher effect on son/daughter
outcomes both in education attainment and future earnings (Nguyen and Getinet, 2003
cited at Causa, 2009). D’Addio also points out that intergeneration earning elasticity
methods requires precise definition of sample and time period used as differences in
17
statistical methods may lead to different results and conclusions within the same
country (D’Addio, 2007).
Due to the fact that actual social mobility is difficult to define and measure in a single
number (Hopkins, 2008; Bjørnskov et al., 2013) in broad terms scholars (Fischer, 2009;
Bjørnskov et al., 2013; D’Addio, 2007) use two major factors to measure the actual
intergenerational mobility including intergenerational education attainment and
earnings (wage) elasticity. As this study focuses on OECD countries, the explanation of
the actual social mobility and data were obtained from the definition at work used by
the OECD Economic Department.
The first category grasps the concept of educational attainment in farter/son pair, i.e.
dependence of child’s educational achievements on parent’s educational background.
For this purpose PISA student performance in mathematics performance data was
obtained (OECD, 2014; OECD, 2007, OECD, 2004) based both on the maternal and
paternal-education dependence, where higher values indicate higher intergenerational
social mobility whereas lower values indicating educational immobility (Fischer, 2009).
Another factor impacting actual intergenerational social mobility in the OECD countries
is earnings elasticity and persistence (Bjørnskov et al., 2013; Hopkins, 2008; Fischer,
2009, Causa, 2009). It should be noted however, that the data for parents life earnings is
the data that is difficult to obtain and often measured in an estimation model (Causa,
2009; D’Addio, 2007; Corak, 2006).Therefore, macro-level data was collected from the
recent Fischer’s (2009) research on social mobility in the OECD countries, where 0
indicates complete generation mobility and 1 – complete immobility (Fischer, 2009).
3.1.3 Control Variables
3.1.3.1 Social Trust
The development of the model analyzing the tolerance to corruption effects of the
intergenerational social mobility includes also other potential factors that may have
influence in the regression. In this connection the question of general trust in the society
may denote the tolerance both to active and passive corruption. In other words
societies with higher trust in institutions and government are generally “happier” and
more willing to accept the existing state of corruption in a country. Moreover Rothstein
18
(2011) argues that societies with higher level of trust are built on the idea of “social
solidarity” and belief that each member of a society have equal share of responsibilities.
On the other hand social trust does not only related to the tolerance to corruption but
also seen as a way of building equal opportunities. In theory high level of economic
inequality built upon the increasing earnings gap prevent societies from creating
welfare programs which may lead to the equal access to education, economic and social
status regardless the parents’ background. Groups with higher privileges have easier
access to the resources whereas others are left out from the social insurance programs
and distribution of the national welfare (Rothstein, 2011).
Moreover, Fischer (2009) argues that social trust may contribute to the higher
intergenerational social mobility in a country. Social trust creates positive environment
for sharing the resources providing economic freedom, which in its turn, triggers higher
social mobility and protects individuals from being trapped by the family background
(Fischer, 2009).
Therefore social trust is included in the analysis as a control variable. The measurement
is based on the World Value Survey, Wave 6 (2010-2014) question:
V24: Generally speaking, would you say that most people can be trusted or that you need
to be very careful in dealing with people?
1 Most people can be trusted. 2 Need to be very careful.
3.1.3.2 General Satisfaction with Life
On the other hand, the attitude towards the level of corruption in a country may be also
correlated with the general satisfaction with life. In other words different people have
different objectives in life regardless the objective opportunities offered by the social
system in a country (Bjørnskov et al., 2013). As it was established earlier in the
literature review part of this paper, equality of opportunities by itself is a major
determinant of fairness and access to the social welfare in a country. Rothstein (2011)
argues that sense of equality of opportunities is directly related to declining segregation
among the different classes of society and therefore generates higher degree of trust
both within the society and towards the institutions (Rothstein, 2011).
19
As this study aims to explore the effect of social mobility both perceived and actual on
the tolerance to corruption, the subjective characteristics of individuals and sense of
equality of opportunities in a society are accounted and grasped through the concept of
general satisfaction with life. Micro level data for the OECD countries was extracted
from the World Value Review, Wave 6 (2010-2014):
V23: All things considered, how satisfied are you with your life as a whole these days?
Using this card on which 1 means you are “completely dissatisfied” and 10 means you are
“completely satisfied” where would you put your satisfaction with your life as a whole?
3.1.3.3 Net National Income
All things considered economic welfare of a country also plays an important role in the
individual wellbeing as it has direct impact on educational attainment, earnings level,
and tolerance to corruption in a society. In other words National wealth is often
associated with the better and more equal access to education and the quality of
government institutions (Fischer, 2009). On the other hand most of the OECD countries
share similar political and economic structure which in theory should lead to the
equality of opportunities and similar level of social insurance for the population in the
countries. However the difference of the wellbeing and increasing gap within the society
prompt that economic structure is not defining factor in the establishing of good
institutions (Rothstein, 2011).
Based on this divergent explanation of the role of economic welfare in a country, the Net
National Income per capita is included in the regression analysis as a control variable.
3.1.3.4 Other Control Variables
The demographics of individuals included in the analysis may also affect the tolerance
to corruption. For example a number of studies on the intergenerational social mobility
and welfare showed that gender, age, educational background and social class
(subjective) of the individuals involved in the analysis identify stronger correlation
between the variables (Fischer, 2009; Bjørnskov et al., 2013). It is therefore may be
suggested that individual’s background has an effect on social mobility and correlated
with the tolerance to corruption in a country. The data on population demographics
included in the World Value Survey and corresponds with the individuals’ responses.
20
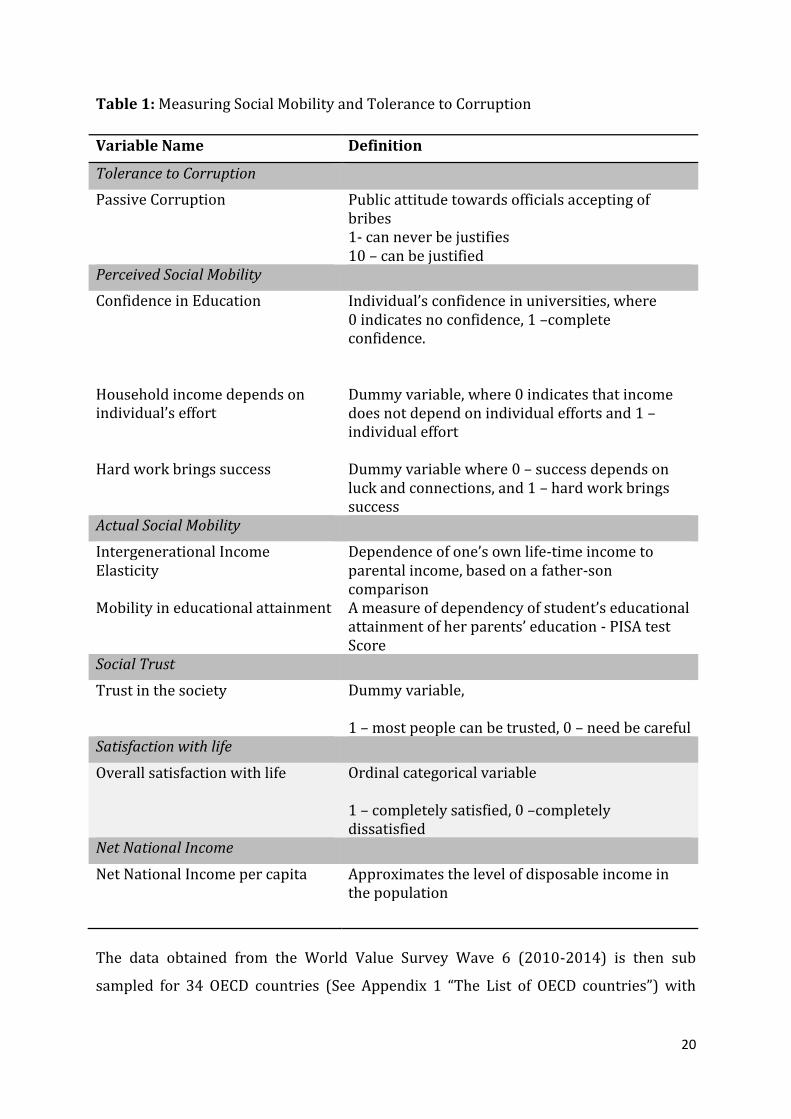
Table 1: Measuring Social Mobility and Tolerance to Corruption
Variable Name Definition
Tolerance to Corruption
Passive Corruption
Public attitude towards officials accepting of bribes 1- can never be justifies 10 – can be justified
Perceived Social Mobility
Confidence in Education
Individual’s confidence in universities, where 0 indicates no confidence, 1 –complete confidence.
Household income depends on individual’s effort
Dummy variable, where 0 indicates that income does not depend on individual efforts and 1 – individual effort
Hard work brings success Dummy variable where 0 – success depends on luck and connections, and 1 – hard work brings success
Actual Social Mobility
Intergenerational Income Elasticity
Dependence of one’s own life-time income to parental income, based on a father-son comparison
Mobility in educational attainment A measure of dependency of student’s educational attainment of her parents’ education - PISA test Score
Social Trust
Trust in the society Dummy variable,
1 – most people can be trusted, 0 – need be careful Satisfaction with life
Overall satisfaction with life Ordinal categorical variable
1 – completely satisfied, 0 –completely dissatisfied
Net National Income
Net National Income per capita Approximates the level of disposable income in the population
The data obtained from the World Value Survey Wave 6 (2010-2014) is then sub
sampled for 34 OECD countries (See Appendix 1 “The List of OECD countries”) with
21
information for 22 709 individuals from 15 OECD countries. For the country-level
analysis individual responses from the WVS are aggregated to the macro-level and
combined with the information on actual intergenerational social mobility, including
intergenerational income elasticity and mobility in educational attainment, obtained
from the OECD database (OECD, 2007; OECD, 2014) and Fischer (2009).
3.2 Model Specification
In order to address the research question if the tolerance to corruption is correlated
with the intergenerational social mobility the quantitative analysis of the data available
for the OECD countries was applied. The quantitative analysis is performed with IBM
SPSS Statistics software. The correlation between two variables is tested with the
ordinary least squares (OLS) regression which generally has the following model:
Where Yi is a dependent variable (predicted outcome) and Xi is an independent variable
and parameter β1 quantify the relationship between two parameters with an error term
εi and common intercept coefficient β0 (Field, 2013).
The analysis includes both the effects of the perceived and actual social mobility; in
addition control variables like socio-demographic characteristics, social trust,
satisfaction with life and net national income per capita are included in the research in
order to test alternative impacts on the tolerance to corruption.
First micro level analysis is applied in order to identify the correlation between the
perceived social mobility and tolerance to passive corruption on the individual level:
Model 1: Tolerance of passive corruptioni= β0 + β1Perceived Social Mobility +εi
The model is further developed by adding control variables, including demographics of
the population, advanced by adding social trust and general life satisfaction in the
regression analysis.
Model 2-5: Tolerance of passive corruptioni= β0 + β1Perceived Social Mobility
+β2Population Demographics + εi
22
Model 6: Tolerance of passive corruptioni = β0 + β1Perceived Social Mobility
+β2Population Demographics + β3Social Trust + εi
Model 7: Tolerance of passive corruptioni = β0 + β1Perceived Social Mobility +
β2Population Demographics + β3Social Trust + β4Life Satisfaction + εi
In further development of the study, actual social mobility is introduced to the
regression with statistical analysis on the macro (country) level:
Model 8: Tolerance of corruptioni = β0 + β1Actual Social Mobility + εi
Model 9: Tolerance of corruptioni= β0 + β1Perceived Social Mobility + β2Actual Social
Mobility +εi
Finally, the macro-level analysis is implemented including control variable economic
welfare of a country (Net National Income):
Model 10: Tolerance of corruptioni= β0 + β1Perceived Social Mobility +β2Actual Social
Mobility+ β3Net National Income + εi
23
4. Empirical Analysis
4.1 Individual-level Analysis
First the individual level analysis is performed in order to determine the correlation
between the perceived intergenerational social mobility and tolerance to corruption in
the OECD countries. The subsample for OECD countries is extracted from the World
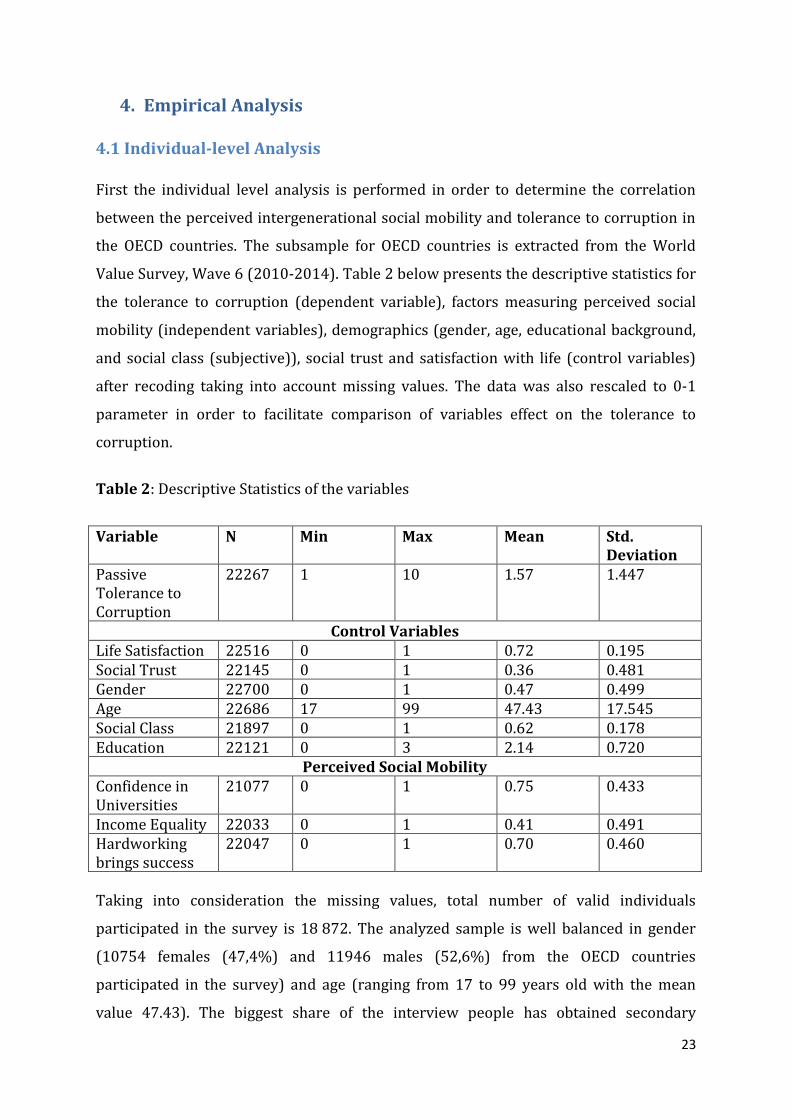
Value Survey, Wave 6 (2010-2014). Table 2 below presents the descriptive statistics for
the tolerance to corruption (dependent variable), factors measuring perceived social
mobility (independent variables), demographics (gender, age, educational background,
and social class (subjective)), social trust and satisfaction with life (control variables)
after recoding taking into account missing values. The data was also rescaled to 0-1
parameter in order to facilitate comparison of variables effect on the tolerance to
corruption.
Table 2: Descriptive Statistics of the variables
Variable N Min Max Mean Std. Deviation
Passive Tolerance to Corruption
22267 1 10 1.57 1.447
Control Variables Life Satisfaction 22516 0 1 0.72 0.195 Social Trust 22145 0 1 0.36 0.481 Gender 22700 0 1 0.47 0.499 Age 22686 17 99 47.43 17.545 Social Class 21897 0 1 0.62 0.178 Education 22121 0 3 2.14 0.720
Perceived Social Mobility Confidence in Universities
21077 0 1 0.75 0.433
Income Equality 22033 0 1 0.41 0.491 Hardworking brings success
22047 0 1 0.70 0.460
Taking into consideration the missing values, total number of valid individuals
participated in the survey is 18 872. The analyzed sample is well balanced in gender
(10754 females (47,4%) and 11946 males (52,6%) from the OECD countries
participated in the survey) and age (ranging from 17 to 99 years old with the mean
value 47.43). The biggest share of the interview people has obtained secondary

24
education - 48.7%, 31.7% have university degree, primary education was achieved by
15.8% and only 1.2% have no formal education. Most of the individuals participated in
the survey attribute themselves to the middle class (with upper middle class share
23.0% and lower middle class share 39.0%), working class was indicated by 26.3%,
whereas upper and lower class 1.1% and 6.1% respectively (See Appendix 2).
Figure 1 (below) was constructed based on the individual responses on tolerance to
corruption obtained from the World Value Survey, Wave 6 (2010-2014). Generally in
the sub-sample of 15 OECD countries the tolerance to corruption is quite low (below
2.5) with highest index in Mexico (2.2) followed by Sweden (1.8) whereas Japan and
Turkey have the lowest tolerance to passive corruption (1.3 and 1.2 respectively).
Figure 1: Tolerance to Passive Corruption: Analysis for OECD countries. Data: World
Value Survey, Wave 6 (2010-2014)
As tolerance to passive corruption does not follow normal distribution, the value is
further transformed to logarithmic function in order to hold the first OLS regression
assumption of data normal distribution (See Appendix 3) (Field, 2013).
Furthermore, when working with the pooled data it is important to address the problem
of clustering, i.e. specific countries factors (GDP, size of the population and etc.) that
may have effect on the individual’s responses and correlation coefficients consequently.
0
0.5
1
1.5
2
2.5
25
Therefore, dummy variables for 15 countries were included in the regression (See full
regression estimates in Appendix 4).
26
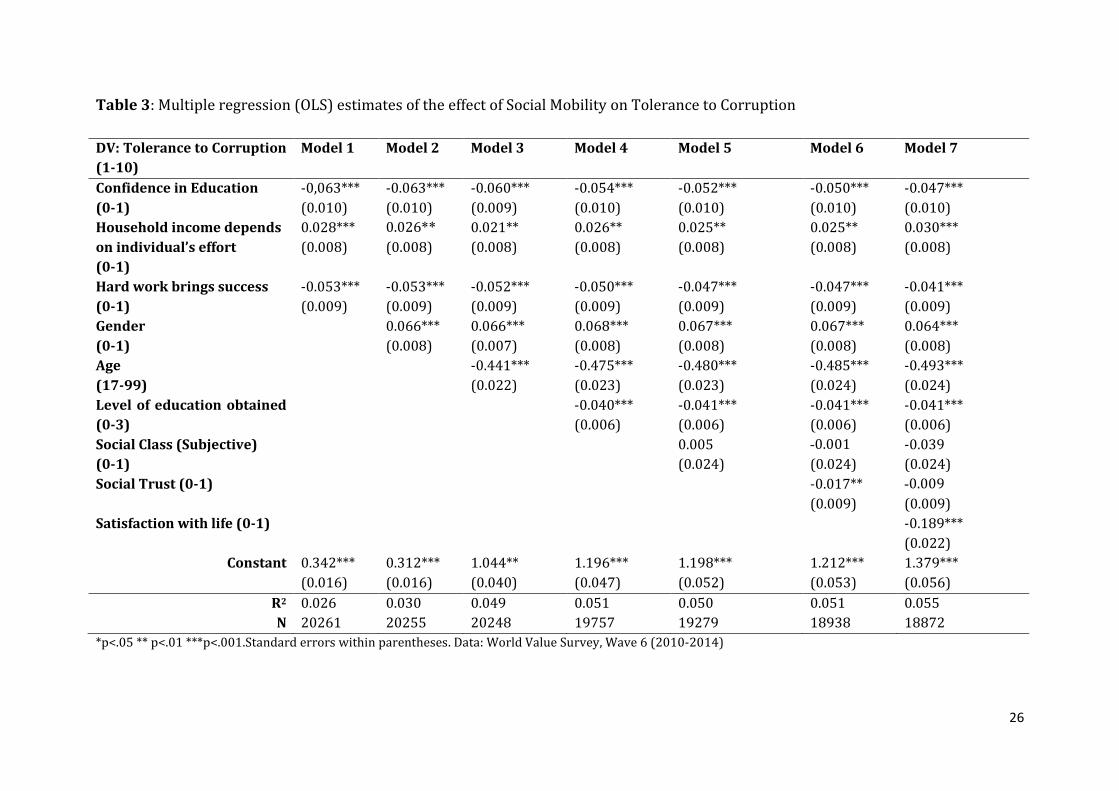
Table 3: Multiple regression (OLS) estimates of the effect of Social Mobility on Tolerance to Corruption
DV: Tolerance to Corruption
(1-10)
Model 1 Model 2 Model 3 Model 4 Model 5 Model 6 Model 7
Confidence in Education
(0-1)
-0,063***
(0.010)
-0.063***
(0.010)
-0.060***
(0.009)
-0.044***
(0.010)
-0.042***
(0.010)
-0.040***
(0.010)
-0.047***
(0.010)
Household income depends
on individual’s effort
(0-1)
0.028***
(0.008)
0.026**
(0.008)
0.021**
(0.008)
0.026**
(0.008)
0.024**
(0.008)
0.024**
(0.008)
0.030***
(0.008)
Hard work brings success
(0-1)
-0.053***
(0.009)
-0.043***
(0.009)
-0.042***
(0.009)
-0.040***
(0.009)
-0.047***
(0.009)
-0.047***
(0.009)
-0.041***
(0.009)
Gender
(0-1)
0.066***
(0.008)
0.066***
(0.007)
0.068***
(0.008)
0.067***
(0.008)
0.067***
(0.008)
0.064***
(0.008)
Age
(17-99)
-0.441***
(0.022)
-0.474***
(0.023)
-0.480***
(0.023)
-0.484***
(0.024)
-0.493***
(0.024)
Level of education obtained
(0-3)
-0.040***
(0.006)
-0.041***
(0.006)
-0.041***
(0.006)
-0.041***
(0.006)
Social Class (Subjective)
(0-1)
0.004
(0.024)
-0.001
(0.024)
-0.039
(0.024)
Social Trust (0-1) -0.017**
(0.009)
-0.009
(0.009)
Satisfaction with life (0-1) -0.189***
(0.022)
Constant 0.342***
(0.016)
0.312***
(0.016)
1.044**
(0.040)
1.196***
(0.047)
1.198***
(0.042)
1.212***
(0.043)
1.379***
(0.056)
R2 0.026 0.030 0.049 0.041 0.040 0.041 0.044
N 20261 20255 20248 19757 19279 18938 18872
*p<.05 ** p<.01 ***p<.001.Standard errors within parentheses. Data: World Value Survey, Wave 6 (2010-2014)
27
The regression analysis starts with measuring correlation between the perceived
intergenerational social mobility (when all three components are included in the
regression) and tolerance to passive corruption. The results indicate that all three
components (confidence in education, believe that household income depends on
individual’s effort and hard work can bring success) are statistically significant in the
analysis. The distinctive factor is the sign of the coefficients included in the regression
which helps us to predict the correlation between the perceived social mobility and
tolerance to corruption. Specifically, higher confidence in education is negatively
correlated with the tolerance to corruption, i.e. 1 unit change in the confidence in
education leads to decrease in tolerance to corruption by 0.063. Similar impact has the
question about the effect of hard work or luck in individual’s success. In other words, if
an individual believes that hard work brings success, his/her tolerance to corruption
decreases by 0.053. On the contrary, the question of income inequality and the role of
officials in decreasing inequality gap have positive correlation with the tolerance to
corruption. This indicates that individuals who rely more on individual efforts in
decreasing income gap tend to tolerate corruption more, comparing to those who think
that household income should be equal. However, the R square of the model is quite low
(0.026) and therefore the model is further improved by introducing the control
variables.
Further models (Model 2-5) take into consideration the demographics of the population
participated in the survey which helps to indicate if gender, age, education and social
class (subjective) have any effect on tolerance to corruption in a society. The
characteristics of population demographics are tested separately, and R square
indicates that the inclusion of all factors in the regression (Model 5) gives the best fit (R
square equals 0.050). The regression indicates that subjective perception of the social
class does not correlate with the tolerance to corruption as its coefficient (0.005) is not
significant in the regression. However, factors of the perceived social mobility
(confidence in education, believe that household’s income depends on individual’s effort
and hard work brings success) remain significant with coefficients -0.052, 0.025 and -
0.047 respectively. Moreover, other demographic factors, including gender, age, and
level of education obtained also show significance in the regression model. Looking at
the coefficients of the control variables it can be concluded, that obtaining higher level
28
of education leads to the decrease in tolerance to corruption by 0.041 points. Similarly,
with aging individuals tend to tolerate corruption among the officials less by 0.480
points. The coefficient of the gender is more difficult to perceive, as dummy variable (0-
male, 1-female) was adapted in the regression. However, from the regression results, it
can be concluded that women have lower tolerance to corruption comparing to men (β
coefficient 0.067).
The next step is to test whether perceived social mobility (including socio-
demographics characteristics) and social trust are correlated with the tolerance to
corruption in the society. The model shows a better fit as R square increases to 0.051.
The factors of the perceived social mobility still show strong correlation with the
tolerance to corruption. Moreover, the socio-demographic characteristics also have
strong correlation with the dependent variable (gender 0.067; Age -0.485; level of
education obtained -0.041). However, subjective perception of the social class does not
affect the tolerance to corruption as its coefficient (0.001) is insignificant in the model.
Social trust, included as a control variable in the regression,shows significance with
p<0.01with negative correlation to tolerance to corruption, i.e. with increase of 1 in
social trust the tolerance to corruption is decreased by -0.017.
Finally, the model includes general satisfaction with life as a control variable. In this
case the model shows the best fit of the data and the theoretical assumptions with R
square 0.055. The model indicates the negative significant correlation between the life
satisfaction and tolerance to corruption showing with the change in life satisfaction by 1
the tolerance to corruption decreases by 0.189 points. As for the main independent
variables measuring the perceived intergenerational social mobility, the confidence in
education is negatively correlated with the tolerance to corruption (coefficient -0.047),
which means that higher confidence in education leads to the decrease in tolerance of
corruption. Similarly, if an individual believe that hard work brings success in life,
his/her tolerance to corruption decreases by 0.030 points. On the other hand, if an
individual thinks that income equality can be achieved by personal efforts, it increases
tolerance to corruption by 0.041. Socio-demographic characteristics of an individual
hold significant coefficients for gender, age and highest level of education obtained
(0.064, -0.493 and -0.041 respectively). However, subjective measure of social class and
general trust in the society are not significant in the model.
29
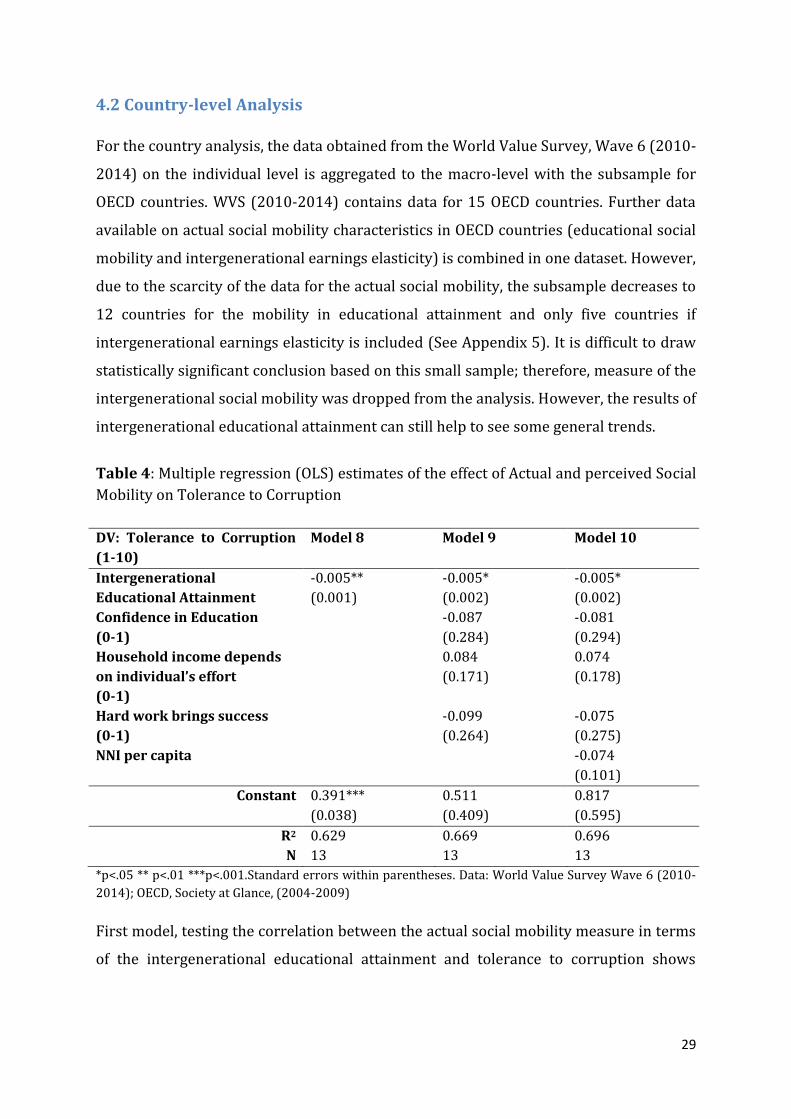
4.2 Country-level Analysis
For the country analysis, the data obtained from the World Value Survey, Wave 6 (2010-
2014) on the individual level is aggregated to the macro-level with the subsample for
OECD countries. WVS (2010-2014) contains data for 15 OECD countries. Further data
available on actual social mobility characteristics in OECD countries (educational social
mobility and intergenerational earnings elasticity) is combined in one dataset. However,
due to the scarcity of the data for the actual social mobility, the subsample decreases to
12 countries for the mobility in educational attainment and only five countries if
intergenerational earnings elasticity is included (See Appendix 5). It is difficult to draw
statistically significant conclusion based on this small sample; therefore, measure of the
intergenerational social mobility was dropped from the analysis. However, the results of
intergenerational educational attainment can still help to see some general trends.
Table 4: Multiple regression (OLS) estimates of the effect of Actual and perceived Social
Mobility on Tolerance to Corruption
DV: Tolerance to Corruption
(1-10)
Model 8 Model 9 Model 10
Intergenerational
Educational Attainment
-0.005**
(0.001)
-0.005*
(0.002)
-0.005*
(0.002)
Confidence in Education
(0-1)
-0.087
(0.284)
-0.081
(0.294)
Household income depends
on individual’s effort
(0-1)
0.084
(0.171)
0.074
(0.178)
Hard work brings success
(0-1)
-0.099
(0.264)
-0.075
(0.275)
NNI per capita -0.074
(0.101)
Constant 0.391***
(0.038)
0.511
(0.409)
0.817
(0.595)
R2 0.629 0.669 0.696
N 13 13 13
*p<.05 ** p<.01 ***p<.001.Standard errors within parentheses. Data: World Value Survey Wave 6 (2010-
2014); OECD, Society at Glance, (2004-2009)
First model, testing the correlation between the actual social mobility measure in terms
of the intergenerational educational attainment and tolerance to corruption shows
30
negative correlation with coefficient -0.005. In other words, lower social mobility leads
to higher tolerance of corruption.
Model 9 includes the characteristics of actual and perceived social mobility. The fit of
the data is better with R square 0.669. However, with the inclusion of perceived social
mobility, the intergenerational educational attainment become less significant
(significant when p<0.05) whereas factors of the perceived social mobility (confidence
in education, importance of individual’s efforts in household income and hard work)
become insignificant in the model.
Finally, Net National Income per capita (Log NNI) is included in the analysis. The model
shows, that only intergenerational social mobility has significant correlation with
tolerance to corruption whereas (-0.005), factors of the perceived social mobility and
NNI does not have significant effect on the tolerance to corruption in a society.
It still should be noted, that the obtained results cannot be considered as a conclusive
due to the scarcity of the data available both for the measurement of Perceived Social
Mobility (World Value Survey, Wave 6 2010-2014) and actual social mobility (OECD,
Society at Glance 2007) in the OECD countries.
4.3 Discussion of the Results
The regression analysis of the factors of perceived social mobility and tolerance to
corruption performed on the individual level for OECD countries indicates that two
indicators are correlated. Specifically, it can be concluded that both higher confidence in
education and believe that success depends on a personal effort but not luck leads to
lower tolerance to corruption in a society, whereas belief that income should be made
more equal (regardless the personal efforts) is positively correlated with the low
tolerance to corruption.
For further analysis socio-demographic characteristics of the individuals participated in
the survey were included in the analysis as control variables.In this case the coefficients
of perceived social mobility of all three factors (confidence in education, household’s
income depends on individual’s effort, and hard work brings success) decreased (-0.063
vs -0.052; 0.028 vs 0.025; -0.053 vs -0.047 respectively) which indicates that correlation
31
between the perceived social mobility and tolerance to corruption is also driven by the
personal socio-demographic characteristics, including gender, age, level of education
obtained and subjective attribution to a social class (Model 5). However, social status
(subjective) does not have significant correlation with tolerance to corruption. On the
other hand, model indicates that women are generally less tolerant to corruption;
moreover, older people are less tolerant to corruption than younger people; similar
effect has education, i.e. people with higher level of education are less tolerant to
corruption. Similar effect was indicated by Fischer (2009) that perceived social mobility
at an individual level analysis is captured by the socio-demographic characteristics or
personal history per se.
Introducing social trust to the regression does not change the coefficients of other
variables significantly (see Model 4), however indicates the importance of the control
variable in the analysis. In other words, if an individual generally trust people it
increases his/her tolerance to corruption by 0.017 points.
Nonetheless, including general satisfaction with life shows the best fit of the model with
r square 0.056 and, interestingly enough, this eliminates the significance of social trust
in the regression. Moreover, the coefficients of confidence of education and belief that
hard work brings success in life are decreased to -0.047 and -0.041 respectively,
whereas the question of income difference used as an incentive for individual effort
becomes stronger 0.030 indicating that individual’s satisfaction with life is one of the
most significant factors in addressing the question of the perceived social mobility and
tolerance to corruption. In other words, as it was previously argued in theory, the belief
of equality of opportunities offered in a society decreases class segregation and
therefore leads to higher trust to institutions and lower tolerance to corruption as a
result.
However, perceived social mobility does not always reflect the actual intergenerational
social mobility in a country as it is rather a measurement of beliefs and perceptions
rather than an indication of social and economic opportunities offered in a society. This
phenomenon may be related to the misconception and individual understanding of a
social mobility, a bright confidence in future life development whereas in reality, actual
mobility may not be that optimistic (Fischer, 2009). It is therefore the further analysis
32
exploiting the characteristics of actual social mobility (intergenerational educational
attainments and earning elasticity) was conducted on a macro level.
Macro-level analysis (Models 8-10) includes the characteristics of actual social mobility
(intergenerational education attainment) in the analysis eliminates the significant effect
of the perceived social mobility, indicating that in a countries with equal opportunities
in education offered to the students regardless their parents’ background show lower
tolerance to corruption. Introduction of the Net National Income per capita as a control
variable in macro-level analysis does not change the correlation coefficient of the
intergenerational educational attainment (-0.005) however it becomes significant only
with p<0.05. NNI per capita itself is not statistically significant in the regression, i.e.
does not have strong effect on tolerance to corruption under this model. Nevertheless
the number of observations (13 OECD countries) included in the analysis is too small to
draw any final statistical conclusion from the suggested models.
4.4 Limitations
It is important to point out limitations of this paper that may have effect the results of
the study. This study aimed to investigate the correlation between intergenerational
social mobility and tolerance to corruption. As previously discussed in the paper, the
existing literature differentiates between the perceived and actual intergenerational
social mobility. Throughout the process of collecting data for this research a number of
obstacles occurred which limited significantly the scope of the study. Specifically, the
data on the actual social mobility in the OECD countries is quite limited and was
collected from different sources (Fischer, 2009; D’Addio, 2007; Bjørnskov, 2013).It is
important to note that organized and comprehensive on the intergenerational social
mobility is available only for the OECD countries. The aspect of scarcity of the data was
pointed out in the results discussion (See Section 4.3) and it was emphasized that no
final conclusion can be drawn for the macro-level analysis exploiting the available data
on the actual social mobility. Further research would benefit from a larger sample of
countries included in the study and will allow to perform a stronger analysis of the
correlation.

33
Another limitation in methodology of this research is use of cross-section data which
does not allow seeing the variations in correlation over time, for example comparing to
the panel data (Vaus, 2010). On the other hand, intergenerational social mobility
involves the comparison of at least two generations in a family (farther/son pair).
However there is no data available in order to trace the effect of parental views and
believes in perceived social mobility and tolerance to corruption on their children.
Future research may benefit from applying case study analysis or multi-level regression
analysis when working on the aspect of social mobility and tolerance to corruption.
5. Conclusion
This study was developed in order to identify the role of the intergenerational social
mobility in tolerance to corruption with the focus on OECD countries. Intergenerational
social mobility was previously thoroughly researched in connection with the country’s
economic welfare whereas the connection with tolerance to corruption is inconclusive
in the social field studies. On the other hand, the discussion of corruption in the context
of quality of government often refers to the impartiality of institutions and equality of
opportunities offered to an individual in a country as a prerequisite to development.
Therefore this researched aimed to bridge two fields of discussion and sought to answer
the following questions:
Does intergenerational social mobility affect the tolerance to corruption in the
OECD countries?
What is the tolerance to corruption effects of the intergenerational social
mobility in the OECD countries?
Throughout the study two measurement of intergenerational social mobility accepted
by the scholars were defined – perceived and actual social mobility. Perceived social
mobility captures the confidence in education and belief that poverty can be escaped by
individual’s efforts, whereas actual social mobility is a measurement of improvement in
educational attainment and earning elasticity with regard to parents’ achievements.
Hence this study adapted both definitions and merged together data sources available
on perceived social mobility (World Values Survey) and actual social mobility (OECD,
Society at Glance), introducing other control variables, like socio-demographic
34
characteristics, general satisfaction with life, trust in society, and economic factors (NNI
per capita).
The main empirical findings were summarized in the results discussion (See Section
4.3) and indicated that intergenerational social mobility has negative effect on the
tolerance to corruption in OECD countries. In other words if an individual perceive the
society he/she living in as a mobile, he/she tend to tolerate corruption on a lesser
degree. The results of the study hold significant when controlling for socio-demographic
factors, social trust and general satisfaction with life. Moreover, as this study exploited
pooled data from 15 OECD countries, the analysis also included statistical control for
avoiding clustering of the results.
The results obtained on micro (individual) level analysis support the theoretical
assumption that more mobile societies tend to tolerate corruption on a much lesser
degree comparing to the immobile societies. Macro-level analysis also support this
assumption, however, as the phenomenon of the actual social mobility is quite difficult
to capture due to the scarcity of the data available, it is cannot be treated as a conclusive
statement.
This study offered initial steps in analyzing the theoretical assumption that tolerance to
corruption may be correlated with how mobile a society is. It connected two broad
social fields of researches – corruption (as a part of quality of government) and social
mobility which is exploited more often in the studies of economic growth and welfare.
On the other hand, answers to the research question allow assessing socio-economic
factors that have direct impact on tolerance to corruption in a society and therefore can
further help in drawing policy recommendations of controlling corruption in a country.
The analysis also helps to evaluate more thoroughly these concepts in connection with
the characteristics of society in the modern world including benefits on the individual
level. Moreover this research contributes to the understanding why some countries
succeeded in maintaining high quality of governance with low level of corruption
whereas others trapped with dysfunctional political institutions.
As it was argued earlier in this research, corruption is a “hierarchical phenomenon” and
in immobile societies it is a direct way of establishing order and structure as a
35
coordination mechanism. Hence, higher social class fractionalization in a country
diminishes the system of controls in a society and risk to increase of corruption in the
long term.
36
References:
Alesina, A., Di Tella, R., MacCulloch, R. (2004). Inequality and happiness: are Europeans
and Americans different? Journal of Public Economics. Vol. 88, pp. 2009-2042.
Alesina, A., Glaeser, E., Sacerdote. B. (2001). Why doesn’t the US have European-Style
Welfare State? Harvard Institute of Economic Research Working Paper 1933.
Bac, M. (1996). Corruption, Supervision, and the Structure of Hierarchies. Journal of Law,
Economics, & Organization, 12(2): 277-298.
Breen, R. (1997). Inequality, Economic Growth and Social Mobility. The British Journal of
Sociology, 48(3): 429-449.
Bjørnskov, C., Dreher, A., Fischer, J., Schnellenbach, J., Gehring, K. (2013). Inequality and
happiness: When perceived social mobility and economic reality do not match. Journal
of Economic Behavior and Organization. 91 (2013) 75-92.
Corak, M. (2006). Do poor children become poor adults? Lessons from a cross country
comparison of generational earnings mobility. IZA Discussion Paper No. 1993.
Corak, M. (2013). Inequality from Generation to Generation: The United States in
Comparison. In Robert S. Rycroft (Ed.), The Economics of Inequality, Poverty, and
Discrimination in the 21st Century. Santa Barbara, CA: ABC- CLIO.
Corak, M. (2013). Income Inequality, Equality of Opportunities, and Intergenerational
Mobility. The Journal of Economic Perspectives, Vol. 27, No.3, 2013, pp. 79-102.
D’Addio, A.C. (2007). Intergenerational Transmission of Disadvantage: Mobility or
Immobility across Generations? A Review of the Evidence for OECD Countries. OECD
Social, Employment and Migration Working Papers No. 52, 2007.
Eurobarometer. (2009). Attitudes of Europeans towards Corruption. Summary report
2009. Retrieved from
http://ec.europa.eu/public_opinion/archives/ebs/ebs_325_sum_en.pdf.
37
Field, A. (2013). Discovering Statistics Using IBM SPSS Statistics. 4th ed. London: Sage
Publications Ltd.
Fischer, J. (2009). The Welfare Effects of Social Mobility: An Analysis for OECD countries.
Munich Personal RePEc Archive. Retrieved from http://mpra.ub.uni-
muenchen.de/id/eprint/17070.
Gatti, R.; Paternostro, S.; Rigolini, J. (2003). Individual Attitudes Toward Corruption: Do
Social Effects Matter? World Bank, Washington, DC. Retrieved from:
https://openknowledge.worldbank.org/handle/10986/18137
Hopkins, E., 2008. Inequality, happiness and relative concerns: what actually is their
relationship? Journal of Economic Inequality Vol. 6, pp. 351–372.
Kaufmann, D., Kraay, A. & Mastruzzi, M. (2007). Growth and governance: A reply.
Journal of Politics. 69(2) pp. 555–562.
Keller, T. and Sik, E. (2009). The Perception, The Tolerance, and The Practice of
Corruption. Tarki European Social Report 2009.
Ko, K., Cho, S.Y. and Lee, J. (2012) The Trend of the Tolerance of Gray Corruption and Its
Determinants: Citizens’ Perception in Korea. International Public Management Network.
Retrieved from:www.ipmn.net/index.php/archives/.../154-ipmn-2012mskoetalpdf
Kolankiewicz, G. (1997). Social Capital and Social Change. The British Journal of
Sociology, 47(3): 427-441.
Korpi, W. (2006). Power Resources and Employer-Centered Approaches in Explanations
of Welfare States and Varietiesof Capitalism: Protagonists, Consenters, and Antagonists.
World Politics, Vol. 58, No. 2, 2006, pp. 167-206.
Kurtz, M.J. & Schrank, A. (2007). Growth and governance: Models, measures and
mechanisms. Journal of Politics. Vol. 69, pp. 538–554.
Morris, S.D. and Klesner, J.L. (2010). Corruption and Trust: Theoretical Consideration
and Evidence from Mexico. Comparative Political Studies 43(10), pp. 1258 – 1285.

38
Mungiu-Pippidi, A. (2006). Corruption: Diagnosis and Treatment. Journal of Democracy
17, No. 3: 86-99.
OECD (2014). Education at a Glance 2014: OECD Indicators, OECD Publishing. Retrieved
from: http://dx.doi.org/10.1787/eag-2014-en
OECD (2010). A Family Affair: Intergenerational Social Mobility across OECD Countries
In OECD (2010) Economic Policy Reform: Going for Growth (pp.183-200). DOI:
10.1787/growth-2010-en
OECD (2009). Society at Glance: OECD Social Indicators 2009.OECD: Paris
OECD (2007). Society at Glance: OECD Social Indicators 2006, OECD: Paris
OECD (2004). Learning for Tomorrow’s World: First Results from PISA 2003. OECD: Paris.
Olson, M. (1993). Dictatorship, Democracy, and Development. American Political Science
Review. 87(3): 567-576.
Orsetta, C. and Johansson, Å. (2010). Intergenerational Social Mobility in OECD
Countries. OECD Journal: Economic Studies, Vol. 2010/1.
Orsetta. C., Dantan, S. and Johansson, A. (2009). Intergenerational Social Mobility in
European OECD Countries. OECD Economics Department Working Papers, No. 709, OECD
Publishing.
Pearce, N. (2011). Beyond Social Mobility. Public Policy Research. 18(1): 3-9.
Roemer, J. (2002). Equality of opportunity: A progress report. Social Choice and Welfare
No.19: 455–471.
Rothstein, B. (2011). The Quality of Government. Corruption, Social Trust and Inequality
in International Perspective. Chicago: University of Chicago.
Rothstein, B. and Jan Teorell, J. (2008). What is Quality of Government: A Theory of
Impartial Political Institutions. Governance-an International Journal of Policy and
Administration 21:165-190.
39
Saunders, M., Lewis, P. and Thornhill, A. (2009). Research Methods for Business Students
(5th ed.). Essex: Pearson Education Limited
Svendsen G.L. and Svendsen, G.T. (2003). On the Wealth of Nations: Bourdieuconomics
and Social Capital. Theory and Society. 32 (5-6): 607-631.
Vaus, D. (2010). Research Design in Social Research. London: Sage.
Widmalm , S. (2008). Decentralization, Corruption and Social Capital: From India to the
West. Thousand Oaks, CA: Sage
You, J.S. and Sanjeev, K. (2005). A Comparative Study of Inequality and Corruption.
American Sociological Review, 2005, Vol. 70:136–157.
WORLD VALUES SURVEY Wave 6 2010-2014 OFFICIAL AGGREGATE v.20140429.
World Values Survey Association (www.worldvaluessurvey.org). Aggregate File
Producer: Asep/JDS, Madrid SPAIN.
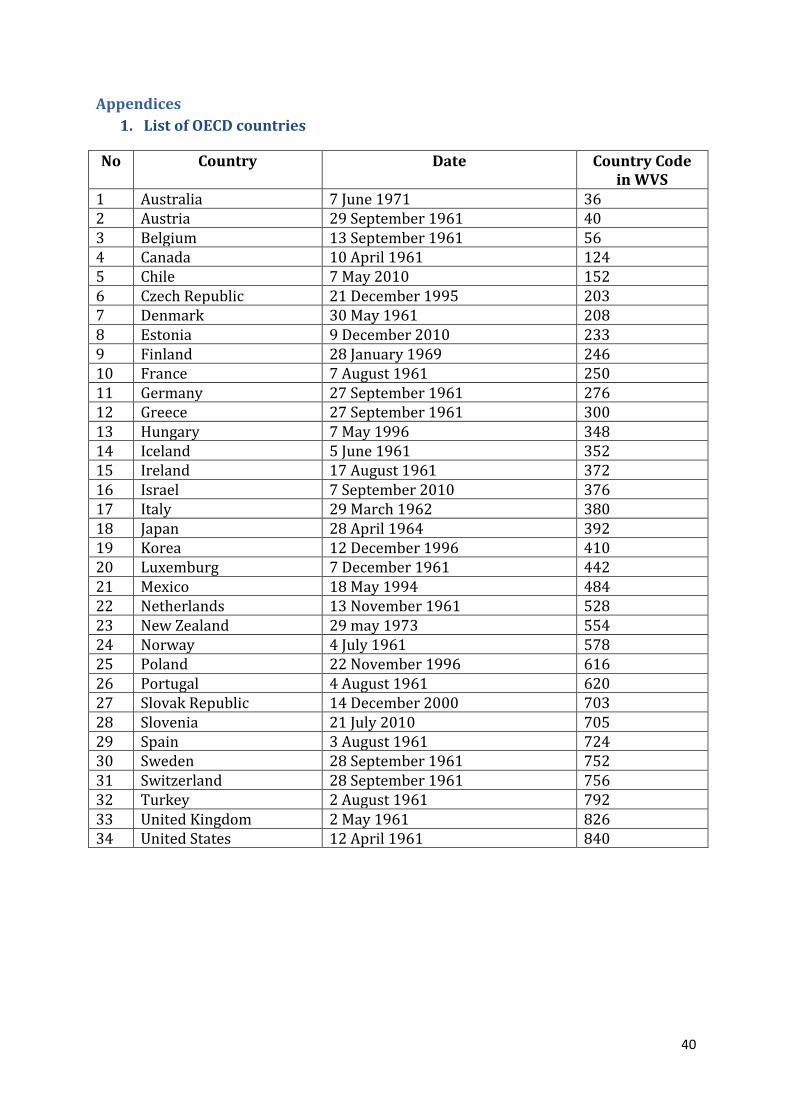
40
Appendices
1. List of OECD countries
No Country Date Country Code in WVS
1 Australia 7 June 1971 36 2 Austria 29 September 1961 40 3 Belgium 13 September 1961 56 4 Canada 10 April 1961 124 5 Chile 7 May 2010 152 6 Czech Republic 21 December 1995 203 7 Denmark 30 May 1961 208 8 Estonia 9 December 2010 233 9 Finland 28 January 1969 246 10 France 7 August 1961 250 11 Germany 27 September 1961 276 12 Greece 27 September 1961 300 13 Hungary 7 May 1996 348 14 Iceland 5 June 1961 352 15 Ireland 17 August 1961 372 16 Israel 7 September 2010 376 17 Italy 29 March 1962 380 18 Japan 28 April 1964 392 19 Korea 12 December 1996 410 20 Luxemburg 7 December 1961 442 21 Mexico 18 May 1994 484 22 Netherlands 13 November 1961 528 23 New Zealand 29 may 1973 554 24 Norway 4 July 1961 578 25 Poland 22 November 1996 616 26 Portugal 4 August 1961 620 27 Slovak Republic 14 December 2000 703 28 Slovenia 21 July 2010 705 29 Spain 3 August 1961 724 30 Sweden 28 September 1961 752 31 Switzerland 28 September 1961 756 32 Turkey 2 August 1961 792 33 United Kingdom 2 May 1961 826 34 United States 12 April 1961 840
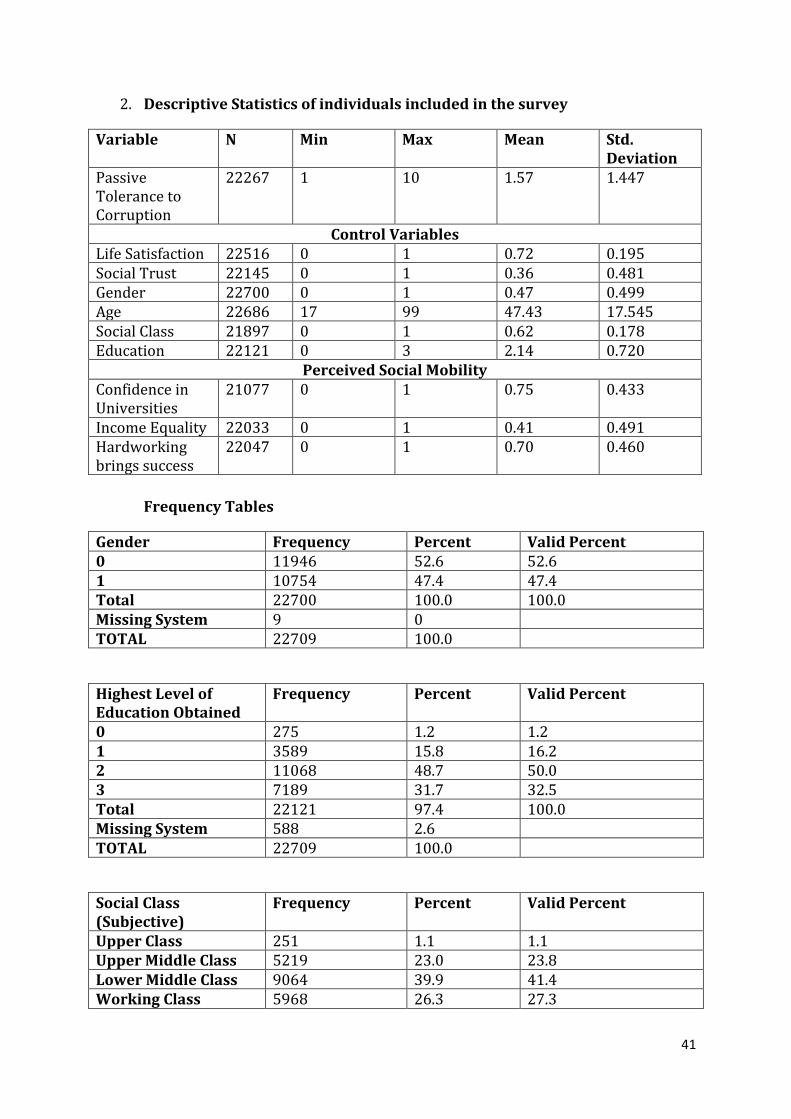
41
2. Descriptive Statistics of individuals included in the survey
Variable N Min Max Mean Std. Deviation
Passive Tolerance to Corruption
22267 1 10 1.57 1.447
Control Variables Life Satisfaction 22516 0 1 0.72 0.195 Social Trust 22145 0 1 0.36 0.481 Gender 22700 0 1 0.47 0.499 Age 22686 17 99 47.43 17.545 Social Class 21897 0 1 0.62 0.178 Education 22121 0 3 2.14 0.720
Perceived Social Mobility Confidence in Universities
21077 0 1 0.75 0.433
Income Equality 22033 0 1 0.41 0.491 Hardworking brings success
22047 0 1 0.70 0.460
Frequency Tables
Gender Frequency Percent Valid Percent 0 11946 52.6 52.6 1 10754 47.4 47.4 Total 22700 100.0 100.0 Missing System 9 0 TOTAL 22709 100.0
Highest Level of Education Obtained
Frequency Percent Valid Percent
0 275 1.2 1.2 1 3589 15.8 16.2 2 11068 48.7 50.0 3 7189 31.7 32.5 Total 22121 97.4 100.0 Missing System 588 2.6 TOTAL 22709 100.0
Social Class (Subjective)
Frequency Percent Valid Percent
Upper Class 251 1.1 1.1 Upper Middle Class 5219 23.0 23.8 Lower Middle Class 9064 39.9 41.4 Working Class 5968 26.3 27.3
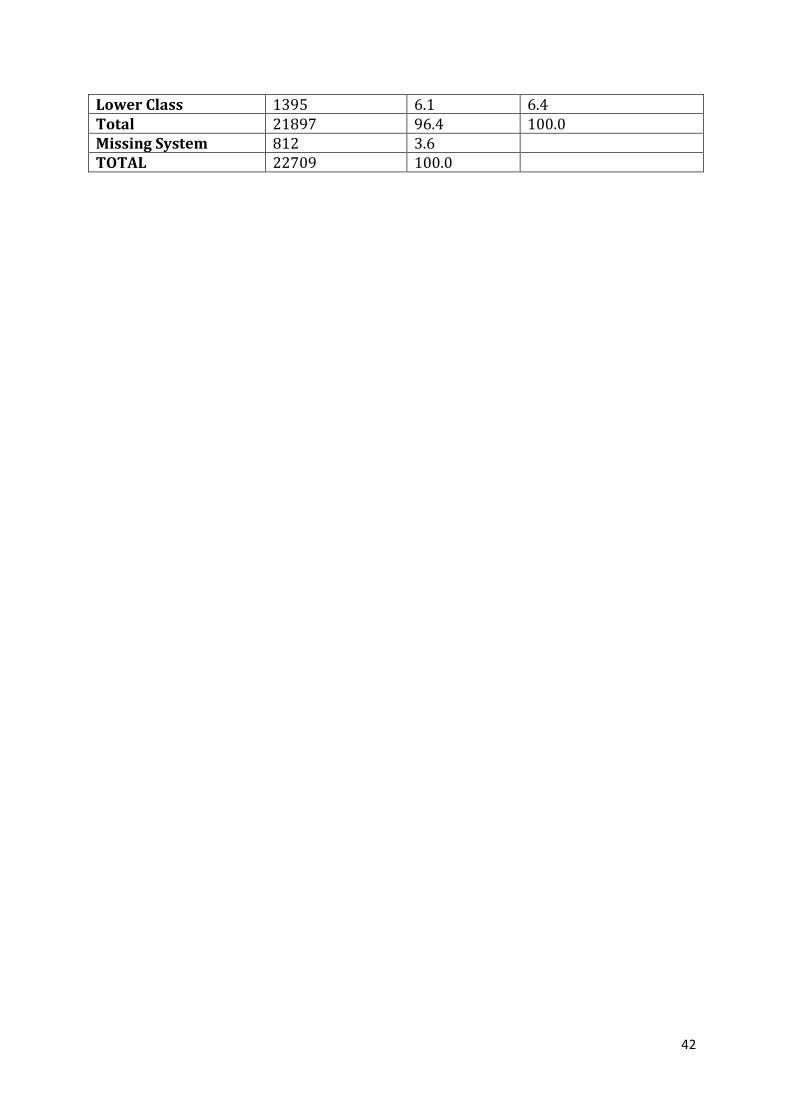
42
Lower Class 1395 6.1 6.4 Total 21897 96.4 100.0 Missing System 812 3.6 TOTAL 22709 100.0
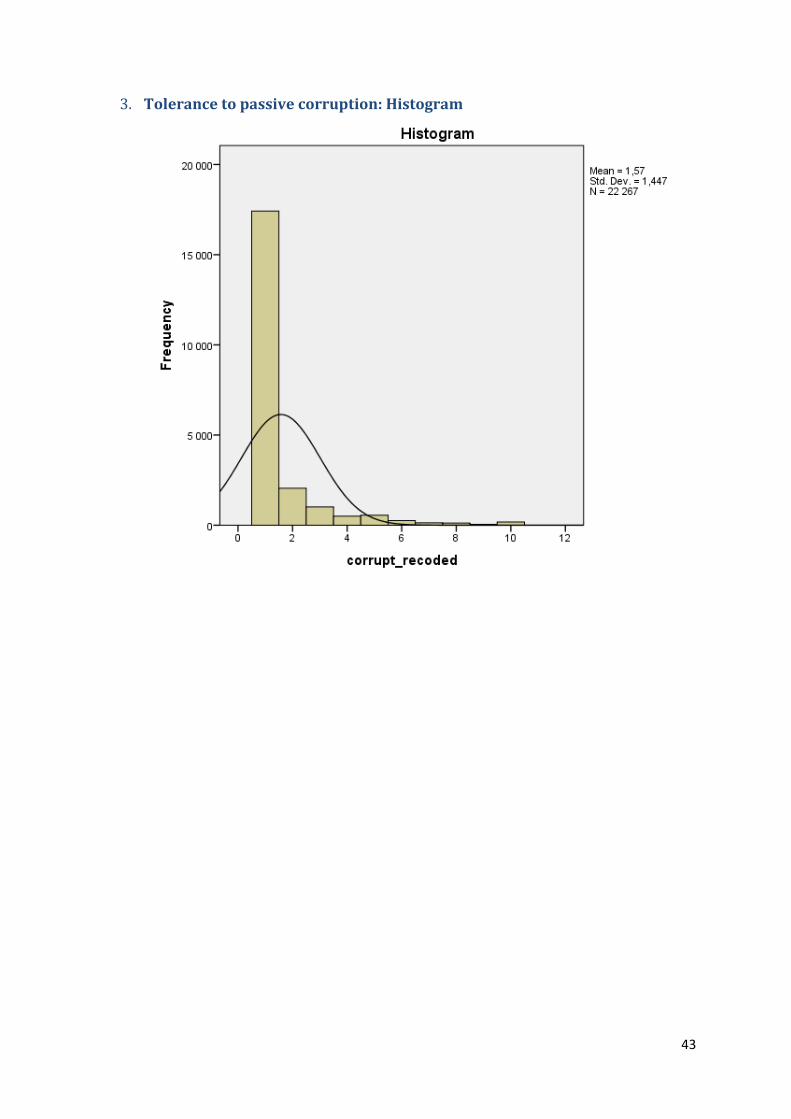
43
3. Tolerance to passive corruption: Histogram
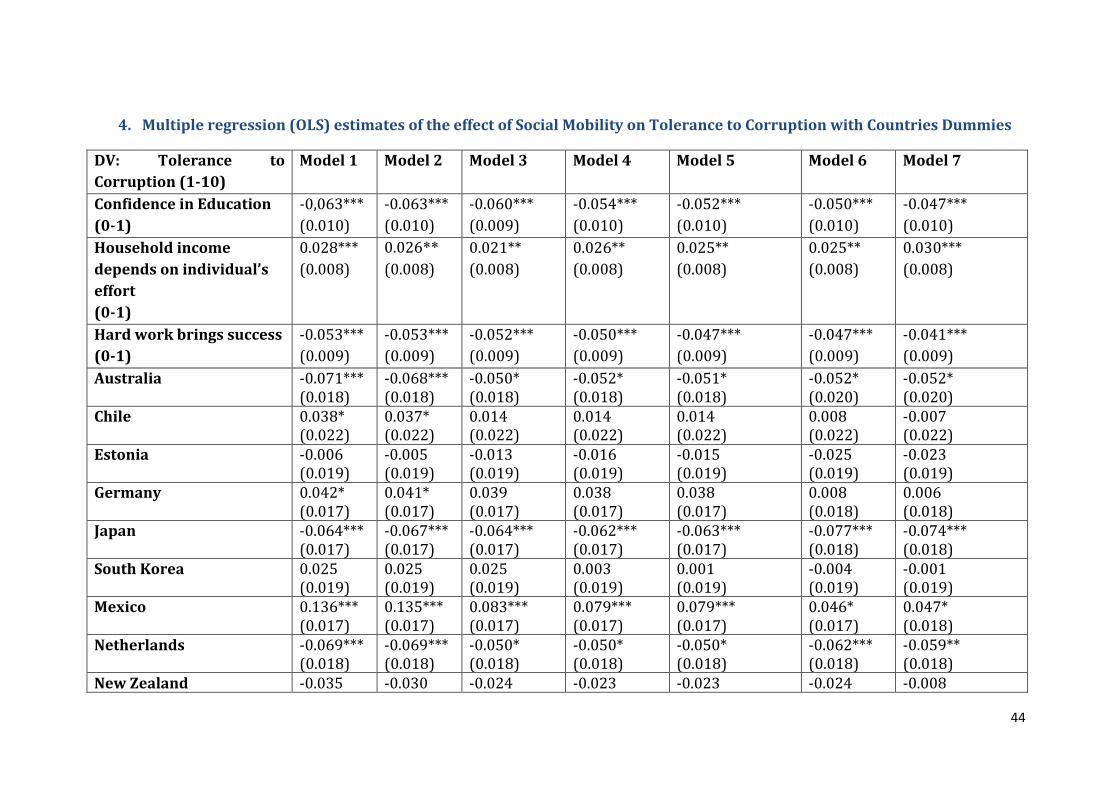
44
4. Multiple regression (OLS) estimates of the effect of Social Mobility on Tolerance to Corruption with Countries Dummies
DV: Tolerance to
Corruption (1-10)
Model 1 Model 2 Model 3 Model 4 Model 5 Model 6 Model 7
Confidence in Education
(0-1)
-0,063***
(0.010)
-0.063***
(0.010)
-0.060***
(0.009)
-0.044***
(0.010)
-0.042***
(0.010)
-0.040***
(0.010)
-0.047***
(0.010)
Household income
depends on individual’s
effort
(0-1)
0.028***
(0.008)
0.026**
(0.008)
0.021**
(0.008)
0.026**
(0.008)
0.024**
(0.008)
0.024**
(0.008)
0.030***
(0.008)
Hard work brings success
(0-1)
-0.053***
(0.009)
-0.043***
(0.009)
-0.042***
(0.009)
-0.040***
(0.009)
-0.047***
(0.009)
-0.047***
(0.009)
-0.041***
(0.009)
Australia -0.071*** (0.018)
-0.068*** (0.018)
-0.050* (0.018)
-0.052* (0.018)
-0.051* (0.018)
-0.052* (0.020)
-0.052* (0.020)
Chile 0.038* (0.022)
0.037* (0.022)
0.014 (0.022)
0.014 (0.022)
0.014 (0.022)
0.008 (0.022)
-0.007 (0.022)
Estonia -0.006 (0.019)
-0.005 (0.019)
-0.013 (0.019)
-0.016 (0.019)
-0.015 (0.019)
-0.025 (0.019)
-0.023 (0.019)
Germany 0.042* (0.017)
0.041* (0.017)
0.039 (0.017)
0.038 (0.017)
0.038 (0.017)
0.008 (0.018)
0.006 (0.018)
Japan -0.064*** (0.017)
-0.067*** (0.017)
-0.064*** (0.017)
-0.062*** (0.017)
-0.063*** (0.017)
-0.077*** (0.018)
-0.074*** (0.018)
South Korea 0.025 (0.019)
0.025 (0.019)
0.025 (0.019)
0.003 (0.019)
0.001 (0.019)
-0.004 (0.019)
-0.001 (0.019)
Mexico 0.136*** (0.017)
0.135*** (0.017)
0.083*** (0.017)
0.079*** (0.017)
0.079*** (0.017)
0.046* (0.017)
0.047* (0.018)
Netherlands -0.069*** (0.018)
-0.069*** (0.018)
-0.050* (0.018)
-0.050* (0.018)
-0.050* (0.018)
-0.062*** (0.018)
-0.059** (0.018)
New Zealand -0.035 -0.030 -0.024 -0.023 -0.023 -0.024 -0.008

45
(0.024) (0.024) (0.023) (0.023) (0.023) (0.024) (0.025) Poland -0.070**
(0.023) -0.069** (0.023)
-0.079*** (0.022)
-0.081*** (0.022)
-0.081*** (0.022)
-0.102*** (0.023)
-0.095*** (0.023)
Slovenia -0.083*** (0.021)
-0.080*** (0.021)
-0.086*** (0.021)
-0.086*** (0.021)
-0.086*** (0.021)
-0.101*** (0.021)
-0.098*** (0.022)
Spain -0.058** (0.020)
-0.058* (0.020)
-0.072*** (0.020)
-0.074*** (0.020)
-0.073*** (0.020)
-0.111*** (0.021)
-0.109*** (0.021)
Sweden 0.123*** (0.020)
0.124*** (0.20)
0.118*** (0.020)
0.111*** (0.020)
0.113*** (0.020)
0.103*** (0.020)
0.102*** (0.020)
Turkey -0.148*** (0.018)
-0.149*** (0.018)
-0.197*** (0.018)
-0.197*** (0.018)
-0.198*** (0.018)
-0.234*** (0.019)
-0.234*** (0.019)
Gender
(0-1)
0.066***
(0.008)
0.066***
(0.007)
0.068***
(0.008)
0.067***
(0.008)
0.067***
(0.008)
0.064***
(0.008)
Age
(17-99)
-0.441***
(0.022)
-0.474***
(0.023)
-0.480***
(0.023)
-0.484***
(0.024)
-0.493***
(0.024)
Level of education
obtained (0-3)
-0.040***
(0.006)
-0.041***
(0.006)
-0.041***
(0.006)
-0.041***
(0.006)
Social Class (Subjective)
(0-1)
0.004
(0.024)
-0.001
(0.024)
-0.039
(0.024)
Social Trust (0-1) -0.017**
(0.009)
-0.009
(0.009)
Satisfaction with life (0-1) -0.189***
(0.022)
Constant 0.342***
(0.016)
0.312***
(0.016)
1.044**
(0.040)
1.196***
(0.047)
1.198***
(0.042)
1.212***
(0.043)
1.379***
(0.056)
R2 0.026 0.030 0.049 0.041 0.040 0.041 0.044
N 20261 20255 20248 19757 19279 18938 18872
*p<.05 ** p<.01 ***p<.001.Standard errors within parentheses. Data: World Value Survey, Wave 6 (2010-2014)
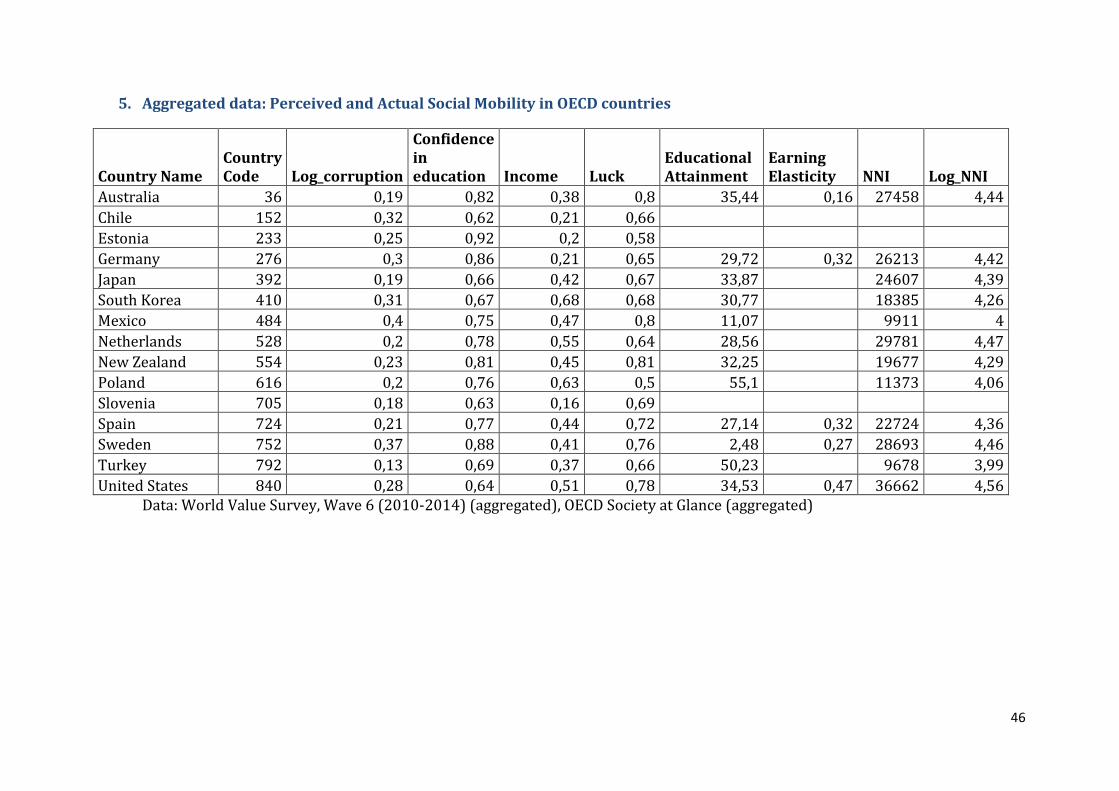
46
5. Aggregated data: Perceived and Actual Social Mobility in OECD countries
Country Name Country Code Log_corruption
Confidence in education Income Luck
Educational Attainment
Earning Elasticity NNI Log_NNI
Australia 36 0,19 0,82 0,38 0,8 35,44 0,16 27458 4,44
Chile 152 0,32 0,62 0,21 0,66 Estonia 233 0,25 0,92 0,2 0,58 Germany 276 0,3 0,86 0,21 0,65 29,72 0,32 26213 4,42
Japan 392 0,19 0,66 0,42 0,67 33,87
24607 4,39
South Korea 410 0,31 0,67 0,68 0,68 30,77
18385 4,26
Mexico 484 0,4 0,75 0,47 0,8 11,07
9911 4
Netherlands 528 0,2 0,78 0,55 0,64 28,56
29781 4,47
New Zealand 554 0,23 0,81 0,45 0,81 32,25
19677 4,29
Poland 616 0,2 0,76 0,63 0,5 55,1
11373 4,06
Slovenia 705 0,18 0,63 0,16 0,69 Spain 724 0,21 0,77 0,44 0,72 27,14 0,32 22724 4,36
Sweden 752 0,37 0,88 0,41 0,76 2,48 0,27 28693 4,46
Turkey 792 0,13 0,69 0,37 0,66 50,23
9678 3,99
United States 840 0,28 0,64 0,51 0,78 34,53 0,47 36662 4,56 Data: World Value Survey, Wave 6 (2010-2014) (aggregated), OECD Society at Glance (aggregated)

47
6. Students Performance in Mathematics (PISA 2003 Score) in Connection with Highest Level of Education Obtained by Fathers
Country
Fathers with completed primary or lower secondary education
Fathers with completed upper secondary education
Fathers with completed tertiary education
Percentage of students
S.E.
Performance
Percentage of students
S.E.
Performance
Percentage of students
S.E.
Performance
Mathematics scale
Mathematics scale
Mathematics scale
Mean score
S.E. Mean score
S.E. Mean score
S.E.
OECD Countries
Australia 23,8 (0,6) 505 (3,3) 34,4 (0,5) 516 (2,1) 41,8 (0,8) 551 (2,8)
Austria 10,9 (0,7) 471 (5,9) 50,8 (1,1) 511 (3,9) 38,3 (1,0) 517 (3,9) Belgium 14,9 (0,5) 502 (4,4) 38,7 (0,8) 536 (2,5) 46,4 (0,9) 565 (2,9) Canada 11,9 (0,4) 511 (2,7) 39,1 (0,6) 529 (1,7) 49,0 (0,8) 552 (2,2) Czech Republic 3,3 (0,3) 465 (11,5) 76,5 (0,8) 513 (3,0) 20,2 (0,8) 575 (4,8) Denmark 18,6 (1,0) 486 (4,1) 43,2 (0,9) 508 (2,9) 38,2 (1,2) 549 (3,5) Finland 21,9 (0,6) 525 (3,0) 27,1 (0,7) 538 (2,8) 51,0 (0,9) 560 (2,2) France 28,8 (1,0) 489 (4,6) 40,5 (1,1) 520 (2,5) 30,7 (1,2) 539 (3,7) Germany 19,2 (0,9) 454 (5,4) 44,5 (0,9) 520 (3,8) 36,3 (0,9) 549 (3,8) Greece 32,8 (1,5) 419 (3,8) 34,4 (0,9) 450 (3,7) 32,9 (1,6) 466 (5,8) Hungary 9,2 (0,6) 425 (6,5) 67,8 (1,0) 482 (2,8) 23,0 (1,0) 546 (4,8) Iceland 20,1 (0,6) 497 (3,8) 50,3 (1,0) 514 (2,3) 29,6 (0,9) 534 (2,9) Ireland 31,4 (0,9) 482 (3,2) 40,4 (0,9) 507 (2,8) 28,3 (1,1) 531 (3,8) Italy 40,9 (0,9) 442 (3,6) 33,6 (0,6) 485 (3,4) 25,5 (0,8) 482 (3,8) Japan 16,4 (0,9) 492 (7,0) 37,3 (0,9) 524 (4,4) 46,3 (1,0) 558 (4,8) Korea 23,6 (0,8) 506 (4,0) 40,7 (1,1) 541 (3,1) 35,7 (1,3) 572 (5,6)
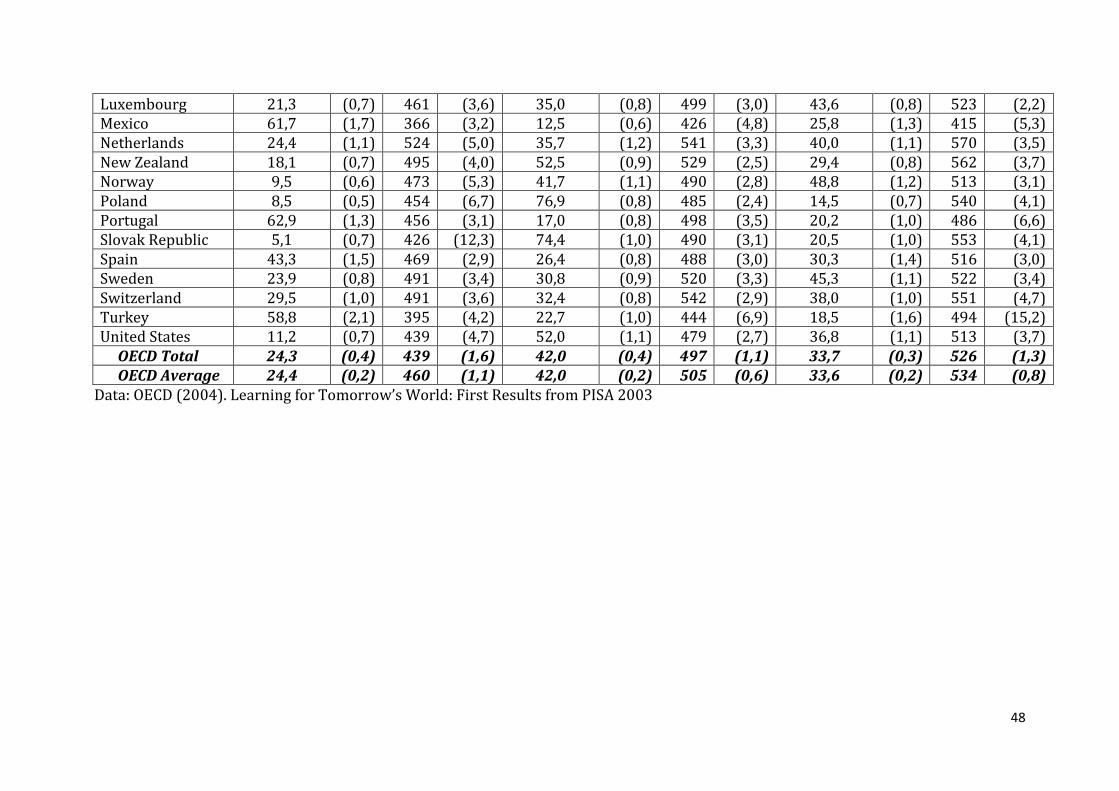
48
Luxembourg 21,3 (0,7) 461 (3,6) 35,0 (0,8) 499 (3,0) 43,6 (0,8) 523 (2,2) Mexico 61,7 (1,7) 366 (3,2) 12,5 (0,6) 426 (4,8) 25,8 (1,3) 415 (5,3) Netherlands 24,4 (1,1) 524 (5,0) 35,7 (1,2) 541 (3,3) 40,0 (1,1) 570 (3,5) New Zealand 18,1 (0,7) 495 (4,0) 52,5 (0,9) 529 (2,5) 29,4 (0,8) 562 (3,7) Norway 9,5 (0,6) 473 (5,3) 41,7 (1,1) 490 (2,8) 48,8 (1,2) 513 (3,1) Poland 8,5 (0,5) 454 (6,7) 76,9 (0,8) 485 (2,4) 14,5 (0,7) 540 (4,1) Portugal 62,9 (1,3) 456 (3,1) 17,0 (0,8) 498 (3,5) 20,2 (1,0) 486 (6,6) Slovak Republic 5,1 (0,7) 426 (12,3) 74,4 (1,0) 490 (3,1) 20,5 (1,0) 553 (4,1) Spain 43,3 (1,5) 469 (2,9) 26,4 (0,8) 488 (3,0) 30,3 (1,4) 516 (3,0) Sweden 23,9 (0,8) 491 (3,4) 30,8 (0,9) 520 (3,3) 45,3 (1,1) 522 (3,4) Switzerland 29,5 (1,0) 491 (3,6) 32,4 (0,8) 542 (2,9) 38,0 (1,0) 551 (4,7) Turkey 58,8 (2,1) 395 (4,2) 22,7 (1,0) 444 (6,9) 18,5 (1,6) 494 (15,2) United States 11,2 (0,7) 439 (4,7) 52,0 (1,1) 479 (2,7) 36,8 (1,1) 513 (3,7) OECD Total 24,3 (0,4) 439 (1,6) 42,0 (0,4) 497 (1,1) 33,7 (0,3) 526 (1,3) OECD Average 24,4 (0,2) 460 (1,1) 42,0 (0,2) 505 (0,6) 33,6 (0,2) 534 (0,8)
Data: OECD (2004). Learning for Tomorrow’s World: First Results from PISA 2003
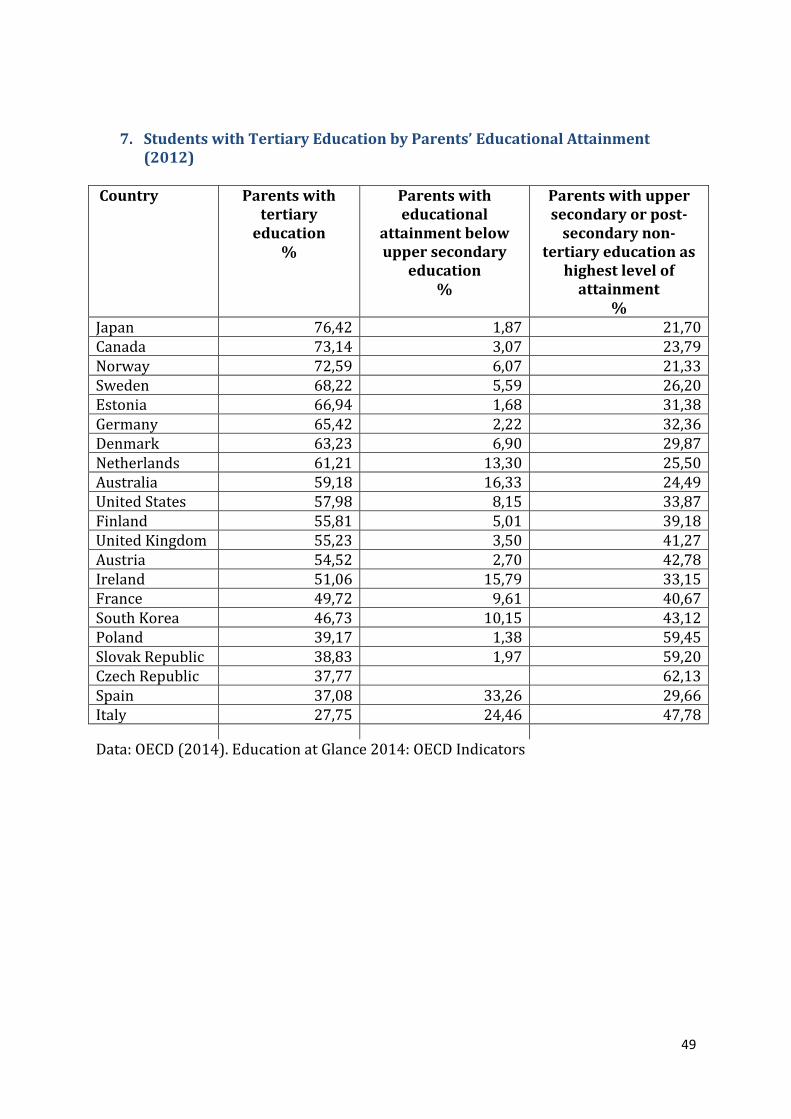
49
7. Students with Tertiary Education by Parents’ Educational Attainment (2012)
Country Parents with tertiary
education %
Parents with educational
attainment below upper secondary
education %
Parents with upper secondary or post-
secondary non-tertiary education as
highest level of attainment
% Japan 76,42 1,87 21,70 Canada 73,14 3,07 23,79 Norway 72,59 6,07 21,33 Sweden 68,22 5,59 26,20 Estonia 66,94 1,68 31,38 Germany 65,42 2,22 32,36 Denmark 63,23 6,90 29,87 Netherlands 61,21 13,30 25,50 Australia 59,18 16,33 24,49 United States 57,98 8,15 33,87 Finland 55,81 5,01 39,18 United Kingdom 55,23 3,50 41,27 Austria 54,52 2,70 42,78 Ireland 51,06 15,79 33,15 France 49,72 9,61 40,67 South Korea 46,73 10,15 43,12 Poland 39,17 1,38 59,45 Slovak Republic 38,83 1,97 59,20 Czech Republic 37,77 62,13 Spain 37,08 33,26 29,66 Italy 27,75 24,46 47,78 Data: OECD (2014). Education at Glance 2014: OECD Indicators


