The EVLA and SKA pathfinder surveys
Jim CondonNRAO, Charlottesville

The EVLA recycles VLA infrastructure• The VLA is a 1960’s
design• 27 x 25-meter VLA
parabaloids – Off-axis Cassegrain
optics for > 1 GHz • Many km of railroad
tracks:– 4 scaled arrays, 1‒ 36
km– Selectable resolution
and brightness sensitivity
– Good imaging with nearly natural weighting
– Multiwavelength spectra at constant angular resolution
Leiden 2011 Feb 24

The EVLA recycles VLA infrastructure• VLA was designed in the
1960’s
• Advantages:– Already exists and
paid for! – Works well 1 to 50 GHz– Sensitive and flexible
• Disadvantages:– Small field of view– Many competing users
Leiden 2011 Feb 24

What’s new? 1. Receivers and feeds for continuous coverage from 1 to 50 GHzBand
(GHz)
Tsys/(best weather)
1-2 L 60 -- 80
2-4 S 55 -- 70
4-8 C 45 -- 60
8-12 X 45
12-18 Ku 50
18-26.5 K 70 -- 80
26.5-40 Ka 90 -- 130
40-50 Q 160 - 360
L
K
QKa
XC
S
Ku
FeedHeaters

What’s new? 2. The ‘WIDAR’ correlator
• The key element of the EVLA is its `WIDAR’ correlator – a 10 petaflop computer
• Major capabilities:– 8 GHz/polarization maximum instantaneous bandwidth– Spectral dynamic range up to 58 dB– Extensive special modes– 64 independently tunable full polarization ‘spectral
windows’, each of which effectively forms an independent ‘sub-correlator’
Leiden 2011 Feb 24
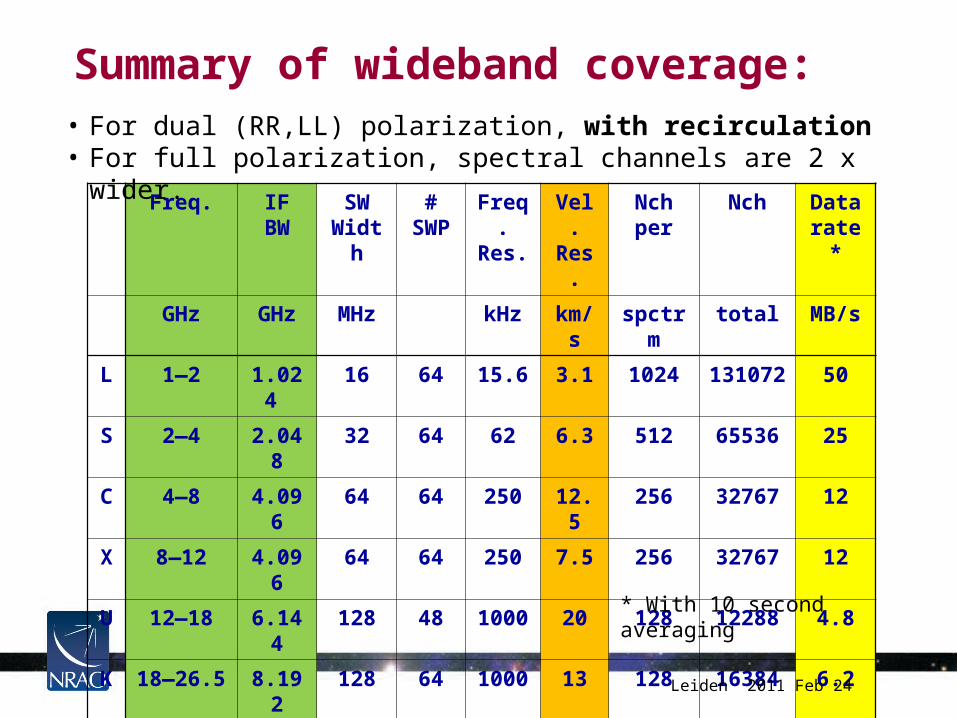
Summary of wideband coverage:
Freq. IF BW SW Width
# SWP
Freq. Res.
Vel. Res.
Nch per
Nch Data rate*
GHz GHz MHz kHz km/s spctrm total MB/s
L 1—2 1.024 16 64 15.6 3.1 1024 131072 50
S 2—4 2.048 32 64 62 6.3 512 65536 25
C 4—8 4.096 64 64 250 12.5 256 32767 12
X 8—12 4.096 64 64 250 7.5 256 32767 12
U 12—18 6.144 128 48 1000 20 128 12288 4.8
K 18—26.5 8.192 128 64 1000 13 128 16384 6.2
A 26.5—40 8.192 128 64 1000 9 128 16384 6.2
Q 40--50 8.192 128 64 1000 6.5 128 16384 6.2
• For dual (RR,LL) polarization, with recirculation• For full polarization, spectral channels are 2 x wider.
* With 10 second averaging
Leiden 2011 Feb 24
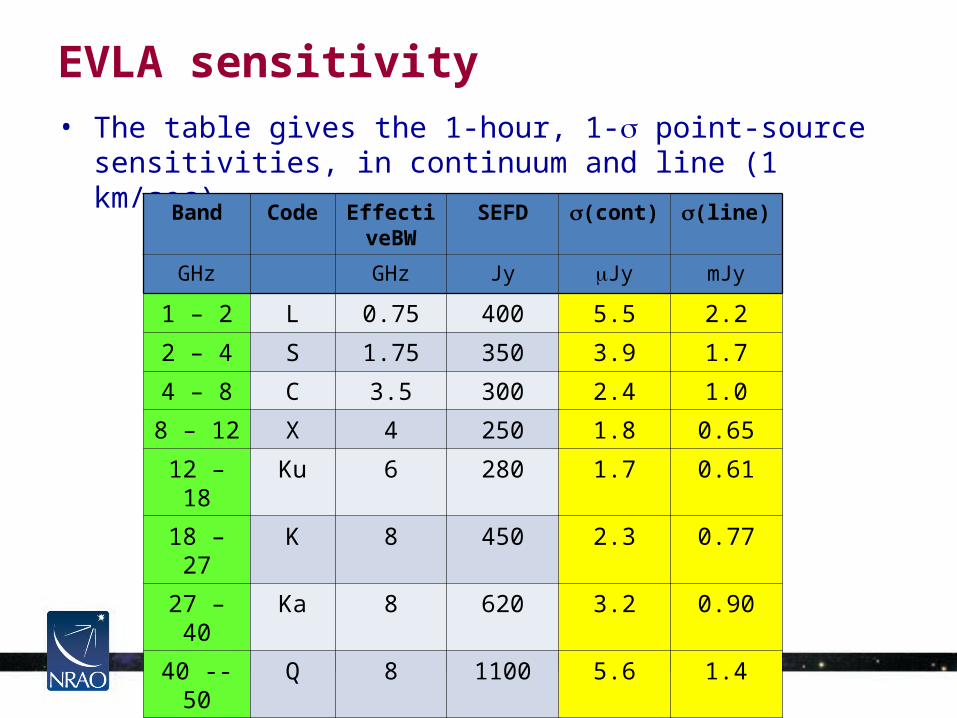
EVLA sensitivity• The table gives the 1-hour, 1- point-source
sensitivities, in continuum and line (1 km/sec)
Band Code EffectiveBW
SEFD (cont) (line)
GHz GHz Jy Jy mJy
1 – 2 L 0.75 400 5.5 2.2
2 – 4 S 1.75 350 3.9 1.7
4 – 8 C 3.5 300 2.4 1.0
8 – 12 X 4 250 1.8 0.65
12 – 18 Ku 6 280 1.7 0.61
18 – 27 K 8 450 2.3 0.77
27 – 40 Ka 8 620 3.2 0.90
40 -- 50 Q 8 1100 5.6 1.4
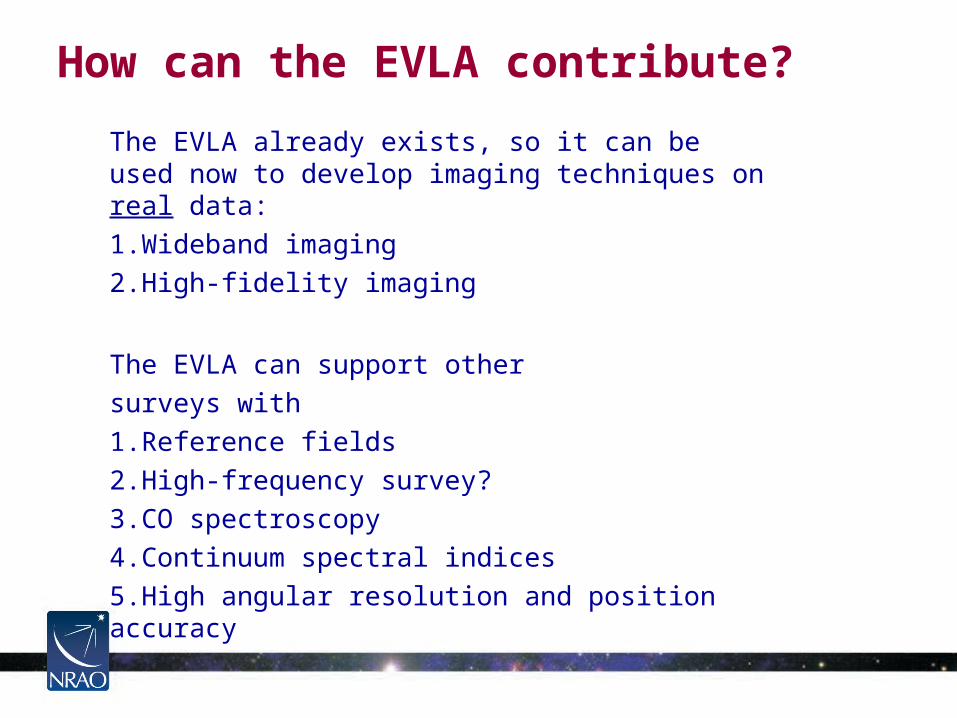
How can the EVLA contribute?
The EVLA already exists, so it can be used now to develop imaging techniques on real data:1.Wideband imaging2.High-fidelity imaging
The EVLA can support othersurveys with1.Reference fields2.High-frequency survey?3.CO spectroscopy4.Continuum spectral indices5.High angular resolution and position accuracy
Wideband imaging
• The EVLA will often be operating in ‘wideband’ mode, with large fractional bandwidths: ~ 1.
• Source structures change significantly over this range – cannot simply grid all channels on one transform plane.
• The primary telescope beam scales with -1 – introducing a ‘false’ spectral index.
• Deconvolving all background sources – even beyond the main beam – is necessary to achieve full sensitivity.
Leiden 2011 Feb 24

High-fidelity imaging
• The super-linear design of the EVLA should enable much higher DR imaging than before, so DR will be limited at virtually all bands by various primary-beam issues:– Systematic pointing offsets– Unsteady tracking– Noncircular beams (alt-az mount telescopes)– Polarization beams (special case of above).
Leiden 2011 Feb 24

3C147 deep field @ 1440 MHz
• Detailed testing underway with 12-station, full polarization, 4 subband initial configuration.
• Most demanding testing is at L-band, short spacings.
• 12 antennas, 110 MHz, 6 hours integration
• Best image so far: 400,000:1 DR for 3C147. (850,000:1 to noise in corners).
• Some artifacts visible – due to noncircular primary beams.
• RMS noise in corners ~ 1 millionth of the peak.
First Null
50% power
Leiden 2011 Feb 24
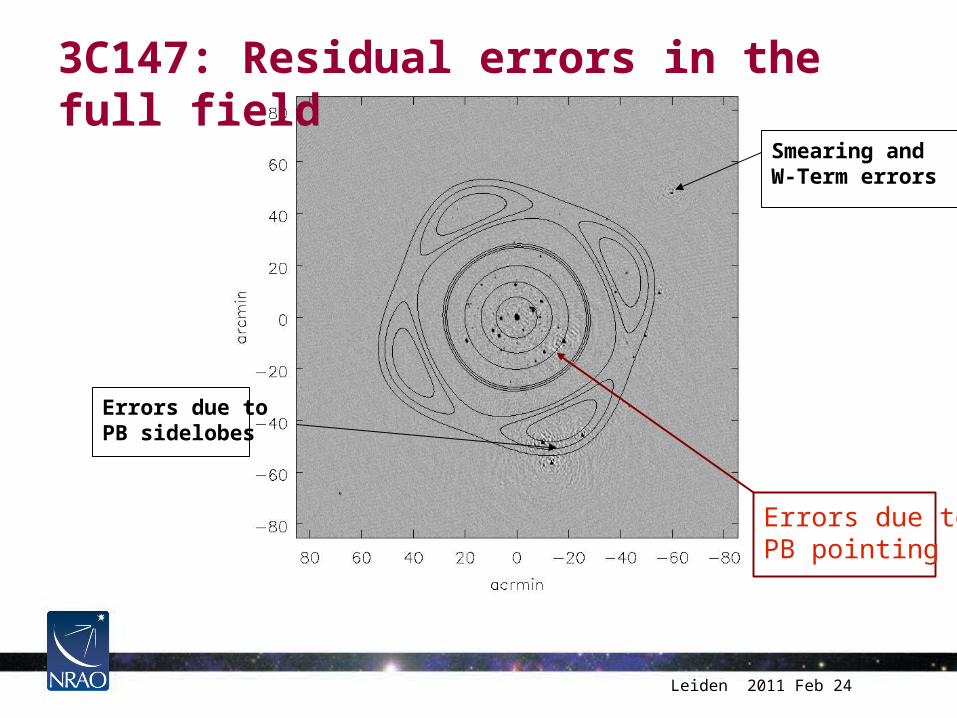
3C147: Residual errors in the full field
Smearing and W-Term errors
Errors due toPB pointing
Errors due toPB sidelobes
Leiden 2011 Feb 24
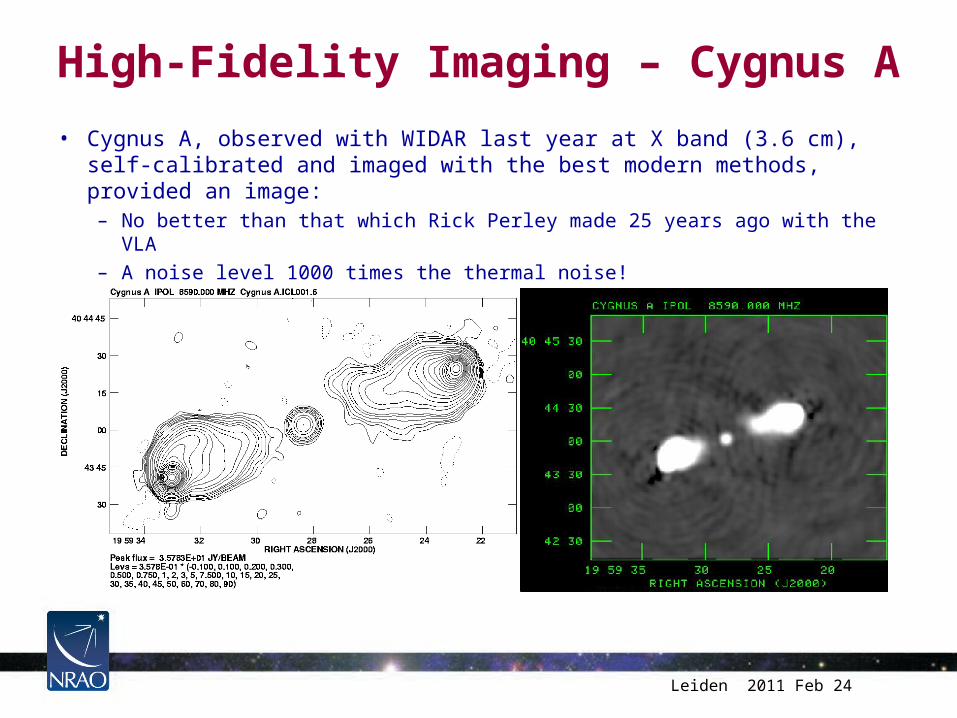
High-Fidelity Imaging – Cygnus A
• Cygnus A, observed with WIDAR last year at X band (3.6 cm), self-calibrated and imaged with the best modern methods, provided an image:– No better than that which Rick Perley made 25 years ago with the VLA– A noise level 1000 times the thermal noise!
Leiden 2011 Feb 24

What Went Wrong?
• What is wrong with Cyg A? • Clearly associated with
imaging/self-calibration. • Many ideas – little progress…• Important problem that must be
solved.
• Image of the calibrator for Cygnus A
• DR is ~650,000:1• Noise is 6 Jy (thermal)
0.004% of peak!
Leiden 2011 Feb 24

CO in submm galaxies
Leiden 2011 Feb 24
Low-excitation molecular gas in active star forming galaxies at z~2, during the ‘epoch of galaxy assembly.’ These observations show more total gas, by a factor 2, than previously derived from higher order transitions and indicate that the gas is extended on scales ~ 16 kpc. They challenge many preconceptions on massive galaxy formation at high z. (Ivison et al 2011, MNRAS, in
press).

Molecular gas in lensed LBGs
• The Ka band has performed the first imaging of molecular gas in normal star forming galaxies at high redshift (LBGs)
• Two strongly lensed were detected in CO1-0.• The gas masses, gas fractions, moderate CO excitation, and
star formation efficiencies are comparable to low-redshift star-forming galaxies
16
Riechers et al., 2011, ApJ,724, L153
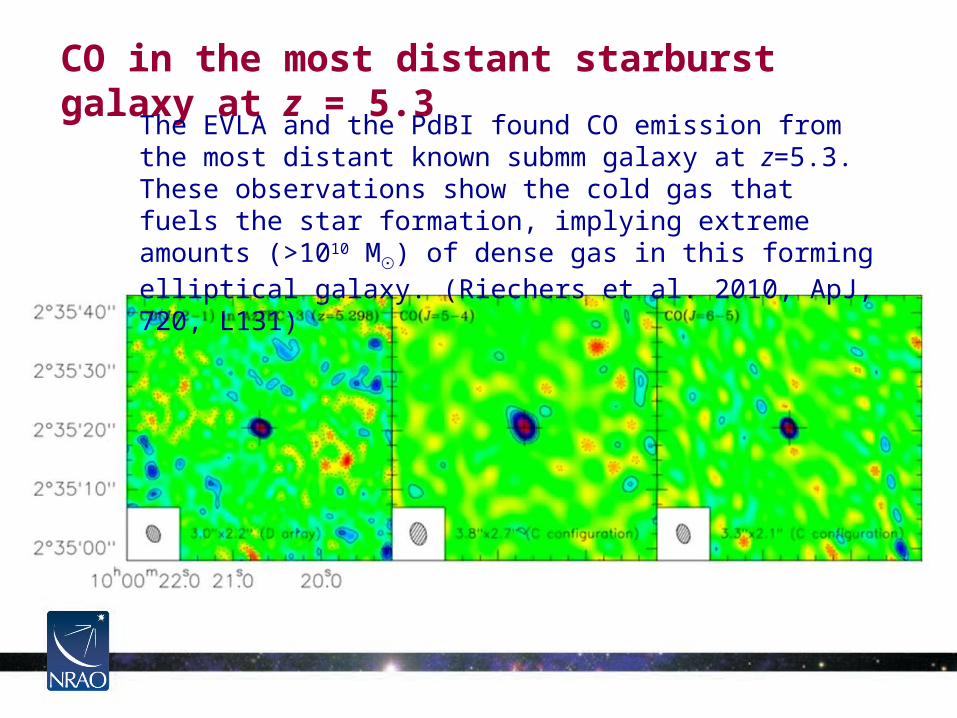
CO in the most distant starburst galaxy at z = 5.3
The EVLA and the PdBI found CO emission from the most distant known submm galaxy at z=5.3. These observations show the cold gas that fuels the star formation, implying extreme amounts (>1010 M) of dense gas in this forming elliptical galaxy. (Riechers et al. 2010, ApJ, 720, L131)

4.051
z=4.055
4.056
0.7mJyCO2-1 46GHz
0.4mJy
1000 km/s
0.3mJy
• SFR ~ 103 Mo/year
• Mgas ~ 1011 Mo
• Early, clustered massive galaxy formation
GN20 molecule-rich proto-cluster at z=4 (Daddi)CO 2-1 in 3 submm galaxies, all in 256 MHz band
Evolving Universe
Leiden 2011 Feb 24

EVLA as SKA pathfinder: counts of very faint sourcesLocal visibility function
ϕ(L) = L5/2ρ(L) yieldscounts normalized by static Euclidean counts
∆ log(L) ~ 1.2 evolutionfor all radio sources <z> ~ 0.8, ∆ log(z) ~ 0.5over wide flux range(more sensitive survey ≠“deeper” survey)
stars
AGN
AGN
stars
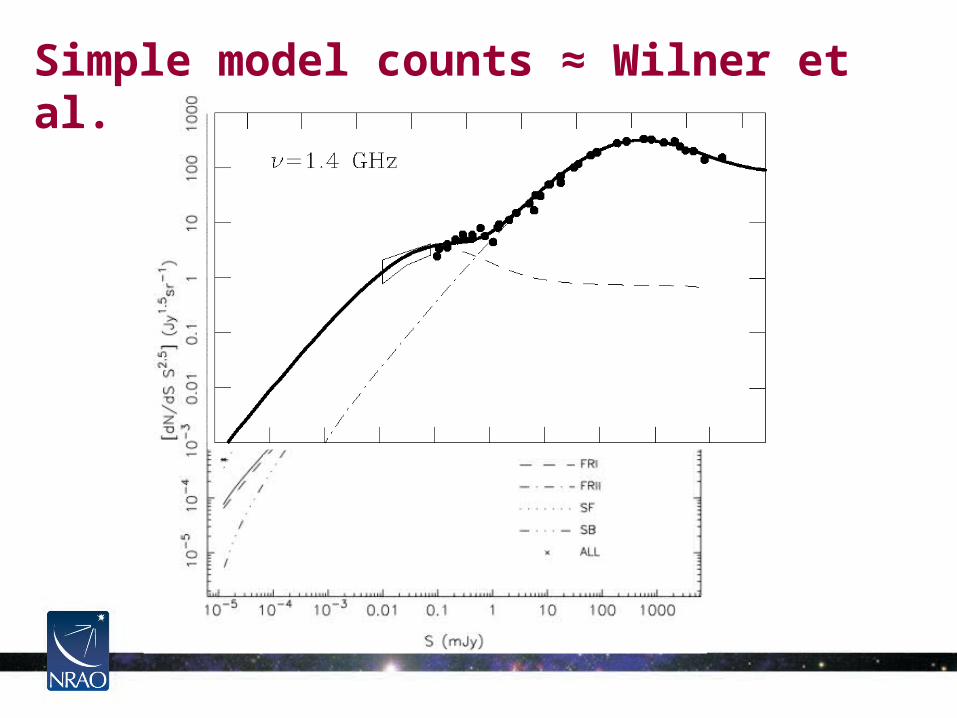
Simple model counts ≈ Wilner et al. (2008)
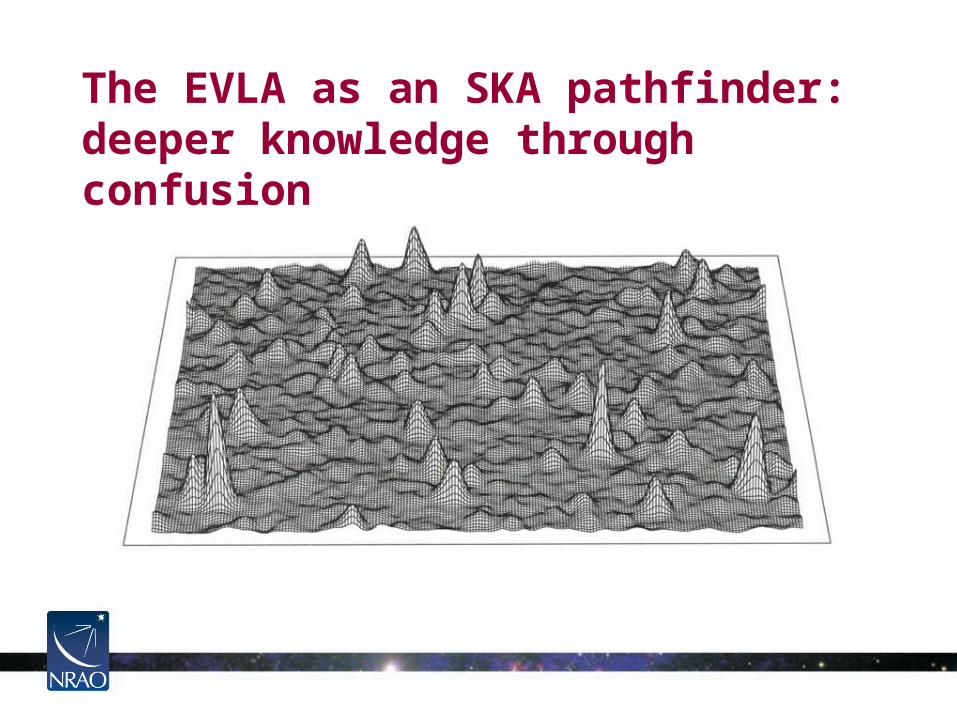
The EVLA as an SKA pathfinder:deeper knowledge through confusion
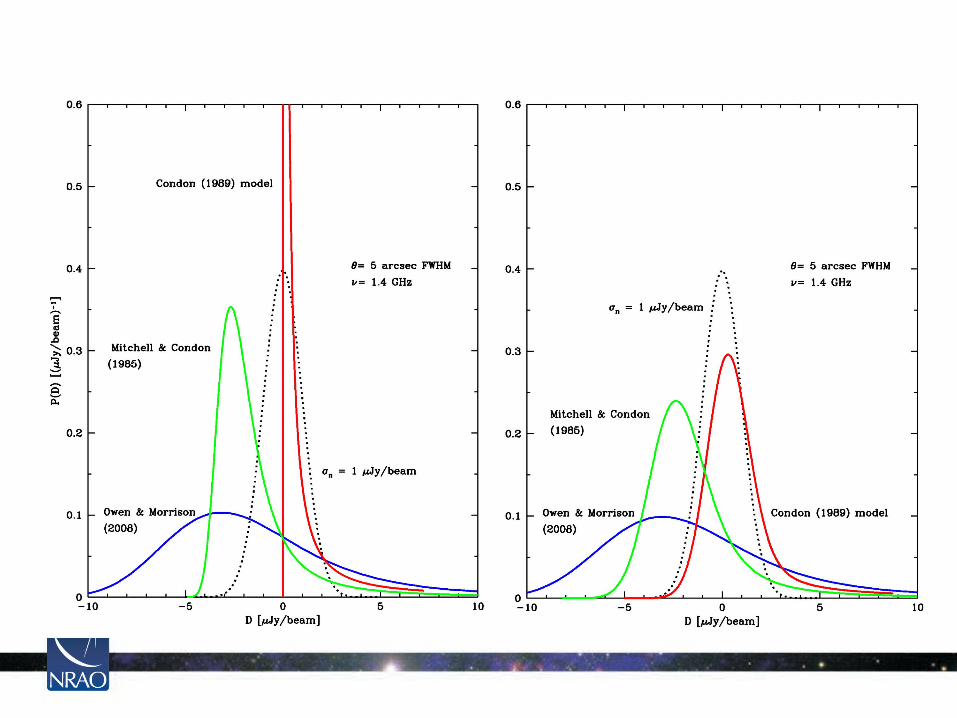

Ultimate limits for radio continuum surveys
• confusion: c~ .03 K at 1.4
GHz) instrumental natural• field of view Ω• dynamic range• noise
Summary: Examples of possible EVLA contributions• CO J=1-0 spectra of high-z galaxies, clusters, and quasars• Continuum radio spectra of individual sources and fields• All-sky 6 cm NVSS for spectra of stronger (more luminous)
AGN• Sky density of faint sources• “Reference” field with higher resolution and sensitivity than
EMU/WODAN surveys
Leiden 2011 Feb 24


