
The Macroeconomics of Open Economies:
Basic Concepts
(Chapter 31 in Mankiw and Taylor)

Basic Concepts
• Closed economy
– Economy that does not interact with other
economies in the world (RoW)
• Open economy
– Economy that interacts freely with other
economies around the world
• International trade can make everyone better
off, since it lets them specialise in producing
those goods and services in which it has a
comparative advantage
2

International Flow of Goods
• An open economy interacts with the RoW by buying
and selling both goods/services and capital assets
(stocks and bonds etc.)
• Exports
– Goods & services
– Produced domestically
– Sold abroad
• Imports
– Goods and services
– Produced abroad
– Sold domestically 3

International Flow of Goods
• Net exports
– Value of a nation’s exports minus the value
of its imports
– Also called the trade balance
• Trade surplus
– Excess of exports over imports
• Trade deficit
– Excess of imports over exports
• Balanced trade
– Exports equal imports
4

International Flow of Goods
• Factors that influence a country’s exports,
imports and net exports:
– Tastes of consumers for domestic & foreign goods
– Prices of goods at home and abroad
– Exchange rates
• People use domestic currency to buy foreign currencies
– Incomes of consumers at home and abroad
– Cost of transporting goods from country to country
– Government policies toward international trade
5

The increasing openness of the U.S. economy
• Increasing importance of international
trade and finance
– 1950s, imports and exports: 4-5% of GDP
– Recent years:
• Exports – increased more than twice
• Imports – increased more than three times
• Similar story for UK and indeed the world
economy
6

The increasing openness of the U.S. economy
• Increase in international trade
– Improvements in transportation
• Bigger and faster ships; planes; better
storage
– Advances in telecommunications
– Technological progress
– Government’s trade policies
• NAFTA
• GATT
7

Figure 1
8
The internationalisation of the U.S. Economy
This figure shows exports and imports of the U.S. economy as a percentage of U.S. gross
domestic product since 1950. The substantial increases over time show the increasing
importance of international trade and finance.

International Flow of Capital
• Net capital outflow
– Purchase of foreign assets by domestic
residents minus the purchase of domestic
assets by foreigners
– Flow of capital takes two forms:
• Foreign direct investment
– You buy a BMW car factory
• Foreign portfolio investment
– You buy shares in BMW
9

International Flow of Capital
• Factors that influence net capital outflow:
– Real interest rates paid on foreign assets
– Real interest rates paid on domestic
assets
– Perceived economic and political risks of
holding assets abroad
– Government policies that affect foreign
ownership of domestic assets
10

Net Exports=Net Capital Outflow
• Net exports (NX) or trade balance
– Imbalance between a country’s exports
and its imports of goods and services
• Net capital outflow (NCO)
– Imbalance between
• Amount of foreign assets bought by domestic
residents
• And the amount of domestic assets bought
by foreigners
• Identity: NCO = NX 11

Net Exports=Net Capital Outflow
• When NX > 0 (trade surplus)
– Selling more goods and services to
foreigners than it is buying from them
– From net sale of goods and services
• Receives foreign currency
• Buy foreign assets
• Capital - flowing out of the country: NCO > 0
12 © 2011 Cengage Learning. All Rights Reserved. May not be copied, scanned, or duplicated, in whole or in part, except for use as
permitted in a license distributed with a certain product or service or otherwise on a password-protected website for classroom use.

Net Exports=Net Capital Outflow
• When NX < 0 (trade deficit)
– Buying more goods and services from
foreigners
• Than it is selling to them
– The net purchase of goods and services
• Needs financing
• Selling assets abroad
• Capital - flowing into the country: NCO < 0
13 © 2011 Cengage Learning. All Rights Reserved. May not be copied, scanned, or duplicated, in whole or in part, except for use as
permitted in a license distributed with a certain product or service or otherwise on a password-protected website for classroom use.
Saving and investment
• A nation’s saving and investment are
fundamental to its long run economic
growth
• So let’s see how these variables are
related to the international flow of goods
and capital, as measured by net exports
and net capital outflow
14

Some simple algebra
• Open economy: Y = C + I + G + NX
• National saving: S = Y – C – G
• Y – C – G = I + NX
• S = I + NX
• NX = NCO
• S = I + NCO
• National saving = Domestic investment +
Net capital outflow
• i.e. when the UK saves a £ it can be used to
accumulate capital at home or abroad 15

International Flows
• Trade surplus: Exports > Imports
• Net exports > 0
• Y > Domestic spending (C+I+G)
• S > I
• NCO > 0
16 © 2011 Cengage Learning. All Rights Reserved. May not be copied, scanned, or duplicated, in whole or in part, except for use as
permitted in a license distributed with a certain product or service or otherwise on a password-protected website for classroom use.

International Flows
• Trade deficit: Exports < Imports
• Net exports < 0
• Y < Domestic spending (C+I+G)
• S < I
• NCO < 0
17 © 2011 Cengage Learning. All Rights Reserved. May not be copied, scanned, or duplicated, in whole or in part, except for use as
permitted in a license distributed with a certain product or service or otherwise on a password-protected website for classroom use.

International Flows
• Balanced trade : Exports = Imports
• Net exports = 0
• Y = Domestic spending (C+I+G)
• S = I
• NCO = 0
18 © 2011 Cengage Learning. All Rights Reserved. May not be copied, scanned, or duplicated, in whole or in part, except for use as
permitted in a license distributed with a certain product or service or otherwise on a password-protected website for classroom use.
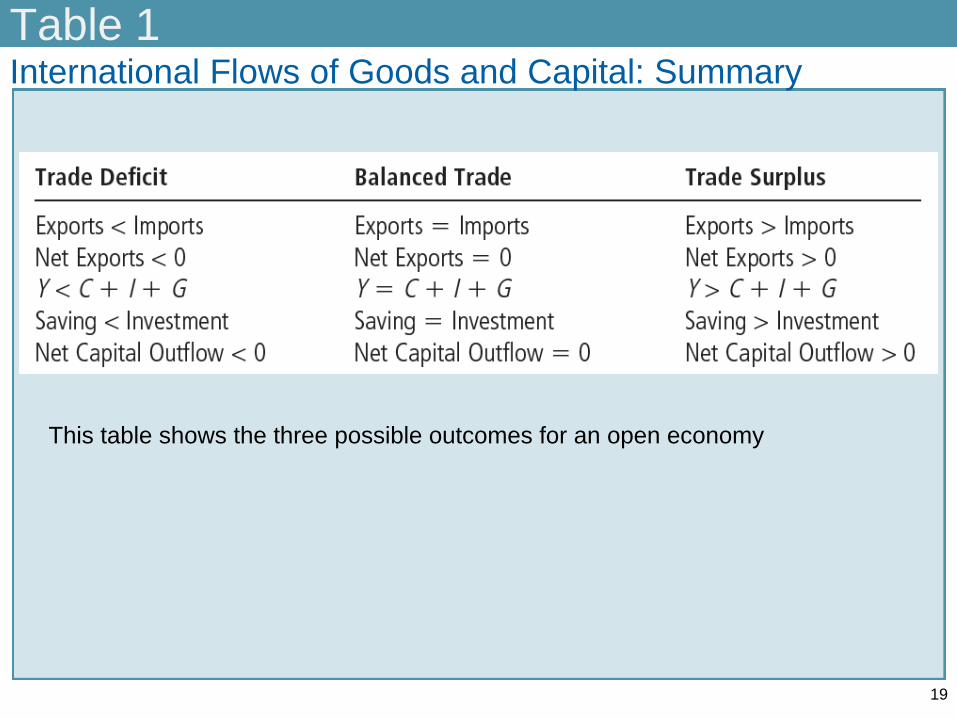
Table 1
19
International Flows of Goods and Capital: Summary
This table shows the three possible outcomes for an open economy

Is the U.S. trade deficit a national problem?
• In the past two decades the U.S.
– Borrowed heavily in world financial
markets
– To finance large trade deficits
• Before 1980
– National saving & domestic investment
were close
– Small net capital outflow
20
Is the U.S. trade deficit a national problem?
• After 1980
– National saving - fell substantially below
investment
– Net capital outflow - a large negative
number; i.e. a capital inflow
– U.S. - going into (external) debt
21

Figure 2: Recall, S-I=NX so I>S implies a trade deficit
22
National Saving, Domestic Investment, and Net Capital Outflow
Panel (a) shows national saving and domestic investment as a percentage of GDP. You can see
from the figure that national saving has been lower since 1980 than it was before 1980. This fall in
national saving has been reflected primarily in reduced net capital outflow rather than in reduced
domestic investment.

Figure 3: S = I + NCO, so I>S implies NCO<0
23
National Saving, Domestic Investment, and Net Capital Outflow
Panel (b) shows net capital outflow as a percentage of GDP. You can see from the figure that
national saving has been lower since 1980 than it was before 1980. This fall in national saving
has been reflected primarily in reduced net capital outflow (i.e. capital inflow) rather than in
reduced domestic investment.

Is the U.S. trade deficit a national problem?
• Trade deficit induced by a fall in saving
– The nation is putting away less of its
income to provide for its future
– No reason to deplore the resulting trade
deficits?
• Better to have foreigners invest in the U.S.
economy than no one at all
24

Is the U.S. trade deficit a national problem?
• Trade deficit induced by an investment
boom
– Economy is borrowing from abroad to
finance the purchase of new capital
goods
• For a good return on investment - the
economy should be able to handle the debts
that are being accumulated
• For a lower return on investment - debts will
look less desirable
25

Nominal Exchange Rates
• Nominal exchange rate
– Rate at which a person can trade currency of
one country for currency of another
• Appreciation (strengthen)
– Increase in the value of a currency
– As measured by the amount of foreign currency
one unit of the domestic currency can buy
• An appreciation means one can buy more foreign
currency
• N.B. can always express the exchange rate the other way
round – i.e. as the domestic price of foreign exchange 26

Nominal Exchange Rates
• Depreciation (weaken)
– Decrease in the value of a currency
– As measured by the amount of foreign
currency it can buy
• A depreciation means one can buy less
foreign currency
27 © 2011 Cengage Learning. All Rights Reserved. May not be copied, scanned, or duplicated, in whole or in part, except for use as
permitted in a license distributed with a certain product or service or otherwise on a password-protected website for classroom use.

Real Exchange Rates
• Real exchange rate
– This is the price at which a person can
trade goods and services of one country,
for goods and services of another:
28
Real exchange rate
Nominal exchange rate Domestic price
Foreign price
© 2011 Cengage Learning. All Rights Reserved. May not be copied, scanned, or duplicated, in whole or in part, except for use as
permitted in a license distributed with a certain product or service or otherwise on a password-protected website for classroom use.

Real Exchange Rates
• Real exchange rate = (e × P) / P*
• Using price indexes
• e – nominal exchange rate between the
U.K. pound and foreign currencies
• P – price index for U.K. basket
• P* – price index for foreign basket
29 © 2011 Cengage Learning. All Rights Reserved. May not be copied, scanned, or duplicated, in whole or in part, except for use as
permitted in a license distributed with a certain product or service or otherwise on a password-protected website for classroom use.

Real Exchange Rates
• Depreciation (fall) in the U.K. real
exchange rate
– U.K. goods - cheaper relative to foreign
goods
– Consumers at home and abroad - buy
more U.K. goods and fewer goods from
other countries
• Higher exports
• Lower imports
• Higher net exports
30 © 2011 Cengage Learning. All Rights Reserved. May not be copied, scanned, or duplicated, in whole or in part, except for use as
permitted in a license distributed with a certain product or service or otherwise on a password-protected website for classroom use.

Real Exchange Rates
• An appreciation (rise) in the U.K. real
exchange rate
– U.K. goods - more expensive compared to
foreign goods
– Consumers at home and abroad - buy
fewer U.K. goods and more goods from
other countries
• Lower exports
• Higher imports
• Lower net exports
31 © 2011 Cengage Learning. All Rights Reserved. May not be copied, scanned, or duplicated, in whole or in part, except for use as
permitted in a license distributed with a certain product or service or otherwise on a password-protected website for classroom use.

Nominal exchange rates vary over time -
Dollar price of £1
32

• Why do nominal exchange rates vary as
much as they apparently do?
33

Purchasing Power Parity
• Purchasing power parity, PPP
– First (long run) theory of exchange rates
– A unit of any given currency
• Should be able to buy the same quantity of
goods in all countries
• Basic logic of purchasing power parity
– Based on the Law Of One Price (LOOP)
– A good must sell for the same price in all
locations
34 © 2011 Cengage Learning. All Rights Reserved. May not be copied, scanned, or duplicated, in whole or in part, except for use as
permitted in a license distributed with a certain product or service or otherwise on a password-protected website for classroom use.

Purchasing Power Parity
• This is due to arbitrage
– Take advantage of price differences for
the same item in different markets
• And trade until there is
– Equality or parity in prices
• Purchasing power
– Value of money in terms of quantity of
goods it can buy
35 © 2011 Cengage Learning. All Rights Reserved. May not be copied, scanned, or duplicated, in whole or in part, except for use as
permitted in a license distributed with a certain product or service or otherwise on a password-protected website for classroom use.

Implications of PPP
• If purchasing power of the pound
– Is always the same at home and abroad
– Then the real exchange rate cannot change, since
1/P=e/P* or 1=eP/P* so that e=P*/P
• If a Big Mac costs £3 in the UK and $4 in the US
then e=4/3=1.3 dollars per pound
• Theory of purchasing power parity
– Nominal exchange rate between the currencies of
two countries reflects the (overall, aggregate) price
levels in those countries
– So when relative prices change, e must change 36

• We have seen (in lecture 10) that the price
level in any country adjusts to bring the
quantity of money supplied and demanded into
balance
• Because the nominal ER depends on the price
level, it also depends on the money supply and
demand in each country
• So, when a country prints money its exchange
rate should depreciate
– So the depreciation of the £ against the $ that
we saw should reflect higher inflation in the UK
Implications of PPP (cont.)
37

Nominal exchange rate during a hyperinflation
• Natural experiment – hyperinflation
– High inflation
– Arises when a government prints money
to pay for large amounts of government
spending
• German hyperinflation, early 1920s
– Money supply, price level, nominal
exchange rate
• Move closely together
38 © 2011 Cengage Learning. All Rights Reserved. May not be copied, scanned, or duplicated, in whole or in part, except for use as
permitted in a license distributed with a certain product or service or otherwise on a password-protected website for classroom use.

Nominal exchange rate during a hyperinflation
• German hyperinflation, early 1920s
– Money supply - starts growing quickly
• Price level – starts growing
• Depreciation
– Money supply - stabilises
• Price level – stabilises
• Exchange rate – stabilises
39 © 2011 Cengage Learning. All Rights Reserved. May not be copied, scanned, or duplicated, in whole or in part, except for use as
permitted in a license distributed with a certain product or service or otherwise on a password-protected website for classroom use.

Nominal exchange rate during a hyperinflation
• Quantity theory of money
– Explains how the money supply affects
price level
• Purchasing power parity
– Explains how price level affects nominal
exchange rate
40 © 2011 Cengage Learning. All Rights Reserved. May not be copied, scanned, or duplicated, in whole or in part, except for use as
permitted in a license distributed with a certain product or service or otherwise on a password-protected website for classroom use.

Figure 3
41
Money, Prices, and the Nominal Exchange Rate during the
German Hyperinflation This figure shows the
money supply, the price
level, and the exchange
rate (measured as U.S.
cents per mark) for the
German hyperinflation
from January 1921 to
December 1924. Notice
how similarly these
three variables move.
When the quantity of
money started growing
quickly, the price level
followed, and the mark
depreciated relative to
the dollar. When the
German central bank
stabilised the money
supply, the price level
and exchange rate
stabilised as well.
Limitations of PPP
• Theory of purchasing power parity
– Does not always hold in practice, except
perhaps in the long run
– Evidenced by the fact that the real ER is not
constant over time
1. Many goods (e.g. services like haircuts) are
not easily traded
2. Even tradable goods are not always perfect
substitutes
• When they are produced in different countries
• No opportunity for profitable arbitrage
• Transactions costs inhibit profitable arbitrage 42

Limitations of PPP
• Purchasing power parity
– Not a perfect theory of exchange-rate
determination
– Real exchange rates fluctuate over time
• Large & persistent movements in nominal
exchange rates
– Typically reflect changes in price levels at
home and abroad
43 © 2011 Cengage Learning. All Rights Reserved. May not be copied, scanned, or duplicated, in whole or in part, except for use as
permitted in a license distributed with a certain product or service or otherwise on a password-protected website for classroom use.

The Big Mac Index: from
• Fun guide to whether currencies are at their “correct” level
• http://www.economist.com/blogs/dailychart/2011/07/big-mac-index
• In the “long run”, exchange rates should move towards the rate that equalises the prices of Big Macs around the world
• According to purchasing power parity
– Cost of “Big Mac” should be the same in both countries
– Predicted exchange rate = Price in foreign country (in foreign currency) divided by price in U.S.

• At market exchange rates, a burger is 43% cheaper in China than in America
– i.e. the raw Big Mac index suggests that the yuan is 43% undervalued against the dollar
• But cheap burgers in China do not prove that the yuan is undervalued. Average prices should be lower in poor countries than in rich ones because labour costs are lower…
Country
Big Mac Price
Implied PPP rate +
Today's Exchange Rate 1 USD =
Over(+) / Under(-) Valuation against the USD, % ++
in Local Currency
in US dollars
United States $ 4.07 4.0700 --- 1.0000 ---
Argentina Peso 20.0 4.6113 4.92 4.3372 13.4372
Australia A$ 4.56 4.8780 1.12 0.9348 19.8117
Brazil Real 9.50 5.4724 2.34 1.7360 34.7926
Britain £ 2.39 3.7846 0.59 0.6315 -6.5717
Canada C$ 4.73 4.7677 1.16 0.9921 16.9237
Chile Peso 1850 3.8027 455 486.500 -6.4748
China Yuan 14.7 2.3288 3.60 6.3123 -42.9685


