Title of The Research Project: Evaluate Effectiveness & Impact of the Disability
Inclusive Poverty Graduation Model Using Randomized Control Trial (Baseline)
Presenting by: Rashidul Islam Funded by UKAid

Defining Extreme Poor
Consume below 1,805 kcal per
person per day / income below
$2 per capita.
Have very few or no IGAs and
thus, more vulnerable to shocks
& fail to cope with such shocks.
Multiple problems i.e diseases,
malnutrition, shortages of food
and shelter, illiteracy, lack of
access to basic healthcare
services and limited access to
community support etc. keep
them in chronic poverty.
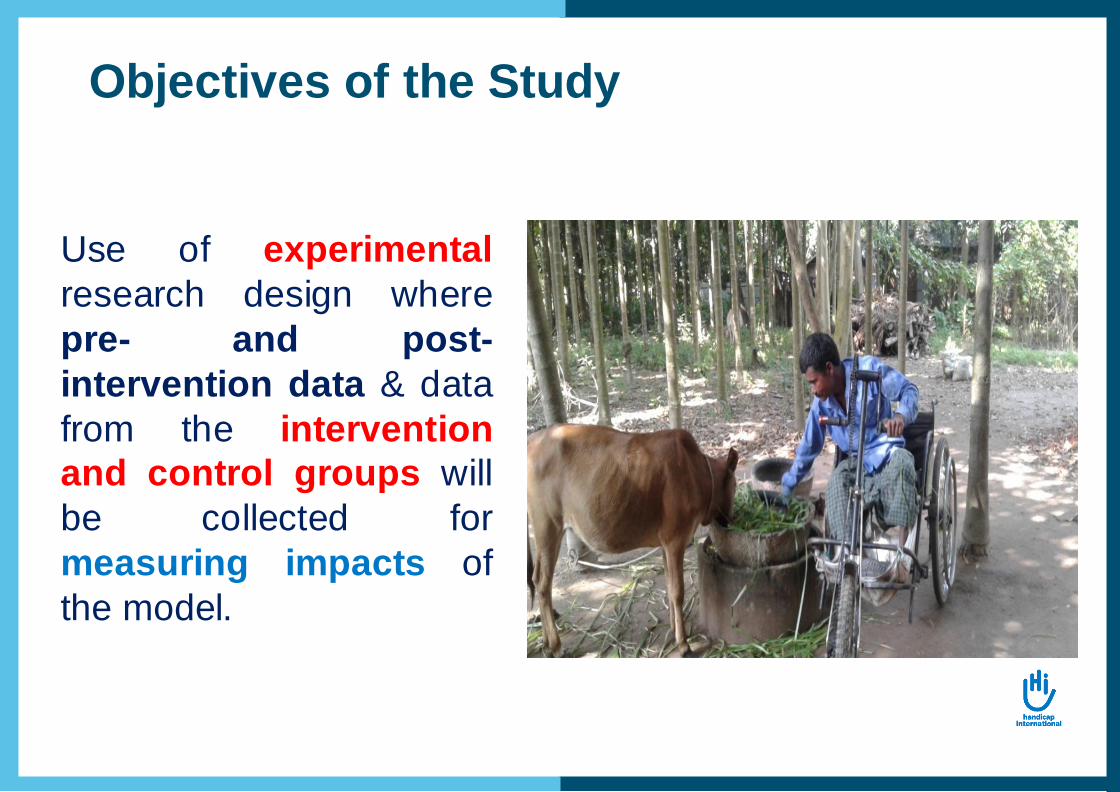
Objectives of the Study
Use of experimental
research design where
pre- and post-
intervention data & data
from the intervention
and control groups will
be collected for
measuring impacts of
the model.
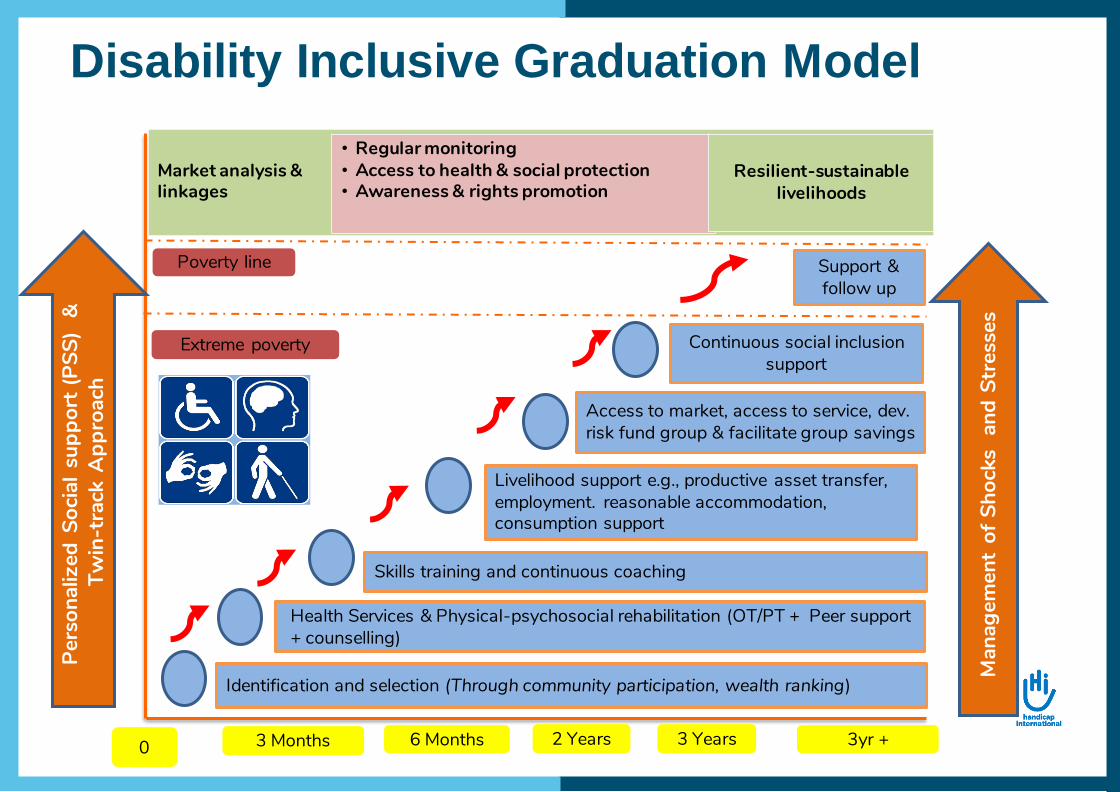
Disability Inclusive Graduation Model
Identification and selection (Through community participation, wealth ranking)
Health Services & Physical-psychosocial rehabilitation (OT/PT + Peer support + counselling)
Skills training and continuous coaching
Livelihood support e.g., productive asset transfer, employment. reasonable accommodation, consumption support
Access to market, access to service, dev. risk fund group & facilitate group savings
Continuous social inclusion support
Poverty line
Extreme poverty
2 Years6 Months0 3yr +
Man
agem
ent
of S
hock
s a
nd S
tres
ses
Market analysis & linkages
• Regular monitoring• Access to health & social protection• Awareness & rights promotion
Resilient-sustainable livelihoods
3 Months 3 Years
Support & follow up
Pers
onal
ized
Soc
ial s
uppo
rt (P
SS)
&Tw
in-t
rack
App
roac
h

Disability-Inclusive Graduation Index
Whole
Household
Individual/s with
disability/ies
(adult/children)
Household:
- Stabilized and diversified income
sources
- Increase in productive assets
- Increase in formal and informal
savings
- Food security (no or limited
negative food copying strategies,
food diversity, food reserves)
- Access to education & healthcare
Individual:
- Increased functional autonomy
- Use of sanitary latrine and clean
drinking water
- Improved participation and self-
confidence
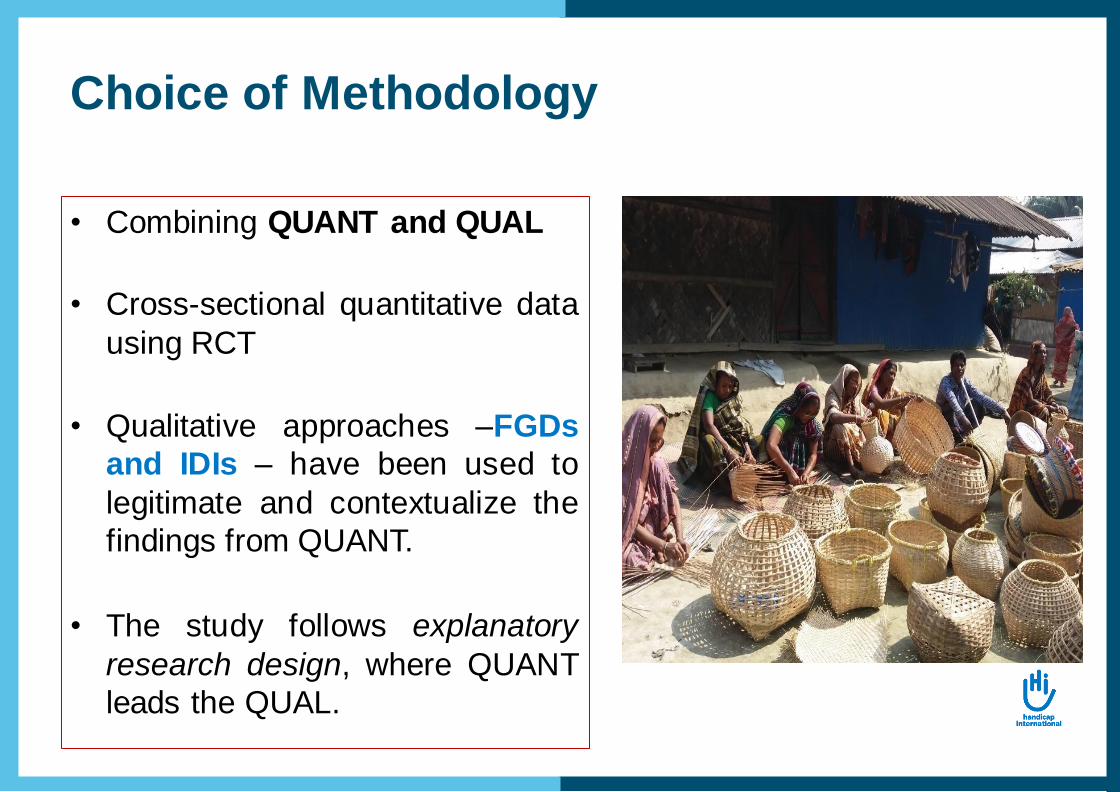
Choice of Methodology
• Combining QUANT and QUAL
• Cross-sectional quantitative data
using RCT
• Qualitative approaches –FGDs
and IDIs – have been used to
legitimate and contextualize the
findings from QUANT.
• The study follows explanatory
research design, where QUANT
leads the QUAL.
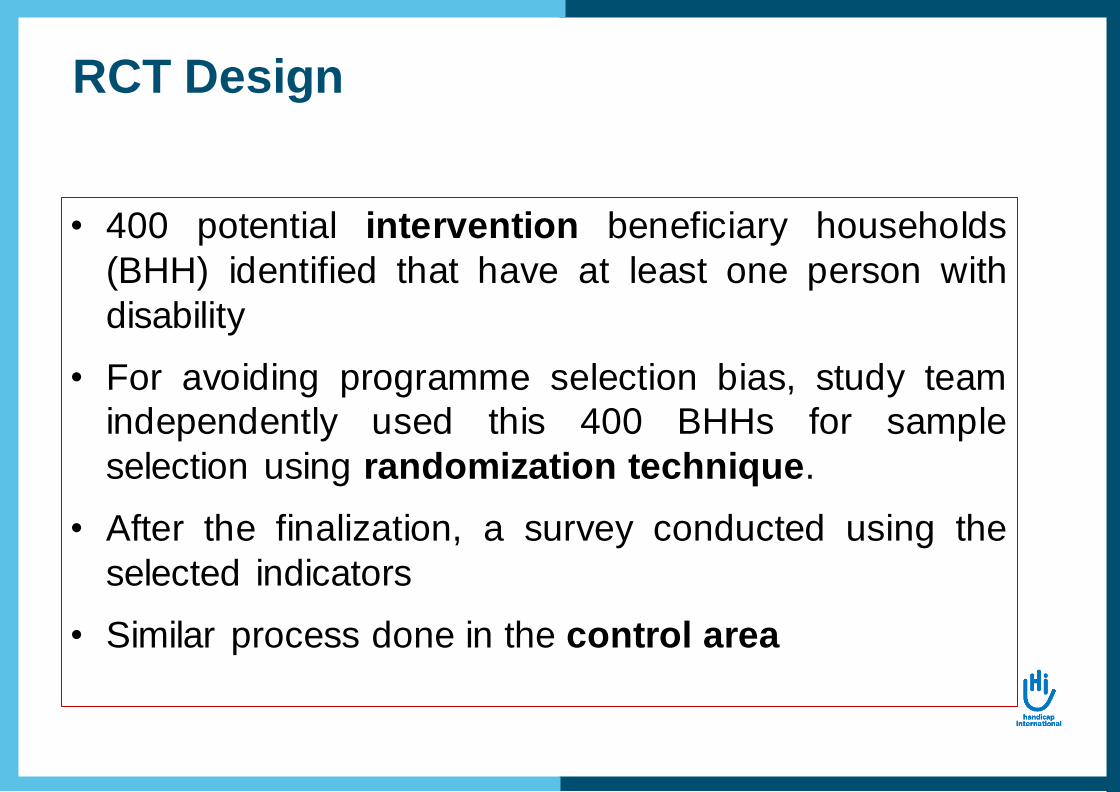
RCT Design
• 400 potential intervention beneficiary households
(BHH) identified that have at least one person with
disability
• For avoiding programme selection bias, study team
independently used this 400 BHHs for sample
selection using randomization technique.
• After the finalization, a survey conducted using the
selected indicators
• Similar process done in the control area

Quantitative Survey Design
• Target population and their characteristics
• Treatment-control approach
• Standard measurement of change with
accordance with Type-I error (level of
significance)
• Attrition rate etc.
• 242 treatment households and 444 control
households were interviewed
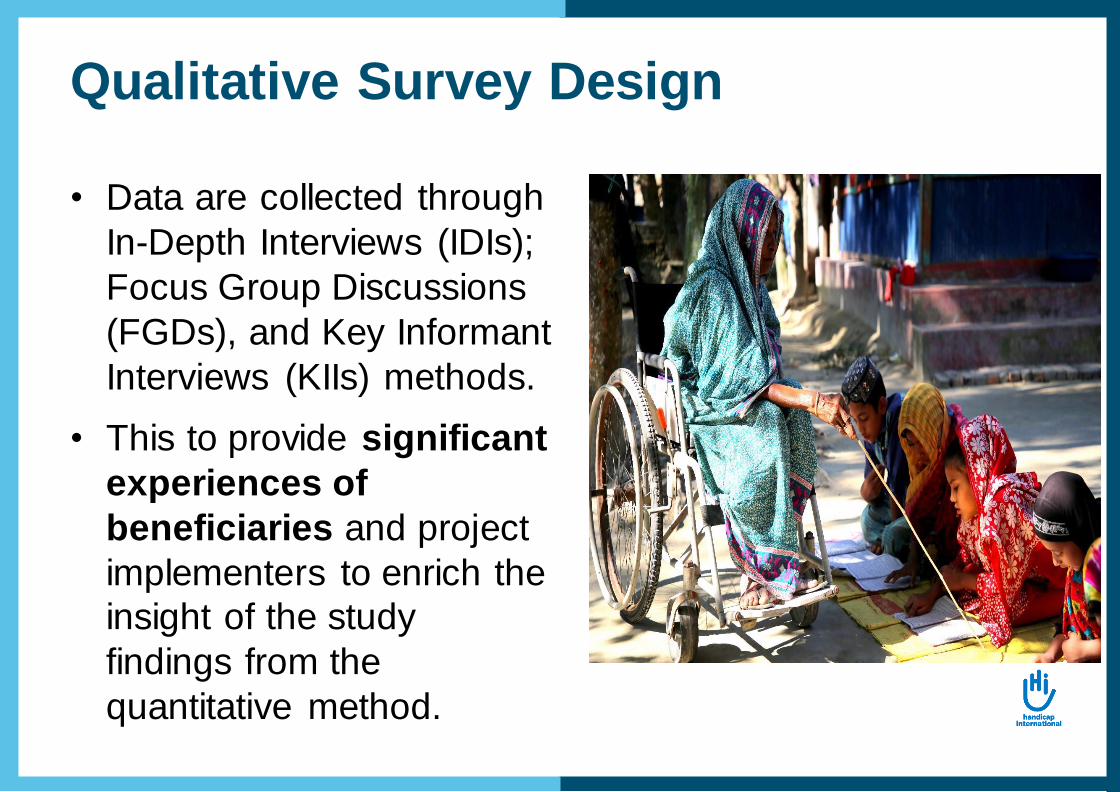
Qualitative Survey Design
• Data are collected through
In-Depth Interviews (IDIs);
Focus Group Discussions
(FGDs), and Key Informant
Interviews (KIIs) methods.
• This to provide significant
experiences of
beneficiaries and project
implementers to enrich the
insight of the study
findings from the
quantitative method.
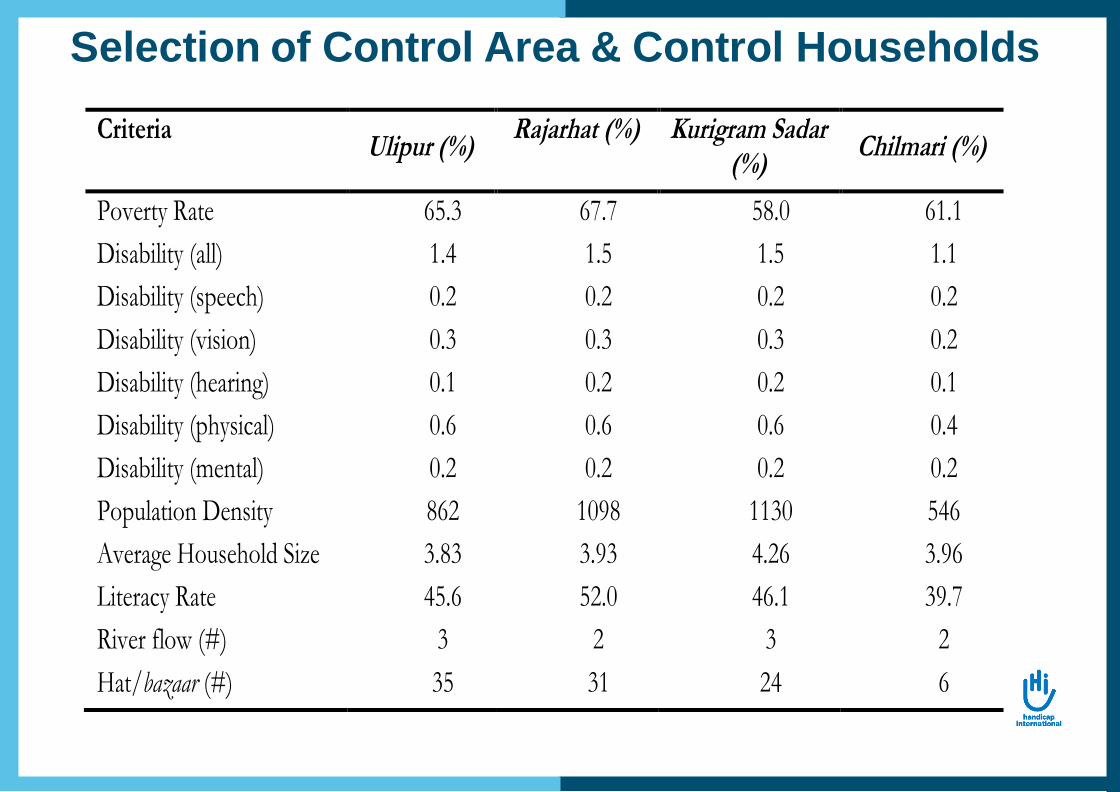
Selection of Control Area & Control Households
Criteria Ulipur (%)
Rajarhat (%) Kurigram Sadar (%)
Chilmari (%)
Poverty Rate 65.3 67.7 58.0 61.1
Disability (all) 1.4 1.5 1.5 1.1
Disability (speech) 0.2 0.2 0.2 0.2
Disability (vision) 0.3 0.3 0.3 0.2
Disability (hearing) 0.1 0.2 0.2 0.1
Disability (physical) 0.6 0.6 0.6 0.4
Disability (mental) 0.2 0.2 0.2 0.2
Population Density 862 1098 1130 546
Average Household Size 3.83 3.93 4.26 3.96
Literacy Rate 45.6 52.0 46.1 39.7
River flow (#) 3 2 3 2
Hat/bazaar (#) 35 31 24 6

Education of People with Disabilities (%)

Participation in HH Important Decision Making
(%)
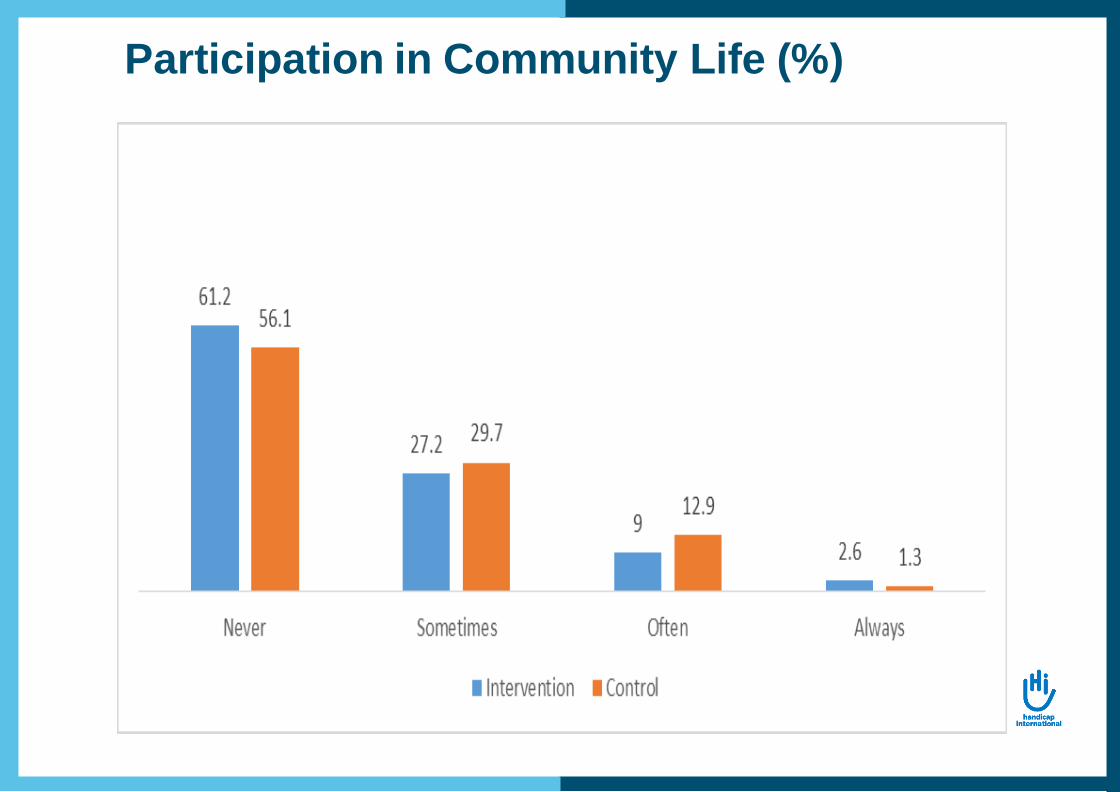
Participation in Community Life (%)
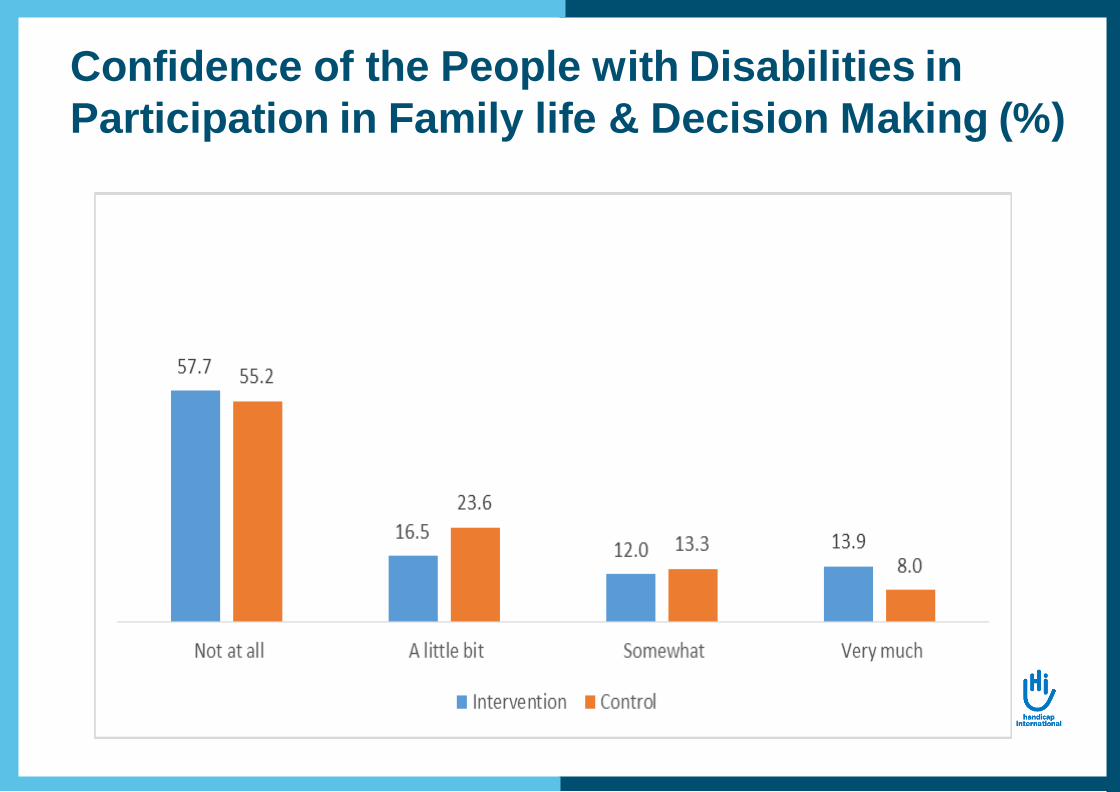
Confidence of the People with Disabilities in
Participation in Family life & Decision Making (%)
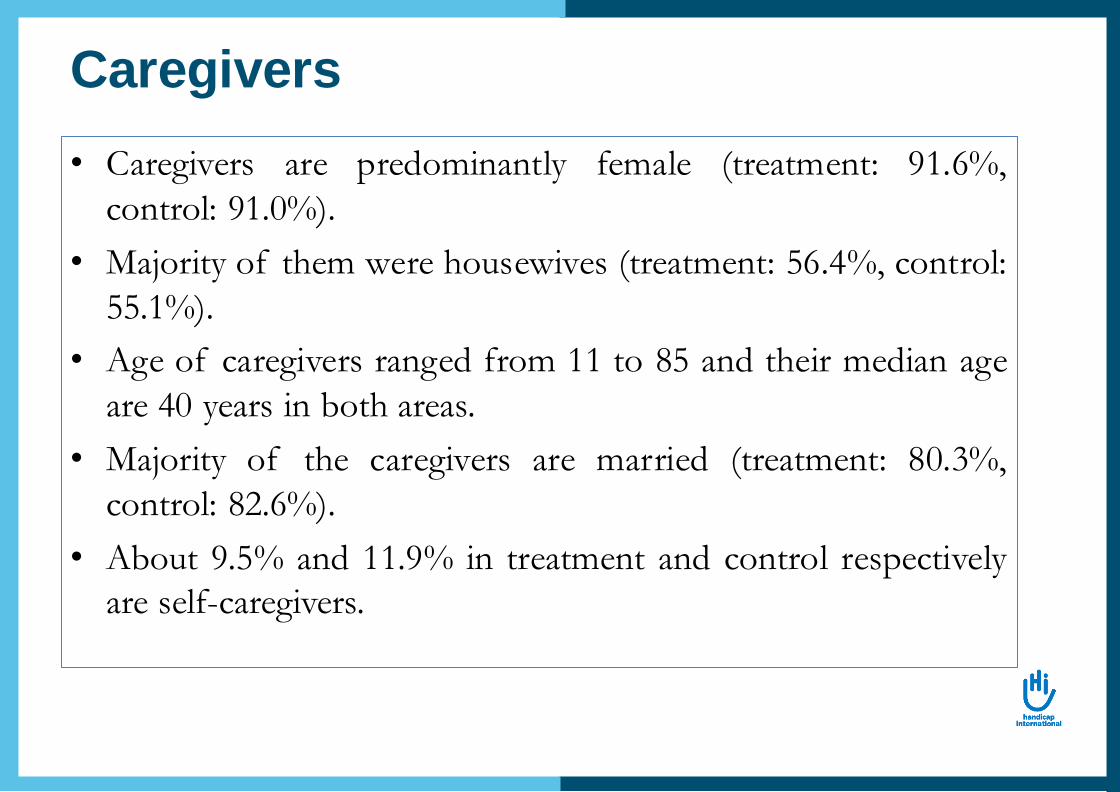
Caregivers
• Caregivers are predominantly female (treatment: 91.6%,
control: 91.0%).
• Majority of them were housewives (treatment: 56.4%, control:
55.1%).
• Age of caregivers ranged from 11 to 85 and their median age
are 40 years in both areas.
• Majority of the caregivers are married (treatment: 80.3%,
control: 82.6%).
• About 9.5% and 11.9% in treatment and control respectively
are self-caregivers.

Difficulties Faced by the Caregivers due to
Caregiving role (%)

Food Security
Food Security Status Treatment Control P-value
Food Shortage 69.0 68.3 0.206
Percentage of households ate 3 meals a day 31.0 31.7 0.84
Category of food shortage
Chronic Food Shortage 9.1 5.9 0.113
Occasional Shortage 59.9 62.4 0.526
Neither surplus nor shortage 31.0 31.5 0.884
Surplus 0.0 0.2 0.461
n 242 444

Reasons of Food Shortage
Reasons Treatment Control
Natural disaster 2.4 1.3 Social/Political unrest 0.0 1.0 Did not have any work 71.3 77.2 Did not have sufficient income 42.5 35.0 Others 1.2 1.3
n 167 303
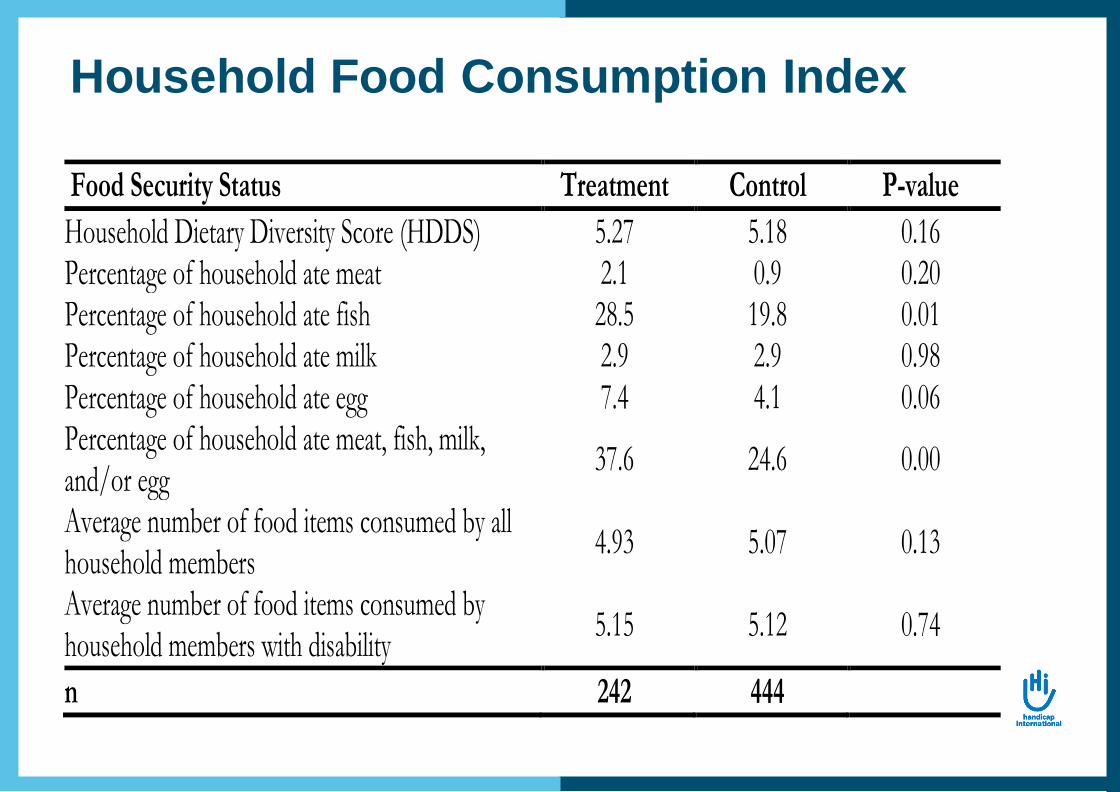
Household Food Consumption Index
Food Security Status Treatment Control P-value
Household Dietary Diversity Score (HDDS) 5.27 5.18 0.16 Percentage of household ate meat 2.1 0.9 0.20 Percentage of household ate fish 28.5 19.8 0.01 Percentage of household ate milk 2.9 2.9 0.98 Percentage of household ate egg 7.4 4.1 0.06 Percentage of household ate meat, fish, milk, and/or egg
37.6 24.6 0.00
Average number of food items consumed by all household members
4.93 5.07 0.13
Average number of food items consumed by household members with disability
5.15 5.12 0.74
n 242 444
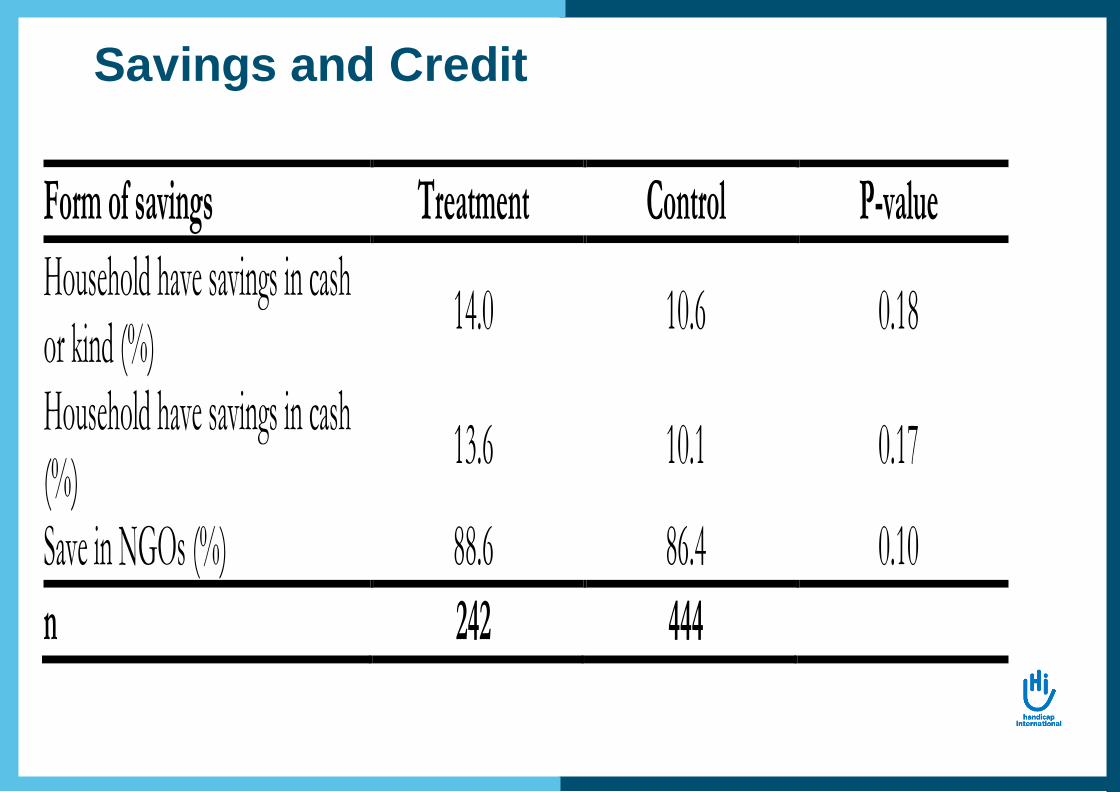
Savings and Credit
Form of savings Treatment Control P-value
Household have savings in cash or kind (%)
14.0 10.6 0.18
Household have savings in cash (%)
13.6 10.1 0.17
Save in NGOs (%) 88.6 86.4 0.10
n 242 444
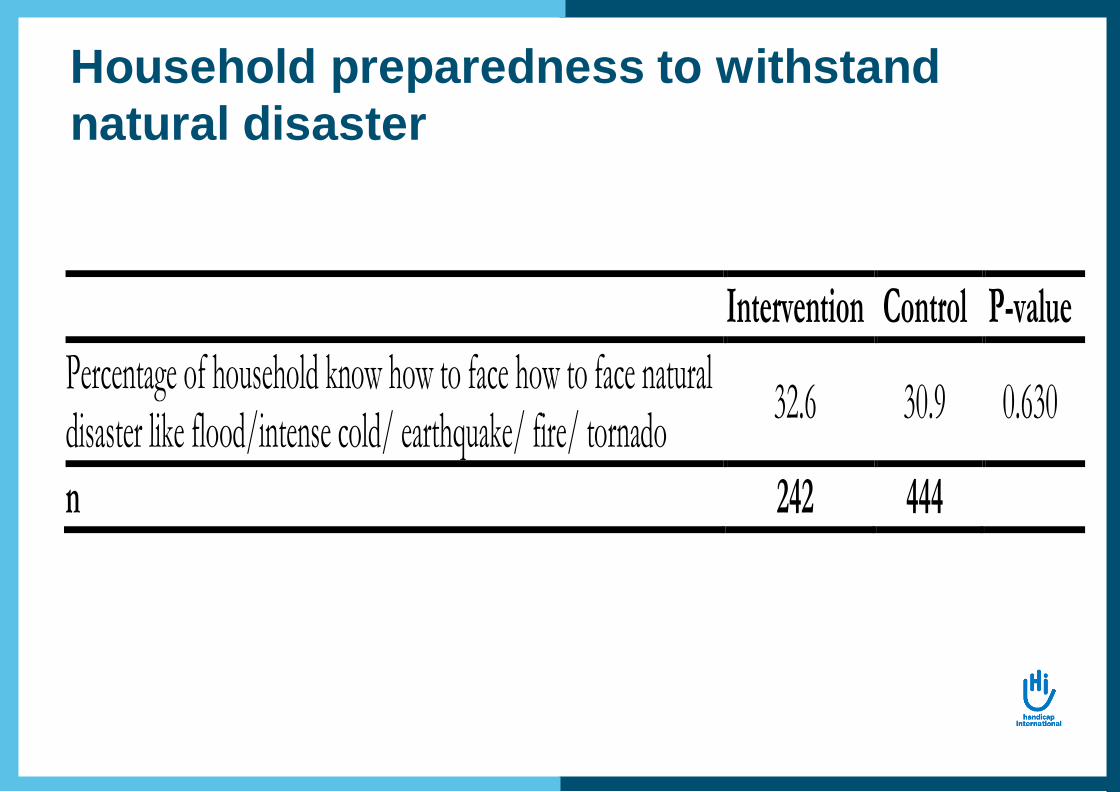
Household preparedness to withstand
natural disaster
Intervention Control P-value
Percentage of household know how to face how to face natural disaster like flood/intense cold/ earthquake/ fire/ tornado
32.6 30.9 0.630
n 242 444
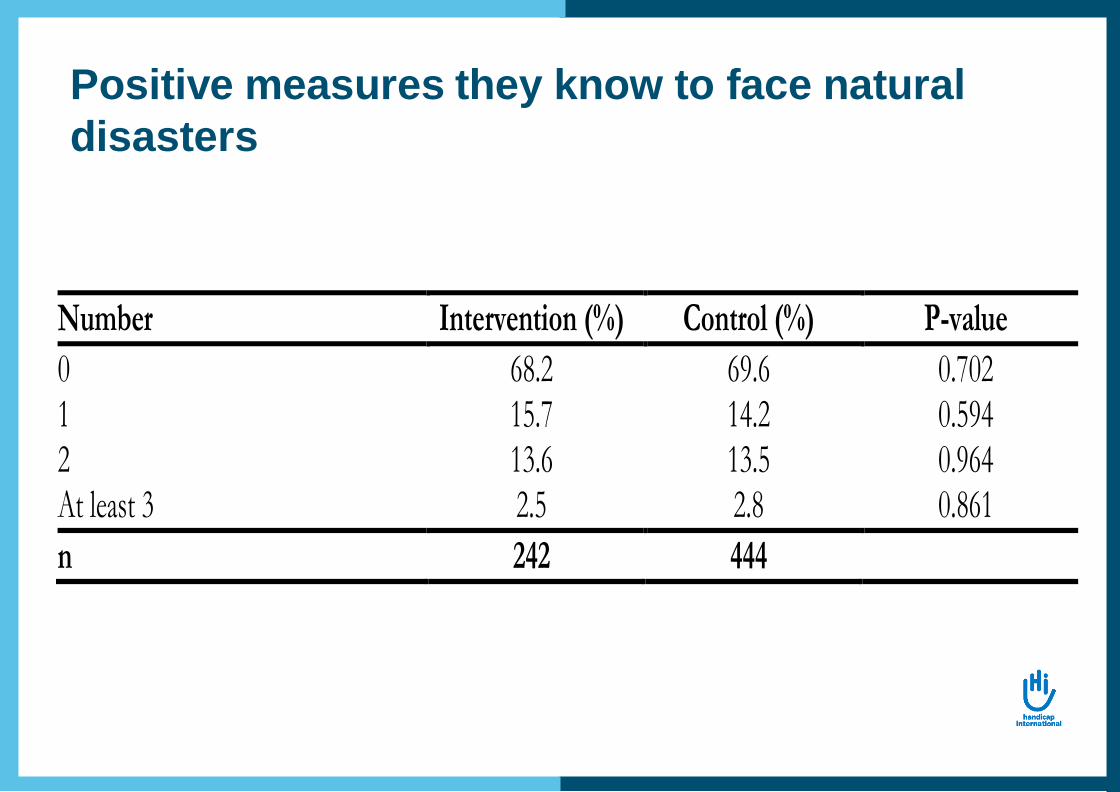
Positive measures they know to face natural
disasters
Number Intervention (%) Control (%) P-value
0 68.2 69.6 0.702 1 15.7 14.2 0.594 2 13.6 13.5 0.964 At least 3 2.5 2.8 0.861
n 242 444
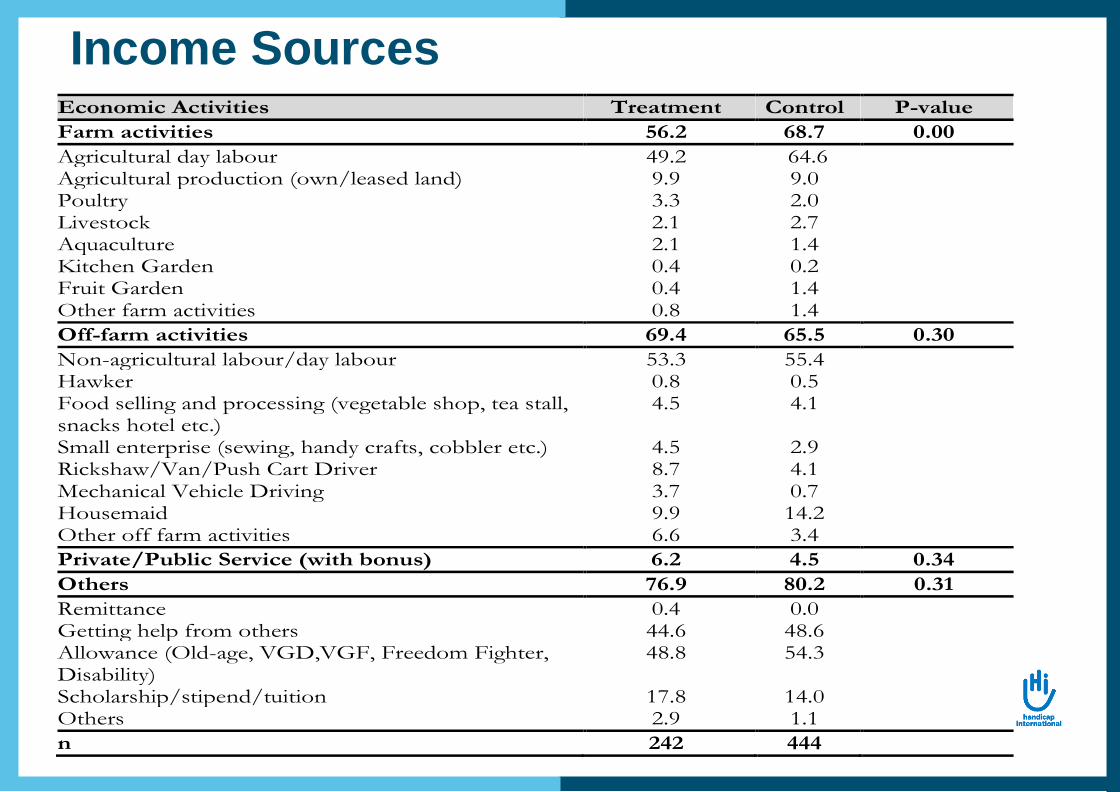
Income SourcesEconomic Activities Treatment Control P-value
Farm activities 56.2 68.7 0.00
Agricultural day labour 49.2 64.6 Agricultural production (own/leased land) 9.9 9.0 Poultry 3.3 2.0 Livestock 2.1 2.7 Aquaculture 2.1 1.4 Kitchen Garden 0.4 0.2 Fruit Garden 0.4 1.4 Other farm activities 0.8 1.4
Off-farm activities 69.4 65.5 0.30
Non-agricultural labour/day labour 53.3 55.4 Hawker 0.8 0.5 Food selling and processing (vegetable shop, tea stall, snacks hotel etc.)
4.5 4.1
Small enterprise (sewing, handy crafts, cobbler etc.) 4.5 2.9 Rickshaw/Van/Push Cart Driver 8.7 4.1 Mechanical Vehicle Driving 3.7 0.7 Housemaid 9.9 14.2 Other off farm activities 6.6 3.4
Private/Public Service (with bonus) 6.2 4.5 0.34
Others 76.9 80.2 0.31
Remittance 0.4 0.0 Getting help from others 44.6 48.6 Allowance (Old-age, VGD,VGF, Freedom Fighter, Disability)
48.8 54.3
Scholarship/stipend/tuition 17.8 14.0 Others 2.9 1.1
n 242 444

Household average annual income
Income (BDT) Treatment Control P-value
Average annual income 52,347 46,267 0.00 SD 24,934 22,154 5% trimmed mean 50,605 44,435 0.00 Per capita annual income 13,012 12,520 0.31 Per capita per day income 35.65 43.30 0.31

Annual Average Expenditure
Expenditure (BDT) Intervention Control P-value
Average annual expenditure 47,357 42,469 0.00
SD 24,328 19,675
5% trimmed mean 45,208 40,836 0.00
Per capita annual expenditure 11,504 11,220 0.437
Per capita per day expenditure 31.52 30.74 0.437
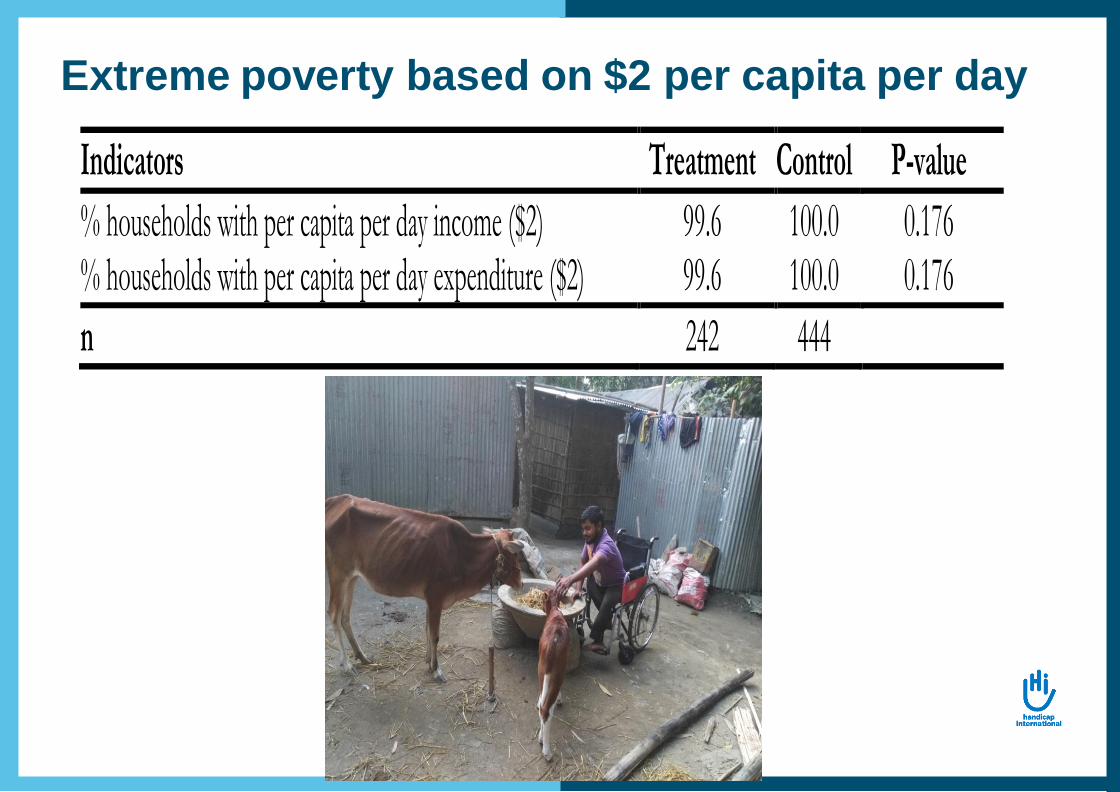
Extreme poverty based on $2 per capita per day
Indicators Treatment Control P-value
% households with per capita per day income ($2) 99.6 100.0 0.176 % households with per capita per day expenditure ($2) 99.6 100.0 0.176
n 242 444
Exclusion Examples (Qualitative)
The primary factor determining exclusion was the ability or
not to buy a gift:
“Among the 9 participants, 3 people with disability get
invitation in wedding. Rest of the other 6 people with disability
didn’t get invitation in the wedding; their family members get the
invitation. They couldn’t able to go to the function and able to buy
any gift …”.
“They don’t participate in any marriage ceremony or other
ceremonies. As they are poor and don’t have money so they
can’t give gifts. So, they do not participate”.
“Relatives come to our house, but don’t eat anything. We
ask them to eat, but they don’t eat anything”.

General comments
Challenges:
• Research timing versus operational timing
• Discussions on ethics issues
implementing such an evaluation
Unexpected outcomes:
• Awareness on disability of
research partners
• Endline to come (by march 2021)
• Uptake activities, for example,
• Stakeholder engagement (including donor)
• Dissemination through Workshop
• Replication of the model
• Recommendation for policy makers
Next steps
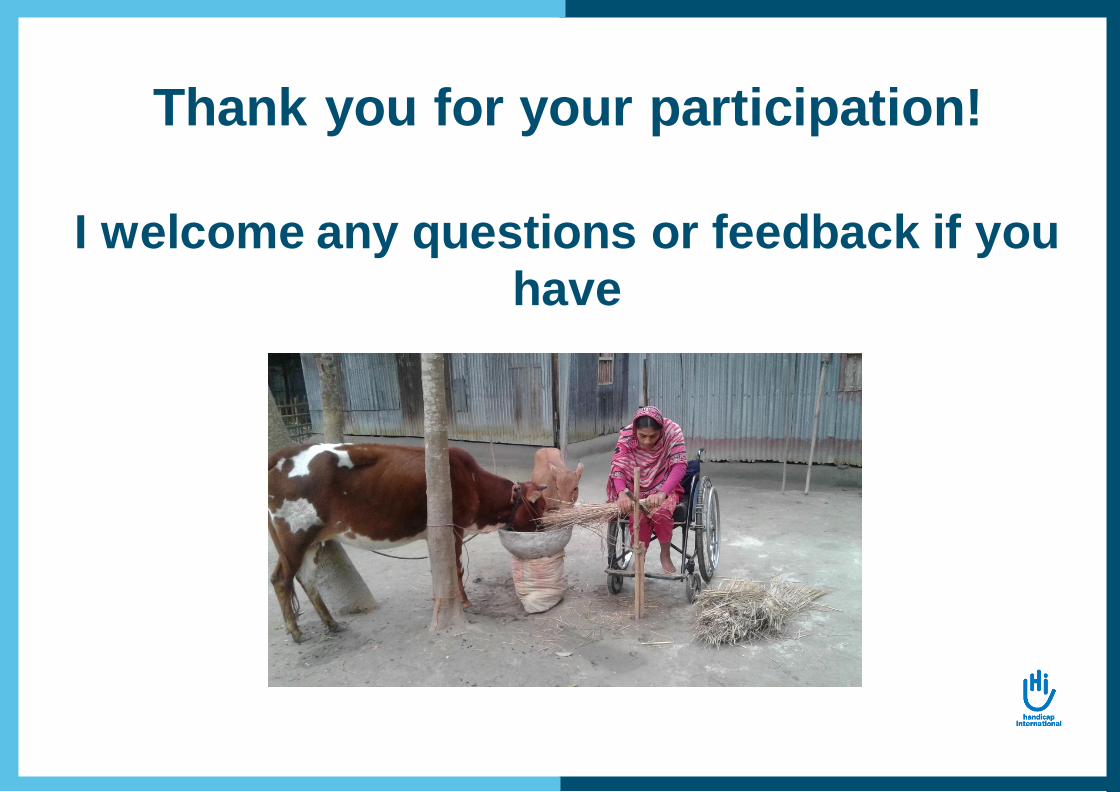
Thank you for your participation!
I welcome any questions or feedback if you
have


