study to evaluate the effectiveness of lighting system by...
TRANSCRIPT

Study to evaluate the effectiveness of lighting
system by using LED technology in Commercial
buildings A dissertation submitted to the Department of Energy
Technology, Royal Institute of Technology, Sweden for the
partial fulfilment of the requirement for the Degree of Master of
Science in Engineering
By
U A S K EDIRISINGHE
2012

i
Study to evaluate the effectiveness of lighting system by using
LED technology in Commercial buildings
By
U A S K EDIRISINGHE
2012
University of Vocational Technology
Sri Lanka
This thesis is part of the fulfillments of M.Sc. in Sustainable
Energy Engineering
Local supervisor
Prof. Kapila Goonasekara
KTH Supervisor
Dr. Peter T Kjaerboe

ii
Declaration
The work submitted in this thesis is the result of my own investigation, except where
otherwise stated.
It has not already been accepted for any other degree and is also not being concurrently
submitted for any other degree.
…………………….
U A S K Edirisinghe
Date:…27-01-2013…………………
We/I endorse declaration by the candidate.
………………………. ……………………………
Prof. Kapila Goonasekara Dr. Peter T Kjaerboe
Date:……11-02-2014……………… …………………………….
Master of Science Thesis EGI 2010:
Study to evaluate effectiveness of
lighting system by using LED technology
in Commercial buildings
U A S K EDIRISINGHE
Approved
Examiner
Supervisor
Peter Kjaerboe
Commissioner Contact person

iii
Study to evaluate effectiveness of lighting system by using LED
technology in commercial buildings
Abstract
Solid-state lighting (SSL) products including light-emitting diodes (LEDs) have been receiving
considerable attention because they are thought to offer many potential advantages over
conventional lighting technologies. One such advantage is energy savings derived from the
lower wattage source. However, energy savings is only one measure of effectiveness of an
installation. The quantity and quality of illumination and project cost effectiveness are also
important. This study evaluates all aspects of an installation to determine the overall suitability
of an LED product substitution, including energy savings, illumination quality, cost-
effectiveness, human performance and waste disposal.
This study evaluated LED product designed to directly replace linear fluorescent lamps (most
commonly “T8” linear lamps) in commercial ambient lighting. These LED product was among
the best brand of locally produced by LED company of Sri Lanka at the time of the study. In
addition the selected company has adequate accredited laboratory facilities to test their products
qualitatively and quantitatively.
The power consumption per unit area was reduced up to 60% for LED lighting system
comparing with fluorescent lighting. The average power consumption is 23 w for a one set of
T8 linear LED fixture and 38 w for T8 linear fluorescent. As per the manufacture specification
the power factor was recorded as 0.52 for fluorescent and 0.54 for LED. Though the power
factor is not considerable differences the efficacy of the LED system was recorded 82%. The
lighting level of the working plane at 00 degree of vertical angle was given as 370 lux ±12 for
LED lamp and 144 lux ± 44 for fluorescent lamp. The lighting level of the 300 degree and 60
0
degree vertical angle was indicated around 365 lux for LED lamp and 100 lux for fluorescent
lamp. That shows the lighting level of the LED is meeting with required standard (IESNA)
which has been given the range 250-450 lux for study area and office environment. But the
florescent lighting was in below level. The range of detected correlated colour temperature is
6000K – 6500K for both lamps.
In this study more than 65% of the population was voted to positive feedback for LED
lighting system considering the human performance factors such as visibility, mood
effect, visual health, colour appearance and work performance.
In the economic analysis, Capital recovery ration is around 0.40 and the rate of return
was indicated as 25.2% for LED lighting system. Though the initial investment is
higher than florescent lamp, the maintenance cost and replacement cost is negligible for
first five years due to long shelf life period recorded as 35000 hours.

iv
In this study shows that CO2 emission factor of the LED lamps could be reduced up to
60% compared to fluorescent lamps. As per the computation of LED lamp disposals were
not harmful to the environment and the amount of emitting greenhouse gases were significantly
less comparing with other lighting systems. Fluorescent lamps when discarded have more
potential to emit toxic gases to the environment but solid state LED lamps have not
given harmful or toxic substances to the ecosystem. When Fluorescent lamps needs to
be replaced two times within a five year period due to burnout unlike LED lamps.
Eventually considering above factors the LED lamps can be recommended as efficient
and eco-friendly lighting systems for illumination domestic and commercial level
building. Further improvement of power factor and quality factors are needed in future.

v
Acknowledgments
I wish to express my sincere appreciation to Professor Torsten H. Fransson Head, Department
of Energy Technology for expanding the DSEE programme to Sri Lanka and pave the way for
us to explore the world of sustainable energy engineering, and awarding me a scholarship to
carry out the thesis work at KTH, Sweden. I am grateful to the rest of the Staff of DSEE
programme of Sweden who extended their services to the maximum to make this endeavor a
successes.
This task would have been a dream, if not for the support given by, my course Coordinator, Mr.
Ruchira Abeyweera, Department of Electrical Engineering (Mechanical Engineering), The
Open University of Sri Lanka. The constructive feedback, the knowledge imparted, and help
given to successful completion of the project.
I gratefully acknowledge my supervisor at KTH Dr. Peter T Kjaerboe, for his sense of
understanding, supervision and guidance provided in completing the task. It is my great
pleasure to acknowledge the continuous guidance and the kindness extended towards me in
guiding me to the goal by Professor Kapila Goonasekara , the local supervisor of the thesis. I
am deeply indebted to both of them.
I would like to specially thank Mr. Sujeewa Wijesinghe, CEO/Managing Director, Tritech
International (Pvt) Ltd. Perisyala, Ambepussa, Sri Lanka for helping me to provide LED lights
with laboratory facilities to this research. My appreciation goes to Mr. Thusan Dias, Managing
Director, Dias Engineering (Pvt) Ltd for providing technical measuring tools including lux
meter and power meter throughout the study period.
I also wish to thank Mr. Pubudu Kahandage, Lecurer (Agri. Engineering) University of
Rajarata, Sri Lanka who gave continuous moral support by reviewing my thesis writing.
I would like to mention special appreciation to Ms. Malkanthi Thenabadu, Lecturer,
Agriculture & Food Technology, UNIVOTEC for giving support in various ways as a good
friend. My special thanks to the students of the degree programs for their student feedback for
success in this endeavor.
My special thanks are for Assistant Professor .Jeevan Jayasooriya, KTH, Sweden and Ms.
Chamindie Senarathene, Coordinator, KTH, Sweden for their concern and the encouragement
during the course work activities. My task would have not been fruitful if not for the immense
support given by my friends and colleagues.

vi
Last but not least, my wife Piumi for bearing with me during portfolio preparation period and
her constant understanding and moral support which gave me ample courage and confidence to
accomplish my goals successfully.

vii
Table of Content
List of figures ix
List of tables x
List of appendixes xi
List of abbreviations xii
Chapter 1.0 Introduction 01
1.1 Objectives 05
1.1.1 Research problem 05
1.1.2 Aims and scope 05
Chapter 2.0 Literature Review 07
2.1 Fluorescent lamps 08
2.2 LED lamps 11
2.3 The shape of visual performance 18
2.3.1 Visual comfort 19
2.3.2 Color characteristics 19
2.4 Uniformity of lighting 20
2.4.1 Glare 21
2.4.2 Veiling reflections 21
2.4.3 Shadows 22
2.4.4 Flicker 22
2.5 Psychological aspects of light 22
2.5.1 Non-visual aspects of light 23
2.6 Lighting and productivity 23
Chapter 3.0 Methodology 25
3.1 Location of the study 26
3.1.1 University of Vocational Technology 26
3.1.2 Commercial bank 27
3.2 Installation of LED 28
3.2.1 UNIVOTEC 28
3.2.2 The bank 31
3.3 Determination of power consumption 33
3.3.1 UNIVOTEC 34
3.3.2 Bank 36

viii
3.4 Determine the human performance under LED and T8 fluorescent
lighting systems 37
3.5 Economic analysis 39
3.6 Determine whether LED technology can successfully replace with
Fluorescent lighting system 39
Chapter 4.0 Results 41
4.1 Power consumption & the load factor of the study area 41
4.1.1 Determination of lighting levels of LED & Fluorescent lamps 41
4.2 Determine the human performance under LED and fluorescent lighting 44
4.2.1 Visibility comparison 44
4.2.2 Comparison of Mood effects 45
4.2.3 Visual health comparison 46
4.2.4 Color appearance 47
4.2.5 Work performance 48
4.2.6 Preference level about lighting condition 48
4.2.7 Preference to stay/work under the lighting 49
4.2.8 Feeling sleepiness 50
4.3 Economic analysis of LED comparing with fluorescent 51
4.4 Determine whether LED technology can successfully replace with
Fluorescent system 52
Chapter 5.0 Discussion and Conclusion 54
6. References 57

ix
List of figures
Figure 01; The development of luminous efficacies of light sources 08
Figure 02: Comparison of tube diameter of different fluorescent lamps 10
Figure 03: Components of a typical light-emitting diode (LED) 15
Figure 04: Commercial Bank and their branches in Sri Lanka 28
Figure 05: Vertical view of line diagram with fixtures in the library 30
Figure 06: Vertical line diagram of the class room at UNIVOTEC 31
Figure 07: Installation diagram of lighting fixtures in the library of UNIVOTEC 32
Figure 08: Designed light beams after installation of lamps at UNIVOTEC library 33
Figure 09: AC & DC digital power meter 33
Figure 10: Selected marking points of library to measure lighting levels 34
Figure 11: Digital light meter 35
Figure 12: Selected marking points of class room to measure lighting levels 36
Figure 13: Designed conceptual frame work to measure human performance 38
Figure 14: Feeling sleepiness under the LED lamp 50
Figure 15: Feeling sleepiness under the fluorescent lamp 51

x
List of Tables
Table 01: The range of luminous efficacies for different artificial light sources 12
Table 02: Available closed indoor spaces of UNIVOTEC Premises
during study period 29
Table 03: Power consumption with different luminaries in a library area 41
Table 04: Lighting level of Fluorescent and LED lamps under 00 degree angle (LA) 42
Table 05: Lighting level of Fluorescent and LED lamps under 300 degree angle (LA) 42
Table 06: Lighting level of Fluorescent and LED lamps under 600 degree angle (LA) 42
Table 07: Lighting level of Fluorescent and LED lamps under 00 degree angle (CR) 42
Table 08: Lighting level of Fluorescent and LED lamps under 300 degree angle (CR) 43
Table 09: Lighting level of Fluorescent and LED lamps under 600 degree angle (CR) 43
Table 10: Responses about visibility of LED lamps 44
Table 11: Responses about visibility of Fluorescent lamps 44
Table 12: Responses about mood effect of LED lamps 45
Table 13: Responses about mood effect of Florescent lamps 45
Table 14: Responses about visual health of LED lamps 46
Table 15: Responses about visual health of Florescent lamps 46
Table 16: Responses about color appearance of LED lamps 47
Table 17: Responses about color appearance of Florescent lamps 47
Table 18: Responses about work performance of LED lamps 48
Table 19: Responses about work performance of Florescent lamps 48
Table 20: Responses about preference giving for LED lamps 49
Table 21: Responses about preference giving for Florescent lamps 49
Table 22: Responses about feeling to stay/work under the LED lamps 49
Table 23: Responses about feeling to stay/work under the Florescent lamps 50
Table 24: Rate of Return analysis of LED lamp and Fluorescent lamp 51
Table 25: Cost/ benefit analysis for professional use-60 months 52

xi
Annexes
Annex 01 Formulas to determine power & lighting design 62
Annex 02 Lighting levels under two different lamps and vertical angles 66
Annex 03 Designed questionnaire about human performance 78
Annex 04 Life cycle assessment criteria for lighting system 79

xii
Abbreviations
CEB - Ceylon Electricity Board
CR - Class Room
FL - Fluorescent
IESNA - Illuminating Engineering Society of North America
LA - Library Area
LAK/Rs/LKR - Sri Lankan Rupees currency
LED - Lighting Emit Diode
ROR - Rate of Return
UNIVOTEC - University of Vocational Technology
$ - United states Dollar currency

1
Chapter 1.0 Introduction

2
1.0 Introduction
While technological and industrial progress has developed the quality of our lives, it has
considerably increased global energy consumption, from 7 billion toe (tonne of oil equivalent)
in 1980 to 12 billion toe in 2010 (IEA, 2012). By way of aggregating levels of greenhouse
gases in the atmosphere and the reducing of traditional energy resources, a more energy-
efficient methodology is required.
Sri Lanka is an island, lies on the Indian tectonic plate, in the Indian Ocean southwest of
the Bay of Bengal, between latitudes 5° and 10°N, and longitudes 79° and 82°E. It has no
proven fossil fuels but very recently has found some evidence in part of the Gulf of Mannar
region. Comprised of a total landmass of 65,610 square kilometers, Sri Lanka is home to a
population of 20 million.
Sri Lanka‟s energy sources consist primarily of biomass, hydro-electricity and petroleum that
contribute to 47%, 8% and 45% of total energy respectively. In the power sector, the installed
capacity for electricity generation from hydro, thermal and wind power presently stands at
2,407 MW, compared to 1,409 MW in 1999. 80% of the households are enjoying the grid
connected electricity while another 2% of households are provided with basic electricity
connection through off-grid systems. The demand for electricity is estimated to rise at an
annual pace of 8% - 10%. Per capita consumption of electricity meanwhile reflected 394 kWh
/ person per annum in 2006.
The present hydropower energy sources are being exploited to its maximum capacity. Sri
Lanka is greatly dependent on energy imports especially in the electricity and transport sector.
Next 15 years the only fuel option for thermal generation the country‟s electricity industry has
with regards to base-load operation is coal. The installed capacity of electricity is 2684 MW
and the peak demand is around 1800 MW (www.ceb.lk).
Sri Lanka, with relatively poor contribution of renewable energy sources and unexplored
fossil fuel sources, has well recognized the barriers with respect to commercial energy
consumption.
The recent supply disruptions in the international crude oil market followed by the speeding
up prices of crude oil have prompted policy makers in oil importing countries to face the
challenge of coping with higher oil prices (International Energy Agency, 2005). Thus, Sri
Lanka is also a victim of the higher oil prices in the international market due to its high

3
dependence on petroleum imports. The increasing demand for petroleum products for
electricity generation, transportation, industrial production and domestic needs has made the
Sri Lankan economy more vulnerable to oil price shocks. Further, in spite of the increasing
crude oil prices in the world market, the demand for petroleum products has observed an
increasing trend while aggravating the problem to the government with the increasing cost on
energy subsidies.
The problems facing the energy sector are many such as high cost and price of electricity. The
cost of producing and delivering electricity exceeds 14 LKR/kWh = 0.125$/kWh (CEB
statistical report 2010). The average price of electricity is presently 10.75 LKR/kWh =
0.1$/kWh, while being high, is grossly inadequate even to cover the recurrent costs of supply.
The average electricity consumption per capita is 449Kwh/person in 2010 (CEB statistical
report 2010), that is an increase of 8.7% compared with 2009.
For thousands of years, people depended on mainly on daylight and fire. The fundamentals of
lighting at that time were related to the quantity of light that was to provide light for people to
see and manage in the visual environment also during the dark hours. Light is a natural
phenomenon vital to our reality. At the beginning of a wide range of electric light sources
means we are now less dependent upon light from the sun, moon and stars and flames from
combustible fuels.
For the time being, the incandescent lamp was invented by Edison in 1882, artificial lighting
has explored three phases such as incandescent lamp, neon light, and discharge lamp, and it
has been progressing towards the fourth phase like semiconductor lighting, especially white
LEDs. White LEDs are already being used in numerous applications like traffic signals,
electronic & electrical appliances, mobile phones and full-color video displays. White LEDs
are supposed to be the gorgeous „„green lighting source of the 21st century‟‟ and show wide
usages and considerable potential market (Gee, 2004, Mueller,2000 and Xianjie,2002).
Currently, LEDs are entering the lighting market and as new light sources they enable
new methodologies to lighting design and practice. LEDs introduce new opportunities for
modifying the color of light and compared to conventional light sources they are small in size
giving also freedom for luminaire design.
Today, the variety and number of lighting equipment manufacturers has grown, but
the fundamentals of lighting remains the same. These are to supply enough light with proper
lighting distribution in space, with good spectral qualities and no glare, with reasonable
costs. The development of light sources and lighting equipment meets the lighting quality

4
demands. Lighting quality is depends on several factors. It depends largely on people‟s
expectations and past experiences of electric lighting.
Concerning of power utilization, 20% of the world's electricity that is generated is used for
lighting (http://www.wired.co.uk/news/archive/2011-10/21/eds-solar-energy-consumption),
mainly in buildings and exterior applications. But Sri Lanka, around 30% of the total
electricity production is used for lighting. Therefore finding a different kind of solution to
maximize the energy efficiency is a timely necessity. According to that lighting is one way of
crucial factor of sharing the electricity consumption. Especially most public and private sector
organizations use lighting during daytime for their day to day activities. Most researchers
have emphasized energy saving systems in different areas which are many ways to measure
the „greening‟ of a building and associated benefits.
A number of different approaches have been suggested to define lighting quality (Bear
and Bell 1992, Loe and Rowlands 1996, Veitch and Newsham 1998, Boyce and Cuttle 1998).
The lighting is based on 50% fact and 50% psychology (Veitch, 2001). Thus, lighting quality
is much more than just providing an appropriate quantity of light. Other factors that are
possible contributors to lighting quality include such as illuminance uniformity, luminance
distributions, light color characteristics and glare (Veitch and Newsham 1998). There are
many physical and physiological factors that can influence the perception of lighting
quality. Lighting quality cannot be expressed simply in terms of photometric measures
nor can there be a single universally applicable technique for good quality lighting (Boyce
2003, Veitch 2001).
The quality, quantity and concentration of light around us expressively affect our visual
appreciation of outer environments. It is significant for us to understand the relationship
between light, colour, what we see and how we see it. The special persistence of lighting
installations is to allow people to satisfactorily fulfill physical or visual tasks, and the
effectiveness of performing these tasks correlates to the quantity and the quality of the
environment. In the real world lighting setting up should be considered primarily for the
comfort of the occupants. The task efficiency, energy efficiency and aesthetic value of the
lighting installation a secondary consideration. However, the importance of energy efficiency
is greatly increased with issues such as climate change and energy pricing, which all impact in
our community. Thus, more efficient lighting offers potentially large savings in energy and is
closely related to the performances of its control electronics.

5
1.1 Objectives
The general objective is to carry out feasibility study on utilizing LED lighting to replace
fluorescent lighting in commercial buildings and to compare human performance under those
lighting conditions.
The specific objectives of this study are to;
Determine the power consumption & the load factor of the buildings
Determine the human performance under LED and existing lighting systems
Economic analysis of LED in comparison with Fluorescent lighting
Determine whether LED technology can successfully replace the existing lighting
system
1.1.1 The research problem
LED lighting system is currently very popular artificial luminaire among the other systems in
the world. But in Sri Lanka, most of the existing lighting systems are used linear and compact
fluorescent luminaires. Though very few medium scale level and small scale level
manufactures engage to produce LED lights, no such prepared standards for LEDs. Therefore
it is difficult to measure and select required lighting parameters of all produce. Considering
those factors, comparison of environmental, technical and economical parameters of LED
lighting with other existing systems are very essential to find a better solution.
1.1.2 Aim and scope
Study scope
The goal of this study was to calculate, examine and compare the luminous performance,
human performance and cost of LED and conventional (linear fluorescent, compact
fluorescent and incandescent) lighting systems in the context of the most common luminaire
uses in the present environment.
Study conditions
The luminaire types examined in this study account for the majority of the luminaries used in
university premises:
In this study, aims to introduce LED lighting system and determine the performance and
sustainability of the new system.
Hypothesis
Application of LED lighting system may reduce electricity consumption significantly.

6
Chapter 2.0 Literature Review
7
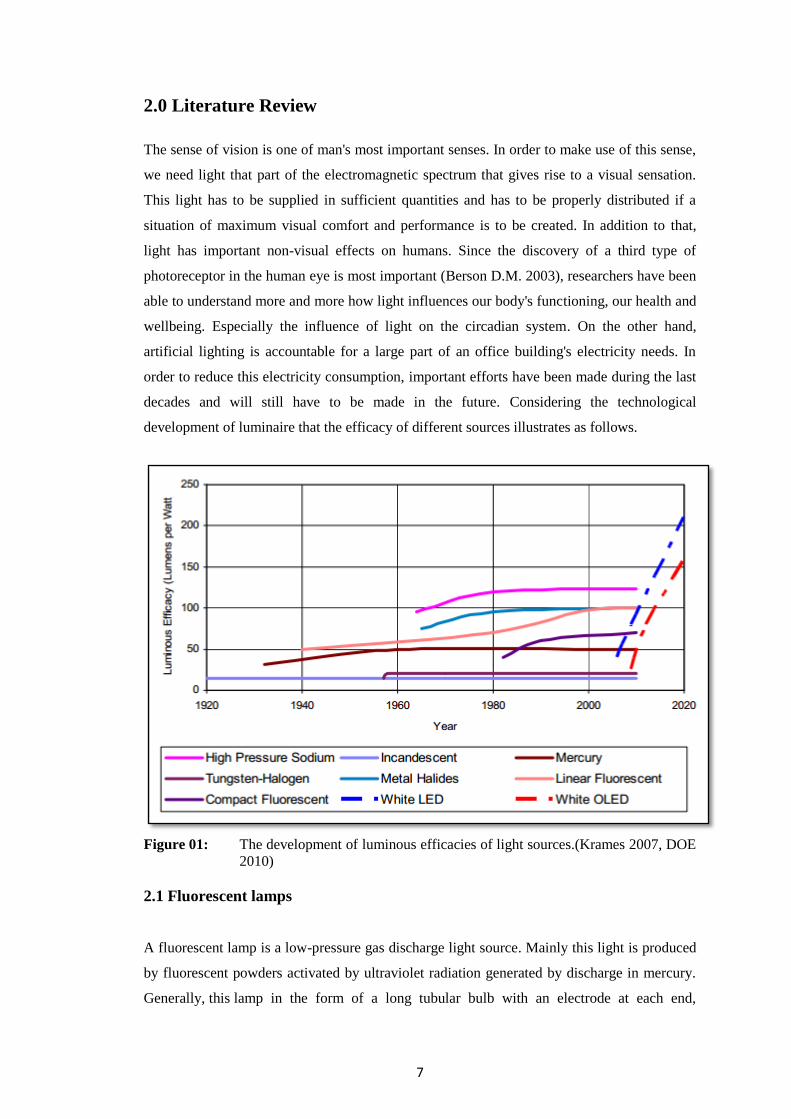
2.0 Literature Review
The sense of vision is one of man's most important senses. In order to make use of this sense,
we need light that part of the electromagnetic spectrum that gives rise to a visual sensation.
This light has to be supplied in sufficient quantities and has to be properly distributed if a
situation of maximum visual comfort and performance is to be created. In addition to that,
light has important non-visual effects on humans. Since the discovery of a third type of
photoreceptor in the human eye is most important (Berson D.M. 2003), researchers have been
able to understand more and more how light influences our body's functioning, our health and
wellbeing. Especially the influence of light on the circadian system. On the other hand,
artificial lighting is accountable for a large part of an office building's electricity needs. In
order to reduce this electricity consumption, important efforts have been made during the last
decades and will still have to be made in the future. Considering the technological
development of luminaire that the efficacy of different sources illustrates as follows.
Figure 01: The development of luminous efficacies of light sources.(Krames 2007, DOE
2010)
2.1 Fluorescent lamps
A fluorescent lamp is a low-pressure gas discharge light source. Mainly this light is produced
by fluorescent powders activated by ultraviolet radiation generated by discharge in mercury.
Generally, this lamp in the form of a long tubular bulb with an electrode at each end,

8
contains mercury vapor at low pressure with a small amount of inert gas for starting. About
95% of the emission occurs in the ultraviolet (UV) region and the wavelengths of the main
emission peaks are 254 nm and 185 nm. Hereafter, this UV radiation is converted into light
by a phosphor layer on the inside of the tube. Subsequently one UV-photon generates only
one visible photon, 65% of the initial photon energy is lost as dissipation heat.
According that reason, the final spectral distribution of emitted light can be fluctuated by
different combinations of phosphors. Correlated Color Temperatures (CCT) vary from 2700
K (warm white) and 6500 K (daylight) up to 17 000 K. The Color Rendering Indices (CRI)
vary from 50 to 95. The luminous efficacy of the latest T5 fluorescent lamp is up to 100
lm/W (without ballast losses). Dimming is possible down to 1% of the normal luminous flux,
and with special high voltage pulse circuits down to 0.01%.
A linear fluorescent lamp is a low-pressure, mercury vapor discharge source consisting of a
tubular glass bulb with a sealed base and electrode at each end. The electrodes are coated with
a material that, when heated upon lamp starting, emits electrons that establish a current across
the lamp. Ultraviolet (UV) energy generated by the mercury arc irradiates the phosphor
coating on the inner bulb wall, which in turn converts UV radiation to radiation in the visible
spectrum. Linear fluorescent lamps are omnidirectional sources; that is, they emit light in all
directions.
Although fluorescent lamps are available in numerous lengths, diameters, and configurations,
this report focuses on commonly used 4-ft-long tubular lamps of 8/8-in. diameter (T8).
Fluorescent lamps also are broadly categorized by phosphor type and color appearance. In
contrast, T8 lamps use rare earth phosphors in a triphosphor blend, to combine light
corresponding with primary colors into white light, in a broad range of nominal Correlated
Color Temperature (CCT) values. Although more costly, triphosphor lamps offer higher
luminous efficacy, better lumen maintenance, and better color rendering than traditional
halophosphor lamps.
Because of the negative voltage-current characteristics of Fluorescent lamps is required a
device to limit the lamp current. Else the ever-increasing current would destroy the lamp.
Pure magnetic (inductive) ballast needs an additional starting element. Electronic control
gear combines all the equipment necessary for starting and operating a fluorescent
lamp. Compared to conventional magnetic ballasts which operate lamps at a line frequency of
50 Hz (or 60 Hz), electronic ballasts generate high frequency currents, most commonly in the
range of 25-50 kHz.
9
Lamp–ballast systems also are characterized by lamp circuit types, which describe the lamp
starting method. The method and frequency of lamp starting are important because the
emissive coating on lamp cathodes is diminished with each starting cycle, resulting eventually
in lamp failure. For general interior lighting, the two most common lamp circuit/ballast types
are rapid start – The rapid-start ballast provides low voltage to heat the lamp cathodes before
applying higher starting voltage, and it continues to provide cathode heating voltage during
normal lamp operation. Continued cathode heating is not required for normal lamp operation,
so the associated ballast power draw is considered lost. However, preheating the lamp
cathodes decreases the required starting voltage and cathode wear, allowing for more starting
cycles and/or extending lamp life.
Instant start- The instant start ballast provides a high initial voltage to start the lamp without
preheating the cathodes. This starting method degrades the lamp cathodes more quickly than
do rapid start systems: however, eliminating the power draw for cathode heating typically
makes instant start systems more efficient.
Fluorescent lamp–ballast systems can be “tuned” for light output and energy usage through
specification of an appropriate Ballast Factor (BF), which in simplest terms is the fraction of
rated lamp lumens (lm) that a particular lamp–ballast combination will produce. Currently, T8
electronic ballasts are available with BF values from less than 0.72 to as high as 1.20.
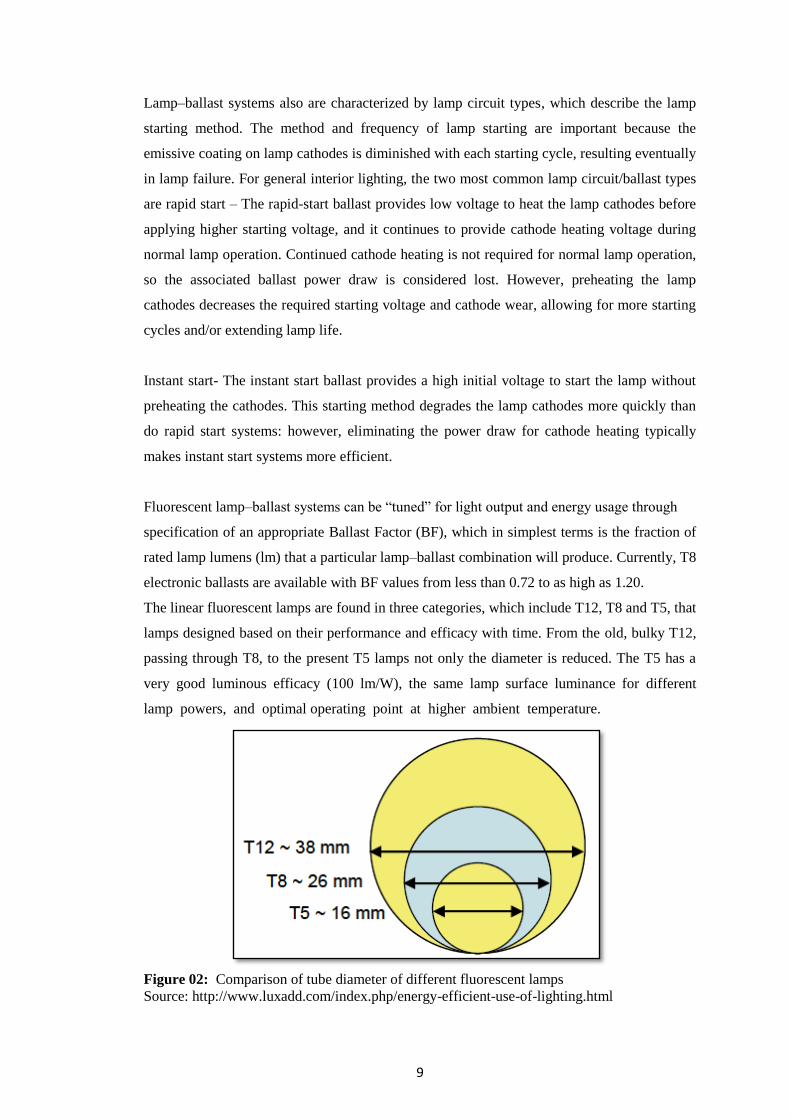
The linear fluorescent lamps are found in three categories, which include T12, T8 and T5, that
lamps designed based on their performance and efficacy with time. From the old, bulky T12,
passing through T8, to the present T5 lamps not only the diameter is reduced. The T5 has a
very good luminous efficacy (100 lm/W), the same lamp surface luminance for different
lamp powers, and optimal operating point at higher ambient temperature.
Figure 02: Comparison of tube diameter of different fluorescent lamps
Source: http://www.luxadd.com/index.php/energy-efficient-use-of-lighting.html

10
The performance of a fluorescent lamp is sensitive to the ambient temperature. T5 lamps
perform best at the ambient temperature of 35°C, and T8 lamps at 25°C.
2.2 LED Lamps
Though the solid state Lighting is generally referring to lighting with Light Emitting Diodes
(LED) at present there is no found to official definition for solid state lighting. Commonly the
“solid state” refers to the semiconductor crystal where charge carriers are following and
originate photons after radiative recombination.
Operation principle and light generation
LED is a p-n junction semiconductor which emits light certainly form electroluminescence
effect. LEDs work similarly to a semiconductor diode, permitting current flow in one
direction only. The diode structure is formed by transporting p- and n-type semiconductor
materials together in order to form a p-n junction. P-type material is gained by doping an
intrinsic semiconductor material with acceptor contaminations resulting in an additional
of positive charges. To produce an n-type semiconductor, donor impurities are used to create
an excess of negative charges. The p and n materials will obviously form a diminution region
at the junction, which is collected of ionized acceptors in the p-side and ionized donors in the
n-side creating a possible barrier at the junction. The applied exterior electric field crosswise
the junction will permit electrons in the conduction band, which are more moveable carriers
than holes, to rise enough energy to cross the gap and recombine with holes on the
other side of the junction emitting a photon as a result of the decrease in energy from
the conduction to the valence band.
Although radiative transitions can also take place in indirect bandgap semiconductors, their
possibility is considerably lower than in direct gap semiconductors. Radiative recombinations
are features for direct band gap semiconductors. Therefore, direct bandgap semiconductor
alloys are regularly used in optoelectronic devices such as LEDs, where the highest
radiative recombination rates are a anticipated characteristic. Most of the direct bandgap
semiconductors that have bandgap energies within the visible spectrum are binary alloys
composed of elements in the groups III and V of the periodic table. The contemporary high-
brightness LED-industry is based on ternary and quaternary alloys containing a mixture
of aluminum (Al), gallium (Ga), and/or indium (In) cations and either one of arsenic (As),
phosphorus (P), or nitrogen (N) anions. The three main relevant material systems for
LEDs are AlGaAs, AlGaInP, and AlInGaN. As per the Zukauskas, Shur et al, 2002 are

11
mentioned each of these systems bandgap engineering is used during the epitaxial growth of
the semiconductor wafers to create heterostructures that are required for high levels of carrier
injection and efficient radiative recombination.
Theoretically, it is probability that all free electrons injected into the active region of
recombine to generate a photon. This suggests the high energy efficiency potential of LEDs.
This energy efficiency potential is denoted to as radiant efficiency e. That efficiency is
defined as the ratio between the total emitted radiated power and the total power drawn from
the power source. The radiant efficiency of an LED depends on several internal mechanisms
regulating light generation and emission processes in the semiconductor and LED package.
These mechanisms are commonly categorized by their efficiencies, ordinarily referred to as
feeding efficiency f, external quantum efficiency ext, injection efficiency inj, radiative
efficiency or internal quantum efficiency rad and optical efficiency or light-extraction
efficiency opt. (Žukauskas, Shur et al. 2002).
In 2009, Robert Lingard indicated that fluorescent and high-intensity discharge (HID) light
sources cannot function without ballast. The ballast provides a starting voltage and limits
electrical current to the lamp. Similarly, LEDs require a power supply (commonly called a
“driver”). The power supply converts line (AC) power to the appropriate DC voltage
(typically between 2 and 4 volts DC for high-brightness LEDs) and current (generally 200-
1000 milliamps, mA), and may also include supplementary electronics for dimming and/or
color correction control.
Presently available LED drivers are typically about 85% efficient. So LED efficacy should be
discounted by 15% to account for the driver.
Light source Typical luminous efficacy range in lm/w
(varies depending on wattage & lamp
type)
Incandescent (no ballast) 10-18
Halogen (no ballast) 15-20
Linear fluorescent (incl ballast) 50-100
Compact fluorescent (CFL) (incl ballast) 35-60
Metal halide (incl ballast) 50-90
Cool white LED->4000K (incl driver) 60-92
Warm white LED ->4000K (incl driver) 27-54
Table 1: The range of luminous efficacies for different artificial light sources
(Source: Robert Lingard;2009)
Luminous efficacy and color rendering are two important characteristics of light sources for
general lighting CIE (1995). Color rendering is a property of a light source that shows how

12
natural the colors of objects look under the given illumination. If color rendering is poor, the
light source will not be useful for general lighting CIE (1995). The main driving force for
solid-state lighting is the potential of huge energy savings on the national or global scale.
Thus, when considering spectra of light sources for general illumination, another important
aspect to consider is luminous efficiency. The luminous efficiency of a source is determined
by two factors: the conversion efficiency from electrical power to optical power and the
conversion factor from optical power to luminous flux. The latter is called luminous efficacy.
As is well known, luminous efficacy and color rendering are determined solely by the
spectrum of the source.
A light emitting diode (LED) is a semiconductor light source. LEDs are used as indicator
lamps in many devices, and are increasingly used for lighting. Introduced as a practical
electronic component in 1962 by Nick Holonyak who was a father of the light emitting diode,
early LEDs emitted low intensity red light, but modern versions are available across the
visible, ultraviolet and infrared wavelengths, with very high brightness.
Electroluminescence was discovered in 1907 by the British experimenter H. J. Round of
Marconi Labs, using a crystal of silicon carbide and a cat's whisker detector. Russian Oleg
Vladimirovich Losev independently reported on the creation of a LED in 1927. Rubin
Braunstein of the Radio Corporation of America reported on infrared emission from Gallium
Arsenide (GaAs) and other semiconductor alloys in 1955. Braunstein observed infrared
emission generated by simple diode structures using Gallium Antimonide (GaSb), GaAs,
Indium Phosphide (InP), and Silicon Germanium (SiGe) alloys at room temperature and at 77
kelvins.
By the time of mid 70s‟ other colours had joined red, including yellow, orange and green.
However, the efficiency and light output was still very poor. Between 1970 and 1995, the
light output of red LEDs increased by a factor of approximately 45 and between 1995 and
2003 the efficiency of LEDs increased by an average factor of 16 and the light output per
LED package by a factor of 430. The net result is that today LEDs have the efficiency and
light output to be considered for many varied applications including traffic signals and signs,
large area videos displays and switch illumination. Since 2005, further developments have
seen a rapid growth in the use of LEDs for higher levels of illumination.
At the heart of every LED there is a very small piece of semi-conducting material called the
LED ‘die”. The die can be considered in the same way as the filament in a lamp, because it
is the die that produces the light. The size of a high power LED die is approximately a 1mm

13
cube and for other LED types much smaller. The base of the die is glued or soldered into a
fine metal framework (the lead frame). A very fine wire called a bond wire is attached to the
top of the LED die, which has a very fine conductive metal pattern. The wire is attached to the
other side of the lead frame. When electricity of the correct voltage and polarity is applied to
the LED via the lead frame contacts, current flows through the die and the LED produces
light of a specific colour. LEDs can be thought of as mini-luminaires. The packaged product
can contain a built-in reflector and lens, coloured filters and scattering materials. Individual
LEDs are called discrete LEDs.
LEDs are discrete semiconductors that produce a narrow-band emission which, depending on
the chemical compound, can emit energy in the ultraviolet (UV), visible, or infrared regions
of the electromagnetic wavelength spectrum. To produce white light for general illumination
applications, either the narrow spectral emission from LEDs must be converted into white
light or two/ more discrete LED light outputs must be mixed together.
White light LED devices are generally based on one of three approaches for producing a
distribution of visible wavelengths that are supposed as “white light”. These are: phosphor-
conversion LEDs (pcLED), discrete color-mixing; or a hybrid method (DOE, 2012b).
Phosphor-conversion LEDs create white light by merging a portion of the blue light emitted
directly from the chip with light emission down-converted by a phosphor from the blue part
of the spectrum to other colors. Discrete color-mixing, on the other hand, starts with discrete
colored sources and uses color mixing optics to merge together the light output to create white
light emission. The hybrid method uses a combination of phosphor-conversion LEDs and
discrete-colored LEDs to create the desired light output.
Other two methods of producing white light emission that may include an approach based on
homoepitaxially grown Zinc Selenide (ZnSe) on a ZnSe substrate that emits blue light from
the active region & yellow light from the substrate (Chang, 2007) and quantum dots that
achieve the light wavelength down shift within the visible spectrum (Salisbury, 2005).
Today, the majority of white light LEDs in production are phosphor converting LEDs based
on Gallium-Nitride, emitting blue light between 450-470 nm (DOE, 2011). This blue light
excites a yellow phosphor, usually made of Ce3+:YAG crystals that have been converted into
a powder. As the LED chip emits blue light, some is emitted directly through the phosphor
and some is converted by the phosphor to a broad spectrum centered around 580 nm (yellow)
by the Ce3+:YAG. This yellow light stimulates the red and green receptors in the human eye,
resulting in a mix that gives the appearance of white light.

14
The pcLED approach, developed by Nichia, was first marketed by them in 1996 as a white-
light LED. This approach has since been adopted by numerous other manufacturers as a
method for producing white light, and constitutes the most common approach today.
Depending on the phosphors used, and whether those phosphors are mounted in the LED
package or located remotely, there can be improvements made in the light quality and
efficiency of the phosphor. While improvements in phosphor technology will yield benefits to
the performance overall, the losses associated with absorbing blue light and down-converting
it to other wavelengths such as green, yellow and red, establish a limit to the ultimate
efficiency of the LED system.
Discrete color-mixing of LED light emissions avoids the need for phosphors, and therefore
promises to offer the highest efficacy LED device. The principal advantage of the color-
mixing method is that it does not involve phosphors, thereby eliminating phosphor conversion
losses in the production of white light.
Figure 03: Components of a typical light-emitting diode (LED)
Source: http://continuingeducation.construction.com/crs.php?L=223&C=947
The third method is a hybrid approach that combines pc-LEDs and colored-light
emission LEDs into the same luminaire, producing the desired white light output.
Some manufacturers are combining pc-LEDs with high (cool-white) correlated color
temperature3 (CCT) emission with several yellow and red-light emitting LEDs to
create a lower (warm-white) CCT. According to that new finding process, the discrete
color-emitting LEDs are used to change cool-white CCT to a warm-white CCT. The
efficacy of this hybrid system will be higher than a pc-LED system, but lower than a

15
color-mixing system, and will be proportional to the relative share of light output of
the LEDs used in the hybrid system. These LEDs can have a range of resultant CCT
values, depending on the types and amounts of phosphor used. The most common
approach used in white light LEDs today for general illumination applications are the
blue-light emitting phosphor converting LEDs.
Visual comfort is also highly dependent on the application, for example lighting that
is considered comfortable in an entertainment setting may be disliked and
regarded as uncomfortable in a working space (Boyce 2003). The light quality can
be determined according to the level of visual comfort and performance required for
our activities. It can also be assessed on the basis of the pleasantness of the visual
environment and its adaptation to the type of room and activity. This is the
psychological aspect. There are also long term effects of light on our health, which are
related either to the strain on our eyes caused by poor lighting, or to non-visual
aspects related to the effects of light on the human circadian system (Brainard et al.
2001, Cajochen et al. 2005).
The definition that seems most generally applicable is that lighting quality is
given by the extent to which the installation meets the objectives and constraints
set by the client and the designer (Boyce 2003). In this way lighting quality is
related to objectives like enhancing performance of relevant tasks, creating
specific impressions, generating desired pattern of behavior and ensuring visual
comfort.
The effect of lighting on vision is the most obvious impact of light on humans. With
light we can see, without light we cannot. Any stimulus to the visual system can be
described by five parameters: visual size, luminance contrast, colour difference,
retinal image quality and retinal illumination. These parameters are important in
determining the extent to which the visual system can detect and identify the stimulus.
The direction of the effect is such that the larger the visual size, the higher the
luminance contrast, the greater the colour differences, the better the retinal image
quality and the higher the retinal illumination, the faster and finer will be the
performance of the visual system. It is interaction between the characteristics of the

16
task and the amount, spectrum and distribution of the lighting of the task that
determines what level of performance is achieved.
Lighting conditions can also affect human performance through the circadian system.
The most obvious evidence for the existence of a circadian system in humans is the
occurrence of the sleep/wake cycle, but this is only the tip of the iceberg. Beneath the
surface lie the variations in many different hormonal rhythms over a twenty-four hour
period. Lighting conditions over twenty-four hours, specially the light-dark cycle are
major factors in determining the state of the circadian system and that itself will
influence the performance of all tasks, not just visual tasks. How lighting conditions
might affect human performance through the circadian system has grown rapidly in
recent years. There are two distinct effects: a shifting effect in which the phase of the
circadian rhythm can be advanced or delayed by exposure to bright light at specific
times (Dijk, et al.,1995); and an acute effect related to the suppression of the hormone
maelatonin at night (Campbell et al.,1995). Both these effects can be expected to
enhance human performance in the right circumstances. Attempts have been made to
use the phase-shift to more quickly adapt people to night shift work. These attempts
have met with mixed success, the problem being that to get the required shift, it is
necessary to control exposure to light over 24 hours, not just during working hours
(Eastman et al.,1994). As for the acute effect, there is clear evidence that exposure to
bright light increases at night (Badia et al.,1991) and that this can enhance the
performance of complex cognitive tasks (Boyce et ai.,1997).
The third route whereby lighting conditions can affect human performance is through
the perceptual system. The perceptual system takes over once the retinal image has
been processed by the visual system. The output of the perceptual system that is most
likely to change the observers‟ mood and behavior, particularly if work is prolonged,
is a sense of discomfort. Lighting conditions in which achieving a high level of visual
performance is difficult will be considered uncomfortable as will conditions in which
the lighting leads to distraction from the task as can occur when glare and flicker are
present. But perception is much more sophisticated than just producing a feeling of
visual discomfort. In a sense, every lighting installation sends a “message” about the
people who designed it, who bought it, who maintain it, and about the place it is
located. Observers interpret the „message‟ according to the context in which it occurs

17
and their own culture, preference and expectations. The importance of this “message”
is sometimes enough to override conditions that would be considered extremely
uncomfortable in an office are positively desired in a dance club. According to that
the “message” is, the observer‟s mood and behavior can be changed.
2.3 The shape of visual performance
Visual performance varies with the size and contrast of detail in the task, and the
retinal illuminance provided by the lighting. The shape of visual performance is a
compressive function, in that for a wide range of sizes, contrasts and retinal
illuminces there is little change in performance, but when any of these factors gets
low enough, performance deteriorates dramatically. This shape is known as the
“plateau and escarpment” of visual performance.
The questionnaire was prepared based on the conceptual framework of technology
and model of effective factors for determining the human performance. Visual
performance is defined by the speed and accuracy of performing a visual task (CIE
1987) and visual performance models are used to evaluate the interrelationships
between visual task performance, visual target size and contrast, observer age and
luminance levels (CIE 2002). Light levels that are optimized in terms of visual
performance should guarantee that the visual performance can be carried out
well above the visibility threshold limits. Visual performance is improved with
increasing luminance. Yet, there is a plateau above which further increases in
luminance do not lead to improvements in visual performance (Rea and Ouellette
1991, CIE 2002). The visual performance aspect and consumption of electricity for
lighting should be in balance in order to increase energy efficiency, not of course,
forgetting the lighting quality aspects. Ensuring adequate and appropriate light
levels (quantity of light) is only an elementary step in creating comfortable and
good-quality luminous and visual environments. It can be agreed that bad quality
lighting does not allow people to see what they need to see and/or it can
cause visual discomfort. On the other hand, lighting that is adequate for visual tasks
and does not cause visual discomfort is not necessarily good-quality lighting. Also,
depending on the specific application and case, both insufficient lighting and too
much light can lead to bad-quality lighting.
18
2.3.1 Visual comfort
There are a number of lighting-related factors that may cause visual discomfort
and there is no straight-forward path to follow in creating visually comfortable
luminous environments (Boyce 2003, Veitch 1998). The current indoor lighting
recommendations give ranges of illuminance values for different types of rooms
and activities (EN12464-1 2002, CIBSE 1997, IESNA 2000). In addition,
guidelines on light distribution in a space, the limitation of glare, and the light
color characteristics are given. Attention also needs to be paid to the elimination of
veiling reflections and to the formation of shadows in the space. The
recommendations and guidelines concern mainly the elimination of visual discomfort,
but lighting designer can add on that to provide visual comfort. Causes of visual
discomfort can be too little light and too much light, too much variation in
luminous distribution, too uniform lighting, annoying glare, veiling reflections, too
strong shadows and flicker from light sources.
2.3.2 Colour characteristics
The color characteristics of light in space are determined by the spectral power
distribution (SPD) of the light source and the reflectance properties of the
surfaces in the room. The Correlate Color Temperature (CCT) and general Color
Rendering Index (CRI) are the properties used to describe light sources. The color
appearance of a light source is evaluated by its correlated color temperature
(CCT). The CRI of the CIE measures how well a given light source renders a
set of test colors relative to a reference source of the same correlated color
temperature as the light source in question (CIE 1995). The general CRI of the
CIE is calculated as the average of special CRIs for eight test colors. The higher the
general CRI, the better is the color rendering of a light source, the maximum value
being 100. The CIE general CRI has its limitations. The shortcomings of the CRI
may become evident when applied to LED light sources as a result of their
peaked spectra. The CIE (CIE 2007) recommends the development of a new
color rendering index, which should be applicable to all types of light sources
including white LEDs.

19
The Kruithof effect describes the psychological effects of preferences for
varying CCT and illuminance level. It proposes that low CCTs are preferred at low
illuminances, and high CCTs are preferred over high illuminances (Kruithof 1941).
The Kruithof effect is not, however, generally supported in later studies (Boyce and
Cuttle 1990, Davis and Ginthner 1990). It is also suggested that color adaptation
occurs when people spend certain time in a space, after which it is no more possible to
compare lamps with different CCT. It is obvious that the color temperature
preferences of people are culture and climate-related, as well as dependent of the
prevailing lighting practices in different regions (Miller 1998, Ayama et al. 2002).
Recently, it has been suggested that high color. Temperature light could be used in
increasing human alertness. More research is needed to confirm this and to apply
these postulates in lighting design.
2.4 Uniformity of lighting
Uniformity of lighting in space can be desirable or less desirable depending on the
function of the space and type of activities. A completely uniform space is usually
undesirable whereas too non-uniform lighting may cause distraction and discomfort.
Lighting standards and codes usually provide recommended illuminance ratios
between the task area and its surroundings (EN12464-1 2002, CIBSE 1997,
IESNA 2000). Most indoor lighting design is based on providing levels of
illuminances while the visual system deals with light reflected from surfaces i.e.
luminances. For office lighting there are recommended luminance ratios between
the task and its immediate surroundings (EN12464-1 2002, CIBSE 1997,
IESNA 2000). Room surface reflectance is an important part of a lighting
system and affect both the uniformity and energy usage of lighting. Compared
to a conventional uniform office lighting installation with fluorescent lamps,
LEDs provide opportunities to concentrate light more on actual working areas and to
have light where it is actually needed. This provides opportunities to increase the
energy efficiency of lighting in the future.
2.4.1 Glare
Glare is caused by high luminance or excessive luminance differences in the visual
field. Disability glare and discomfort glare are two types of glare, but in indoor

20
lighting the main concern is about discomfort glare. This is visual discomfort in
the presence of bright light sources, luminaries, windows or other bright surfaces
(CIE 1987, Boyce 2003). There are established systems for the evaluation of the
magnitude of discomfort glare, e.g. Unified Glare Rating (UGR) (EN12464-1
2002), Visual Comfort Probability (VCP) (IESNA 2000), British Glare Rating
system (CIBSE 1997), yet the physiological or perceptual mechanism for
discomfort glare is not established. The present glare indices are best suitable for
assessing discomfort glare induced by a regular array of fluorescent lamp luminaries
for a range of standard interiors, and there are a number of questions related to their
application in practice. The possible problems are related to the definition of the glare
source size and luminance and its immediate background luminance (Boyce 2003).
LEDs are small point sources with high intensities and arrays of these individual
sources can form luminaires with very different shapes and sizes. In illuminating the
space with LEDs special care has to be taken to avoid glare.
2.4.2 Veiling reflections
Veiling reflections are specular reflections that appear on the object viewed and which
reduce the visual task contrast (CIE 1987). The determining factors are the specularity
of the surface and the geometry between the surface, observer and sources of high
luminance (e.g. luminaires, windows, bright walls). Glossy papers, glass surfaces
and computer screens are subject to cause veiling reflections. In rooms with
several computer screens inside the task area special care has to be taken in the
positioning of the luminaries to avoid luminous reflections from the screens. In using
portable computers the viewing directions may change in relation to the fixed
luminaires and this poses further requirements for lighting design. Also, when
rearranging the working places and geometry of the working conditions, the possible
causes of veiling reflections should be avoided in the typical viewing directions. With
proper lighting design, i.e. positioning of luminaires related to working areas, it
is possible to achieve the same visibility conditions with less energy than with
incorrect positioning of luminaires causing veiling reflections to the working area.

21
2.4.3 Shadows
Shadows in the space may be negative in obstructing the visibility of certain elements,
but they can also be positive in creating an attractive and interesting visual
environment. Whether shadows are considered as visually comfortable or
discomfortable depends much on the application.
A good balance between direct light and diffuse light is important in order to see the
way light falls on objects. In the quest for more parameters of lighting quality, it
is worthwhile to study the shadows of objects in a deeper way: the light side of an
object, the shadow side, the cast shadow and the presence of reflected light. This can
give more connections between scientific and artistic knowledge of lighting qualities.
Moreover, for the visual comfort in spaces it is necessary to pay more attention to the
shadowing, especially for the comfort of elderly people and visually impaired.
2.4.4 Flicker
Flicker is produced by the fluctuation of light emitted by a light source. Light
sources that are operated with ac supply, produce regular fluctuations in light
output. The visibility of these fluctuations depends on the frequency and modulation
of the fluctuation. Flickering light is mostly as a source of discomfort, except in some
entertainment purposes. For some people flicker can even be a hazard to health.
Flicker from light sources can be minimized by stable supply voltage or by using
high frequency electronic ballasts with fluorescent and high intensity discharge
lamps (EN12464-1 2002, CIBSE 1997, IESNA 2000).
2.5 Psychological aspects of light
The luminous environment is observed by eyes, but they process this information with
their brain. Light scenes are therefore judged in connection with references and
expectations. The luminous environment can be appreciated in many ways such as
more less attractive, more or less appropriate to the function of the space, more or less
agreeable. Variations of luminance and colors can strengthen attractiveness, trigger
emotions, and affect human activities and mood, the impact of lighting depending
much on the individuals and their state of mind. A lighting installation that does not
meet the user‟s expectations can be considered unacceptable even if it provides the

22
conditions for adequate visual performance. Undesirable lighting environments
may impact on task performance and thus productivity through motivation
(Boyce 2003, Gligor 2004).
2.5.1 Non-visual aspects of light
Light has also effects that are fully or partly separated from the visual system. These
are called the non-visual, non-image forming (NIF) or biological effects of light
and are related to the human circadian photoreception (Brainard et al. 2001,
Cajochen et al. 2005).
The discovery of the novel third photoreceptor, intrinsically photoreceptive
retinal ganglion cell (ipRGC), in 2002 has raised huge interest both in the
circadian biology and lighting research communities (Berson et al. 2002). The
ipRGC has been found to be the main photoreceptor responsible for entraining
humans to the environmental light/dark-cycle along with other biological effects. It
represents a missing link in describing the mechanism of biological effects as
controlled by light and darkness. Thus, light can be thought of as an external cue
that entrains the internal clock to work properly. The human biological clock drives
most daily rhythms in physiology and behavior. These include sleep/wake rhythm,
core body temperature, and hormone secretion. It passes on information
regulating the secretion of almost all hormones, including nocturnal pineal hormone
melatonin and serotonin, and cortisol. Besides the shifting of the phase of the
endogenous clock by light, there is evidence of the involvement of the ipRGCs
in pupillary reflex, alertness, mood, and in human performance (Dacey et al.
2005, Duffy and Wright 2005, Whiteley et al. 1998).
There is evidence that short-wavelength light is the most effective in regulating the
biological clock (Brainard and Hanifin 2006, Wright et al. 2001, Thapan et al.
2001). Thus much research is currently investigating the possibility to use blue
enriched light to affect human responses and behaviour like alertness and mood
(Gooley et al. 2003, Lehr et al. 2007, Mills et al. 2007, Rautkylä et al. 2009). The
effect of light on alertness has been much examined, but the mechanism
explaining the detected reactions still remains unclear.

23
The biological effects of light and their effects on human performance are not yet very
well known. A considerable amount of research work is still required before we can
understand the non-visual effects of light and consider them in lighting practice.
Research work is needed to generate an improved understanding of the
interaction of the effects of different aspects of lighting on behavioral visual
tasks and cortical responses and on how the biological effects of lighting could be
related to these responses.
2.6 Lighting and productivity
Lighting should be designed to provide people with the right visual conditions that
help them to perform visual tasks efficiently, safely and comfortably. The luminous
environment acts through a chain of mechanisms on human physiological and
psychological factors, which further influence human performance and productivity
(Gligor 2004).

24
Chapter 3.0 Methodology

25
3.0 Methodology
3.1 Location of the study
A sample of one educational institute and one banking sector organization was
selected for this study for representing two services sectors. University of Vocational
Technology was selected as an educational sector and the Commercial Bank (Wattala
Branch) for banking sector.
3.1.1 University of Vocational Technology (UNIVOTEC)
University of Vocational Technology of Sri Lanka is a unique organization to cater
the higher education (Degree and Post-graduate level) and industry based training
programs for the Technical and Vocational Education and Training (TVET) sector. As
a show case of the green building concept, university management is planning to
improve energy efficiency and minimizing cost of electricity. The monthly average
electricity consumption is 32,250 KWh per month that cost around US$ 7600
(800,000LKR).
As per the categorization of Sustainable Energy Authority, this university belongs to
medium scale service organizations, in which the organization with monthly energy
bill ranging from LKR 500,000/= to LKR 1,200,000 (Guide book-Sri Lanka National
Energy Efficiency Award, 2013 & www.energy.gov.lk/pdf/guide book award 2012). The
cost of energy is shared around 20% of the monthly expenses. The university is in its
development stages as such new buildings will be added to meet space requirements
which will significantly increase the electricity consumption in the future. The
operating hours of the university is ranged from 8.00 to 18.00 during week days and
weekends in the office premises and other residential areas of the on campus students
are operated more than 15 hours per day.The indoor lighting system consists of T8
linear fluorescent lamps and some parts of the buildings with compact fluorescent
lamps (CFL). Considering the current situation of the lighting system, the fluorescent
and CFL are used mostly for indoor lighting of the university. Most indoor lights are
switched on during day time therefore the electricity consumption of the lighting
system may significantly affect the total energy consumption. Alternative lighting

26
system could be used to improve energy efficiency and minimize the cost of energy
consumption.
3.1.2 Commercial Bank
The commercial Bank of Ceylon, which began its operations with a single branch in
the 1920s, is one of the leading commercial banks in Sri Lanka with 232 branches and
the workforce around 3350. It has been rated Best bank in Sri Lanka by Global
Finance for the 14th
successive year. According to the categorization of Sustainable
Energy Authority of Sri Lanka, the bank could be included large scale service
organization with with monthly energy bill of more than LKR 1,200,000/=, (Guide
book-Sri Lanka National Energy Efficiency Award,2013 &
www.energy.gov.lk/pdf/guide book award 2012).
For this study, one of a branch situated in Wattala was selected, which open weekdays
including weekends 10.00a.m. to 7.30p.m. in Sri Lankan local time, which is nine and
half hour duration of operation. In this branch works 18 number of staff members.
This branch and most of the branches use T8 linear fluorescent and compact
fluorescent bulbs for lighting. The study area of the bank was covered about 4000
square feet (36m2).Basically under area of working plane 3ft X 3ft coverage there
were fixed 110 numbers of LED lamp with fixtures considering the required lighting
level of an office.
But the determination of human performance was only measured by using a
questionnaire due to security reason and decision taken by their management
regulations.

27
Figure:04 commercial Bank and their branches in Sri Lanka
Source:http://www.combank.lk/newweb/annualreports_html/data/sustainability_supplement/our_profile.html
3.2 Installation of LED
3.2.1 UNIVOTEC
Manageable area is selected for experiment considering time frame and the initial
investment of this study. Currently the UNIVOTEC has building blocks mentioned as
follows. Out of all the closed indoor surfaces, I selected two sample rooms. One is
belong to study area of the library in Old Building (Block B) and other one is class
room No 03 of New building (block A-second floor).

28
Table: 02 Available indoor space of UNIVOTEC Premises during study period
The relevant measurement of selected area of particular buildings, which including
length, width, height, height of work plane, height of room cavity and height of
ceiling cavity was taken initially. Then, lumen method formula was used to determine
the average illuminance in the selected area (See Annex 01).
The length and width of the selected section in the library are 95‟(28.9m) and 38‟
(11.6m) respectively, which is covered around 3610 square feet (335.2m2) of the
entire area. The space to be fixed in luminaries was considered based on 36 square
feet (3.3m2) per luminary that included two lamps per luminary and same power line
used to connect all the luminaries of the particular area. Moreover, the selected class
room of the new building block also measured length, width and height before
installing the luminaries. Based on that criteria 100 LED lamps were installed in
selected area and other part (reference section) of the library area almost same in the
study area (which also all the measurements are same as selected part). T8 linear 48”
fluorescent lamps were fixed into the recessed direct lighting fixtures (ceiling
mounted) of the room cavity area in the library.
# Description Floor Numbers
Office
room
Lab Lecture
room
Library Rooms
1 New Admin building
(Block A)
Ground
floor
05 04
1st floor 06 06
2nd
floor 06 03 03
3rd
floor 05 03
2 Old building (Block B) Ground
floor
06 06 02
1st floor 48 04 07
3 CEC building (Block
C)
Ground
floor
03
1st floor 04
4 New hostel (Block D) Ground
floor
05 10
1st & 2
nd
floor
20
5 Old hostel (Block E) Ground
floor
1st & 2
nd
floor
30
6 Canteen (Block F) 04 03
7 Four story building
(Block G)
Under construction

29
Figure: 05 Vertical line diagram with fixtures of Study area of library
The selected class room (CR 03) was taken the relevant measurement and other three
class room capacities also same as the selected room. Other rooms capacities also
almost same as selected one. Length and the width of this class room are 39‟(11.8m)
and 15‟(4.5m) respectively. But the ceiling height is not presence; therefore the
ceiling cavity would be zero. The typical vertical diagram of the class room is given
bellow (Figure 06). But the lighting fixtures were not recessed; therefore class rooms
haven‟t ceiling cavities. The vertical diagrams of the class room with lighting fixture
as shown Figure 06.

30
Figure: 06 Vertical line diagram of the class room in UNIVOTEC
Numbers of eight (08) fixtures were fixed in the class room as shown figure no 06,
which is included two lamps per fixture.
3.2.2 The Bank
The length and width of the selected room cavity of the commercial bank, Wattala
branch 100‟ and 40‟ respectively, which is covered about 4000‟ square feet (335.5m2)
of the entire area. The space to be fixed in luminaries was considered based on 36
square feet (3.3m2) per luminary that included two lamps per luminary and same
power line used to connect all the luminaries of the particular area. In addition to that,
the working area of the bank also measured length, width and height before installing
the luminaries. Based on that criteria 110 LED lamps were installed by covering
entire area, which has included two (02) lamps per fixture.

31
Figure 07: Installation diagram of lighting fixtures in the library of UNIVOTEC

32
Figure 08: Designed light beams after installation of lamps UNIVOTEC
library
3.3 Determination of power consumption
After install the lighting lamps, the consumption of power in each unit was measured
using AC & DC digital power meter (Everfine –PF9802) two times per day (morning and
evening) for two weeks.
Figure 09: AC & DC digital power meter

33
3.3.1 UNIVOTEC
After installing the required LED linear lamps in recessed fixtures in the library, the
thirty (30) sampling points were selected as follows.
For determining the power consumption, the first two rows of the lamps fixtures
(thirty lamps) were selected and checked the consumed power of each fixture of
lamps by using power meter in 9.00am and 4.00pm continuously two weeks of the
time. Each row was consisted fifteen fixtures as shown in Figure 09.
For T8 fluorescent tube bulbs also measured the consumed power in library and the
class room like above practicing procedure. This amount of power consumption was
taken with lamp + ballast current. At the beginning of installation was checked power
separately without ballast and with ballast in T8 fluorescent tube bulbs. On the above
selection procedure was used to measure fixed T8 Fluorescent lamps section in the
library and both sections of class rooms in the university.
Figure: 10 selected marking points of library to measure lighting levels in the
unit of lux
34
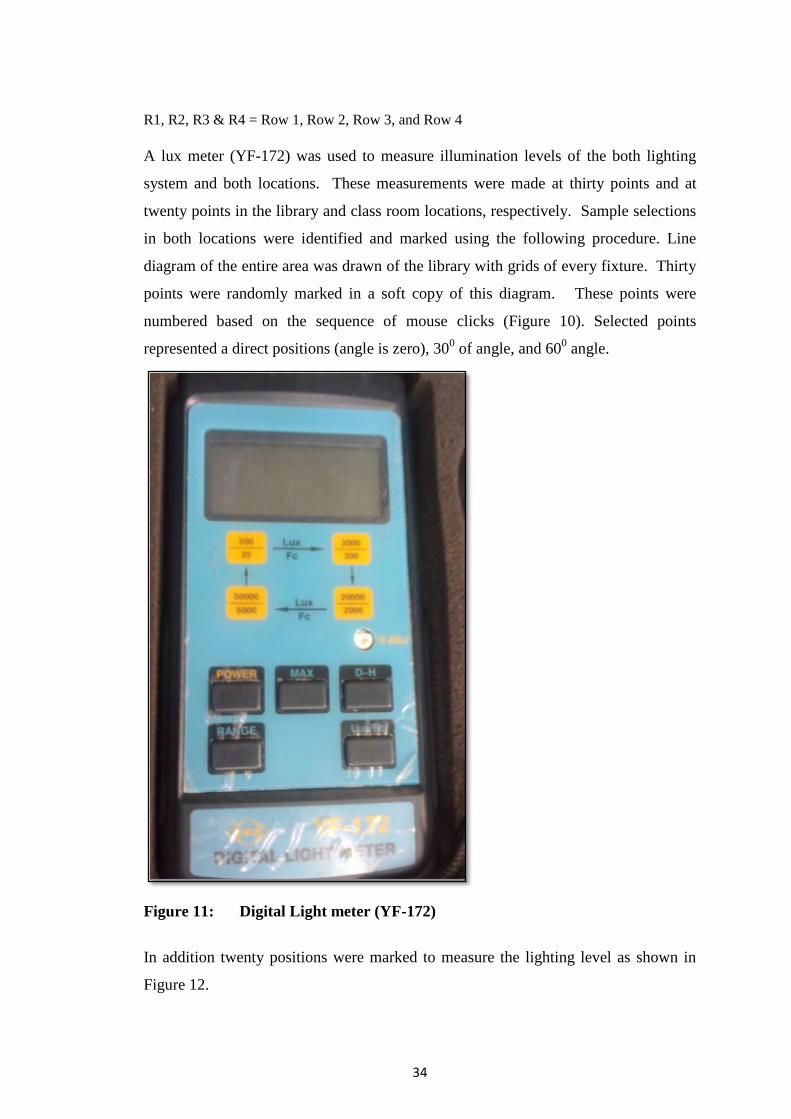
R1, R2, R3 & R4 = Row 1, Row 2, Row 3, and Row 4
A lux meter (YF-172) was used to measure illumination levels of the both lighting
system and both locations. These measurements were made at thirty points and at
twenty points in the library and class room locations, respectively. Sample selections
in both locations were identified and marked using the following procedure. Line
diagram of the entire area was drawn of the library with grids of every fixture. Thirty
points were randomly marked in a soft copy of this diagram. These points were
numbered based on the sequence of mouse clicks (Figure 10). Selected points
represented a direct positions (angle is zero), 300 of angle, and 60
0 angle.
Figure 11: Digital Light meter (YF-172)
In addition twenty positions were marked to measure the lighting level as shown in
Figure 12.

35
Figure: 12 selected marking points of class room to measure lighting levels at
UNIVOTEC
3.3.2 Bank
In the floor of bank building also applied same procedure to get power consumption
in the lighting system. Before installing the T8 linear 4ft LED lighting this branch
had used T8 linear fluorescent. The management of the bank has decided all the
fluorescent lamps replacing with T8 LED lights. Therefore the power consumption
of the all the existing lighting system was measured at one time. After that,
consumed power for LED lighting system was measured once a week for a three
months period continuously, which data gathered from the Tritech International
(Pvt) Ltd who is the supplier and producer of LED linear (4‟) four feet LED
lighting. Data related to human performance for both lighting conditions was
collected from all staff members of that branch by using prepared questionnaire. But

36
other lighting level measurement was not taken due to restriction and rules and
regulations of the management of the bank.
3.4 Determine the human performance under LED and T8 fluorescent
lighting systems
Whilst there were several concepts and frameworks used to determine human
performance out of those I selected one of the best conceptual framework expressed
by the Boyce & Rea in 2001 which was setting out the routes by which lighting can
influence human performance. The arrows indicate the direction of the effects
(Boyce and Rea, 2001). Therefore the following conceptual frame work was
designed.
There are three routes by which lighting conditions can influence the performance
of individuals: through the visual system, through the circadian system and through
the perceptual system. The capabilities of the visual system are determined by the
lighting conditions. The state of the circadian system is influenced primarily by the
light dark cycle. The message delivered by the perceptual system is influenced by
many factors, lighting being just one of them.
The questionnaire was prepared based on that designed and randomly selected more
than 30 students & university staff members. In addition to that the other
questionnaire was given all the staff members of the bank.

37
Figure 13: Designed conceptual frame work to measure human performance
(Boyce and Rea, 2001)
For determination of productivity performance that I selected to use the Hawthorne
Studies which were conducted from 1927-1932 at the Western Electric Hawthorne
Works in Chicago, where Harvard Business School Professor Elton Mayo examined
productivity and work conditions. Participant were selected from students who are
attending the library from 8.00 to 11.00 (first three hours) during day time for a one
week. Moreover, employees of the university were also selected. Prepared
questionnaire was given to selected population for gathering data about human
performance factors.

38
3.5 Economic analysis
For determination of economic factors the following formulas were selected to
measure Capital recovery ratio (was described comparing with fluorescent)
include manufacture recommended lifetime.
C= P/A Capital recovery ratio (P/A) = Initial investment / Uniform annual benefits
Rate of Return (ROR)
Return on invested capital is defined as the interest rate earned on the
unrecovered project balance of an investment project. It is commonly known
as internal rate of return. For LED a light investment was analyzed using the
following equation.
ROR= P/A = {(1+i)n-1}/i( 1+i)
n
3.6 Determine whether LED technology can successfully replace the existing
lighting system
To test the validity of the above all factors, mainly power consumption, human
performance and economic analysis were used to determine the final outcome
of this project. Non parametric analysis and their correlations were measured
using SPSS package software for both lighting conditions.

39
Chapter 4.0 Results

40
4. Results
4.1 Power consumption & the load factor of the study area
Comparing power consumption between T8 LED lamps and Fluorescent lamp with
in a one unit area of the building space, a reduction of 40% was observed when LED
lighting was used as illustrated in Table 03.
Table:03 Power consumption with different luminaries in a library area.
Power consumption of the class room (area =52.65m2 (4.5 m x 11.7 m) was also
recorded 6.0w per m2 and 3.6w per m
2 for fluorescent and LED lamps respectively.
According to manufacturer specifications of the T8 LED lamps correlated color
temperature was given 6500K that is cool white color and the T8 linear fluorescent
was given 6000K-6500K range. The efficacy of the one unit was recorded 5900lm for
T8 fluorescent and 900lm for LED lamps without fixing parabolic Troffers. But after
fixing the troffers the efficacy was considerably noted as very low for fluorescent
lamp. But the value of efficacy in the LED was recorded as 90% in the working plane
of the library. In the classroom is not troffer type fixtures and ceiling height also. In
class room section, the efficacy values were indicated higher than the library area.
4.1.2 Determination of lighting levels LED and Fluorescent lamps
The Table 04 illustrates the lighting levels of fluorescent and LED lamps under zero
angle of the working plane. As per the following data that the lighting level of LED is
higher than the fluorescent lamp, which is approximately two times of higher than the
fluorescent.
T8 Fluorescent lamp T8 LED Lamp
Power consumed within an
hour
2000w
(20w x 100 nos)
1200w
(12w x 100 nos)
Power consumed per 1 m2 for
lighting
6.0w
(2000w/335.2m2)
3.6w
(1200w/335.2m2)

41
Table: 04 Lighting level (lux) of Fluorescent and LED lamps under 00
degree angle (library area)
point # 5 7 14 17 19
Lux LED 344 338 341 338 340
Lux FL 124 130 134 125 128
Table 05 indicates that the lighting levels of 300 degree angle in both types of lamps
did not show a significant variation among them when compared with 00 degree
angle. But the difference between LED lamp and the fluorescent lamp levels appeared
considerably high.
Table: 05 Lighting level (lux) of Fluorescent and LED lamps under 300
degree angle (library area)
There was no change in lighting level of 600 angle in the LED lamps but fluorescent
lamps recorded the lowest lighting levels compared with other two angles as illustrated
in Table 06. All measures indicated a value close to 100 lux in florescent lamps.
Table: 06 Lighting level (lux) of Fluorescent and LED lamps under 600
degree angle (library area)
Lighting levels of three different angles in both lamps shows a gradually decrease.
Table: 07 Lighting level (lux) of Fluorescent and LED lamps under 00
degree vertical angle (Class room)
As per the table no 07, the average lighting level was measured as 340 lux for LED
lamp and 128 lux for fluorescent lamps.
Point # 4 6 8 12 13 18
Lux LED 338 338 338 338 338 338
Lux FL 122 120 118 121 119 118
Point # 1 2 3 9 10 11 15 16 20
Lux LED 336 329 323 310 333 325 328 326 330
Lux FL 103 102 102 101 102 102 107 107 103
Point # 5 7 17 19
Lux LED 344 338 338 340
Lux FL 124 130 134 128

42
Table: 08 Lighting level (lux) of Fluorescent and LED lamps under 300 degree
vertical vertical angle (Class room)
On the above table indicates that average lighting level is 338 lux for LED lamps and 120
lux for fluorescent lamp.
Table:09 Lighting level (lux) of Fluorescent and LED lamps under 600 degree
angle (Class room)
Under this angle the average lighting level was given as 327 lux for LED and 103 lux for
fluorescent lamp.
Point # 4 6 8 12 13 18
Lux LED 338 338 338 338 338 338
Lux FL 122 120 118 121 119 118
Point # 1 2 3 9 10 11 15 16 20
Lux LED 336 329 323 310 333 325 328 326 330
Lux FL 103 102 102 101 102 102 107 107 103

43
4.2 Determine the human performance under LED and fluorescent lighting
systems
Under the measuring criteria of human performance the following attributes were
considered for both types of lamps.
4.2.1 Visibility comparison
Table: 10 Responses about visibility of LED lamps
Table 10 shows that a majority (75%) of the population considered level for visibility
of LED lamps as excellent. Table 11 shows that a majority (66%) of the population
rated fluorescent lamps in the good visibility category and only 2.5% rated in the
very poor visibility.
Table: 11 Responses about visibility of Fluorescent lamps

44
4.2.2 Comparison of Mood effects
Considering mood effects those who were mostly considered as excellent under the
LED lamp as given in Table 12. Others mentioned good and very good conditions.
No one has responded condition as very poor.
Table: 12 Responses about mood effect of LED lamps
Of those responded 72.5% considered mood effects of the fluorescent lamps good and
only 25% of those responded as not bad (Table 13).
Table: 13 Responses about mood effect of Florescent lamps

45
4.2.3 Visual health comparison
Majority of those responded that the visual health condition of LED lamps as
very good and excellent level (Table 14).
Table: 14 Responses about visual health of LED lamps
Table: 15 Responses about visual health of fluorescent lamps
Table 15 shows that no one has responded to visual health of fluorescent
lamps as excellent.

46
4.2.4 Color appearance
The color appearance of people and furnishings under the LED lamps were
majority recorded in excellent marking points as per the table 16 and figure
24. No one has given very poor or bad condition
Table: 16 Responses about color appearance of LED lamps
.
As shown by Table 17 more than 50% of the responded rated colour
appearance of fluorescent lamps good with only 1 responding as very good.
Table: 17 Responses about color appearance of fluorescent lamps
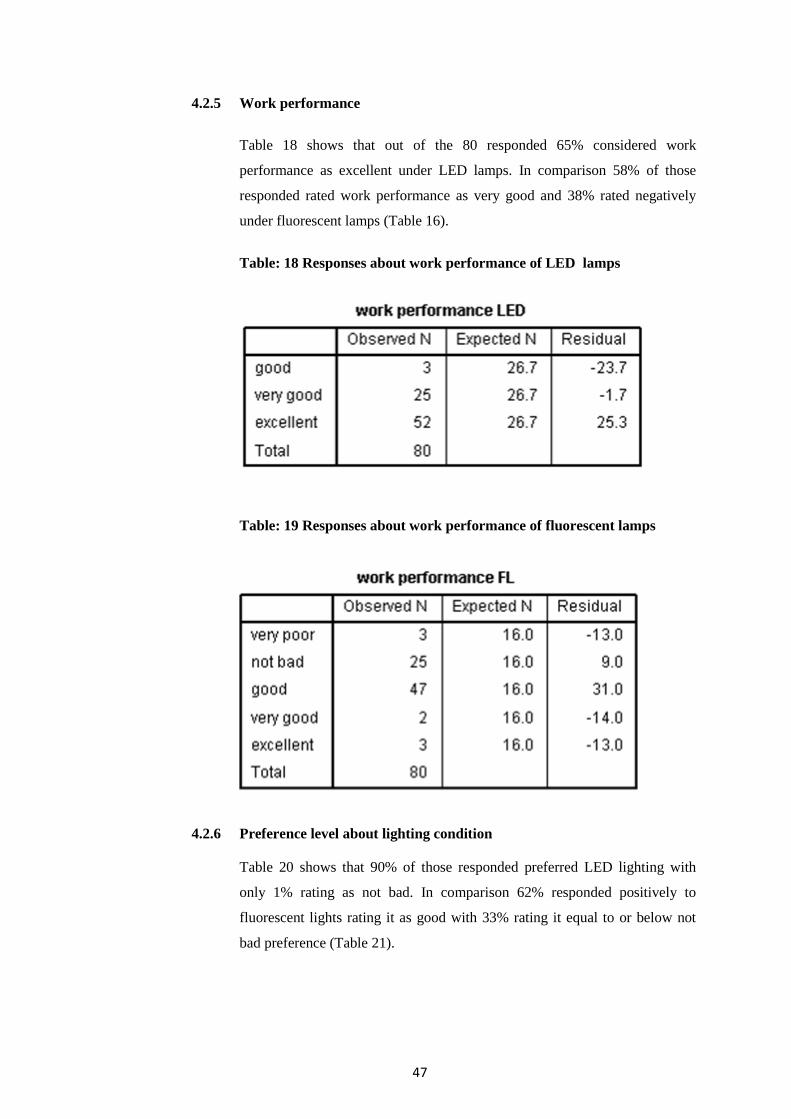
47
4.2.5 Work performance
Table 18 shows that out of the 80 responded 65% considered work
performance as excellent under LED lamps. In comparison 58% of those
responded rated work performance as very good and 38% rated negatively
under fluorescent lamps (Table 16).
Table: 18 Responses about work performance of LED lamps
Table: 19 Responses about work performance of fluorescent lamps
4.2.6 Preference level about lighting condition
Table 20 shows that 90% of those responded preferred LED lighting with
only 1% rating as not bad. In comparison 62% responded positively to
fluorescent lights rating it as good with 33% rating it equal to or below not
bad preference (Table 21).

48
Table: 20 Responses about preference giving for LED lamps
Table: 21 Responses about preference giving for fluorescent lamps
4.2.7 Preference to stay/work under the lighting
Tables 22 and 20 show the response of preference to work under LED lamps
and fluorescent lamps respectively. All those responded (100%) show
positive preference to work under LED lighting in comparison to fluorescent
lights. Whereas 20% and 72% preferred fluorescent lights as not bad and
good respectively (Table 20).
Table: 22 Responses about feeling preference to stay/work under the
LED lamps

49
Table: 23 Responses about preference to stay/work under the fluorescent
lamps
4.2.8 Feeling Sleepiness
Figure 14 and 15 show the sleepiness feeling under LED lamps and
Fluorescent lamps respectively. , around 95% of the population was given no
sleepiness mood take place working under the LED lighting condition.
Figure: 14 Feeling sleepiness under the LED lamp

50
Figure: 15 Feeling sleepiness under the fluorescent lamp
Figure 15 shows that 75% of the population indicated sleepiness under the
fluorescent lighting condition.
4.3 Economic analysis of LED comparing with Fluorescent Table: 24 Rate of Return analysis of LED lamp and Fluorescent lamp
01 US$= LAK 120
As shown by Table 24, the Rate of Return is 25.2% and the capital recovery ratio was
approximately 0.4. When compared with the usage of fluorescent lamp, LED lamp
has a profit of 25.2% of each year after recovery of capital cost.

51
4.4 Determine whether LED technology can successfully replace the existing
lighting system
Considering the cost of power consumption during a 60 months period, though the
total cost of fluorescent lamp power is lower than the incandescent lamp, LED lamp
recorded the lowest cost amounting to Rs. 1,532.16 ($ 12.76). Replacement of
fluorescent lamps occurred twice during this period which is not applicable in the
case of LED lamps due to their durability. Therefore the total cost is very low in the
case of LED lamps. Considering the CO2 emission factor after 60 months period LED
has the lowest value as 80.64 KgCO2 which is reduced up to 80% and 66% when
compared with the incandescent and fluorescent lamps respectively. LED lamps when
compared with fluorescent lamps reduced CO2 emissions by 30%.
Table: 25 Cost/ benefit analysis for professional use-60 months
# Incandescent T8-Fluorescent
linear tube
T8 LED
linear tube
1 No. of lamps 01 01 01
2 Lamp wattage 60 W 18 W 12 W
3 Avg lamp life 1,000h 8,000h 35,000h
4 Burning time in university,
7days a 8 hours
2688 h/year 2688 h/year 2688 h/year
5 Relamping cost Rs. 80 Rs. 1100 Rs.4500
6 Replacement costs/light
source
Rs. 200 Rs. 200 Rs. 200
7 Electricity cost (kWh) Rs.9.50 Rs.9.50 Rs.9.50
8 CO2 factor 0.5Kg
Co2/kWh
0.5Kg Co2/kWh 0.5Kg
Co2/kWh
9 Connected load (with ballast) 0.06kW 0.020kW 0.012kW
10 Hours of operation after 60
months
13440 13440 13440
11 No. lamps required after 60
months
14 1.68 NA
12 Lamp replacement &
relamping costs
3920
[14*(200+80)]
2600
[2*(200+1100)]
NA
13 Power consumption after 60
months
806.4 kWh 268.8 kWh 161.28 kWh
14 Electricity cost after 60
months
Rs. 7660.80
($ 63.84)
Rs. 2253.60
($ 21.28)
Rs. 1,532.16
($ 12.76)
15 Total costs after 60 months Rs. 11,580.80
($ 96.50)
Rs.4,853.60
($ 40.40)
Rs. 1,532.16
($ 12.76)
16 CO2 emission factor after 60
months 403.20 Kg
CO2
134.40 Kg CO2 80.64 Kg CO2

52
Chapter 5.0 Discussion & Conclusion

53
5. Discussion & Conclusion
As a result of installation of T8 linear LED lighting system in the study area the power
consumption per unit area was reduced up to 60% against with fluorescent lighting. It shows
that LED lighting contributed to save 40% of energy comparing with fluorescent. This result
is also the lowest energy consumption among artificial illumination. As per the manufactures
specification the power factor was recorded 0.52 for fluorescent and 0.54 for LED, but it is
not a considerable differences. If the power factor of LED would be increased more than 0.54,
which is contributed to a new avenue for the growth of smart lighting and coefficient of
utilization. Also detected correlated color temperature was recorded within the range of
6000K- 6500K.
Lighting level and efficacy are also very crucial parts in addition to the power consumption.
In the library area the average lux levels were recorded within the range of 358-382 lux for
LED lamps and 93-181 lux for fluorescent lamps in a working plane. In the class room
lighting level disperse with 340 – 328 range for LED lamps and 128 – 103 for fluorescent
lamp. But it was not significant different both areas. In the class room height to the working
plane is higher than the library height and not presented ceiling mounted troffer fixtures.
Therefore some factors can be affected to bit of change in the lighting level. The standard,
lighting level of the study area and office environment was in the 250 lux to 450 lux range.
Considering efficacy, though the initial lighting level output of the fluorescent lamp is 2950
lumens per watt before fixing into parabolic fixtures it was reduced up to 180 lux in the
working plane at 00 degree vertical angle. It was indicated about 90% loss of lighting level
within a 2.42m height difference. However, in LED lamp initial output is 450 lumens per watt
before fixing to the parabolic fixture and It is recorded around 370 lux in the working plane at
the above mentioned height difference and vertical angle. Therefore the lighting level was lost
20% due to filter of fixture. These results indicated that LED lights are more focused to the
direction and loss factor is less than the fluorescent lamp. IT has proven that LED lamp is
very productive than the fluorescent because the efficacy is maintained around 90%.
Narendran et al, 2007, have indicated that the key benefits of LED technology for general
lighting applications contributed to reduced maintenance due to its long-life potential.
The results of human performance factors like visibility, mood effect, visual health, colour
appearance, work performance, and the preference level for T8 LED lighting conditions more
than 65% of the population has given positive feedback. But fluorescent lighting condition
has produced more negative responses. Winterbottom and Wilkins (2009), (who are
educational researchers) have pointed out that fluorescent lights created an imperceptible

54
flicker that can cause visual discomfort and make it more difficult to read accurately in
secondary schools for students between the ages of 12 and 18.
( http://www.naturalnews.com/022431_public_schools_fluorescent_lights.html#)
Effects of Fluorescent Light on the Ocular Health of Persons with Pre-Existing Eye
Pathologies, Kitchel (1990) has indicated that cellular activity of the human retina could be
damaged with cool white fluorescent tube when more time spend or stay under the those
lighting condition. Another research study has proven that people are affected with reading
difficulties and academic underachievement related to fluorescent lighting. In fact, they have
estimated that 12-14 percent of the world‟s population, fluorescent lighting may trigger
physical and emotional symptoms, such as headaches, migraines, nausea, dyslexia, ADD/HD,
and Stress Irlen Helen (2008).
In the economic analysis, Capital recovery ration was determined as around 0.40 and rate of
return analysis was 25.2%. Though the initial investment is higher than the fluorescent lamps
the shelf life is longer than any other artificial lighting sources. Therefore maintenance cost
and replacement cost could not be applied to LED lamps during five year period as prescribed
by the Table 24.
Table 25 shows that the CO2 emission factor of the LED lamps could be reduced up to 60%
compared to fluorescent lamps. Fluorescent lamps when discarded have more potentials to
emit toxic gases to the environment but solid state LED lamps have not given harmful or
toxic substances to the ecosystem. When Fluorescent lamps needs to be replaced two times
within a five year period due to burnout unlike LED lamps. In addition to that, during
production and disposal of fluorescent lamps there is a potential risk affecting the
environmental and the human health due to mercury Hu and Cheng (2012). Life Cycle
Assessment of LED light indicated less environmental hazards compared to fluorescent and
other illumination sources (see Annex: 04). They, Hu and Cheng (2012) have mentioned that
most of the fluorescent lamps contained up to 40mg of mercury which contributed to
pollution of the environmental media and posed chronic health risk to the human by causing
neuropsychological damages.
Beral, Shaw, and Milton (1982) pointed out that exposure to fluorescent light at work
associated with the risk of succumbing to malignant melanomas. In addition to reducing
immune system functioning, and mental performance, raised stress levels can also stunt

55
childrens‟ growth. It appears that cool-white fluorescent tubes were legally banned in some
German medical institutions Hollwich and Dieckhues (1980).
LEDs can be combined to allow variations in the amount, distribution and spectrum of the
light emitted. It is the potential of this flexibility to enhance human performance, comfort and
safety that needs to be studied. In this study it is attempted to provide a basic understanding of
the effects of lighting conditions on performance, comfort & safety and explore the potential
for LEDs to provide new approaches for specific applications. The performance of a visual
task almost always involves visual, cognitive and motor components. Different tasks have
different combinations of these components. Further, how these components fit into the
overall task structure and the extent to which they interact will vary from task to task. Such
complexity makes it difficult to predict the performance on one task from measurements on
another which complicate the studies of this nature.
The main effect of lighting conditions on task performance is through the changes it makes to
the stimuli presented to the visual system and hence the information that can be extracted
from the environment.
Studies conducted by the US Department of energy (2012), emphasized that the negative
environmental impacts of LED lighting are currently very much less than the incandescent
lighting systems as well as CFL lighting systems (See Annex 04).
Finally considering the above risk and adverse health factors of the fluorescent lighting
condition, LED lighting can be considered as eco-friendly. Even though initial investment of
the LED lamp is higher than the fluorescent lamp, there is little or no maintenance cost and
very low power consumption cos is an added advantage. The LED can also be interconnected
with solar power panel due less power consumed. LED lights could be recommended for
illumination of even street lights and any decorative lights in future.

56
7. References
1. Adair J, Sharpe D, Huynh C-L (1989) Hawthorne control procedures in educational
experiments:
A reconsideration of their use and effectiveness. Rev Educ Res 59:215–228."
2. Adair JG (1984) The Hawthorne effect: A reconsideration of the methodological
artifact. J Appl Psychol 69:334–345
3. Akashi Y. and Boyce P.R.. A(2006), field study of illuminance reduction. Energy &
Buildings,38(6):588{599|
4. ANSI/IESNA (American National Standard Institute/ Illuminating Engineering
Society of North America), 2007.
5. "ANSI/IESNA RP-27.1-05: Recommended Practice for Photobiological Safety for
Lamp and Lamp Systems – General Requirements. Illuminating Engineering Society
of North America Web Store 10 June 2007"
6. "BARON, R.A., REA, M.S., DANIELS, S.G. 1992. Effects of indoor lighting
(Illuminance and spectral power distribution)on the performance of cognitive tasks
and interpersonal behaviour: the potential mediating role of positive affect,
Motivation Emotion, 16, 1-33."
7. BEAR, A.R., BELL, R.I., 1992. The CSP index: a practical measure of office lighting
quality. Lighting Research ant Technology 24 (4), 215-225
8. Beral, V., Evans S., Sgaw H. & milton G., (1982), "Malignant melanoma & exposure
to fluorescent lighting at work", The Lancet, pp:290-293.
9. Berson D.M. (2003) Strange vision: ganglion cells as circadian photoreceptors.
TRENDS in Neurosciences, 26(6):314{320}
10. Bouchet C, Guillemin F, Briancon S (1996) Nonspecific effects in longitudinal
studies: impact on quality of life measures. J Clin Epidemiol 49:15–20.
11. "BOYCE, P. R., CUTTLE, C., 1990. Effect of correlated color temperature on
the perception of interiors and color discrimination performance, Lighting
Research and Technology, 22 (1), 16-36"
12. BOYCE, P. R., 2003. Human Factors in Lighting. 2nd ed. London and New York:
Taylor & Francis
13. Carey A (1967) The Hawthorne studies: A radical criticism. Am Sociol Rev 32:403–
416.
14. CIBSE 1997. CIBSE Code for interior lighting 1994: Additions and corrections 1997.
ISBN 0 900953 64 0
15. CIE (Commission Internationale de l‟Éclairage), 2002. The correlation of models for
vision and visual performance. CIE 2002; 145

57
16. CIE 13.3:1995, Method of measuring and specifying color rendering properties of
light sources
17. CIE 15.2:1986, Colorimetry, second ed
18. Cook DL (1962) The Hawthorne Effect in Educational Research. The Phi Delta
Kappan 44:116–122.
19. DEHOFF. P., 2002. The impact of changing light on the well-being of people at
work. Proceedings of Right Light 5,
20. "DOE. (2012a). Life-Cycle Assessment of Energy and Environmental Impacts of
LED Lighting Products, Part 1: Review of the Life-Cycle Energy Consumption of
Incandescent, Compact Fluorescent, and LED Lamps. Washington DC. Retrieved
from
http://apps1.eere.energy.gov/buildings/publications/pdfs/ssl/2012_LED_Lifecycle_Re
port.pdf"
21. "Eckmanns T, Bessert J, Behnke M, Gastmeier P, Ruden H (2006) Compliance with
antiseptic hand rub use in intensive care units: the Hawthorne effect. Infect Control
Hosp Epidemiol 27:931–4."
22. Feil PH, Grauer JS, Gadbury-amyot CC, Kula K, Mccunniff MD (2002) Intentional
Use of the Hawthorne Effect Orthodontic Patients. J Dent Educ:1129–1135
23. FONTOYNONT, M., 2008. Long term assessment of costs associated with lighting
and daylighting techniques. Light and Engineering, 16 (1), 19-31
24. French JRJ (1950) in Experiments in social process: A symposium on social
psychology, ed Miller JG (McGraw-Hill, New York, NY), pp 81–96.
25. French JRJ (1953) in Research methods in the behavioral sciences, eds Festinger L,
Katz D (Holt, Rinehart and Winston, New York, NY), pp 98–135.
26. Gee.J.M., Tsao.J.Y., Simmons.J.A.,(2004) Prospects for LED lighting, Proc.SPIE
5187 227–233.
27. Gerber AS, Green DP, Larimer CW (2008) Social Pressure and Voter Turnout:
Evidence from a Large-Scale Field Experiment. Am Polit Sci Rev 102:33–48.
28. GLIGOR, V., 2004. Luminous environment and productivity at workplaces. Thesis
(Licentiate), Helsinki University of Technology, Espoo
29. Grangaard E. M.(1995). Color and light effects on learning. Retrieved from ERIC
Database. (ED382381)
30. "Heschong L.,Wright R. L.,Okura S.,Klein P. D.,Simner M.,Berman S.,Clear
R.(2002). Daylighting impacts on human performance in school.
31. Journal of Illuminating Engineering Society, 31, 101-114."
32. http://acept.la.asu.edu/courses/phs110/expmts/exp13a.html
33. http://arch3511.files.wordpress.com/2011/07/interior-lighting.pdf

58
34. http://continuingeducation.construction.com/crs.php?L=223&C=947
35. http://ebookbrowse.com/7-lighting-calculation-of-external-area-pdf-d398672470
36. http://greenmanual.rutgers.edu/newresidential/strategies/interiorlighting.pdf
37. http://hyperphysics.phy-astr.gsu.edu/hbase/electronic/leds.html
38. http://personal.cityu.edu.hk/~bsapplec/newpage216.htm
39. http://www.cfm.va.gov/til/etc/LightingStudy.pdf
40. http://www.cree.com/~/media/Files/Cree/Lighting/Misc%20Tech%20Docs/LightingC
alculationsintheLEDEra_Benya.pdf
41. http://www.deborahburnett.com/images/uploads/Responsearticle2009LightatNightaff
ectsonagingvision.pdf (Kitchel, Elaine THE EFFECTS OF FLUORESCENT LIGHT
on the OCULAR HEALTH of PERSONS with EXISTING EYE PATHOLOGIES
American Printing House for the Blind)
42. http://www.ecosmartelectricians.com.au/starter-kit/d01_46.html
43. http://www.fiber-optics.info/articles/LEDs.htm
44. http://www.iar.unicamp.br/lab/luz/ld/Livros/Handbook%20of%20lighting%20design.
45. http://www.iesanz.org/_dyn/media/r105/system/attrib/file/807/4_electric_lighting_des
ign_techniques.pdf
46. http://www.kpsec.freeuk.com/components/led.htm
47. http://www.lightingassociates.org/i/u/2127806/f/tech_sheets/Lighting_Fundamentals_
1.pdf
48. http://www.marktechopto.com/
49. http://www.nabagreen.com/faqs.asp (about LED technology)
50. http://www.nichia.co.jp/en/product/led_catalogue.html
51. http://www.theledlight.com/technical1.html
52. "ICNIRP (International Commission on Non-Ionizing Radiation Protection), 2000.
Statement on Light-Emitting Diodes (Leds) and Laser Diodes: Implications for
Hazard Assessment. Health Physics 78 (6): 744-752"
53. "IEC(International Electrotechnical Commission), 2008. Photobiological safety of
lamps and lamp systems. Part 2.
54. Guidance on manufacturing requirements relating to non-laser optical radiation
safety"
55. IESNA (Illuminating Engineering Society of North America) 2000. The IESNA
Lighting Handbook, 9th ed. New York: IESNA.
56. IESNA LM-79-2008 Approved method for Electrical and Photometric measurement
of solid state lighting products.

59
57. "Izawa MR, French MD, Hedge A (2011) Shining New Light on the Hawthorne
Illumination Experiments. Human Factors:
58. The Journal of the Human Factors and Ergonomics Society 53:528–547."
59. Jones S (1992) Was there a Hawthorne effect? AJS 98:451–468.
60. Kitchel, Elaine THE EFFECTS OF FLUORESCENT LIGHT on the OCULAR
HEALTH of PERSONS with EXISTING EYE PATHOLOGIES American Printing
House for the Blind
61. Krames M. (2007). Progress in high-power light-emitting diodes for solid-state
lighting. Proceedings of the 11th International Symposium of the Science and
Technology of Light Sources, May 20th-24th, Shanghai, China. pp. 571-573.
62. Ku¨ller, R., & Lindsten, K. (1992). Health and behaviour of children in classrooms
with and without windows. Journal of Environmental Psychology, 12, 305–317
63. Lei Z.,Guo Xia, Liang Ting, Gu Xiaoling, Lin Qiao Ming, Shen Guangdi., (2006),
Color rendering and luminous efficacy of trichromatic and tetrachromatic LED-based
white LEDs, Microelectronics Journal
64. Levitt SD, List JA (2011) Was there really a Hawthorne effect at the Hawthorne
plant? An analysis of the original illumination experiments. Am Econ J Appl Econ
3:224–238.
65. Mangione-Smith R, Elliott MN, McDonald L, McGlynn EA (2002) An observational
study of antibiotic prescribing behavior and the Hawthorne effect. Health Services
Research 37:1603–23
66. MILLS, P.R., TOMKINS, S.C., SCHLANGEN, J.M., (2007), The effect of high
correlated color temperature office lighting on employee wellbeing and work
performance. Journal of Circadian Rhythms, 5, 2
67. Myer M. A, Paget M. L and Lingard R. D., (2009), Performance of T12 and T8
fluorescent lamps and troffers and LED linear replacement lamps, US Department of
energy
68. Narendran N, Gu Y., Jayasinghe L., Freyssinier J. P., and Zhu Y., (2007) Long-term
performance of white LEDs and systems, proceeding of first international conference
on white LEDs and solid state lighting, Tokyo, P174-P179.
69. Ott J. N.(1976). Influence of fluorescent lights on hyperactivity and learning
disabilities. Journal of Learning Disabilities, 9, 22-27
70. Parsons H (1974) What happened at Hawthorne? Science 183:922–932
71. R. Mueller-Mach, G.O. Mueller, (2000),White light emitting diodes forillumination,
Proc. SPIE 3938 30–41

60
72. Rautkyla, E., Puolakka, M., Tetri, E., Halonen, L. (2009). Correlated color
temperature and timing of light exposure; their effects on daytime alertness in
lecture environments, to be published in Journal of Light and Visual.
73. Rea, M.,(1981), Visual performance with realistic methods of changing contrast.
Journal of the Illuminating Engineering Society, 10(3): p. 164-177
74. Rea, Mark S., (2000.),ed. The IESNA Lighting Handbook, Ninth Edition.
Illuminating Engineering Society of America: New York, NY,
75. Roethlisberger FJ, Dickson WD (1939) Management and the Worker (Harvard
University Press, Cambridge, MA)
76. Xianjie, S., Qifei, T., and Wei, Z., (2002),Prospect of the application for
highbrightness LED in lighting area, Semicond. Optoelectron. 23 (5) 356-360.
77. "Veitch J.A. and Newsham G.R. . (1995), Quantifying lighting quality based on
experimental investigations of end user performance and preference.
78. Veitch, J. A. (2001). Psychological processes influencing lighting quality. Journal of
the Illuminating Engineering Society, 30(1), 124-140
79. www.kpsec.freeuk.com/components/led.htm
80. www.naasln.org/documents/articles/hudson_miller_02_fluorescent_lighting_crisis

61
ANNEX 01 Equation - 01
Lumen method formula
Foot candles=
No. of Luminaries =
Equation – 02
Average illuminance equation
Ewp = ( )
Ewp= average maintained illuminance on the work plane
Ø(Total)= Total system lamp lumen output
CU= Coefficient of Utilization
LLF= Light Loss factor
Awp= Area of the work plane
Equation -03
Total system lamp output Ø(Total)= no. of luminaries x no. of lamps per luminaries x lumens per lamp
Equation -04
Coefficients of Utilization (CU)
Coefficient of Utilization is described based on Room Cavity Ratio. (RCR)
RCR = ( )
Where, hRC= Room cavity height
L= Length of the room
W= Width of the room
Cavity ratios
Ceiling-cavity Ratio, CCR= ( )
= RCR
hCC= Height of Ceiling Cavity
hRC = Height of Room Cavity
Floor Cavity Ratio, FCR= FCR= ( )
= RCR

62

63

64

65
ANNEX-02
Lighting levels under the LED lamps- vertical angle 300 (Library)
Angle 30
Point # 12 14 16 19 21 24 26
Day
1 365 370 365 375 372 380 378
2 370 372 366 378 371 378 377
3 370 372 365 378 371 381 379
4 370 372 366 378 370 382 380
5 370 372 365 378 371 381 380
6 370 372 365 376 372 382 378
7 370 372 366 376 370 380 378
8 368 372 365 378 372 380 380
9 370 372 366 378 373 380 380
10 366 372 368 376 370 380 380
11 370 372 367 374 370 380 380
12 370 372 367 378 370 380 379
13 364 372 367 378 372 379 378
14 370 372 367 376 372 378 379
15 370 372 367 377 371 379 376
16 364 372 367 376 371 381 377
17 364 372 367 375 370 382 377
18 363 370 367 376 373 383 377
19 366 370 368 378 373 380 376
20 365 370 368 376 373 380 378
21 366 370 368 374 372 382 378
22 367 370 367 375 370 381 379
23 367 370 367 374 371 378 378
24 367 370 368 375 372 379 378
25 367 370 368 374 372 379 380
26 368 370 368 375 373 381 378
27 368 370 365 376 374 381 377
28 365 370 364 375 370 382 376
Avg. 368 371 367 376 371 380 378
Point # 12 14 16 19 21 24 26
Lux 368 371 367 376 371 380 378

66
Lighting levels under the LED lamps- vertical angle 600 (Library)
Angle 60
Point # 1 2 3 4 5 6 7 8 9 10 23 28 30
Day
1 356 365 360 362 361 350 352 354 356 360 358 348 350
2 355 363 361 360 359 351 351 353 355 361 357 346 351
3 355 362 362 358 358 352 351 353 354 362 356 345 351
4 358 360 358 361 360 350 352 354 355 360 357 347 349
5 358 362 359 358 361 358 351 353 354 361 358 348 348
6 358 358 358 358 362 356 352 353 355 364 359 350 349
7 358 366 359 358 358 348 353 353 356 364 360 350 348
8 358 363 360 358 358 348 353 354 356 360 358 348 348
9 358 363 361 358 358 348 353 353 358 361 359 348 348
10 356 363 362 358 358 356 353 354 353 362 360 349 350
11 348 364 358 360 358 356 353 352 353 361 360 349 350
12 348 365 361 360 362 349 354 352 354 362 360 349 351
13 348 364 361 361 360 348 352 352 355 361 357 348 349
14 356 364 361 362 362 351 350 353 356 362 357 348 349
15 356 364 362 361 358 351 351 354 354 361 356 347 350
16 357 365 362 360 366 348 350 352 355 360 357 348 349
17 358 365 362 360 363 348 351 352 357 361 356 349 348
18 357 366 362 361 363 348 352 353 358 359 357 350 348
19 357 366 363 359 363 348 351 354 357 358 358 350 348
20 355 365 360 359 364 350 352 355 358 359 359 350 348
21 355 364 361 358 365 351 351 355 357 358 359 349 349
22 355 362 361 359 362 352 350 355 353 358 358 349 349
23 356 363 360 359 360 353 350 354 353 359 357 348 348
24 354 365 360 357 362 351 353 354 354 359 357 348 350
25 354 362 357 359 358 352 352 355 355 359 357 347 351
26 357 365 357 357 366 351 353 354 356 359 358 348 356
27 356 366 358 359 363 351 353 353 354 360 359 350 348
28 354 367 359 360 363 352 350 353 356 361 357 349 350
Avg. 355 364 360 359 361 351 352 353 355 360 358 348 349
Point # 1 2 3 4 5 6 7 8 9 10 23 28 30
Lux 355 364 360 359 361 351 352 353 355 360 358 348 349

67
Lighting levels under the LED lamps- vertical angle 00 (Library)
Angle 0
Point # 11 13 15 17 18 20 22 25 27 29
Day
1 380 385 378 375 382 374 378 385 382 381
2 352 386 380 378 382 374 378 385 382 382
3 385 385 378 375 382 374 378 385 382 382
4 382 384 378 376 380 374 378 385 382 382
5 380 385 378 378 382 374 378 385 382 382
6 380 385 378 375 378 374 378 385 382 382
7 382 385 379 375 381 374 378 385 382 382
8 381 385 381 376 382 374 378 385 382 382
9 384 385 380 375 380 374 378 385 382 382
10 380 385 380 376 381 374 378 385 382 382
11 380 385 380 374 382 374 378 385 382 382
12 380 385 380 375 380 374 378 385 382 382
13 380 385 380 376 384 374 378 385 382 382
14 382 385 380 376 382 374 378 385 382 382
15 380 384 378 376 385 374 378 385 382 382
16 381 385 379 376 380 374 378 385 382 382
17 380 384 378 376 380 374 378 385 382 382
18 380 382 379 376 382 374 378 385 382 382
19 380 385 378 376 380 374 378 385 382 382
20 382 384 379 375 380 374 378 385 382 382
21 384 385 378 376 382 374 378 385 382 382
22 382 385 380 376 382 374 378 385 382 382
23 384 385 381 376 382 374 378 385 382 382
24 385 386 378 376 382 374 378 385 382 382
25 382 386 378 376 381 374 378 385 382 382
26 380 385 380 374 382 374 378 385 382 382
27 382 385 379 378 381 374 378 385 382 382
28 380 385 380 376 382 374 378 385 382 382
Avg. 380 385 379 376 381 374 378 385 382 382
Point # 11 13 15 17 18 20 22 25 27 29
Lux 380 385 379 376 381 374 378 385 382 382

68
Lighting levels under the Fluorescent lamps- vertical angle 00
(Library)
Angle 0
Point # 11 13 15 17 18 20 22 25 27 29
Day
1 180 182 180 176 180 179 182 178 176 180
2 182 182 182 182 182 182 182 175 178 182
3 180 182 182 182 182 182 182 187 178 182
4 180 182 182 182 182 182 182 175 178 182
5 180 182 182 182 181 182 182 176 178 182
6 180 182 182 182 180 182 182 178 178 182
7 180 182 182 182 180 182 182 174 178 180
8 180 182 182 177 181 182 182 175 182 182
9 180 182 182 178 181 180 182 176 182 181
10 180 182 182 178 180 179 182 178 182 182
11 180 182 182 179 181 180 182 178 182 179
12 180 182 182 178 180 180 182 180 177 182
13 180 182 182 179 180 178 182 176 177 180
14 180 182 182 176 181 179 182 176 176 182
15 180 176 182 176 180 179 182 176 178 180
16 180 178 182 177 180 180 182 178 177 180
17 180 178 182 177 180 178 182 178 176 180
18 180 178 182 177 180 178 182 178 178 182
19 180 178 182 176 180 179 182 178 179 179
20 180 178 182 178 180 180 182 178 180 182
21 180 178 182 178 180 181 182 178 179 181
22 180 182 182 179 180 181 182 174 178 182
23 180 182 182 178 180 180 182 176 179 180
24 180 182 182 179 178 180 182 177 176 182
25 180 182 182 178 179 182 182 177 176 180
26 180 182 182 179 179 179 182 178 176 180
27 180 182 182 180 182 179 182 177 176 180
28 180 182 182 179 182 179 182 176 176 179
180 181 182 179 180 180 182 177 178 181
Point # 11 13 15 17 18 20 22 25 27 29
Lux of LED 380 385 379 376 381 374 378 385 382 382
Lux of fluoresecent 180 181 182 179 180 180 182 177 178 181

69
Lighting levels under the Fluorescent lamps- vertical angle 300
(Library)
Angle 30
Point # 12 14 16 19 21 24 26
Day
1 150 155 154 150 152 150 154
2 154 150 154 152 152 155 154
3 152 151 153 151 151 150 152
4 154 156 153 149 149 151 152
5 150 156 154 150 150 156 150
6 154 157 155 150 150 156 152
7 154 152 153 151 151 157 153
8 154 150 152 150 150 152 150
9 152 150 150 155 155 150 154
10 152 154 151 150 150 151 152
11 150 155 156 151 151 150 152
12 152 155 156 156 152 151 379
13 153 155 157 156 151 152 154
14 150 153 152 157 149 150 152
15 154 153 150 152 150 152 152
16 152 154 150 149 150 151 150
17 152 153 153 150 151 152 152
18 152 153 154 150 150 151 153
19 154 154 155 152 155 149 155
20 150 155 155 151 150 150 155
21 150 153 156 149 151 150 154
22 150 152 156 150 156 151 154
23 150 156 154 150 157 150 156
24 152 156 153 151 152 155 154
25 154 153 155 150 150 150 154
26 152 154 153 155 151 151 155
27 150 154 154 150 152 150 154
28 150 155 155 151 151 150 155
Avg. 152 154 154 151 151 152 161
point # 12 14 16 19 21 24 26
Lux 152 154 154 151 151 152 161

70
Lighting levels under the Fluorescent lamps- vertical angle 600
(Library)
Angle 60
Point # 1 2 3 4 5 6 7 8 9 10 23 28 30
Day
1 100 90 105 110 100 90 98 95 102 105 102 100 95
2 102 88 102 108 100 88 96 95 100 100 100 102 94
3 100 86 103 110 102 88 98 94 102 101 100 100 90
4 102 89 100 110 103 89 97 95 100 102 101 102 90
5 103 90 101 110 102 88 98 96 101 103 100 103 90
6 98 92 102 111 103 91 97 97 100 105 101 98 90
7 99 91 103 112 102 90 97 95 101 103 102 99 91
8 100 90 105 112 99 90 99 94 102 102 103 100 95
9 102 90 103 109 100 90 99 96 103 105 105 102 94
10 103 90 102 110 100 90 98 96 105 104 103 103 95
11 102 88 104 110 101 91 95 98 103 106 102 102 96
12 103 87 105 108 100 88 96 97 102 106 101 103 97
13 102 89 105 109 101 86 96 98 101 106 100 100 95
14 100 88 106 112 100 89 97 97 102 105 101 101 94
15 101 88 105 112 101 90 98 97 103 104 102 102 96
16 100 88 108 111 102 92 95 99 102 104 103 103 96
17 101 88 105 110 103 91 98 99 99 103 105 105 98
18 102 89 106 109 105 90 96 95 100 105 103 103 97
19 103 90 107 110 103 90 98 96 100 106 102 102 98
20 105 90 105 110 102 90 96 97 101 105 100 101 97
21 103 90 103 110 101 88 95 95 100 106 99 100 97
22 102 90 104 110 100 87 95 94 101 104 100 101 99
23 101 91 104 110 100 89 95 96 102 104 102 102 99
24 100 91 105 111 99 88 95 96 102 102 102 101 96
25 102 92 105 112 100 90 96 94 103 103 103 102 95
26 102 90 105 112 101 88 96 96 100 108 102 102 94
27 102 90 104 109 101 89 98 95 102 105 102 101 96
28 100 90 104 109 100 88 98 94 103 106 103 100 93
Avg. 101 89 104 110 101 89 97 96 102 104 102 101 95
Point # 1 2 3 4 5 6 7 8 9 10 23 28 30
Lux level 101 89 104 110 101 89 97 96 102 104 102 101 95
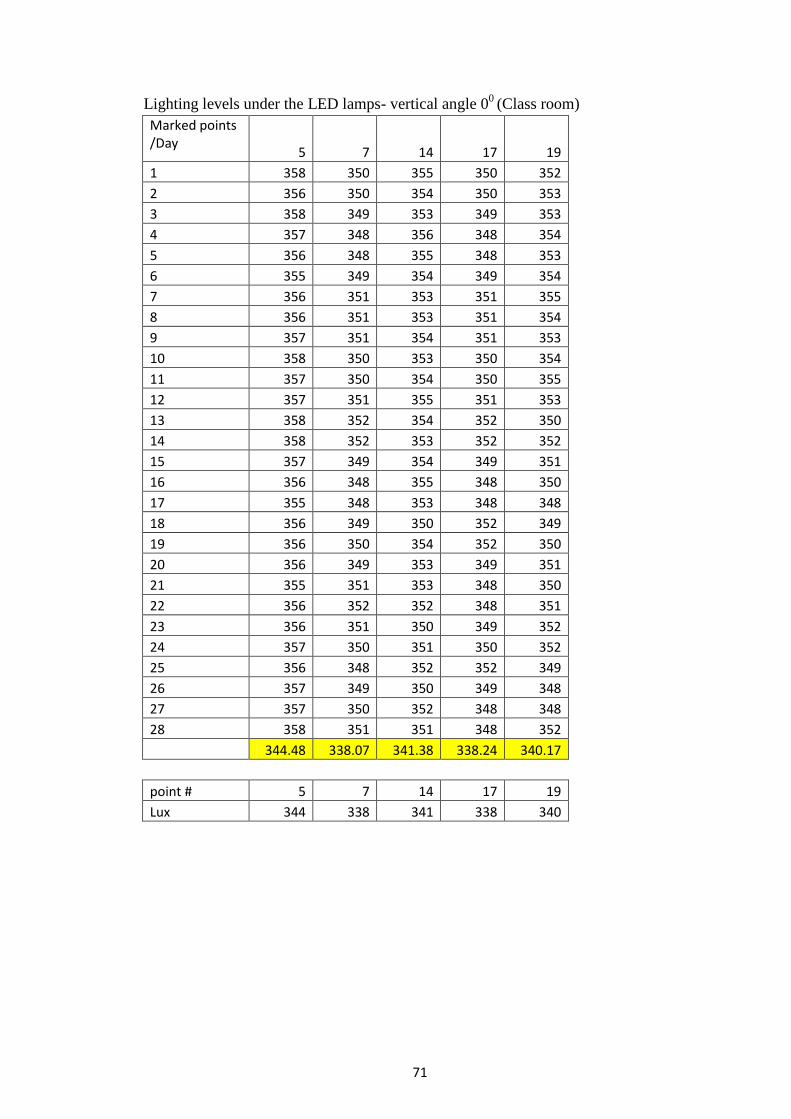
71
Lighting levels under the LED lamps- vertical angle 00
(Class room)
Marked points /Day
5 7 14 17 19
1 358 350 355 350 352
2 356 350 354 350 353
3 358 349 353 349 353
4 357 348 356 348 354
5 356 348 355 348 353
6 355 349 354 349 354
7 356 351 353 351 355
8 356 351 353 351 354
9 357 351 354 351 353
10 358 350 353 350 354
11 357 350 354 350 355
12 357 351 355 351 353
13 358 352 354 352 350
14 358 352 353 352 352
15 357 349 354 349 351
16 356 348 355 348 350
17 355 348 353 348 348
18 356 349 350 352 349
19 356 350 354 352 350
20 356 349 353 349 351
21 355 351 353 348 350
22 356 352 352 348 351
23 356 351 350 349 352
24 357 350 351 350 352
25 356 348 352 352 349
26 357 349 350 349 348
27 357 350 352 348 348
28 358 351 351 348 352
344.48 338.07 341.38 338.24 340.17
point # 5 7 14 17 19
Lux 344 338 341 338 340

72
Lighting levels under the LED lamps- vertical angle 300
(Class room)
Marked points /Day 4 6 8 12 13 18
1 350 348 352 351 348 348
2 351 352 350 350 352 351
3 352 351 348 350 351 351
4 350 350 352 350 350 348
5 348 350 351 352 350 348
6 352 350 350 349 350 348
7 351 352 350 348 352 350
8 350 349 350 351 349 350
9 350 348 352 351 348 350
10 350 351 349 348 351 352
11 352 351 348 348 351 349
12 349 348 351 352 348 350
13 348 348 351 351 348 350
14 351 348 348 350 348 352
15 351 350 348 350 348 349
16 348 350 348 350 352 348
17 348 350 348 352 351 351
18 348 352 349 349 350 351
19 348 349 348 348 350 348
20 350 348 351 351 350 348
21 351 351 351 351 352 348
22 352 351 348 348 349 348
23 353 348 348 348 348 352
24 351 352 348 348 351 351
25 352 353 348 350 350 350
26 351 348 352 352 351 352
27 351 350 351 353 352 353
28 352 351 350 351 353 351
338.41 338.10 337.86 338.41 338.48 338.45
Point # 4 6 8 12 13 18
Lux 338 338 338 338 338 338

73
Lighting levels under the LED lamps- vertical angle 600
(Class room)
marked points Day 1 2 3 9 10 11 15
1 345 340 335 330 338 336 340
2 342 341 334 33 337 336 341
3 345 342 336 332 336 335 340
4 344 340 335 332 335 336 341
5 345 339 335 332 338 334 342
6 346 340 336 332 333 335 341
7 346 340 334 330 833 335 340
8 345 342 334 330 339 336 342
9 343 341 335 334 338 337 340
10 434 342 337 333 338 337 340
11 344 341 336 331 337 338 341
12 344 342 334 331 337 338 341
13 345 341 333 331 338 337 340
14 345 342 332 330 338 337 340
15 345 342 334 330 339 336 340
16 345 341 335 330 337 337 340
17 346 342 334 330 336 338 335
18 342 340 336 331 338 336 338
19 343 339 335 331 337 335 339
20 343 339 334 331 338 334 336
21 345 338 335 331 339 336 338
22 345 341 335 332 336 337 339
23 346 342 334 331 337 335 341
24 345 342 335 332 338 336 338
25 346 342 334 331 339 336 339
26 346 341 334 332 339 334 340
27 345 340 336 332 337 335 341
28 346 343 334 331 337 336 340
Avg. 335.93 329.21 323.24 309.83 343.17 324.79 328.55
Point # 1 2 3 9 10 11 15
Avg. light level (Lux) 336 329 323 310 333 325 328

74
Lighting levels under the Fluorescent lamps- vertical angle 00
(Class room)
Marked points /Day 5 7 14 17 19
1 120 128 123 125 128
2 122 129 135 126 128
3 121 130 135 125 129
4 123 130 133 126 127
5 124 130 132 125 126
6 125 129 136 124 128
7 122 128 136 123 129
8 120 129 135 123 128
9 125 128 136 124 130
10 120 130 134 125 130
11 124 130 135 125 129
12 125 130 135 126 129
13 126 130 135 127 128
14 125 130 136 125 129
15 126 130 135 126 130
16 124 128 134 127 128
17 126 129 133 125 130
18 126 130 135 126 128
19 125 130 135 123 130
20 126 131 135 124 128
21 126 131 135 125 129
22 125 130 136 125 128
23 126 130 135 125 129
24 127 130 134 126 128
25 126 129 135 126 129
26 125 130 134 126 128
27 122 130 135 126 127
28 123 129 136 125 128
124.11 129.57 134.39 125.14 128.50
Point # 5 7 14 17 19
Lux 124 130 134 125 128

75
Lighting levels under the Fluorescent lamps- vertical angle 300
(Class room)
Marked Point /day 4 6 8 12 13 18
1 120 121 118 120 118 116
2 122 120 116 125 120 118
3 121 118 118 120 118 118
4 123 120 118 124 120 116
5 124 120 116 125 120 117
6 125 118 117 120 120 116
7 122 119 116 118 118 116
8 120 118 116 120 115 118
9 125 120 118 120 116 119
10 120 120 119 120 120 120
11 124 120 116 118 121 120
12 125 120 118 115 120 120
13 126 120 118 116 118 118
14 125 120 116 120 118 120
15 126 120 117 121 118 120
16 124 120 116 120 118 120
17 126 120 116 118 116 118
18 122 122 118 118 117 115
19 120 120 119 120 116 116
20 118 122 118 125 116 120
21 119 120 119 120 118 116
22 120 121 120 124 119 117
23 119 120 119 125 120 116
24 120 120 120 126 120 116
25 118 121 118 125 120 118
26 119 120 118 126 120 119
27 120 122 119 124 121 117
28 120 120 120 126 120 116
121.89 120.07 117.75 121.39 118.61 117.71
Point # 4 6 8 13 18
Lux 122 120 118 121 119 118

76
Lighting levels under the Fluorescent lamps- vertical angle 600
(Class room)
Marked points /Day 1 2 3 9 10 11 15 16 20
1 105 100 102 100 102 105 105 108 105
2 100 102 102 100 102 102 106 109 100
3 102 105 105 99 103 102 105 108 102
4 105 100 100 101 102 103 106 106 105
5 100 100 100 102 104 100 107 105 100
6 100 102 102 102 102 100 105 106 100
7 102 103 103 103 102 101 104 104 102
8 103 102 102 100 102 100 105 105 103
9 102 103 103 100 103 100 110 106 102
10 103 102 102 101 103 101 109 107 103
11 102 102 102 100 102 101 108 108 102
12 102 100 100 100 102 100 106 108 105
13 100 100 100 101 103 101 105 107 100
14 100 102 102 101 102 102 106 105 100
15 102 105 100 100 103 105 104 105 102
16 100 100 105 101 103 100 105 100 103
17 105 100 100 102 104 102 106 100 102
18 100 102 101 100 102 105 107 102 103
19 101 103 102 101 102 100 108 107 102
20 102 102 103 102 102 100 108 108 102
21 103 103 102 101 100 102 107 109 100
22 105 102 103 100 101 103 105 105 105
23 104 102 100 102 101 102 105 106 104
24 105 100 102 101 100 103 106 107 105
25 105 100 103 100 100 102 106 106 106
26 105 102 102 100 100 103 105 108 105
27 104 100 103 101 102 102 106 107 104
28 105 100 102 101 100 104 105 109 105
102.6 101.6 102.0 101.1 102.2 102.2 106.6 106.6 103.4
Point # 1 2 3 9 10 11 15 16 20
Lux 103 102 102 101 102 102 107 107 103

77
ANNEX-03
Designed questionnaire for determining human performance

78
ANNEX 04
LED Life-Cycle Assessment
Source: U.S. Department of Energy
http://continuingeducation.construction.com/crs.php?L=223&C=947

79