Download - Trend Macrolytics, LLC

Copyright 2020 Trend Macrolytics LLC. All rights reserved. This document is not to be forwarded to individuals or organizations not
authorized by Trend Macrolytics LLC to receive it. For information purposes only; not to be deemed to be recommendations for buying
or selling specific securities or to constitute personalized investment advice. Derived from sources deemed to be reliable, but no
warranty is made as to accuracy.
Trend Macrolytics, LLC
Donald Luskin, Chief Investment Officer
Thomas Demas, Managing Director
Michael Warren, Energy Strategist
Data Insights: Covid-2019 Monitor Thursday, December 17, 2020
The global scorecard
United States + 232,258 United States + 3,448
Brazil + 70,574 Brazil + 936
Germany + 32,744 Germany + 729
Turkey + 29,718 Italy + 680
Russia + 26,074 Mexico + 670
United Kingdom + 25,300 United Kingdom + 612
India + 24,010 Poland + 605
France + 17,720 Russia + 584
Italy + 17,568 India + 355
Poland + 12,455 France + 290
+ 488,421 + 8,909
World + 719,225 World + 13,321
Top ten 68% Top ten 67%
World
30.6 median population age
New cases New Deaths
The worst ten countries
97.453 bp of population infected
As of Dec 16
New confirmed cases
by continent
2.160 bp of population fatalities
Source: Johns Hopkins, Covid Tracking Project, TrendMacro calculations
For more information contact us: Donald Luskin: 312 273 6766 [email protected] Thomas Demas: 704 552 3625 [email protected]

2
The US scorecard
New cases New Deaths New in hospital Cume cases Cume deaths Cume in hospital
CA CA CA NY NY
PA KS TX TX FL
TX NY FL CA NJ
IL AZ IL FL GA
KS NC NY NJ OH
IN TX OH IL IN
NJ FL PA PA AZ
FL PA GA MI AL
OH TN TN MA MD
AZ WA MI GA MN
All states All states All states All states All states
Top ten Top ten Top ten Top ten Top ten
Fewer daily cases Fewer new deaths Fewer new hospitalizations Most recoveries
United States
9.174 bp of population fatalities
+ 14,795
TX + 13,017
OH + 11,218
PA + 11,022
AL + 8,820
IN -194
PA -218-53
-113
-747 IA
-1,233 MI
CA
TX
TN
FL
PA
+ 688
+ 235
+ 115
+ 107
+ 9,998
+ 7,123
+ 6,208
+ 133
+ 131
+ 125
+ 76
+ 11,282
+ 252
+ 190
+ 144
+ 293
+ 123
+ 108NJ
All states
+ 140,196
+ 232,258
NY
IL
IN
MA + 5,952
+ 5,661
WA -462 NY -34 IL -186
LA
1,671,081 28,100
1,136,024 21,481
584,766 15,777
519,369 13,168
870,600 20,490
804,555 18,003
Top ten
OH -292
MI
GA
The ten worst US states
+ 1,456
+ 276
528%
89,995
59,751
44,461
38,418
33,375
31,575
31,468
29,559
23,908
19,980
402,490
488,338 11,588
484,285 11,513
1,519,340 24,394
+ 53,711
+ 18,802
Some states not reporting
+ 56
+ 53
+ 51
+ 38
+ 37 482,815 10,228
8,561,173 174,742
627,774
64%
+ 1,777
+ 278
+ 11,410
+ 10,049
38.1 median population age
514.631 bp of population infected
51% 58%
16,762,527 298,823
60%
+ 3,448
52%
-626 CO -45
Five most improved US states
OH -3,346 MO -195 NV -383
WI
Dail
y n
ew
cases a
nd d
eath
s
Source: Covid Tracking Project, TrendMacro calculations

3
US deep-dive National and state-by-state data do not line up because of different sources
Source: Covid Tracking Project, TrendMacro calculations

4
US deep-dive on the demographics of age, race and health
Age distribution of US cases, fatalities and case-fatality rates Cumulative
Racial distribution of US cases, fatalities and case-fatality rates
(Does not foot
with national average
due to sample error)
ComorbiditesTop-ten joint causes of Covid mortalities, cumulative For 6% of the deaths,
COVID-19 was the only
cause mentioned. For
deaths with conditions
or causes in addition to
COVID-19, on average,
there were 2.9
additional conditions or
causes per death.
Source: Distributions CDC, Comorbidities CDC, TrendMacro calculations

5
Recommended reading
Rhode Island Governor Tells Citizens To ‘Stay Home’
Before Heading To Wine Bar (edit) Jordan Lancaster
Daily Caller December 16, 2020
Fauci tells Americans not to see their kids for
Christmas Bradford Betz
Fox News December 16, 2020
Vaccines vs. Lockdowns Holman Jenkins
Wall Street Journal December 15, 2020
Why the number ‘3’ may make you rethink Covid
hysteria Simon Black
Sovereign Man December 15, 2020
FT People of the Year: BioNTech’s Ugur Sahin and
Ozlem Tureci Joe Miller and Clive Cookson
Financial Times
December 16, 2020
Vaccination Campaign at Nursing Homes Faces
Obstacles and Confusion Rebecca Robbins and Jessica Silver-Greenberg
New York Times December 16, 2020
'The most lopsided economic event imaginable':
Wave of evictions threatens Black, Latino tenants Katy O'Donnell and Janaki Chadha
Politico December 14, 2020
They Stole It Fair and Square Steven Hayward
Power Line Blog December 15, 2020
The Virus Trains: How Lockdown Chaos Spread
Covid-19 Across India Jeffrey Gettleman, Suhasini Raj, Sameer Yasir and Karan
Deep Singh
New York Times December 16, 2020
Meme of day
g
Source: Our beloved clients, and Power Line blog "The Week in Pictures"

6
The coronavirus case accelerometer… tracking the world’s infection curves
Share of infected population from first day with 100 confirmed cases, log scale
Source: Johns Hopkins, Covid Tracking Project, TrendMacro calculations

7
The coronavirus mortality accelerometer … tracking the world’s fatality curves
Share of deceased population from day of first fatality
Source: Johns Hopkins, Covid Tracking Project, TrendMacro calculations

8
“Exponential”? Our most reliable evidence of the rate of spread of Covid-2019 Vertical: days to double deaths Horizontal: days from first death Flat indicates exponential spread Declining indicates supra-exponential spread Rising indicates sub-exponential spread
Source: Johns Hopkins, Covid Tracking Project, TrendMacro calculations
9
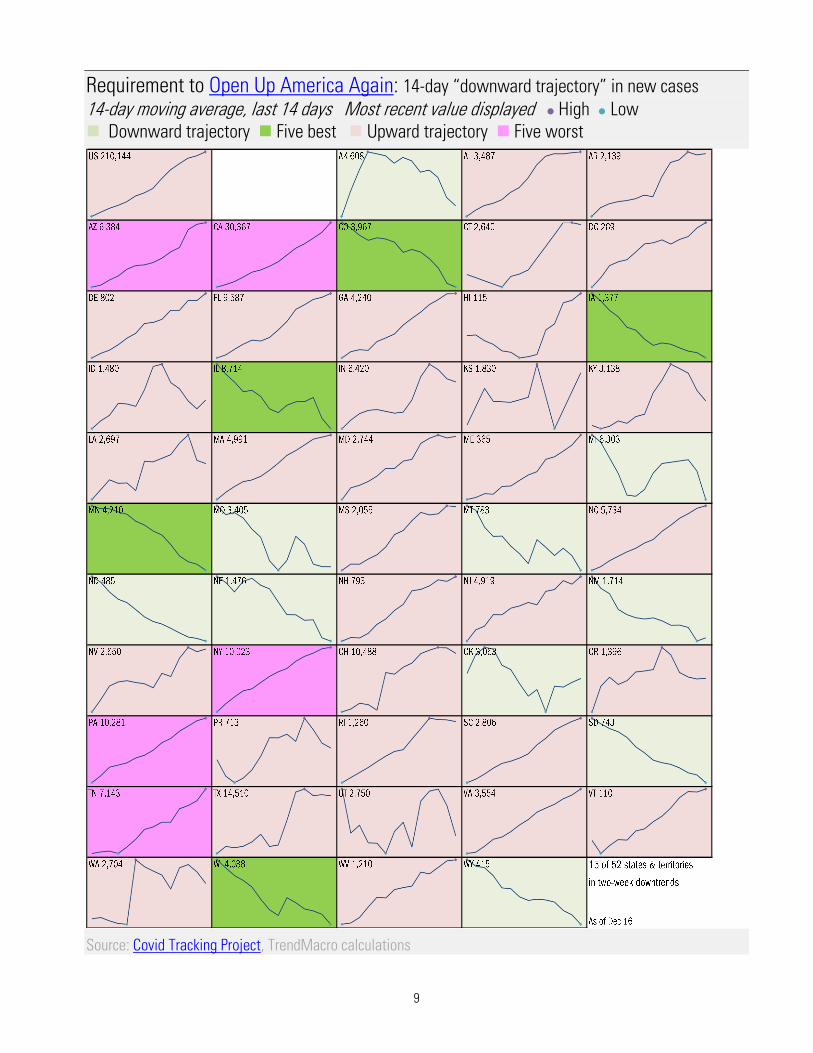
Requirement to Open Up America Again: 14-day “downward trajectory” in new cases
14-day moving average, last 14 days Most recent value displayed ⚫ High ⚫ Low
◼ Downward trajectory ◼ Five best ◼ Upward trajectory ◼ Five worst
Source: Covid Tracking Project, TrendMacro calculations
10
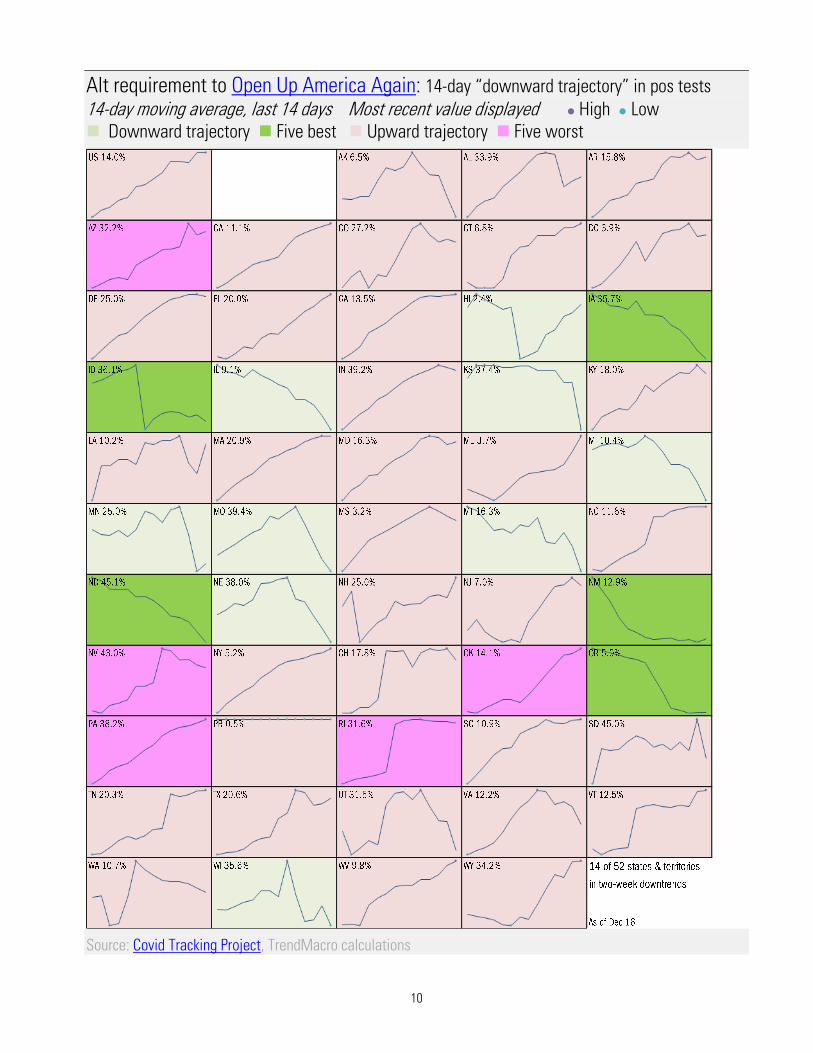
Alt requirement to Open Up America Again: 14-day “downward trajectory” in pos tests 14-day moving average, last 14 days Most recent value displayed ⚫ High ⚫ Low
◼ Downward trajectory ◼ Five best ◼ Upward trajectory ◼ Five worst
Source: Covid Tracking Project, TrendMacro calculations

11
Reality-checking the models: actuals versus IHME predictions
Source: IHME, Covid Tracking Project, TrendMacro calculations

12
From Ground Zero to the Rio Grande
New York
US ex-New York
Texas523.98 bp of population infected
33.9 median population age
As of Dec 16
38.1 median population age
413.58 bp of population infected
38.2 median population age
521.05 bp of population infected
14.39 bp of population fatalities
8.73 bp of population fatalities
8.33 bp of population fatalities
Source: Covid Tracking Project,, TrendMacro calculations

13
The sun-belt hot-spot states (other than Texas)
California
Florida
Arizona
As of Dec 16
589.69 bp of population infected
38.0 median population age
42.2 median population age
422.93 bp of population infected
36.7 median population age
528.93 bp of population infected
5.36 bp of population fatalities
9.48 bp of population fatalities
10.11 bp of population fatalities
Source: Covid Tracking Project,, TrendMacro calculations

14
Patient zero… and then everyone else
China
World ex-China
As of Dec 16
28.8 median population age
119.24 bp of population infected
2.62 bp of population mortalities
0.68 bp of population infected
0.03 bp of population mortalities
37.4 median population age
Source: Johns Hopkins, Covid Tracking Project,TrendMacro calculations
15
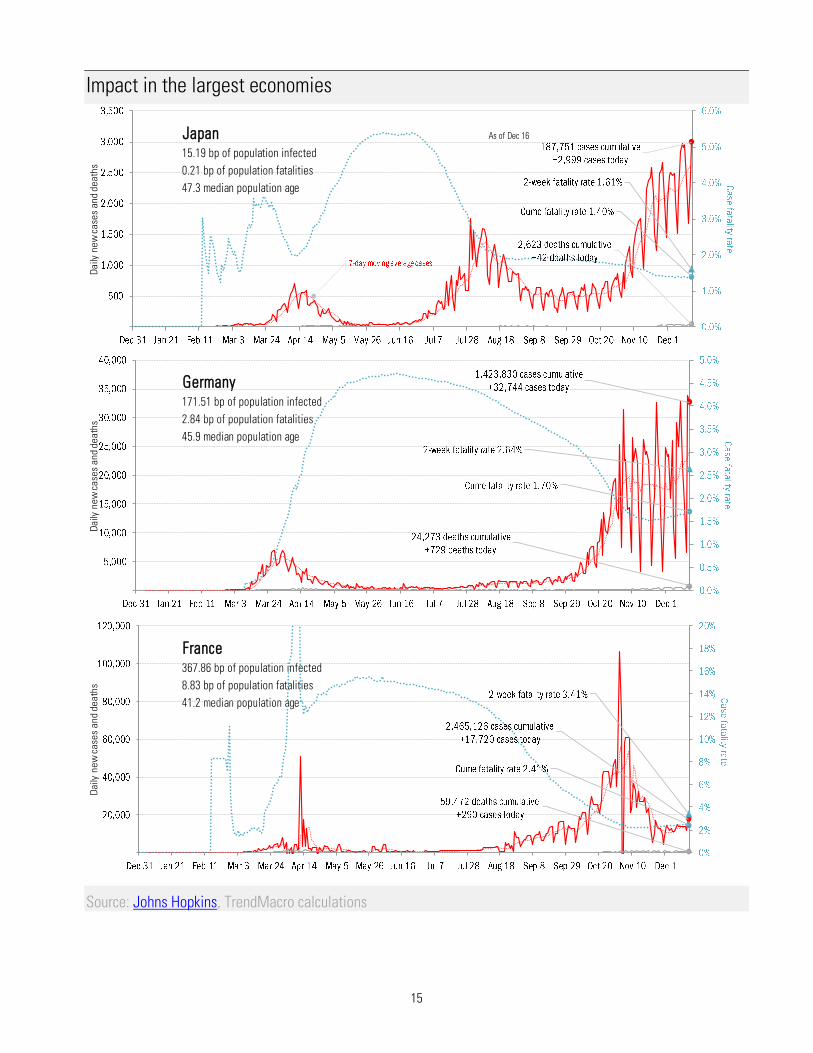
Impact in the largest economies
Japan
Germany
France
As of Dec 16
8.83 bp of population fatalities
367.86 bp of population infected
2.84 bp of population fatalities
0.21 bp of population fatalities
15.19 bp of population infected
171.51 bp of population infected
41.2 median population age
45.9 median population age
47.3 median population age
Da
ily n
ew
ca
ses
an
d d
ea
ths
Da
ily n
ew
ca
ses
an
d d
ea
ths
Da
ily n
ew
ca
ses
an
d d
ea
ths
Source: Johns Hopkins, TrendMacro calculations

16
Impact in The Anglosphere
United Kingdom
Canada
Australia10.15 bp of population infected
37.9 median population age
As of Dec 16
287.89 bp of population infected
40.5 median population age
128.14 bp of population infected
40.8 median population age
9.75 bp of population fatalities
3.61 bp of population fatalities
0.33 bp of population fatalities
Source: Johns Hopkins, TrendMacro calculations

17
Impact in continental Europe
Italy
Spain
Switzerland
As of Dec 16
7.33 bp of population fatalities
461.64 bp of population infected
10.31 bp of population fatalities
10.91 bp of population fatalities
312.82 bp of population infected
377.80 bp of population infected
45.5 median population age
44.9 median population age
42.2 median population age
Da
ily n
ew
ca
ses
an
d d
ea
ths
Da
ily n
ew
ca
ses
an
d d
ea
ths
Da
ily n
ew
ca
ses
an
d d
ea
ths
Source: Johns Hopkins, TrendMacro calculations
18
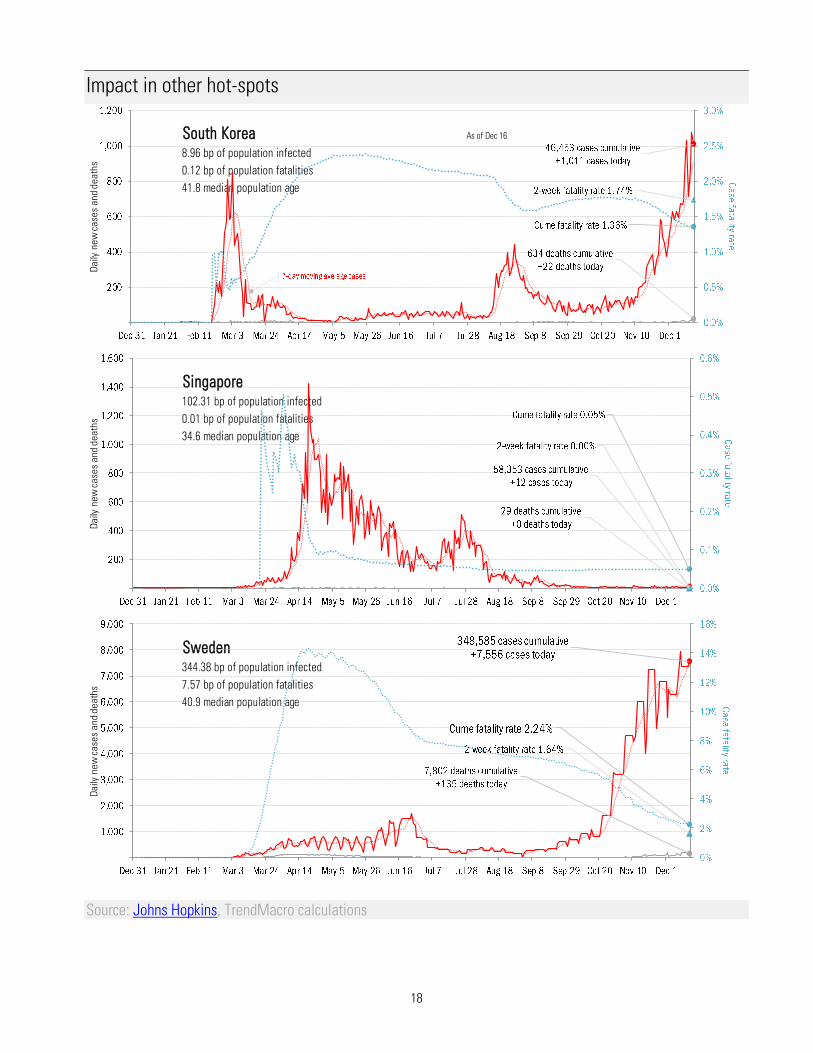
Impact in other hot-spots
South Korea
Singapore
Sweden
As of Dec 16
41.8 median population age
8.96 bp of population infected
102.31 bp of population infected
34.6 median population age
0.12 bp of population fatalities
0.01 bp of population fatalities
40.9 median population age
344.38 bp of population infected
7.57 bp of population fatalities
Da
ily n
ew
ca
ses
an
d d
ea
ths
Da
ily n
ew
ca
ses
an
d d
ea
ths
Da
ily n
ew
ca
ses
an
d d
ea
ths
Source: Johns Hopkins, TrendMacro calculations

19
Impact in the BRICs ex-China
India
Russia
Brazil
As of Dec 16
39.6 median population age
26.8 median population age
74.27 bp of population infected
18.75 bp of population infected
1.07 bp of population fatalities
0.33 bp of population fatalities
33.5 median population age
336.07 bp of population infected
8.73 bp of population fatalities
Da
ily n
ew
ca
ses
an
d d
ea
ths
Da
ily n
ew
ca
ses
an
d d
ea
ths
Da
ily n
ew
ca
ses
an
d d
ea
ths
Source: Johns Hopkins, TrendMacro calculations

20
Impact in the Middle East and Africa
Israel
Iran
Africa (52 nations)
As of Dec 16
30.3 median population age
30.2 median population age
410.90 bp of population infected
129.22 bp of population infected
3.39 bp of population fatalities
6.02 bp of population fatalities
18.79 bp of population infected
19.7 median population age
0.44 bp of population fatalities
Da
ily n
ew
ca
ses
an
d d
ea
ths
Da
ily n
ew
ca
ses
an
d d
ea
ths
Da
ily n
ew
ca
ses
an
d d
ea
ths
Source: Johns Hopkins, TrendMacro calculations


![[Marketing Trend] 2014 상반기 Marketing Trend](https://cdn.vdocuments.net/doc/165x107/5538dd514a795971788b4837/marketing-trend-2014-marketing-trend.jpg)


