Volcanoes and decadal forecasts with EC-
Earth Martin Ménégoz, Francisco
Doblas-Reyes, Virginie Guemas, Asif Muhammad
EC-Earth Meeting, Reading, May 2015
Reading, May 2015 2
Introduction
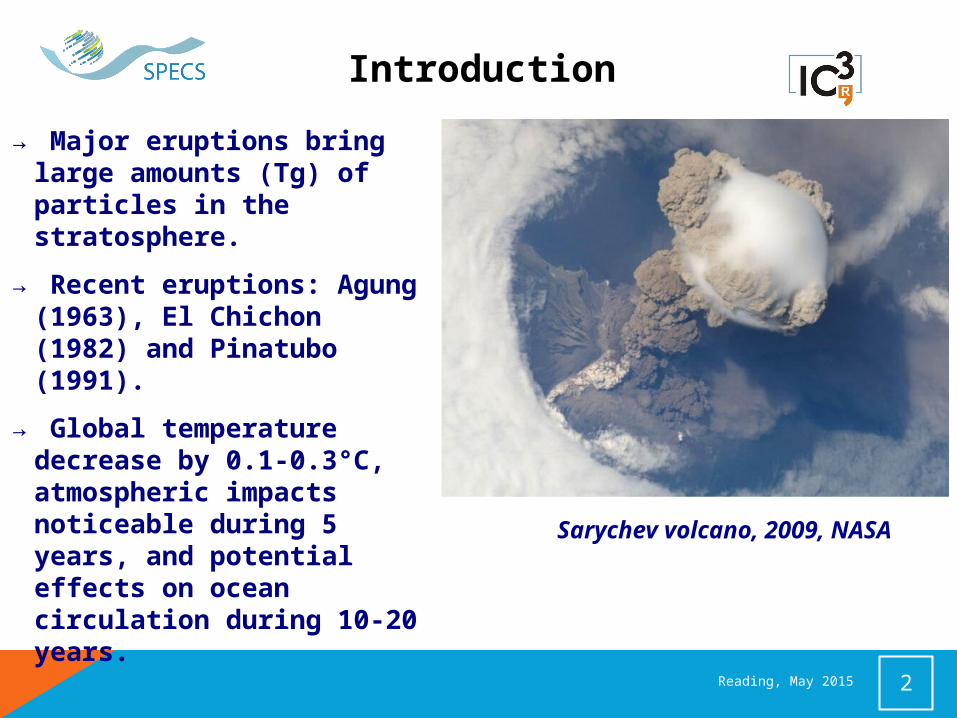
→ Major eruptions bring large amounts (Tg) of particles in the stratosphere.
→ Recent eruptions: Agung (1963), El Chichon (1982) and Pinatubo (1991).
→ Global temperature decrease by 0.1-0.3°C, atmospheric impacts noticeable during 5 years, and potential effects on ocean circulation during 10-20 years.
Sarychev volcano, 2009, NASA

3
Introduction
EC-Earth
Initialisation
Forcings (GHGs,
aerosols)
Forecast
→ Simulations with/without initialisation
→ Simulations with/without volcanic forcing
→ Simulations with idealized volcanic forcing Reading, May 2015
4
→ Climate response to volcanoes
→ Initialisation and volcanic forcing in forecasts
→ Correlations and RMSEReading, May 2015

5
→ Climate response to volcanoes
→ Initialisation and volcanic forcing in forecasts
→ Correlations and RMSEReading, May 2015

6
Climate response to volcanoes
Surface temperature anomalies over forecast years 1-3 after the last 3 major eruptions: (a) Observation; (b) EC-Earth hindcasts.
Anomalies are averaged over 3 start dates (and 5 members for the simulations). Shaded areas show regions with significant differences
with a 5% level, areas without observations appear in white.
(a) Observation (b) Model
→ Large inter-annual variability partly overwhelms the volcanic signal
Reading, May 2015
7
Climate response to volcanoes
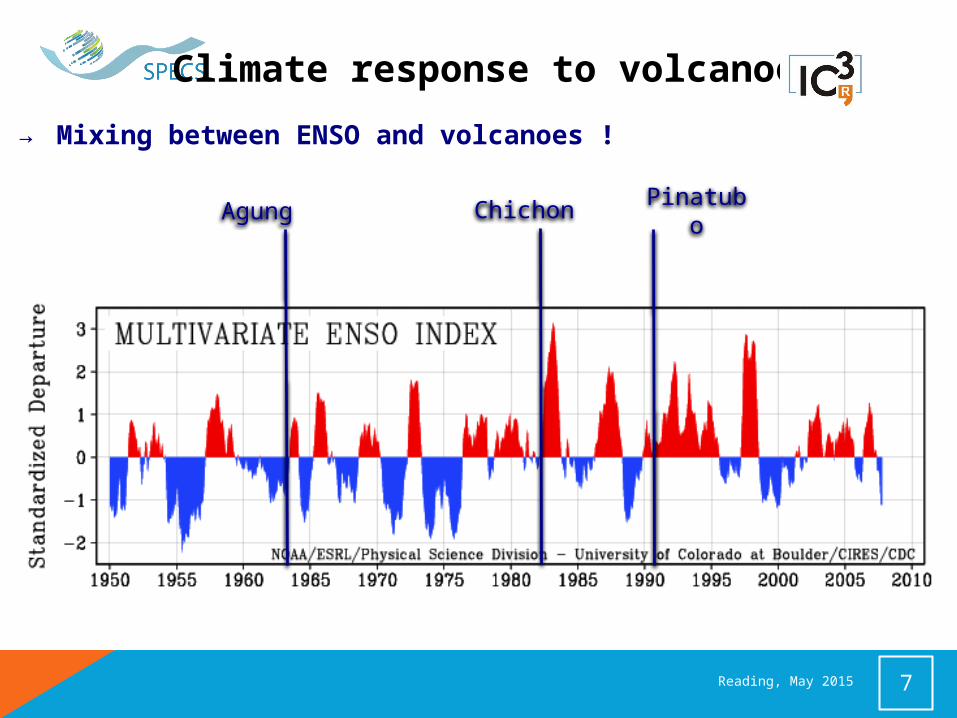
Agung Chichon Pinatubo
→ Mixing between ENSO and volcanoes !
Reading, May 2015
8
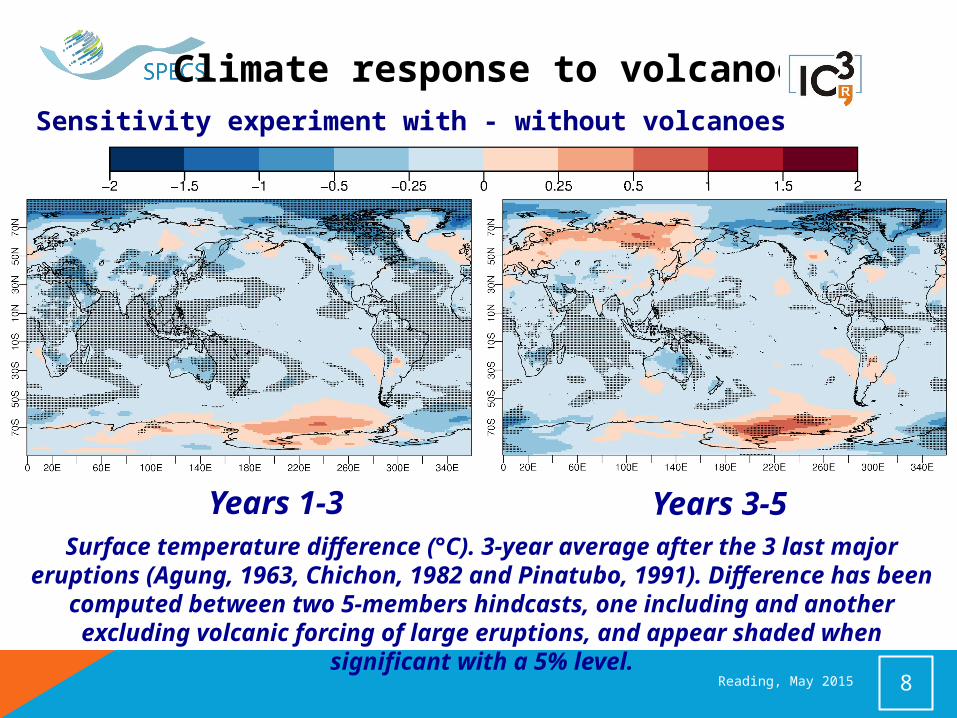
Climate response to volcanoesSensitivity experiment with - without volcanoes
Surface temperature difference (°C). 3-year average after the 3 last major eruptions (Agung, 1963, Chichon, 1982 and Pinatubo, 1991). Difference has been computed between two 5-members hindcasts,
one including and another excluding volcanic forcing of large eruptions, and appear shaded when significant with a 5% level.
Years 1-3
Years 3-5
Reading, May 2015

9
→ Climate response to volcanoes
→ Initialisation and volcanic forcing in forecasts
→ Correlations and RMSEReading, May 2015
10
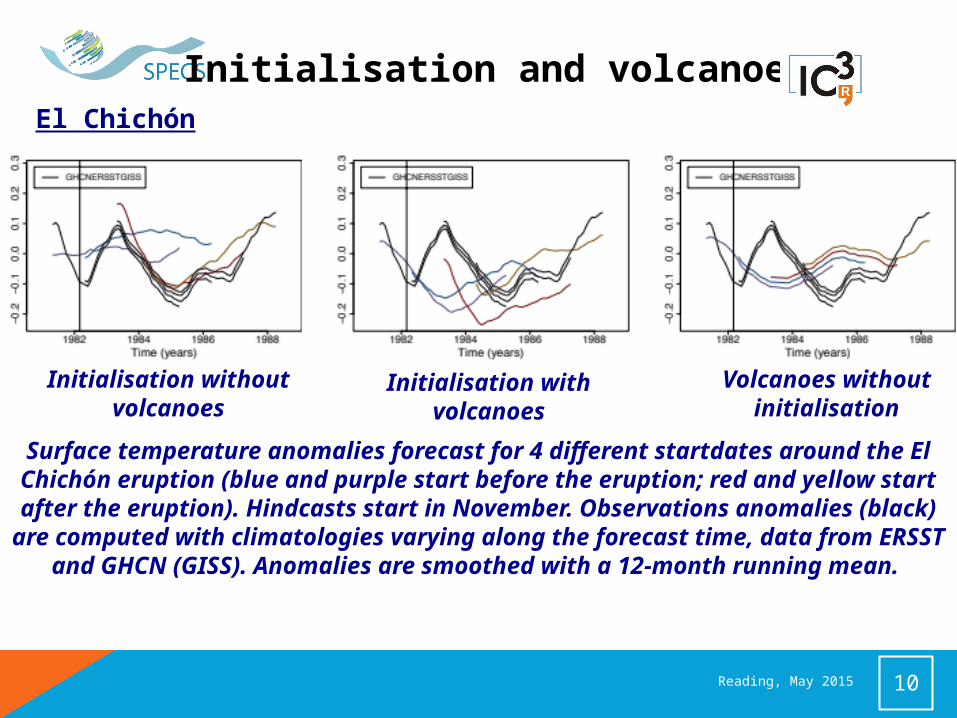
Initialisation and volcanoesEl Chichón
Surface temperature anomalies forecast for 4 different startdates around the El Chichón eruption (blue and purple start before the
eruption; red and yellow start after the eruption). Hindcasts start in November. Observations anomalies (black) are computed with
climatologies varying along the forecast time, data from ERSST and GHCN (GISS). Anomalies are smoothed with a 12-month running
mean.
Reading, May 2015
Initialisation without volcanoes
Initialisation with volcanoes
Volcanoes without initialisation
11
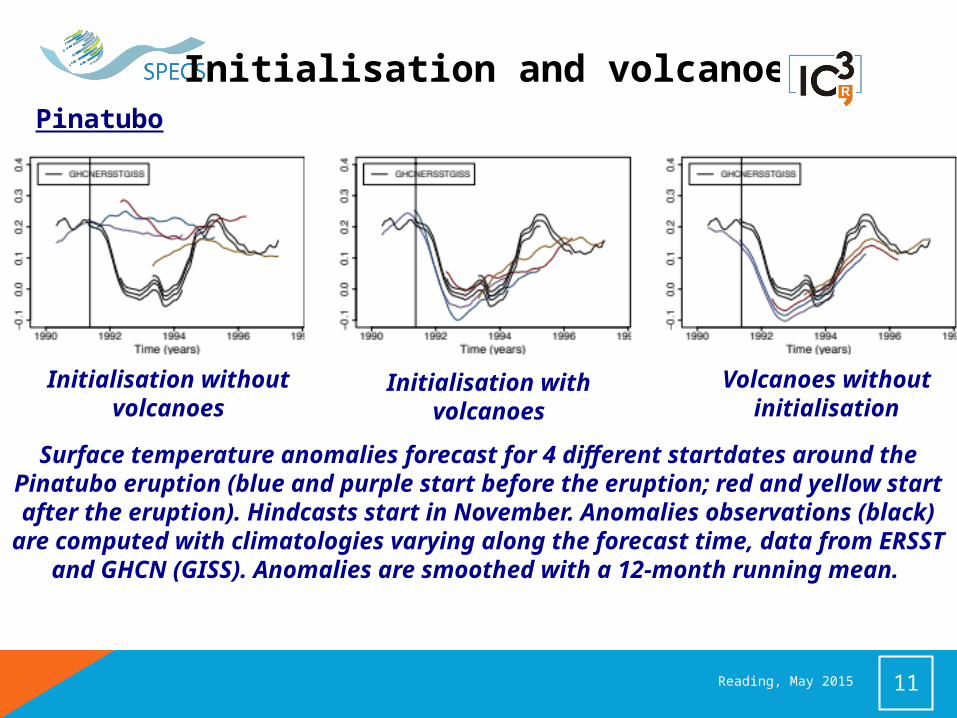
Initialisation and volcanoes
Surface temperature anomalies forecast for 4 different startdates around the Pinatubo eruption (blue and purple start before the
eruption; red and yellow start after the eruption). Hindcasts start in November. Anomalies observations (black) are computed with
climatologies varying along the forecast time, data from ERSST and GHCN (GISS). Anomalies are smoothed with a 12-month running
mean.
Pinatubo
Reading, May 2015
Initialisation without volcanoes
Initialisation with volcanoes
Volcanoes without initialisation
12
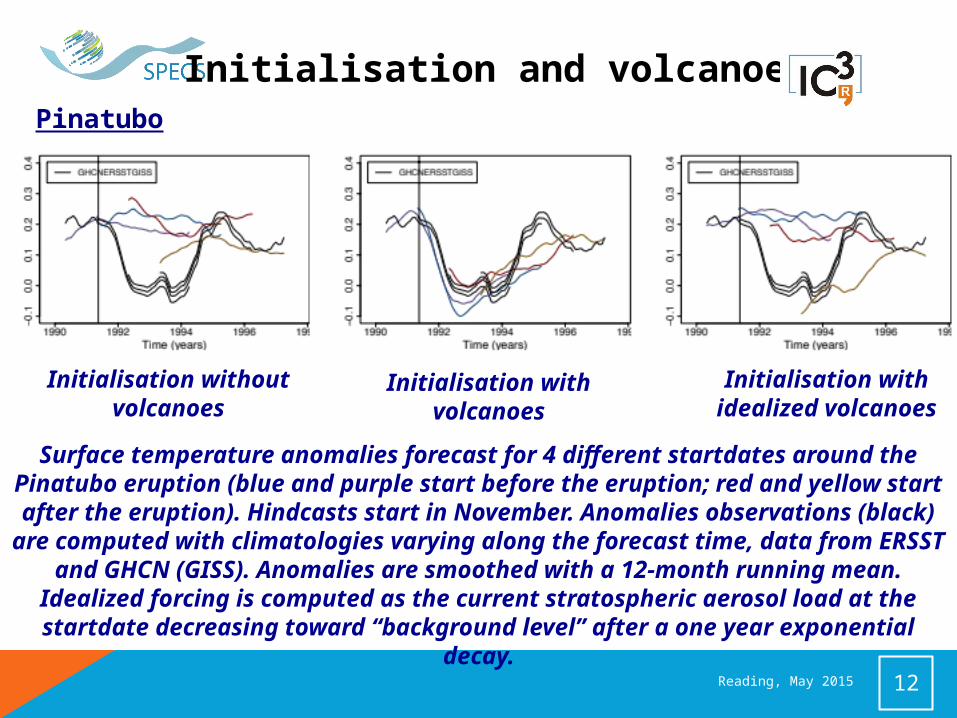
Initialisation and volcanoes
Surface temperature anomalies forecast for 4 different startdates around the Pinatubo eruption (blue and purple start before the
eruption; red and yellow start after the eruption). Hindcasts start in November. Anomalies observations (black) are computed with
climatologies varying along the forecast time, data from ERSST and GHCN (GISS). Anomalies are smoothed with a 12-month running mean. Idealized forcing is computed as the current stratospheric
aerosol load at the startdate decreasing toward “background level” after a one year exponential decay. Reading, May 2015
Pinatubo
Initialisation without volcanoes
Initialisation with volcanoes
Initialisation with idealized volcanoes
13
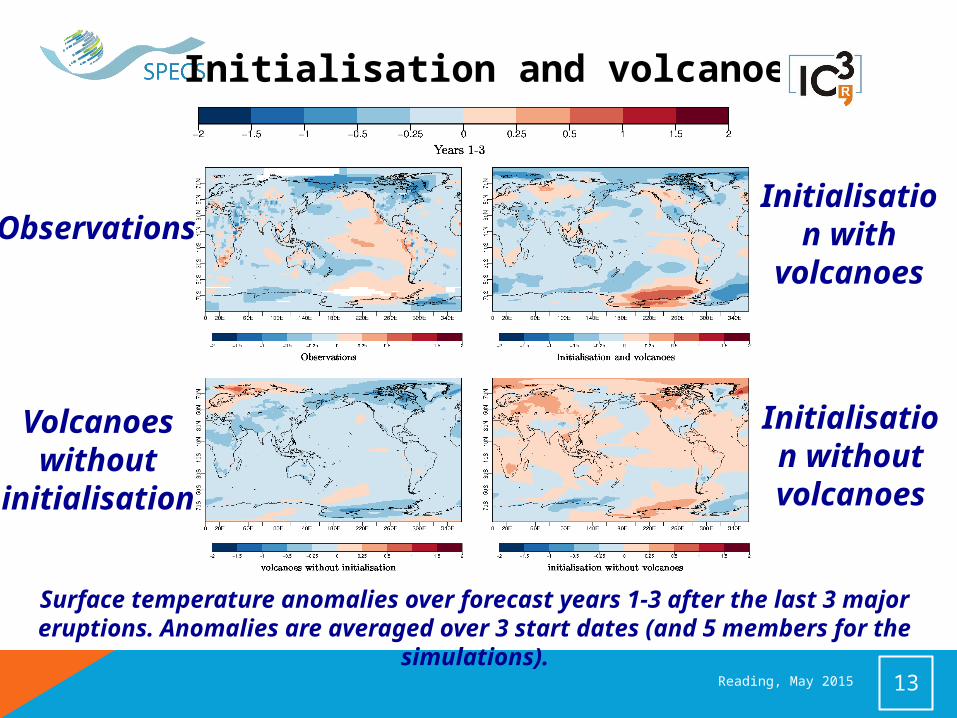
Initialisation and volcanoes
Surface temperature anomalies over forecast years 1-3 after the last 3 major eruptions. Anomalies are averaged over 3 start dates (and 5
members for the simulations).
Observations
Initialisation with
volcanoes
Volcanoes without
initialisation
Initialisation without volcanoes
Reading, May 2015

14
→ Climate response to volcanoes
→ Initialisation and volcanic forcing in forecasts
→ Correlations and RMSEReading, May 2015
15
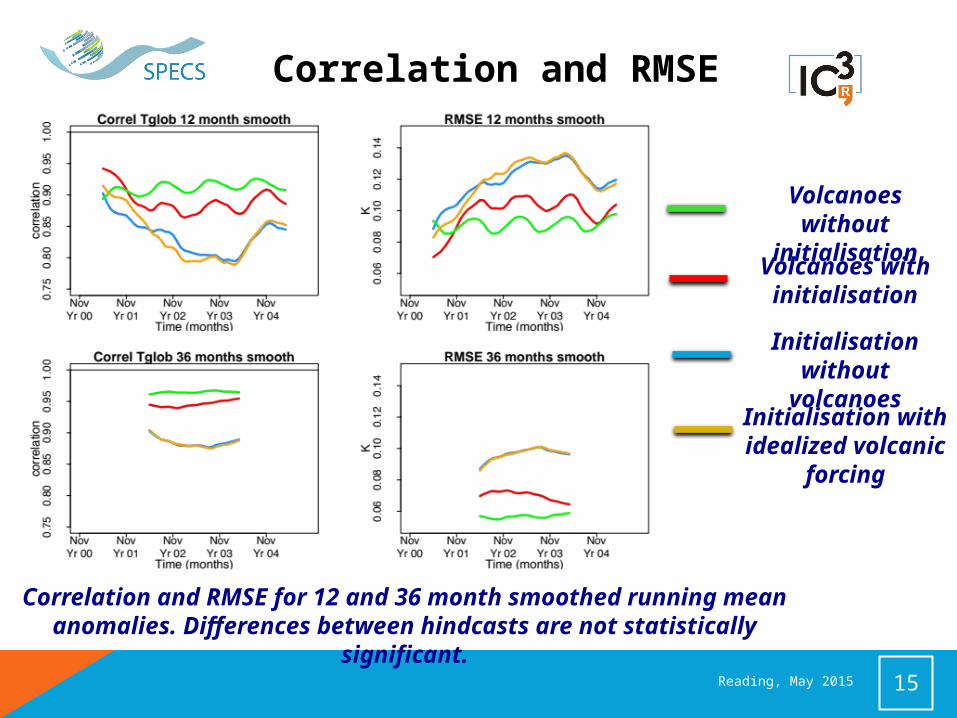
Correlation and RMSE
Volcanoes without
initialisationVolcanoes with initialisation
Initialisation without
volcanoesInitialisation with idealized
volcanic forcing
Correlation and RMSE for 12 and 36 month smoothed running mean anomalies. Differences between hindcasts
are not statistically significant.Reading, May 2015
16
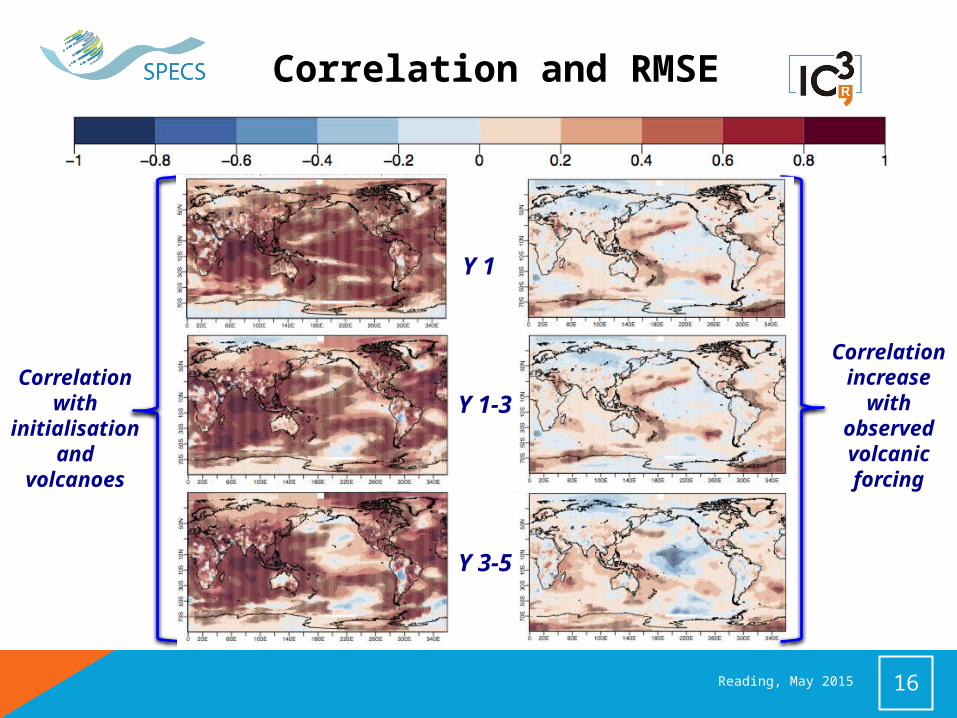
Correlation and RMSE
Correlation increase
with observed volcanic forcing
Y 1-3
Y 3-5
Y 1
Correlation with
initialisation and
volcanoes
Reading, May 2015
17
Conclusion
→ Temperature anomalies after large eruptions are a mix between internal variability and volcanic signal.
→ Evaluating the performances of climate forecast systems cannot be done without considering large eruptions that occurred during the last decades.
→ EC-Earth historical simulation has higher skill than hindcasts.
→ Including volcanic forcing in forecast systems allows an increase of the skill for surface temperature mainly in Western Pacific, tropical Atlantic and Indian Ocean.
→ It is challenging to design idealized volcanic forcing that could be used in operational forecasts.
Reading, May 2015
18
Thank you
Reading, May 2015

19
Appendix
→ Skill diagnosed with idealized forcing
Reading, May 2015
20
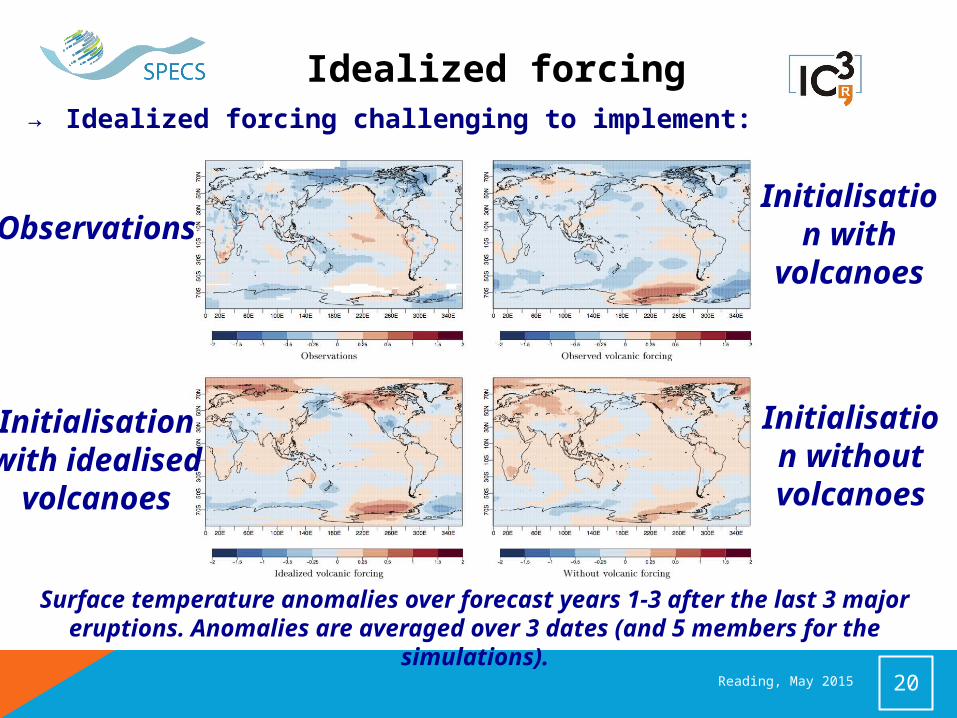
Idealized forcing→ Idealized forcing challenging to implement:
Surface temperature anomalies over forecast years 1-3 after the last 3 major eruptions. Anomalies are averaged over 3 dates (and 5
members for the simulations).
Observations
Initialisation with
volcanoes
Initialisation with
idealised volcanoes
Initialisation without volcanoes
Reading, May 2015
21
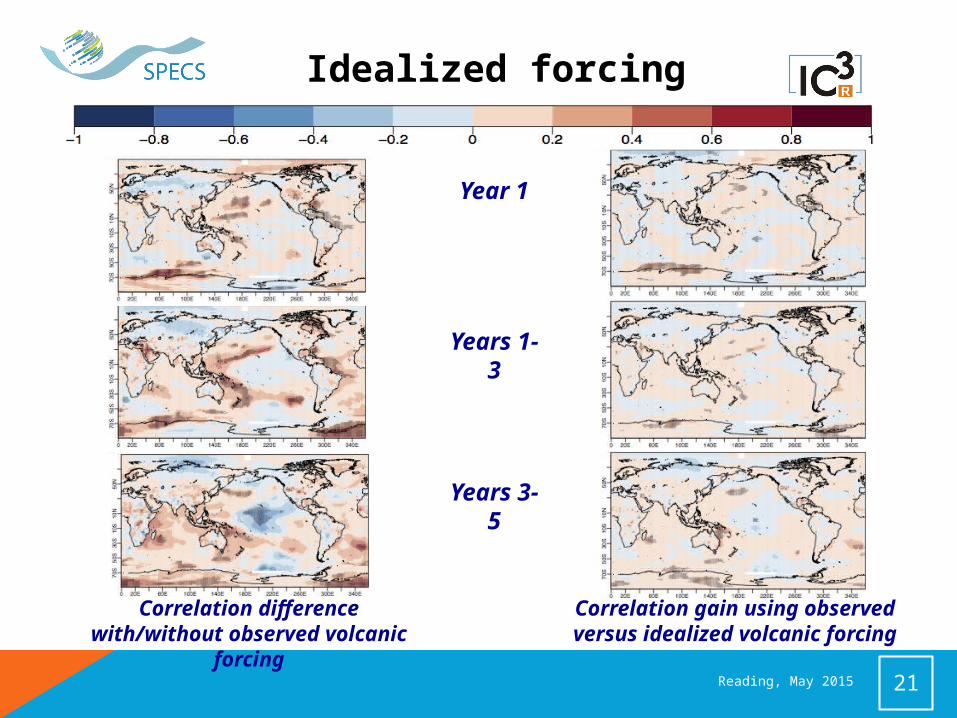
Idealized forcing
Years 1-3
Years 3-5
Year 1
Correlation difference with/without observed
volcanic forcing
Correlation gain using observed versus idealized
volcanic forcingReading, May 2015

22
Initialisation
Reading, May 2015


![K EC, KVKE EC, TFSR EC, TFSK EC, KVO EC, KD EC · k ec, kvke ec, tfsr ec, tfsk ec, kvo ec, kd ec ... sk si gb fr ... 1=min 5 (10,0v) 0 0.5 1 1.5 2 0 200 400 600 [m³/s] [pa]](https://cdn.vdocuments.net/doc/165x107/5ad4f62a7f8b9a571e8ce97b/k-ec-kvke-ec-tfsr-ec-tfsk-ec-kvo-ec-kd-ec-ec-kvke-ec-tfsr-ec-tfsk-ec-kvo.jpg)