Download - Yvonne Brown - DMUG 2014

© - Copyright 2014 Bureau Veritas – All rights reserved
DMUG 2014: Emissions Factors Tookit Update
2nd December 2014
Yvonne Brown
Technical Director
Air Quality
2Bureau Veritas Air Quality© - Copyright 2014 Bureau Veritas – All rights reserved
Overview
► Reminder of steps involved in calculating factors
► Changes to
Emissions Factors for NOx and PM
Changes to Fleet Information
Euro Compositions
► How have emissions changed?
► Alternative Technologies
► Other Updates
► Questions?

3Bureau Veritas Air Quality© - Copyright 2014 Bureau Veritas – All rights reserved
Reminder of Basic Steps
►Final Emissions Factors (g/km) take account of the following steps
Speed related Emissions Functions (polynomial equations with coefficients)
Degradation Factors (only Petrol Cars/LGVs Euro 1-4)
Fuel Scaling Factors
Fleet Information
• Euro compositions
• Vehicle compositions and sizes
• Region and Road Type
►Which of these have changed varies by vehicle type and therefore determines the overall change

4Bureau Veritas Air Quality© - Copyright 2014 Bureau Veritas – All rights reserved
Changes to NOx
► EFT v5 updated DfT TRL Emissions Factors for NOx to COPERT v8.1
► EFT v6 updated COPERTv10 for NOx
Euro 5 and 6 diesel cars – coefficients updated
Euro 5 and 6 LGVs – coefficients updated based on scaling of diesel cars.
Update aimed at reflecting more recent evidence from real-world emissions performance
No other changes to emissions functions
► Degradation calculations applied to petrol Cars and LGVs are unchanged.
► Fuel Scaling Factors updated from TRL to R-AEA based
Marginal changes
5Bureau Veritas Air Quality© - Copyright 2014 Bureau Veritas – All rights reserved
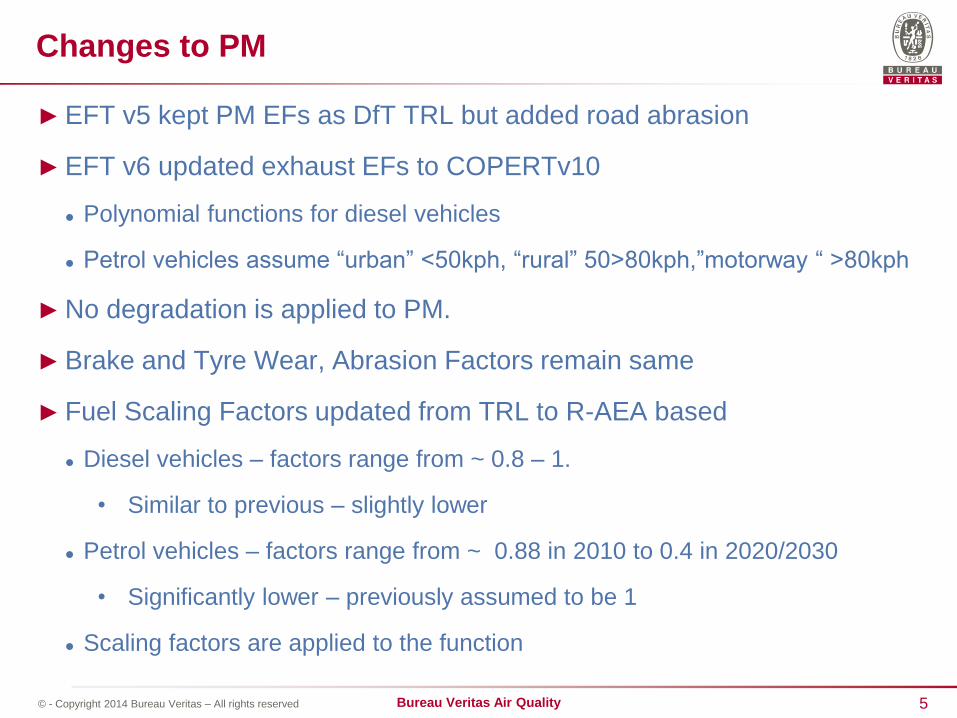
Changes to PM
► EFT v5 kept PM EFs as DfT TRL but added road abrasion
► EFT v6 updated exhaust EFs to COPERTv10
Polynomial functions for diesel vehicles
Petrol vehicles assume “urban” <50kph, “rural” 50>80kph,”motorway “ >80kph
► No degradation is applied to PM.
► Brake and Tyre Wear, Abrasion Factors remain same
► Fuel Scaling Factors updated from TRL to R-AEA based
Diesel vehicles – factors range from ~ 0.8 – 1.
• Similar to previous – slightly lower
Petrol vehicles – factors range from ~ 0.88 in 2010 to 0.4 in 2020/2030
• Significantly lower – previously assumed to be 1
Scaling factors are applied to the function
6Bureau Veritas Air Quality© - Copyright 2014 Bureau Veritas – All rights reserved
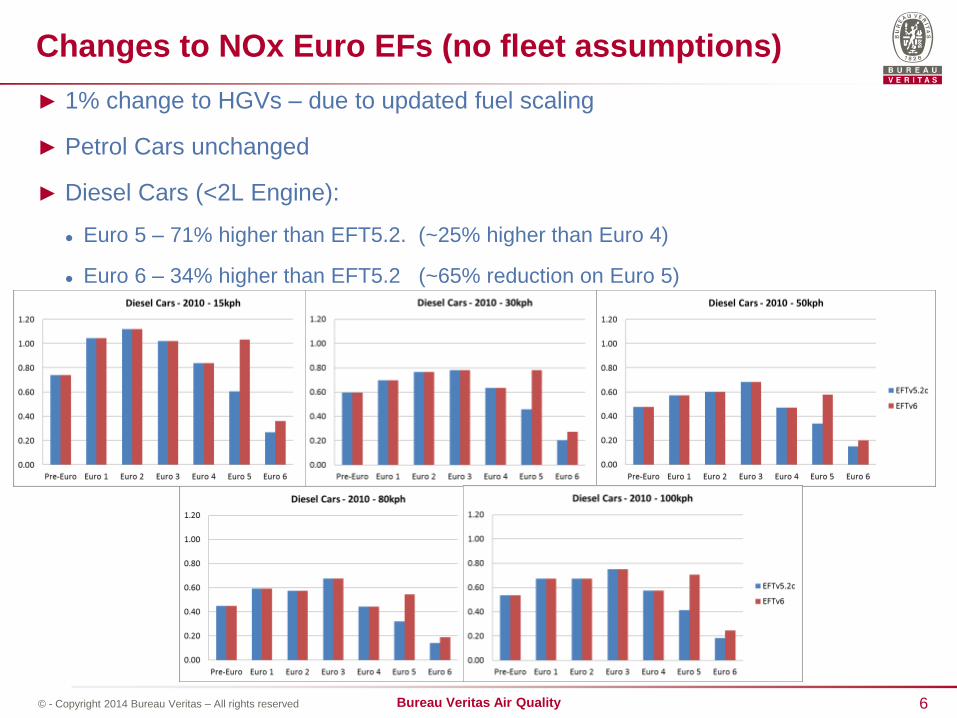
Changes to NOx Euro EFs (no fleet assumptions)
► 1% change to HGVs – due to updated fuel scaling
► Petrol Cars unchanged
► Diesel Cars (<2L Engine):
Euro 5 – 71% higher than EFT5.2. (~25% higher than Euro 4)
Euro 6 – 34% higher than EFT5.2 (~65% reduction on Euro 5)
7Bureau Veritas Air Quality© - Copyright 2014 Bureau Veritas – All rights reserved
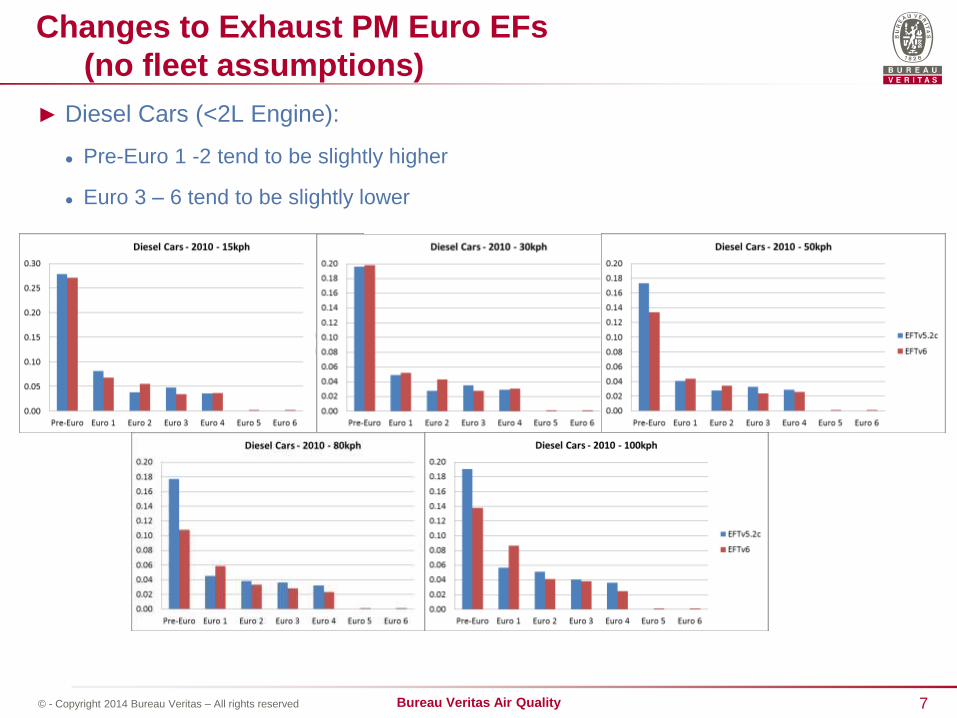
Changes to Exhaust PM Euro EFs
(no fleet assumptions)
► Diesel Cars (<2L Engine):
Pre-Euro 1 -2 tend to be slightly higher
Euro 3 – 6 tend to be slightly lower

8Bureau Veritas Air Quality© - Copyright 2014 Bureau Veritas – All rights reserved
Changes to Exhaust PM Euro EFs
(no fleet assumptions)► Petrol Cars (<2L Engine):
All significantly lower - greater effects of scaling factors in later years
9Bureau Veritas Air Quality© - Copyright 2014 Bureau Veritas – All rights reserved
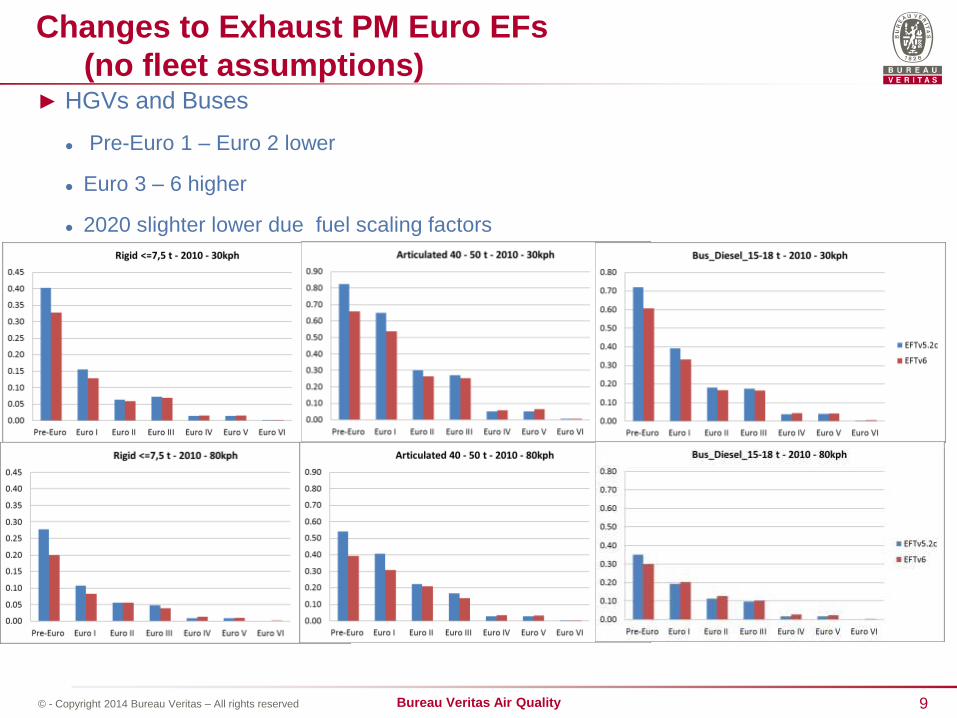
Changes to Exhaust PM Euro EFs
(no fleet assumptions)► HGVs and Buses
Pre-Euro 1 – Euro 2 lower
Euro 3 – 6 higher
2020 slighter lower due fuel scaling factors
10Bureau Veritas Air Quality© - Copyright 2014 Bureau Veritas – All rights reserved
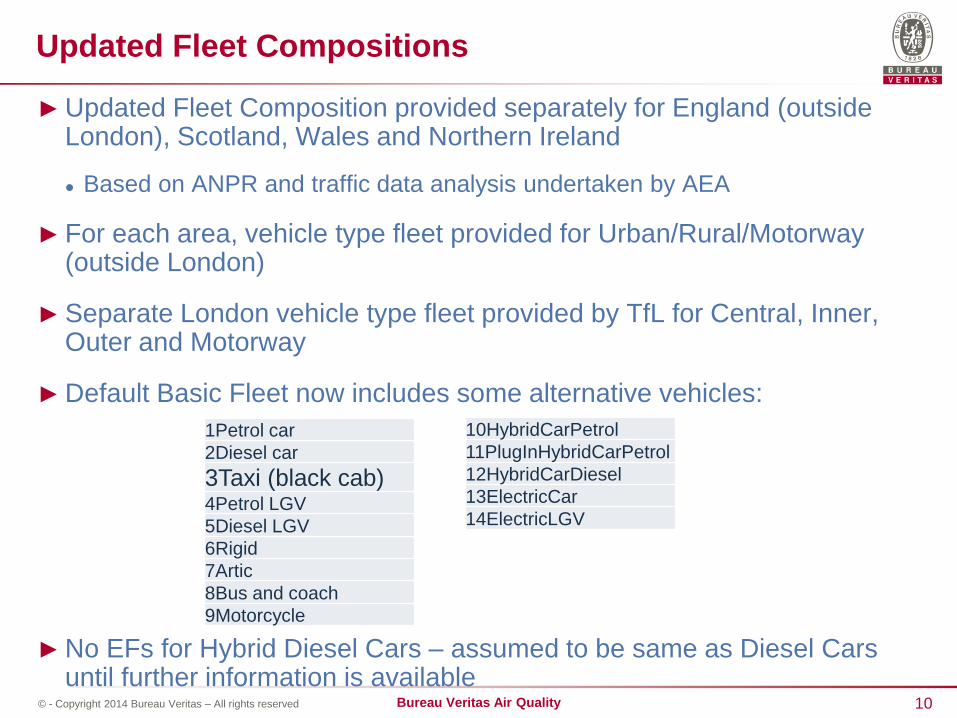
Updated Fleet Compositions
► Updated Fleet Composition provided separately for England (outside London), Scotland, Wales and Northern Ireland
Based on ANPR and traffic data analysis undertaken by AEA
► For each area, vehicle type fleet provided for Urban/Rural/Motorway (outside London)
► Separate London vehicle type fleet provided by TfL for Central, Inner, Outer and Motorway
► Default Basic Fleet now includes some alternative vehicles:
► No EFs for Hybrid Diesel Cars – assumed to be same as Diesel Cars until further information is available
1Petrol car
2Diesel car
3Taxi (black cab)4Petrol LGV
5Diesel LGV
6Rigid
7Artic
8Bus and coach
9Motorcycle
10HybridCarPetrol
11PlugInHybridCarPetrol
12HybridCarDiesel
13ElectricCar
14ElectricLGV

11Bureau Veritas Air Quality© - Copyright 2014 Bureau Veritas – All rights reserved
Updated Fleet Compositions
► By 2030 15% of the fleet veh/km (Urban-England) is estimated to be hybrid/electric
4% of car fleet by 2020, 17% of the car fleet by 2030
12Bureau Veritas Air Quality© - Copyright 2014 Bureau Veritas – All rights reserved
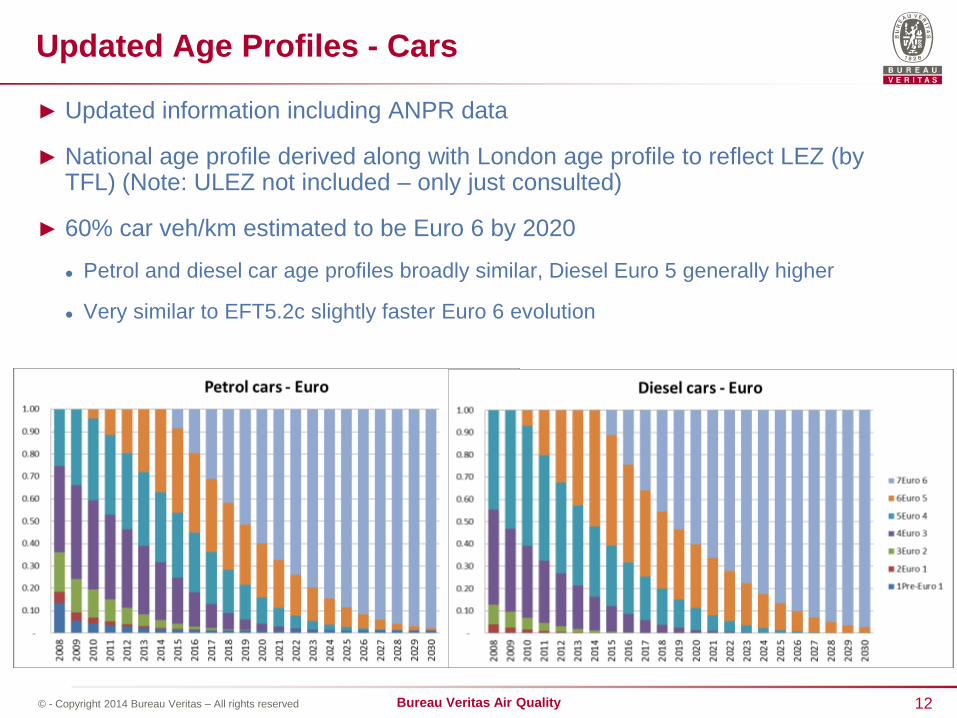
Updated Age Profiles - Cars
► Updated information including ANPR data
► National age profile derived along with London age profile to reflect LEZ (by TFL) (Note: ULEZ not included – only just consulted)
► 60% car veh/km estimated to be Euro 6 by 2020
Petrol and diesel car age profiles broadly similar, Diesel Euro 5 generally higher
Very similar to EFT5.2c slightly faster Euro 6 evolution

13Bureau Veritas Air Quality© - Copyright 2014 Bureau Veritas – All rights reserved
Updated Age Profiles - LGV
► 70% car veh/km estimated to be Euro 6 by 2020
Very similar to EFT5.2c
14Bureau Veritas Air Quality© - Copyright 2014 Bureau Veritas – All rights reserved
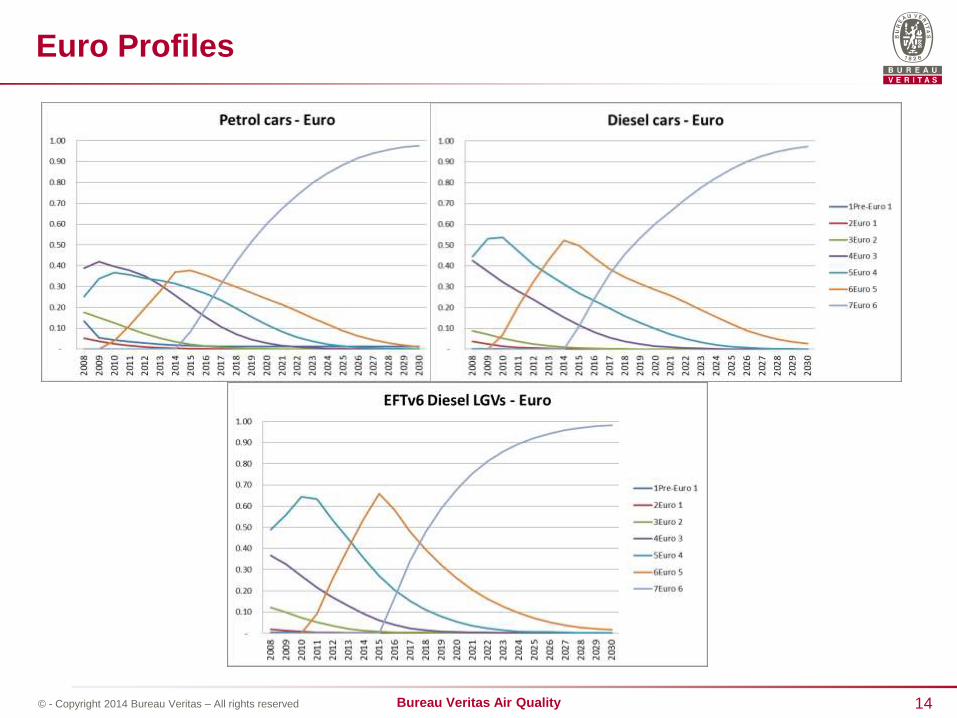
Euro Profiles
15Bureau Veritas Air Quality© - Copyright 2014 Bureau Veritas – All rights reserved
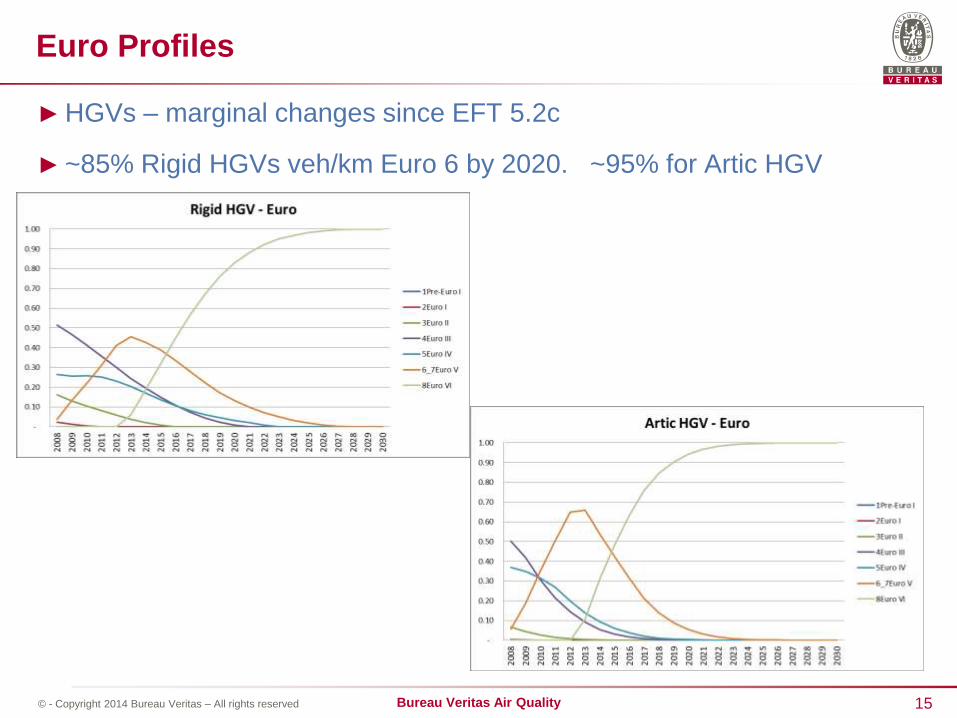
Euro Profiles
► HGVs – marginal changes since EFT 5.2c
► ~85% Rigid HGVs veh/km Euro 6 by 2020. ~95% for Artic HGV
16Bureau Veritas Air Quality© - Copyright 2014 Bureau Veritas – All rights reserved
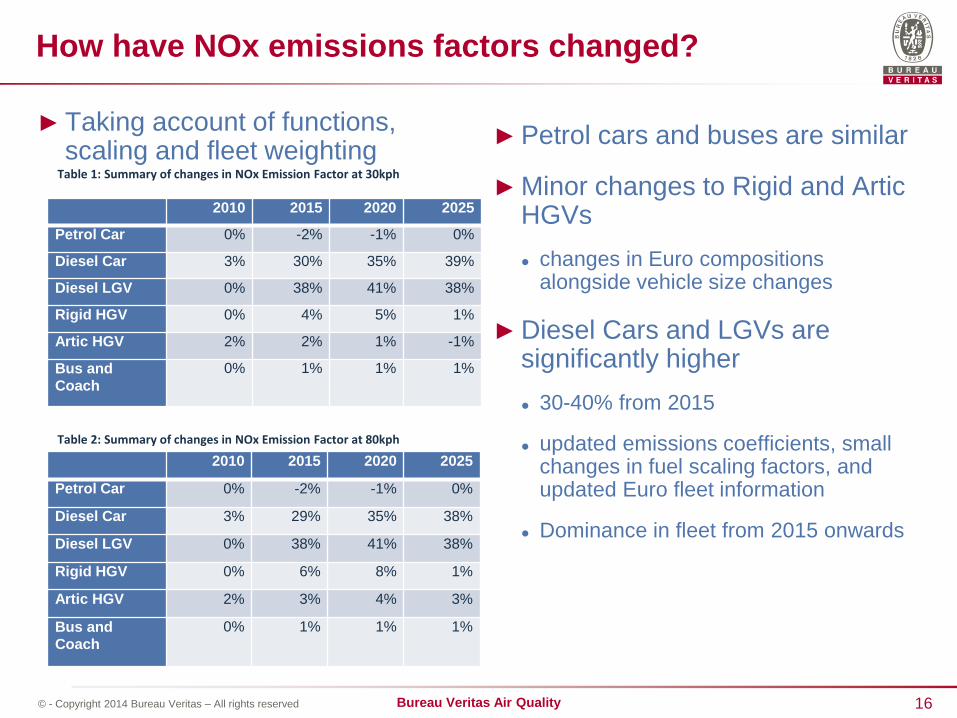
How have NOx emissions factors changed?
► Taking account of functions, scaling and fleet weighting
► Petrol cars and buses are similar
► Minor changes to Rigid and Artic HGVs
changes in Euro compositions alongside vehicle size changes
► Diesel Cars and LGVs are significantly higher
30-40% from 2015
updated emissions coefficients, small changes in fuel scaling factors, and updated Euro fleet information
Dominance in fleet from 2015 onwards
2010 2015 2020 2025
Petrol Car 0% -2% -1% 0%
Diesel Car 3% 30% 35% 39%
Diesel LGV 0% 38% 41% 38%
Rigid HGV 0% 4% 5% 1%
Artic HGV 2% 2% 1% -1%
Bus and
Coach
0% 1% 1% 1%
Table 1: Summary of changes in NOx Emission Factor at 30kph
2010 2015 2020 2025
Petrol Car 0% -2% -1% 0%
Diesel Car 3% 29% 35% 38%
Diesel LGV 0% 38% 41% 38%
Rigid HGV 0% 6% 8% 1%
Artic HGV 2% 3% 4% 3%
Bus and
Coach
0% 1% 1% 1%
Table 2: Summary of changes in NOx Emission Factor at 80kph
17Bureau Veritas Air Quality© - Copyright 2014 Bureau Veritas – All rights reserved
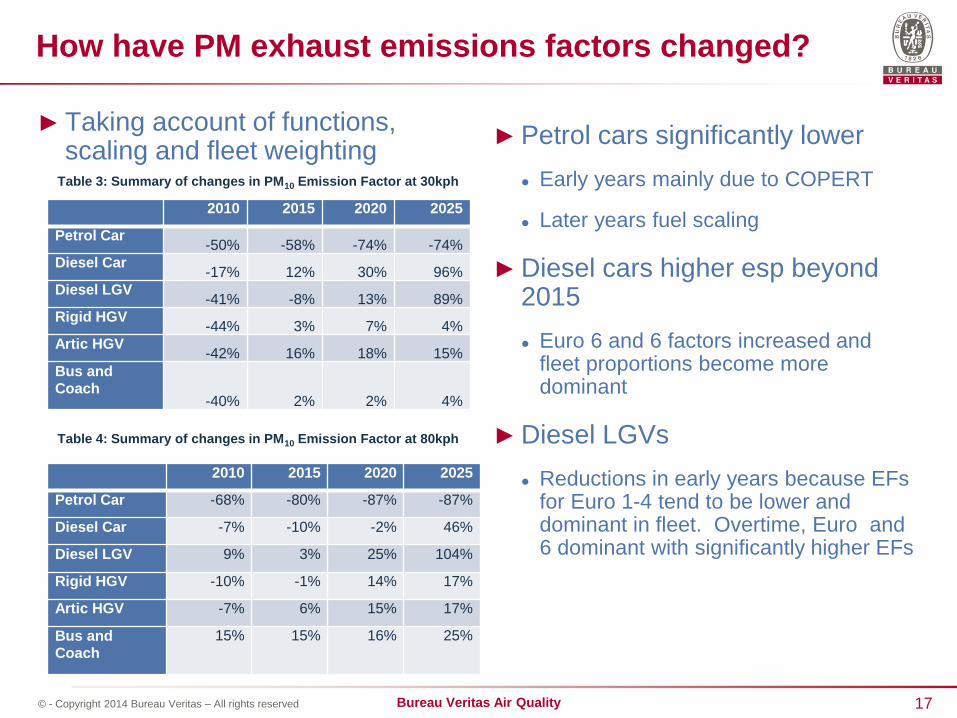
How have PM exhaust emissions factors changed?
► Taking account of functions, scaling and fleet weighting
► Petrol cars significantly lower
Early years mainly due to COPERT
Later years fuel scaling
► Diesel cars higher esp beyond 2015
Euro 6 and 6 factors increased and fleet proportions become more dominant
► Diesel LGVs
Reductions in early years because EFs for Euro 1-4 tend to be lower and dominant in fleet. Overtime, Euro and 6 dominant with significantly higher EFs
Table 3: Summary of changes in PM10 Emission Factor at 30kph
Table 4: Summary of changes in PM10 Emission Factor at 80kph
2010 2015 2020 2025
Petrol Car-50% -58% -74% -74%
Diesel Car-17% 12% 30% 96%
Diesel LGV-41% -8% 13% 89%
Rigid HGV-44% 3% 7% 4%
Artic HGV-42% 16% 18% 15%
Bus and
Coach-40% 2% 2% 4%
2010 2015 2020 2025
Petrol Car -68% -80% -87% -87%
Diesel Car -7% -10% -2% 46%
Diesel LGV 9% 3% 25% 104%
Rigid HGV -10% -1% 14% 17%
Artic HGV -7% 6% 15% 17%
Bus and
Coach
15% 15% 16% 25%
18Bureau Veritas Air Quality© - Copyright 2014 Bureau Veritas – All rights reserved
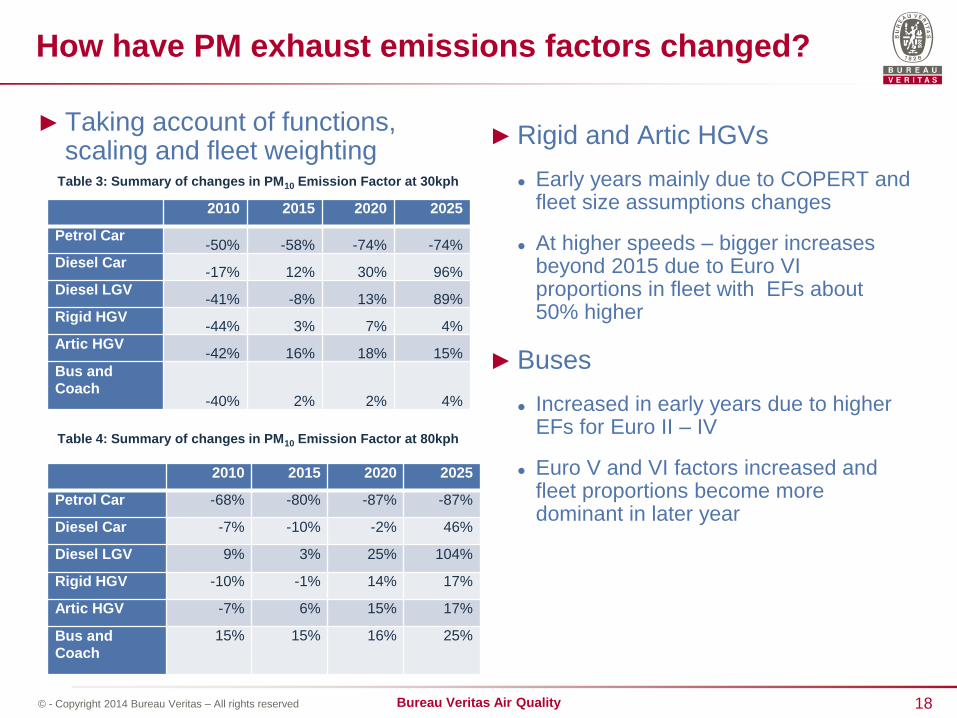
How have PM exhaust emissions factors changed?
► Taking account of functions, scaling and fleet weighting
► Rigid and Artic HGVs
Early years mainly due to COPERT and fleet size assumptions changes
At higher speeds – bigger increases beyond 2015 due to Euro VI proportions in fleet with EFs about 50% higher
► Buses
Increased in early years due to higher EFs for Euro II – IV
Euro V and VI factors increased and fleet proportions become more dominant in later year
Table 3: Summary of changes in PM10 Emission Factor at 30kph
Table 4: Summary of changes in PM10 Emission Factor at 80kph
2010 2015 2020 2025
Petrol Car-50% -58% -74% -74%
Diesel Car-17% 12% 30% 96%
Diesel LGV-41% -8% 13% 89%
Rigid HGV-44% 3% 7% 4%
Artic HGV-42% 16% 18% 15%
Bus and
Coach-40% 2% 2% 4%
2010 2015 2020 2025
Petrol Car -68% -80% -87% -87%
Diesel Car -7% -10% -2% 46%
Diesel LGV 9% 3% 25% 104%
Rigid HGV -10% -1% 14% 17%
Artic HGV -7% 6% 15% 17%
Bus and
Coach
15% 15% 16% 25%
19Bureau Veritas Air Quality© - Copyright 2014 Bureau Veritas – All rights reserved
Alternative Technologies - assumptions
► EFT has options for users to provide their own alternative fleet incorporating the following technologies:
Full Hybrid Electric and Plug-in Hybrid Electric cars and vans
Hybrid-Diesel Cars
Battery Electric cars and vans and Fuel Cell Vehicles (zero tailpipe emissions)
Alternative fuels: CNG Buses, LPG cars, High Strength Biofuels (E85 Bioethanol, B100 Biodiesel)
Retrofitting DPF, SCR
Hybrid Buses
Only including available information – not all alternatives are included
► Scaling factors or emission factors assumed are same as those in NAEI available here
► Current best estimates and Information updated when available
20Bureau Veritas Air Quality© - Copyright 2014 Bureau Veritas – All rights reserved
Other Updates
►User Defined Euro splits and vehicle fleet options improved
►Option 3 allows user to define petrol/diesel car proportions
►Updated v6.0.1 July 2014
fixed issue with CO2 Output (tonnes not kg)
►Updated v6.0.2 Dec 2014
Bug Fix for 100% HDV runtime error in Basic Split
Alternative Vehicles output error fixed
• g/km/sec and annual emissions – g/km output not affected.
►Future updates in line with NAEI methodology changes

© - Copyright 2014 Bureau Veritas – All rights reserved
http://laqm.defra.gov.uk
http://aqma.defra.gov.uk
http://laqm.defra.gov.uk/1rsw
Helpdesk Tel: 0800 032 7953
Yvonne Brown
0207 661 0762
Thank You


