downloaded from on july 12, 2019 by guest · 3 58 introduction 59 candida albicans is both an...
TRANSCRIPT

1
Candida albicans and bacterial microbiota interactions in the cecum during re-1 colonization following broad spectrum antibiotic therapy 2
3
Katie L. Mason1,2, John R. Erb Downward1, Kelly D. Mason1, Nicole R. Falkowski1, Kathryn A. 4 Eaton2,4, John Y. Kao5, Vincent B. Young2,3, and Gary B. Huffnagle1,2* 5
6 1 Division of Pulmonary and Critical Care, Department of Internal Medicine, 7
2 Department of Microbiology and Immunology, 8 3 Infectious Diseases Division, Department of Internal Medicine, 9
4 Unit for Laboratory Animal Medicine, 10 5 Gastroenterology Division, Department of Internal Medicine, 11
University of Michigan Medical School 12 13 Running Title: C. albicans - bacterial microbiome re-colonization dynamics 14 15 *corresponding author 16 17 Gary B. Huffnagle 18 Department of Internal Medicine (Pulmonary) 19 6240 MSRB 3 - box 5642 20 1150 W. Medical Ctr. Dr. 21 University of Michigan Med. Ctr. 22 Ann Arbor, MI 48109-5642 23 (734) 936-9369 (office) 24 (734) 936-5010 (administrative assistant) 25 (734) 764-2655 (fax) 26 [email protected] 27 28
ABBREVIATION LIST 29
SDA – Sabouraud dextrose agar 30
MRS – deMan, Rogosa and Sharpe media 31
LAB – lactic acid bacteria 32
OTU – operational taxonomic unit 33
RDP – ribosomal database project 34
T-RFLP – terminal restriction fragment length polymorphism 35
pSI – proximal small intestine 36
dSI – distal small intestine 37
H&E – hematoxylin and eosin stain 38
Copyright © 2012, American Society for Microbiology. All Rights Reserved.Infect. Immun. doi:10.1128/IAI.00449-12 IAI Accepts, published online ahead of print on 9 July 2012
on October 12, 2019 by guest
http://iai.asm.org/
Dow
nloaded from
2
SUMMARY 39
Candida albicans is a normal member of the gastrointestinal (GI) tract of healthy 40
humans, but during host immuno-suppression or alterations in the bacterial microbiota, C. 41
albicans can disseminate and cause life-threatening illness. The bacterial microbiome of the GI 42
tract, including lactic acid bacteria (LAB), plays a vital role in preventing fungal invasion. 43
However, little is known about the role of C. albicans in shaping the bacterial microbiota during 44
antibiotic recovery. We investigated the fungal burdens in the GI tract of germ-free and 45
microbiome-disturbed mice to demonstrate the role of the microbiota in preventing C. albicans 46
colonization. Histological analysis demonstrated that colonization with C. albicans during 47
antibiotic treatment does not trigger overt inflammation in the murine cecum. Bacterial diversity 48
is reduced long-term following cefoperazone treatment, but the presence of C. albicans during 49
antibiotic recovery promoted the recovery of bacterial diversity. Cefoperazone diminishes 50
Bacteroidetes populations long-term in the ceca of mice, but the presence of C. albicans 51
during cefoperazone recovery promoted Bacteroidetes population recovery. However, the 52
presence of C. albicans resulted in a long-term reduction in Lactobacillus spp. and promoted 53
E. faecalis populations. Previous studies have focused on the ability of bacteria to alter C. 54
albicans, this study addresses the ability of C. albicans to alter the bacterial microbiota during 55
non-pathogenic colonization. 56
57
on October 12, 2019 by guest
http://iai.asm.org/
Dow
nloaded from
3
INTRODUCTION 58
Candida albicans is both an opportunistic fungal pathogen and a normal member of the 59
human gastrointestinal (GI) tract. It can persist in the GI tract in a nonpathogenic state for long 60
periods of time in most humans, but upon disruption of the host immune system or indigenous 61
bacterial microbiota, C. albicans can disseminate and cause life-threatening infections (26). 62
The bacteria in the GI tract play a critical role in preventing fungal colonization and invasion, as 63
indicated by the enhanced susceptibility of germfree mice to Candida colonization (6-8, 17, 32-64
34). Thus the ability of the GI microbiota to prevent invasion or colonization by C. albicans is 65
well documented, but the ability of C. albicans to alter the microbiota is not well understood or 66
studied. 67
68
In our previously published studies, we have documented that Candida albicans CHN1 69
will colonize the cecum and stomach of cefoperazone-treated mice (13, 20-22). Cefoperazone 70
is a broad-spectrum antibiotic that has been shown to have dramatic, long-term effects on the 71
indigenous microbiota of mice (1). Broad-spectrum antibiotic treatment, like cefoperazone, 72
predisposes mice to Candida GI overgrowth and candidiasis (7, 9) and studies have 73
demonstrated that cefoperazone can cause long-term alterations of the cecal microbiota (1). 74
Most importantly, Candida colonization of the stomach modulated the post-antibiotic recovery 75
of the lactic acid bacteria (LAB), antagonizing Lactobacillus and facilitating E. faecalis 76
colonization (13). The objective of these studies was to determine if similar yeast-bacterial 77
interactions were occurring in the intestinal tract. 78
79
on October 12, 2019 by guest
http://iai.asm.org/
Dow
nloaded from
4
MATERIALS AND METHODS 80
Animals and housing. Female C57BL/6 mice were purchased from Jackson 81
Laboratories (Bar Harbor, ME) and were housed under specific-pathogen-free conditions in 82
enclosed filter-top cages. Food and sterile water were given ad libitum. Food remained 83
constant throughout the experiment to minimize the effect of diet on the microbiota. To reduce 84
coprophagy, mice were maintained on grates; this procedure and protocols were approved by 85
the Unit for Laboratory Animal Medicine (ULAM) at the University of Michigan (Ann Arbor, MI) 86
and protocols were approved by an animal institutional review board. Germ-free C57BL/6 87
mice were raised and housed in the ULAM germ-free barrier facility at the University of 88
Michigan. C. albicans infected germ-free mice were maintained in the barrier facility. 89
90
Antibiotic treatment. Cefoperazone (0.5mg/ml) (Sigma-Aldrich, St. Louis, MO) was 91
administered orally to mice ad libitum in drinking water. Antibiotic treatment was continued for 92
7 days (days -7 to day 0) prior to C. albicans colonization. After 7 days, antibiotic containing 93
drinking water was replaced with sterile water. 94
95
C. albicans GI inoculation. C. albicans strain CHN1 (a human clinical isolate) was 96
grown in Sabouraud dextrose broth (Difco, Detroit, MI) to stationary phase in a shaking flask at 97
37º C. For gavage, the cultures were washed in sterile nonpyrogenic saline, counted using a 98
hemacytometer, and diluted to 2 x 10⁸ CFU/ml in sterile nonpyrogenic saline. Mice were 99
inoculated with C. albicans (107 CFU in 50ul) by oral administration using a 24-gauge feeding 100
needle attached to a 1-ml syringe. The syringe containing C. albicans was mounted on a 101
Stepper repetitive pipette (Tridak, Brookfield, CT) to deliver an equivalent amount of inoculum 102
on October 12, 2019 by guest
http://iai.asm.org/
Dow
nloaded from

5
to each mouse. The inocula were serially diluted and grown on Sabouraud dextrose agar 103
(SDA) to verify the number of colony forming units (CFU) delivered. 104
105
Necropsy and microbiological culture. Mice were euthanized by CO2 asphyxiation. 106
Mouse intestinal tract was removed and washed in phosphate-buffered saline (PBS) to remove 107
contents. Sections of intestinal wall for bacterial 16S analysis were flash frozen in liquid 108
nitrogen and stored at -80º C. Histological sections of the cecum were obtained by cutting 109
along the greater curvature, removing the cecal contents, and washing in sterile 1x PBS. Two 110
separate sections were cut from the organ and were fixed with 10% buffered formalin and 111
embedded in paraffin. Tissue sections were stained with hematoxylin and eosin (H&E) for 112
detection of inflammatory infiltrates. The remaining organs were homogenized in sterile water, 113
serially diluted, and cultured aerobically on differential agars SDA (promotes the growth of 114
fungi) and de Man, Rogosa, and Sharpe (MRS)(promotes growth of lactic acid bacteria) agar 115
supplemented with 0.02% sodium azide (Difco), to determine culturable bacterial/fungal 116
counts. Colonies that grew on MRS + azide were identified further by PCR with previously 117
published bacterial universal primers (23). Yeast numbers were quantified in mucosal samples 118
by culturing on SDA supplemented with cefoperazone (0.1mg/ml). Identity of the yeast was 119
confirmed with wet mounts and replica plating on HardyChrom Candida indicator plates (Hardy 120
Diagnostics, Santa Maria, CA). 121
122
Antibiotic susceptibility assays. Bacterial species isolated from the murine ceca were 123
subcultured in vitro on MRS + azide agar. Bacterial susceptibility to cefoperazone was 124
determined using cefoperazone-treated sterile paper discs (BD Biosciences, San Jose, 125
on October 12, 2019 by guest
http://iai.asm.org/
Dow
nloaded from
6
California). All samples were tested in duplicate and the zone of antibiotic-induced clearance 126
was analyzed for each sample. 127
128
DNA extraction. Genomic DNA was extracted from cecal tip sections stored at -80º C 129
using a modified commercial kit (DNeasy tissue kit; QIAGEN, Germantown, MD). Samples 130
were subjected to bead beating for 1 minute in DNA isolation bead tubes (MoBio Laboratories, 131
Carlsbad, CA) prior to kit use. DNeasy tissue protocol was modified to use 40ul proteinase K 132
instead of the recommended 20ul, and samples were eluted with 100ul of Buffer AE instead of 133
the suggested 200ul. 134
135
Terminal Restriction Fragment Length Polymorphism. T-RFLP was performed as 136
described previously (11, 13). Briefly, full length bacterial 16S rRNA genes were amplified 137
from each sample by PCR amplification. The primers used in the amplification were a 138
fluorescently labeled FAM-8F forward primer and an unlabeled 1525R reverse primer. Each 139
25ul PCR mixture contained 20pmol of each primer, 200uM of each deoxynucleoside 140
triphosphate, and 1.5 U of Taq DNA polymerase in a final concentration of 10mM Tris-HCL-141
50mM KCL-1.5 mM MgCl2 (Ready to Go PCR beads; Amersham Pharmacia Biotech, 142
Piscataway, NJ). PCR was performed under the following cycle conditions; an initial 143
denaturation step at 94º C for 2 min and 30 cycles of denaturation at 94º C for 30s, annealing 144
at 58ºC for 45s, and extension at 72º C for 90s. A final extension step at 72º C for 5 min was 145
performed. The PCR product was purified using the QIAquick PCR Purification Kit (QIAGEN). 146
Two hundred nanograms of purified PCR amplicon was cut individually with the restriction 147
enzyme MspI (New England Biolabs, Beverly, MA) for 2 hours at 37ºC. The DNA fragments 148
on October 12, 2019 by guest
http://iai.asm.org/
Dow
nloaded from

7
were separated on an ABI 3730XL (Applied Biosystems Instruments, Foster City, CA) at the 149
University of Michigan Sequencing Facility. The 5’-terminal restriction fragments (TRFs) were 150
detected by excitation of the 6-FAM molecule attached to the forward primer. 151
152
T-RFLP Analysis. Raw T-RFLP chromatograms were analyzed using Peakscanner 153
(Applied Biosystems) to call the fragment sizes and to build a list of peaks (a peak file). This 154
process was carried out for every sample, after which all of the peak files are exported as one 155
bulk peak file. Further analysis was carried out using K9, an in-house designed program for T-156
RFLP data analysis (freely available at http://www-157
personal.umich.edu/~jre/Microbiome_Core/K9.html). K9 separated the bulk peak file into all of 158
the individual peak files, and the meta-tags were removed. Next, corrected peak files were 159
generated by binning peak fragments to the corresponding whole number of fragment lengths. 160
This binning allowed uniform comparison of samples from different analyses and also allowed 161
for simple background subtraction to be performed where appropriate. 162
163
Rank abundance graphs. Individual TRFs were used to create rank abundance curves 164
for each experimental group. Briefly, for each experimental treatment and time point, TRFs 165
were presented with base pair length plotted on the x axis. The peak height was normalized by 166
determining the percentage of total TRFs for each individual sample. Within each treatment 167
group, individual mouse TRFs were combined, and the standard error of the mean is 168
represented by the error bars. Experiments were performed at least twice with three to five 169
mice per group per experiment. 170
on October 12, 2019 by guest
http://iai.asm.org/
Dow
nloaded from
8
T-RFLP distance matrix construction. Analysis of treatment groups was performed by 171
first determining the core group of peaks common in a given treatment group, but separate 172
from the noise of the system. To accomplish this, peaks were selected that occur in N-1 of N 173
samples. This is followed by temporally removing the top 3 peaks (to avoid skewing of the 174
data), taking the sum of the total peak height, and determining which of the remaining peaks 175
contribute to >1% of the total peak height. These peaks plus the 3 top peaks formed the peak 176
set for the group. Groups were then compared to one another through the generation of a 177
distance matrix (based on the Bray-Curtis distance) and a complete furthest-neighbor 178
hierarchical clustering of individual samples or groups of samples based on the sample mean. 179
180
Clone Library Protocol and Analysis. Clone libraries were constructed as described 181
previously (15, 16). Whole DNA isolated from the murine cecum was amplified with illustra 182
PuRe Taq ReadyTo Go PCR beads (GE Healthcare, Piscataway, NJ). Briefly, amplification by 183
polymerase chain reaction was performed using broad-ranged primers, 184
(8F,AGAGTTTGATCCTGGCTCAG; 1492R, GGTTACCTTGTTACGACTT). Amplicons were 185
purified with a commercial kit (GFX, GE Healthcare, Piscataway, NJ) as directed by the 186
manufacturer. Products were ligated into the TOPO 4 vector (Invitrogen K4575-01) according 187
to the manufacturer’s specifications, transformed into the provided TOP-10 cells, and plated on 188
LB agar supplemented with carbenicillin (50ug/ml). The resulting colonies were then grown in 189
96 well deep well plates in LB supplemented with carbenicillin and grown overnight at 37�C. 190
To screen for our desired insert, vector primers were used to screen the bacterial clones 191
(M13F, CAGTCACGACGTTGTAAAACGACGGC; and M13R, 192
CAGGAAACAGCTATGACCATG). Clones that tested positive for the insert were sent for a 193
single sequencing run using the 8F primer at the Sequencing Facility at the University of 194
on October 12, 2019 by guest
http://iai.asm.org/
Dow
nloaded from
9
Michigan. Raw sequence data were processed through an automated “information pipeline” 195
available through the Ribosomal Database Project (RDP) Website (http://rdp.cme.msu.edu/). 196
Following alignment of the sequences via myRDP, distance matrices representing each of the 197
libraries were downloaded and taxonomic assignments designated (95% confidence cutoff) 198
using the RDP provided Classifier. These distance matrices were grouped into operational 199
taxonomic units (OTUs) and rarefaction curves were made using Mothur (30).. 200
201
T-RFLP-based Community Analysis. T-RFLP data was converted into a standard 202
community matrix where for each sample the position of the peak was assigned as an OTU 203
and the high of the peak the abundance of the OTU. A canonical correspondance analysis 204
(CCA) of this data was carried out using R (http://www.r-project.org) and the cca function in the 205
R-package vegan (9). To test whether significant differences were seen between treatment 206
groups first the model was tested for significance using the function anova.cca which performs 207
an anova-like permutation test for the joint effect of the constraints. After determining the 208
number of significant axes, the coordinates along an axis were tested using the aov function 209
followed by TukeyHSD post-test. 210
211
Additional Statistics. All values reported in rank abundance curves are standard errors 212
of the mean, where mean values are pooled from independent experiments and are noted for 213
each experiment. Bacterial and fungal colonization levels were compared by two-way analysis 214
of variance with a Bonferroni correction (GraphPad Prism 5; *p<0.05;**p<0.01) 215
216
on October 12, 2019 by guest
http://iai.asm.org/
Dow
nloaded from
10
RESULTS 217
C. albicans colonizes the murine gastrointestinal tract during disruptions of the 218
bacterial microbiota. Our first objective was to examine the contribution of the indigenous 219
bacterial microbiota in intestinal colonization resistance against C. albicans CHN1 in mice. 220
Germfree female C57BL/6 mice were given a single oral gavage of C. albicans CHN1 and their 221
level of fungal colonization was determined at day 7 and day 21 post-gavage through selective 222
culturing on SDA. Unchallenged germfree mice did not have detectable fungal colonization at 223
any time point (Figure 1A). Every germfree mouse given a single oral gavage of C. albicans 224
maintained a steady, low-level of colonization in the proximal small intestine (pSI), distal small 225
intestine (dSI), cecum, and colon at both day 7 and day 21 (Figure 1A). In contrast, C. albicans 226
CHN1 was not able to effectively colonize the GI tract of conventional C57BL/6 mice after a 227
single oral gavage. These mice had extremely low level of colonization in the pSI (36% of mice 228
colonized day 7, 9.1% day 21), dSI (45% day 7, 18% day 21), and cecum (36% day 7, 9.1% 229
day 21) and no detectable C. albicans CFU in the colon (0% day 7, 0% day 21) (figure 1B-E). 230
However, conventional female C57BL/6 mice treated with cefoperazone in their water for one 231
week (days -7 to 0), followed by a single oral gavage of C. albicans CHN1 at day 0, showed a 232
consistent steady low level of colonization at day 7 and day 21 throughout the intestinal tract 233
(pSI 100% day 7, 86% day 21; dSI 100% day 7, 94% day 21; cecum 100% day 7, 88% day 21; 234
colon 91% day 7, 91% day 21)(Figure 1B-E). In general, the level of colonization was at a 235
similar level to those in germfree mice at the same time points (Figure 1A). Untreated mice and 236
mice treated only with cefoperazone never had any detectable C. albicans growth at any time 237
point. Thus, an intact indigenous microbiota is required for effective colonization resistance 238
against C. albicans in the intestinal tract. 239
240
on October 12, 2019 by guest
http://iai.asm.org/
Dow
nloaded from
11
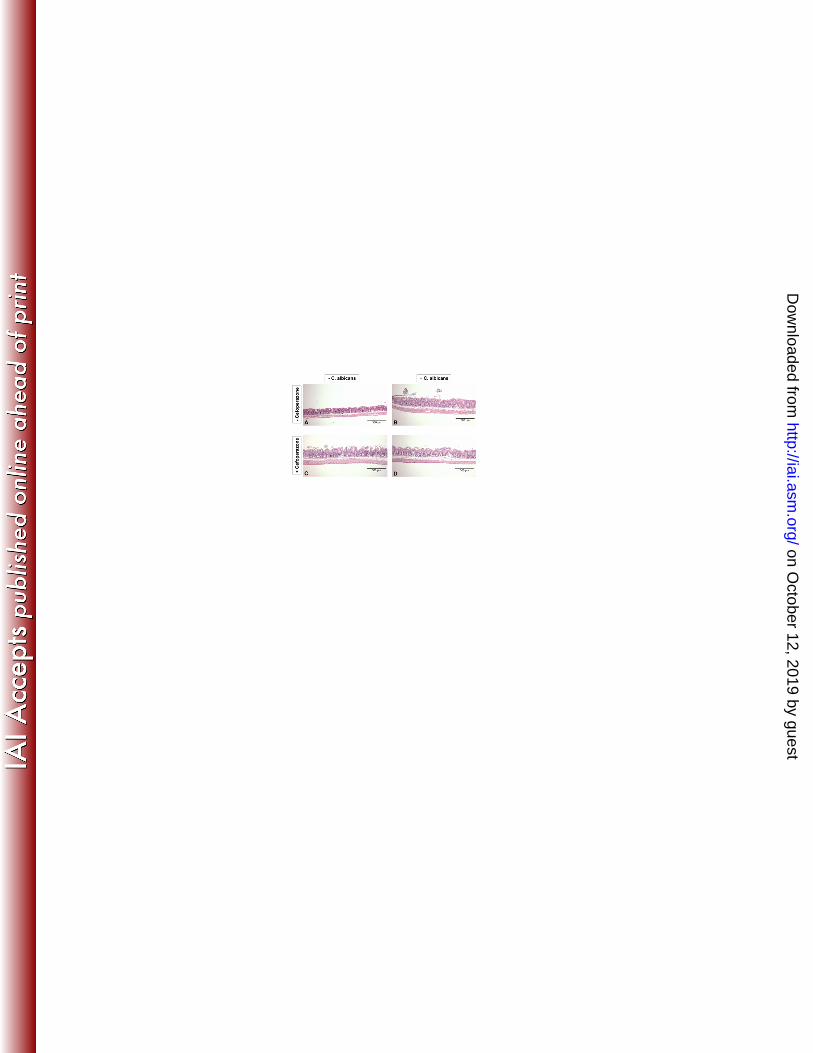
C. albicans colonization does not cause overt inflammation in the murine cecum. 241
To look for any evidence of inflammatory infiltrates or changes in the cecal epithelium, we 242
examined H&E stained histological samples of ceca from these mice. C. albicans colonization 243
of the cecum, in the presence or absence of cefoperazone treatment, did not result in overt 244
inflammation at day 7 (data not shown) or day 21 (Figure 2A-D). Consistent with our previous 245
studies (13), the limiting ridge of the stomach showed erosions at day 7 and day 21 (data not 246
shown) while the pSI, dSI, and colon did not show signs of over inflammation at any time point 247
(data not shown). 248
249
Low-level colonization by C. albicans causes alterations of the cecal bacterial 250
microbiota during recovery from antibiotic disruption. To determine if the presence of C. 251
albicans was altering the post-antibiotic reassembly of the cecal microbiome, we utilized 252
terminal-restriction fragment length polymorphism (T-RFLP) analysis to monitor changes in the 253
microbial community structure over time. Initially, an ordination of the data was carried out on 254
T-RFLP data using canonical correspondence analysis (CCA) where the data was constrained 255
by the treatment that the mice received. Since each sample has many data points generated 256
from individual category measurements within that sample (e.g. levels of individual TRFs), 257
samples can be further analyzed by ordination methods, such as correspondence analysis 258
(CA), to reveal patterns in the dataset that could not be found by analyzing each variable 259
separately. Correspondence analysis reduces the dimensionality (or categories) of the data by 260
combining multiple data categories to create fewer total categories, with each of these new 261
categories being a “best-fit” relationship function between specific categories of data. From 262
this, patterns in the data can be identified that cannot be found by analyzing each variable 263
separately. This is accomplished by plotting the sample data on two or more axes in which 264
on October 12, 2019 by guest
http://iai.asm.org/
Dow
nloaded from
12
each axis is one of the new derived categories and increasing distance between samples 265
corresponds to increasing dissimilarity (or differences) between samples. The first axis is the 266
function that can predict the greatest amount of the data relationship, while the second axis is 267
the function that can predict the second highest, etc. Statistical tests can be applied to the data 268
in the samples. At day 7 (Figure 3A), untreated or C. albicans alone mice had communities 269
that were not statistically significantly different (p > 0.05). Mice treated with cefoperazone or 270
cefoperazone and C. albicans had communities that had significantly shifted as seen by the 271
large shift along the first canonical axis (p < 0.05). The bacterial communities in cefoperazone 272
treated mice were significantly different from mice treated with cefoperazone and then 273
gavaged with C. albicans suggesting that the presence of C. albicans during antibiotic 274
disruption alters the community. 275
Rarefaction curves at day 7 (Figure 3B) suggest that the diversity is reduced by 276
antibiotic treatment in the presence or absence of C. albicans with a trend toward differences 277
in total diversity between groups. At day 21 (Figure 3C), bacterial community differences were 278
observed between all four groups (p < 0.05). The greatest differences were seen between 279
animals treated with cefoperazone and those that were not. These data suggest that during 280
antibiotic disruption, the presence of C. albicans can alter bacterial community structure. 281
Rarefaction curves at day 21 (Figure 3D) suggest that the presence of C. albicans changes the 282
diversity of the cecal bacterial populations. 283
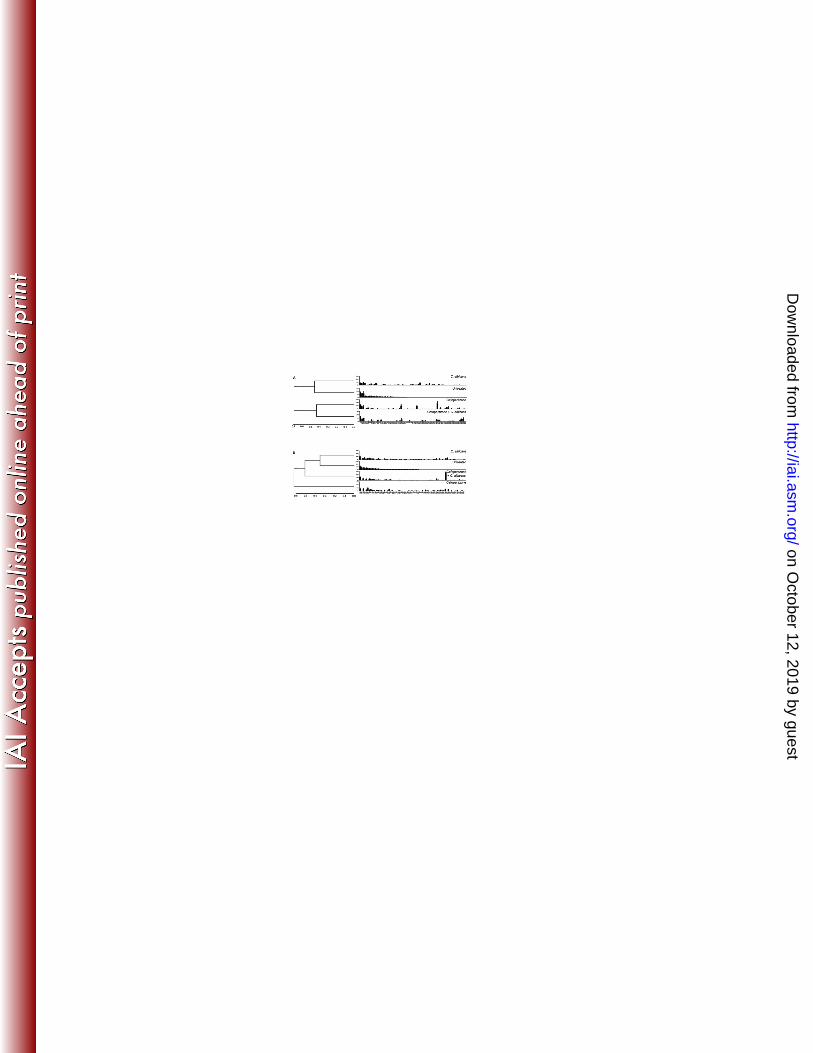
A furthest-neighbor hierarchical cluster analysis was performed to create an average 284
dendrogram. At day 7 post-treatment, all experimental groups have bacterial populations that 285
are different from untreated mice. Based upon Bray-Curtis distances, cefoperazone was the 286
main driving force for changes in the cecal microbiome at day 7 (Figure 4A). At day 21 post-287
antibiotic, the presence of C. albicans altered the bacterial community more than the effects of 288
on October 12, 2019 by guest
http://iai.asm.org/
Dow
nloaded from
13
C. albicans alone (Figure 4B). We generated rank abundance graphs of the T-RFLP analysis 289
to examine changes in the cecal bacterial microbiome during recovery from antibiotic treatment 290
(Figure 4A-B). The disappearance of some TRFs, and the appearance of new TRFs after 291
antibiotic cessation, indicate that the cecal bacterial community structure is altered over time 292
by cefoperazone treatment. 293
294
To confirm and extend the results of the T-RFLP analysis, 16S gene clone libraries 295
were constructed and analyzed with DOTUR to determine operational taxonomic units (OTUs) 296
in the samples. To examine bacterial diversity in the ceca of the various groups, rarefaction 297
curves were created with phylotypes based on an OTU definition of 97% sequence similarity. 298
At day 7, bacterial diversity was lower in the microbial community from both cefoperazone-299
treated mice and cefoperazone-treated/ C. albicans- colonized mice (Figures 5A & E). This 300
analysis was repeated using an OTU definition of 90% sequence similarity. Again, both 301
cefoperazone only, and cefoperazone + C. albicans groups, maintained a reduced phylotype 302
richness (Figure 5C). Untreated mice and C. albicans-gavage only mice had similar phylotype 303
richness at both OTU definitions (Figures 5A, C & E). At day 21, using OTU sequence 304
similarity definitions of both 97% and 90%, only the cefoperazone-treated mice had a reduced 305
phylotype richness compared to all other experimental groups (Figures 5B, D, F). Based upon 306
Bray-Curtis distances, cefoperazone was the significant force for changes in the cecal 307
microbiome at day 7 and day 21 (Figure 5E-F). While cefoperazone + C. albicans mice had 308
altered bacterial communities at day 7, based on Bray-Curtis distance, these populations are 309
beginning to recover by day 21 (Figure 5E-F). Thus, the presence of C. albicans in 310
cefoperazone-treated mice was associated with a recovery of bacterial community diversity in 311
the period between days 7 and 21. 312
on October 12, 2019 by guest
http://iai.asm.org/
Dow
nloaded from

14
313
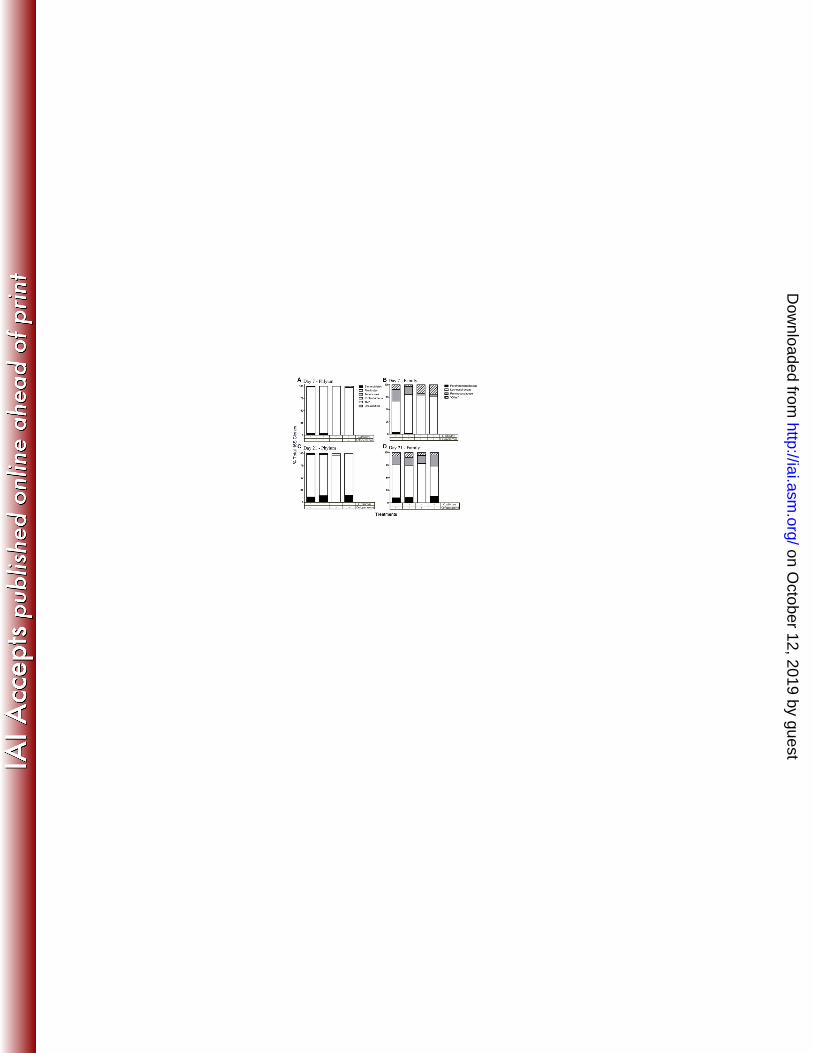
We further analyzed the 16S gene clone libraries using the RDP classifier to generate 314
taxonomic identification of the clones. At the phylum classification level, untreated mice and 315
untreated mice gavaged with C. albicans, had similar levels of Bacteroidetes (Figure 6A). Both 316
cefoperazone and cefoperazone + C. albicans mice were markedly depleted in Bacteroidetes 317
at day 7, but this phylum had recovered to match the levels observed in untreated mice by day 318
21 in cefoperazone-treated mice if C. albicans was present (Figure 6C). At the family level, this 319
difference in Bacteroidetes was reflected in relative changes in the Porphyromonadaceae. A 320
single member of the Firmicutes, the Ruminococcaceae, was also depressed at day 7 in both 321
groups of mice treated with cefoperazone (Figure 6B & 6D). Overall, the shifts in diversity 322
noted in the rarefaction curves (Figure 5) are largely reflected by changes in Bacteroidetes 323
membership (Figure 6). 324
325
The effect of cefoperazone and C. albicans on lactic acid bacteria (LAB) levels. 326
We have previously found that both cefoperazone treatment and C. albicans can alter the LAB 327
levels in the stomach of mice (13). Therefore, we utilized selective plating to determine the 328
effects of cefoperazone and C. albicans on the LAB in the murine cecum, and all resulting 329
colonies were further identified through PCR amplification of the 16S rRNA gene. At day 7, 330
untreated mice and C. albicans only mice had LAB populations that were predominantly 331
Lactobacillus spp. (Figure 7A). In contrast, cefoperazone only or cefoperazone + C. albicans 332
mice had LAB populations dominated by Enterococcus faecalis (Figure 7A). Cefoperazone, in 333
the presence or absence of C. albicans, promoted the outgrowth of E. faecalis populations in 334
the murine cecum short-term. At day 21, untreated and C. albicans only mice continued to 335
on October 12, 2019 by guest
http://iai.asm.org/
Dow
nloaded from
15
have LAB populations that were predominantly Lactobacillus (Figure 7B). There was a 336
decrease in Enterococcus populations and an increase in Lactobacilli in cefoperazone-only 337
treated mice, potentially suggesting that the Lactobacillus populations were beginning to 338
recover in these mice. However, mice treated with cefoperazone + C. albicans did not recover 339
their Lactobacillus populations at day 21. The LAB populations in these mice continued to be 340
predominantly Enterococcus, indicating that the presence of C. albicans during cefoperazone 341
recovery alters the LAB populations through at least 21 days after antibiotic treatment. 342
343
We also sought to determine if the E. faecalis and L. johnsonii isolated from the post-344
cefoperazone-treated murine cecum were susceptible to cefoperazone. An in vitro 345
cefoperazone susceptibility assay indicated that both E. faecalis and L. johnsonii were 346
susceptible to concentrations of cefoperazone that were far less than the concentration 347
administered in the mouse drinking water (Figure 7C). Thus, despite being susceptible to 348
cefoperazone in vitro, these two species of LAB grew out from the murine cecum within a week 349
post-cefoperazone treatment. 350
351
DISCUSSION 352
This study investigated the ability of C. albicans to influence the indigenous microbiota 353
of the murine cecum during reassembly following broad-spectrum antibiotic treatment. We 354
utilized culture-independent and culture-dependent approaches to demonstrate that 355
colonization by non-pathogenic C. albicans can significantly alter the bacterial microbiome 356
during recovery from cefoperazone treatment. The presence of C. albicans in the antibiotic-357
disrupted bacterial community of the murine cecum was associated with suppressed re-growth 358
on October 12, 2019 by guest
http://iai.asm.org/
Dow
nloaded from
16
of Lactobacillus populations, implicating C. albicans in antagonizing Lactobacillus in vivo. The 359
presence of C. albicans also promoted the recovery of Bacteroidetes populations during 360
antibiotic recovery. While previous studies have focused on the ability of bacteria to alter C. 361
albicans, this study addressed the ability of C. albicans to alter the host microbiota during non-362
pathogenic colonization. 363
364
Within a few days or weeks after birth, non-pathogenic C. albicans colonizes the GI 365
tracts of humans (27). C. albicans often persists in the GI tract for long period of time without 366
causing any overt disease, and mouse models have relied upon major disruptions of the host 367
immune system of GI microbiota to promote the development of disease by C. albicans (8, 28, 368
29). Our germfree and conventional data confirm previous studies demonstrating that the 369
bacterial microbiota plays an important role in preventing Candida dissemination and disease 370
(10, 13, 20-22, 36). C. albicans adapts to the GI environment through expression of genes, 371
such as the transcription factors encoded by EFH1 and CPH2, to maintain colonization in the 372
GI tract during bacterial microbiota disruption (25, 36). Other factors involved with adherence, 373
such as ECE1, can promote GI colonization (19). To minimize alterations in the bacterial 374
microbiota in our studies, all mice were female C57Bl/6 mice, 7-9 weeks old from Jackson 375
laboratories. The standardization of our mouse genetics, age, and vendor source helps to 376
minimize changes in the GI microbiota from these factors. This study is one of the first to 377
investigate the ability of C. albicans to alter the microbiota, during a non-pathogenic state, 378
resulting in increased fungal GI colonization. Future studies must be conducted to determine 379
the mechanisms behind the C. albicans-induced alterations in bacterial populations. 380
381
on October 12, 2019 by guest
http://iai.asm.org/
Dow
nloaded from
17
We propose that the subsequent changes in bacterial biota may be in response to the 382
change in C. albicans gene expression during cecal colonization following antibiotic-induced 383
disruption of the microbiota. Candida colonization varies by both mucosal site and Candida 384
species and strain (24, 31). It is important to note that the differences between C. albicans 385
strains are not well understood, and even Candida species show altered organ specificity 386
during GI colonization as demonstrated by C. pintolopesii preferentially colonizing the murine 387
stomach (2). Gene expression studies of C. albicans during colonization, or systemic infection 388
demonstrate that cecal colonization results in altered C. albicans gene expression compared to 389
during a disease state. Secreted aspartic proteases, well known C. albicans virulence factors, 390
are not strongly up-regulated during normal colonization of the murine cecum (25). Other 391
genes typically found during invasive growth in the host (i.e. DEF1 and DFG16) were also not 392
up-regulated during cecal colonization. CPH2, a transcription factor, is required for the 393
establishment of normal levels of C. albicans in the murine ceca, in an EFG1 independent 394
mechanism (25, 36). This suggests that C. albicans responds and adapts to its presence in 395
different environments within the host. Broad-spectrum antibiotics work through reducing 396
bacterial populations to create niches for fungal colonization where C. albicans normally does 397
not colonize. Additional studies are required to reveal further features of C. albicans adaption 398
to the host environment during antibiotic re-colonization. 399
400
One interesting finding of this study was the ability of C. albicans to promote 401
Enterococcus populations and antagonize Lactobacillus population recovery following 402
cefoperazone treatment. The ability of Lactobacillus to antagonize C. albicans growth, 403
adhesion, and hyphal transformation is well documented. Lactobacillus can displace Candida 404
from the epithelium (29), prevent germ tube formation (21, 22), and inhibit hyphal invasion (29, 405
on October 12, 2019 by guest
http://iai.asm.org/
Dow
nloaded from
18
35). Here we demonstrate that this antagonism can be a bidirectional process. Further, the 406
presence of C. albicans during antibiotic recovery promoted the persistence of E. faecalis. E. 407
faecalis is a species of major concern in hospital settings due to its ability to acquire antibiotic 408
resistance genes and survive in a broad range of pH environments (18). Enterococcus is 409
typically found in relatively low abundance in the GI tract, but is well-adapted to survival along 410
the mucosa through its ability to adhere to multiple epithelial and extra-cellular matrix proteins 411
(5). Recent work has demonstrated that oral antibiotics in mice down-regulate, RegIIIγ, a C-412
type lectin that inhibits the growth of Enterococcus spp. (3). Regardless of antibiotic treatment, 413
RegIIIγ has no cidal activity against fungi (4). A potential mechanism of in our model may be 414
the down-regulation of RegIIIγ by antibiotics and/or by C. albicans, resulting in Enterococcus 415
overgrowth. Little is known about LAB niche competition within the GI tract or the C. albicans-416
Enterococcus agonism. However, due to the medical relevance of both species, further studies 417
investigating the potential symbiosis may provide new insights for treatments. 418
419
The interactions between C.albicans and the Bacteroidetes are not well investigated. 420
Previous studies have demonstrated the ability of C. albicans to interact or compete with 421
bacteria, but most of these studies demonstrate interactions with members of the Firmicutes 422
(14). Our work demonstrates that C. albicans can promote the recovery of Bacteroidetes 423
populations during antibiotic recovery. The mechanism behind this is not understood, but 424
potential interactions could include C. albicans providing a binding or attachment mechanism 425
for Bacteroidetes to promote their re-colonization in the cecum, yeast glucans could be serving 426
as a potential food source for Bacteroidetes, or C. albicans may be suppressing bacteria 427
usually competing with Bacteroidetes. Bacteroidetes is a prominent phylum in the human GI 428
tract and alterations in Bacteroidetes populations have been associated with changes in host 429
on October 12, 2019 by guest
http://iai.asm.org/
Dow
nloaded from

19
health (12). Further studies are needed to dissect the potential interaction between 430
Bacteriodetes and C. albicans during antibiotic recovery. 431
432
This study demonstrated the ability of C. albicans to alter the microbiota of the murine 433
gut during antibiotic re-colonization. During non-pathogenic colonization, C. albicans promoted 434
the recovery of Bacteroidetes populations, antagonized L. johnsonii populations, and promoted 435
the persistence of E. faecalis populations in the cecum. These data demonstrate that while the 436
microbiota can prevent C. albicans overgrowth, C. albicans can also alter the microbiota. 437
Unpublished data from our laboratory demonstrates that changes in LAB in the cecum are long 438
term (up to 58 days post-treatment), demonstrating that the changes in the bacterial microbiota 439
are not transient. In the absence of Candida-induced inflammation or invasion, there is a bi-440
directional interaction between normal members of the fungal and bacterial microbiota of the 441
human gut. A more complete understanding of the interactions occurring during antibiotic 442
recovery could aid in our understanding of the relationship between the microbiota, C. 443
albicans, and the host, leading to novel treatments of disease in the future. 444
445
ACKNOWLEDGEMENTS 446
We would like to thank Rod McDonald for his technical support. This work was 447
supported in part by grants R21-AI087869 (GBH), NIH NIDDK grant P30DK034933 (GBH), 448
NIH grant UL1 RR024986 (the Michigan Institute for Clinical and Health Research), Frederick 449
G. Novy Fellowship (KLM), NIDDK R01DK070875 (VBY) and KO8 DK0669907-01 (JYK). 450
451
on October 12, 2019 by guest
http://iai.asm.org/
Dow
nloaded from
20
FIGURE LEGENDS 452
Figure 1: C. albicans colonization of germfree and conventional mice 453
Germfree mice were given a single oral gavage of C. albicans CHN1 and the GI organs were 454
removed at days 7 and 21 post-gavage. The proximal small intestine (pSI), distal small 455
intestine (dSI), cecum and colon were removed at day 7 or day 21, and were differentially 456
cultured to determine C. albicans colonization. All germfree colonized mice had detectable C. 457
albicans at all times points (A). The GI organs of conventional mice were removed at day 7 458
and day 21 post-gavage (C. albicans CHN1) +/- pretreatment with cefoperazone. The organs 459
were differentially cultured to determine C. albicans CHN1 colonization (B-E). Untreated mice 460
and cefoperazone-only mice had no detectable C. albicans CHN1 colonization. Error bars 461
represent the standard errors of the mean. (*, p<0.05 versus untreated) 462
Figure 2. C. albicans colonization of the murine cecum does not result in histological 463
inflammation 464
Histological H&E sections of the murine cecum were examined to look for evidence of 465
inflammation during cefoperazone-induced microbiota disruption. All treatment groups 466
(untreated, cefoperazone-only, C. albicans-only, and Cefoperazone + C. albicans) had no 467
histological evidence of inflammation during microbiota disruption at day 7 (data not shown) 468
and day 21 (Figure 2A-D). 469
Figure 3. Cefoperazone and C. albicans alter bacterial diversity in the murine cecum. 470
Rarefaction analysis was performed on the TRFs found in the T-RFLP analysis at days 7 (B) 471
and 21 (D). Solid lines indicate the mean rarefied value whereas dotted lines indicate the 472
Standard Error (n=8 per group). Canonical correspondence analysis of the days 7 (A) and day 473
on October 12, 2019 by guest
http://iai.asm.org/
Dow
nloaded from
21
21 (C) communities where the data was constrained by treatment type. Both models were 474
significant (p < 0.05 (anova.cca)) and both CCA1 and CCA2 were found to be significant axes 475
(p < 0.05) at both time points. Untreated samples are depicted in blue, C. albicans alone in 476
green, antibiotics alone in orange and dual treated in red. 477
Figure 4. Cefoperazone alters short-term bacterial diversity but C. albicans alters 478
bacterial diversity in the murine cecum long-term 479
The cecum was removed and analyzed using T-RFLP. Rank abundance plots were 480
constructed from TRFs in each of the experimental groups at day 7 (A) and day 21 (B). Error 481
bars represent the standard errors of the mean where the mean is pooled TRFs from individual 482
mice within each experimental group. Bray Curtis distance was determined to compare each 483
experimental group at day 7 (A) and day 21 (B). 484
Figure 5. Rarefaction analysis of microbial communities in the murine cecum. 485
The number of OTUs for each experimental treatment group was used to construct rarefaction 486
curves from clone library data with an OTU definition of 97% (A-B) or 90% (C-D) sequence 487
similarity. Comparison of the cecal community in untreated animals (black circles) and in 488
animals treated with cefoperazone alone (black diamond), C. albicans alone (black square) 489
and cefoperazone + C. albicans (black triangle) at day 7 (E) and day 21 (F). Using an OTU 490
definition of 97% similarity in the Bray-Curtis similarity metric, results are displayed in 491
dendrogram format. 492
Figure 6. Bacterial composition of the murine cecum during C. albicans colonization. 493
Clone libraries were constructed to investigate the relative abundance of members of the 494
bacteria in the murine cecum at day 7 (A, B) and day 21 (C, D). Bacterial populations are 495
on October 12, 2019 by guest
http://iai.asm.org/
Dow
nloaded from

22
shown as % of the total 16S clones for each treatment group. Cefoperazone treatment in the 496
presence or absence of C. albicans diminishes Bacteroidetes populations in the cecum at day 497
7. At day 21, the presence of C. albicans during recovery from cefoperazone results in a 498
recovery of Bacteroidetes populations, while cefoperazone-only mice do not. 499
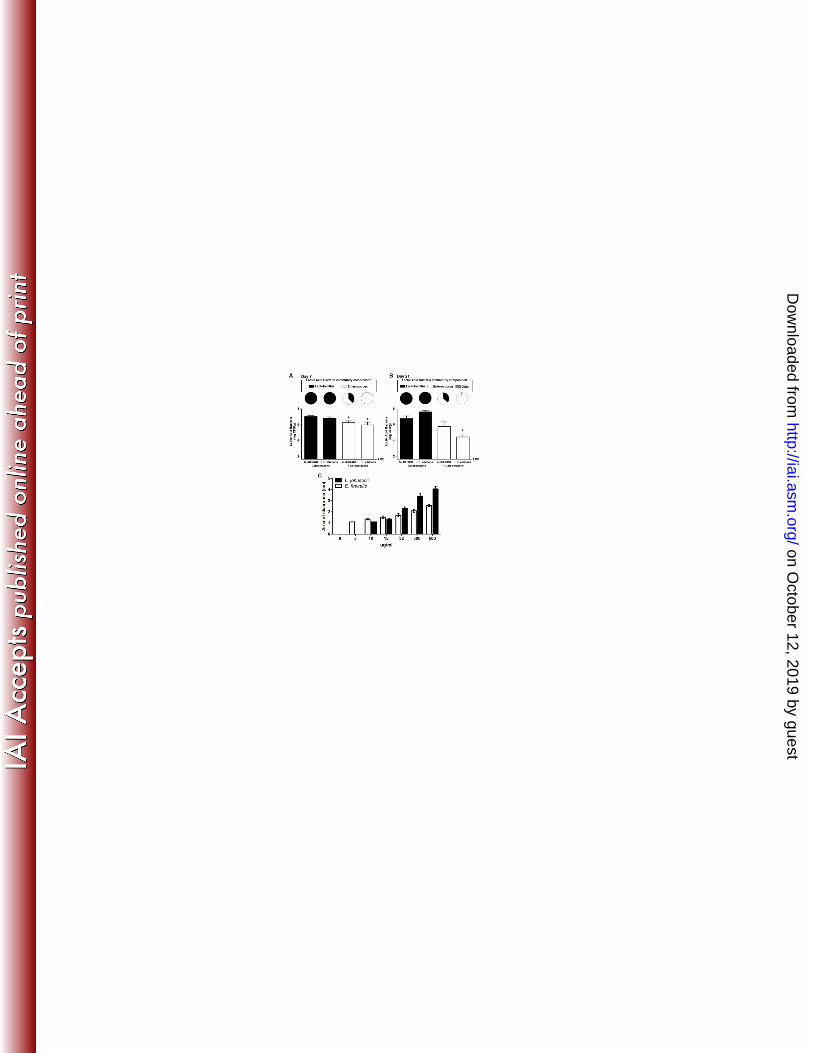
Figure 7. C. albicans CHN1 during antibiotic treatment promotes E. faecalis growth in 500
the murine cecum. 501
The cecum was removed at day 7 (A) and day 21 (B) postantibiotic and differentially cultured 502
to determine total lactic acid bacterial (LAB) colonization in untreated, cefoperazone treated, 503
C.albicans-only or cefoperazone + C. albicans mice (graphs). Lactic acid bacteria colonies that 504
grew on MRS plus azide agar were further identified, using colony PCR as described in the 505
methods, and expressed as a fraction of the total LAB population in that group (pie charts). 506
Error bars represent the standard errors of the mean (*, p<0.05 compared to untreated mice). 507
E. faecalis and L. johnsonii were isolated from the cecum of a cefoperazone-treated mouse 508
and their in vitro susceptibility to cefoperazone was determined (C). Error bars represent the 509
standard errors of the mean. No significance was found between any of the groups. (n=3-510
6/group) 511
512
513
514
515
516
517
on October 12, 2019 by guest
http://iai.asm.org/
Dow
nloaded from

23
WORKS CITED 518
1. Antonopoulos, D. A., S. M. Huse, H. G. Morrison, T. M. Schmidt, M. L. Sogin, and V. B. 519 Young. 2009. Reproducible community dynamics of the gastrointestinal microbiota following 520 antibiotic perturbation. Infect Immun 77:2367-2375. 521
2. Artwohl, J., A. McCLain, and L. Cera. 1988. Population changes of indigenous murine 522 Candida pintolopesii under various experimental conditions and routes of inoculation. Applied 523 and Environmental Microbiology 54:2371-2371. 524
3. Brandl, K., G. Plitas, C. N. Mihu, C. Ubeda, T. Jia, M. Fleisher, B. Schnabl, R. P. 525 DeMatteo, and E. G. Pamer. 2008. Vancomycin-resistant enterococci exploit antibiotic-526 induced innate immune deficits. Nature 455:804-807. 527
4. Cash, H. L., C. V. Whitham, C. L. Behrendt, and L. V. Hooper. 2006. Symbiotic bacteria 528 direct expression of an intestinal bactericidal lectin. Science 313:1126-1130. 529
5. Franz, C. M., W. H. Holzapfel, and M. E. Stiles. 1999. Enterococci at the crossroads of food 530 safety? Int J Food Microbiol 47:1-24. 531
6. Hummel, R. P., E. J. Oestreicher, M. P. Maley, and B. G. Macmillan. 1973. Inhibition of 532 Candida albicans by Escherichia coli in vitro and in the germfree mouse. J Surg Res 15:53-58. 533
7. Kennedy, M. J. 1981. Inhibition of Candida albicans by the anaerobic oral flora of mice in vitro. 534 Sabouraudia 19:205-208. 535
8. Kennedy, M. J., and P. A. Volz. 1985. Ecology of Candida albicans gut colonization: inhibition 536 of Candida adhesion, colonization, and dissemination from the gastrointestinal tract by bacterial 537 antagonism. Infect Immun 49:654-663. 538
9. Kennedy, M. J., and P. A. Volz. 1985. Effect of various antibiotics on gastrointestinal 539 colonization and dissemination by Candida albicans. Sabouraudia 23:265-273. 540
10. Koh, A. Y., J. R. Kohler, K. T. Coggshall, N. Van Rooijen, and G. B. Pier. 2008. Mucosal 541 damage and neutropenia are required for Candida albicans dissemination. PLoS Pathog 4:e35. 542
11. Kuehl, C. J., H. D. Wood, T. L. Marsh, T. M. Schmidt, and V. B. Young. 2005. Colonization 543 of the cecal mucosa by Helicobacter hepaticus impacts the diversity of the indigenous 544 microbiota. Infect Immun 73:6952-6961. 545
12. Ley, R. E., F. Backhed, P. Turnbaugh, C. A. Lozupone, R. D. Knight, and J. I. Gordon. 546 2005. Obesity alters gut microbial ecology. Proc Natl Acad Sci U S A 102:11070-11075. 547
13. Mason, K. L., J. R. Erb Downward, N. R. Falkowski, V. B. Young, J. Y. Kao, and G. B. 548 Huffnagle. 2012. Interplay between the gastric bacterial microbiota and Candida albicans during 549 postantibiotic recolonization and gastritis. Infect Immun 80:150-158. 550
14. Morales, D. K., and D. A. Hogan. 2010. Candida albicans interactions with bacteria in the 551 context of human health and disease. PLoS Pathog 6:e1000886. 552
15. Nagalingam, N. A., J. Y. Kao, and V. B. Young. 2011. Microbial ecology of the murine gut 553 associated with the development of dextran sodium sulfate-induced colitis. Inflamm Bowel Dis 554 17:917-926. 555
16. Nagalingam, N. A., and S. V. Lynch. 2011. Role of the microbiota in inflammatory bowel 556 diseases. Inflamm Bowel Dis. 557
17. Naglik, J. R., P. L. F. Jr, and F. C. Odds. 2008. Animals models of mucosal Candida infection. 558 FEMS Microbiol Lett 283:129-139. 559
18. Nakajo, K., R. Komori, S. Ishikawa, T. Ueno, Y. Suzuki, Y. Iwami, and N. Takahashi. 2006. 560 Resistance to acidic and alkaline environments in the endodontic pathogen Enterococcus 561 faecalis. Oral Microbiol Immunol 21:283-288. 562
19. Nobile, C. J., and A. P. Mitchell. 2005. Regulation of cell-surface genes and biofilm formation 563 by the C. albicans transcription factor Bcr1p. Curr Biol 15:1150-1155. 564
on October 12, 2019 by guest
http://iai.asm.org/
Dow
nloaded from
24
20. Noverr, M. C., N. R. Falkowski, R. A. McDonald, A. N. McKenzie, and G. B. Huffnagle. 565 2005. Development of allergic airway disease in mice following antibiotic therapy and fungal 566 microbiota increase: role of host genetics, antigen, and interleukin-13. Infect Immun 73:30-38. 567
21. Noverr, M. C., and G. B. Huffnagle. 2004. Regulation of Candida albicans morphogenesis by 568 fatty acid metabolites. Infect Immun 72:6206-6210. 569
22. Noverr, M. C., R. M. Noggle, G. B. Toews, and G. B. Huffnagle. 2004. Role of antibiotics and 570 fungal microbiota in driving pulmonary allergic responses. Infect Immun 72:4996-5003. 571
23. Paster, B. J., S. K. Boches, J. L. Galvin, R. E. Ericson, C. N. Lau, V. A. Levanos, A. 572 Sahasrabudhe, and F. E. Dewhirst. 2001. Bacterial diversity in human subgingival plaque. J 573 Bacteriol 183:3770-3783. 574
24. Rahman, D., M. Mistry, S. Thavaraj, S. J. Challacombe, and J. R. Naglik. 2007. Murine 575 model of concurrent oral and vaginal Candida albicans colonization to study epithelial host-576 pathogen interactions. Microbes Infect 9:615-622. 577
25. Rosenbach, A., D. Dignard, J. V. Pierce, M. Whiteway, and C. A. Kumamoto. 2010. 578 Adaptations of Candida albicans for growth in the mammalian intestinal tract. Eukaryot Cell 579 9:1075-1086. 580
26. Ruiz-Sanchez, D., L. Calderon-Romero, J. T. Sanchez-Vega, and J. Tay. 2002. Intestinal 581 candidiasis. A clinical report and comments about this opportunistic pathology. Mycopathologia 582 156:9-11. 583
27. Russell, C., and K. M. Lay. 1973. Natural history of Candida species and yeasts in the oral 584 cavities of infants. Arch Oral Biol 18:957-962. 585
28. Samonis, G., E. J. Anaissie, and G. P. Bodey. 1990. Effects of broad-spectrum antimicrobial 586 agents on yeast colonization of the gastrointestinal tracts of mice. Antimicrob Agents Chemother 587 34:2420-2422. 588
29. Savage, D. C. 1969. Microbial interference between indigenous yeast and lactobacilli in the 589 rodent stomach. J Bacteriol 98:1278-1283. 590
30. Schloss, P. D., S. L. Westcott, T. Ryabin, J. R. Hall, M. Hartmann, E. B. Hollister, R. A. 591 Lesniewski, B. B. Oakley, D. H. Parks, C. J. Robinson, J. W. Sahl, B. Stres, G. G. 592 Thallinger, D. J. Van Horn, and C. F. Weber. 2009. Introducing mothur: open-source, 593 platform-independent, community-supported software for describing and comparing microbial 594 communities. Appl Environ Microbiol 75:7537-7541. 595
31. Taylor, B. N., C. Fichtenbaum, M. Saavedra, I. J. Slavinsky, R. Swoboda, K. Wozniak, A. 596 Arribas, W. Powderly, and P. L. Fidel Jr. 2000. In vivo virulence of Candida albicans isolates 597 causing mucosal infections in people infected with the human immunodeficiency virus. J Infect 598 Dis 182:955-959. 599
32. van der Waaij, D. 1987. Colonization resistance of the digestive tract--mechanism and clinical 600 consequences. Nahrung 31:507-517. 601
33. van der Waaij, D., and J. M. Berghuis. 1974. Determination of the colonization resistance of 602 the digestive tract of individual mice. J Hyg (Lond) 72:379-387. 603
34. Van der Waaij, D., and B. D. Van der Waaij. 1990. The colonization resistance of the 604 digestive tract in different animal species and in man; a comparative study. Epidemiol Infect 605 105:237-243. 606
35. Wagner, R. D., C. Pierson, T. Warner, M. Dohnalek, M. Hilty, and E. Balish. 2000. 607 Probiotic effects of feeding heat-killed Lactobacillus acidophilus and Lactobacillus casei to 608 Candida albicans-colonized immunodeficient mice. J Food Prot 63:638-644. 609
36. White, S. J., A. Rosenbach, P. Lephart, D. Nguyen, A. Benjamin, S. Tzipori, M. Whiteway, 610 J. Mecsas, and C. A. Kumamoto. 2007. Self-regulation of Candida albicans population size 611 during GI colonization. PLoS Pathog 3:e184. 612
on October 12, 2019 by guest
http://iai.asm.org/
Dow
nloaded from