dr. anwar abu-zarifa department of industrial engineering...
TRANSCRIPT

1 - 1
Integrated Production systems
Integrated Production systems
Dr. Anwar Abu-ZarifaDepartment of Industrial EngineeringIslamic University of GazaEmail: [email protected] intern: 2832

1 - 2
Course Description and Outline
Course Description and Outline
Attendance 5%
Quizzes 5% Project 10%Mid-term 30% Final examination 50%
Integrated Production systems EIND 2305
Course Description and OutlineThis module introduces the concept of integrated productions systems. Furthermore, it helps the students to improve their
skills of dealing with real life problems and perform further research in the related areas.Discussed Topics
Supply Chain Management Inventory Management Systems Resource Planning Just-in-time Systems Learning Curve Analysis Scheduling Constraint Management Text Book•Krajewski, L., Ritzman, L., and Malhotra, M., Operations Management processes and supply chains, 9th Edition, Pearson, 2010. Software: QM Explorer References •Evans, J., Anderson, D., Sweeney, D., and Williams, T., Applied Production and Operations Management, 3rd Edition, West Publishing Company, 1990.Grading

1 - 3© 2011 Pearson Education, Inc. publishing as Prentice Hall
11 Operations and Productivity
Operations and Productivity

1 - 4© 2011 Pearson Education, Inc. publishing as Prentice Hall
What Is Operations Management?
Production is the creation of goods and services
Operations management (OM) is the set of activities that create value in the form of goods and
services by transforming inputs into outputs

1 - 5© 2011 Pearson Education, Inc. publishing as Prentice Hall
Organizing to Produce Goods and Services
Essential functions:1. Marketing – generates demand2. Production/operations – creates
the product3. Finance/accounting – tracks how
well the organization is doing, pays bills, collects the money

1 - 6© 2011 Pearson Education, Inc. publishing as Prentice Hall
Organizational Charts
OperationsTeller SchedulingCheck ClearingCollectionTransaction processingFacilities design/layoutVault operationsMaintenanceSecurity
FinanceInvestmentsSecurityReal estate
Accounting
Auditing
MarketingLoans
CommercialIndustrialFinancialPersonalMortgage
Trust Department
Commercial Bank
Figure 1.1(A)

1 - 7© 2011 Pearson Education, Inc. publishing as Prentice Hall
Organizational Charts
OperationsGround support
equipmentMaintenanceGround Operations
Facilitymaintenance
CateringFlight OperationsCrew schedulingFlyingCommunicationsDispatching
Management science
Finance/ accountingAccounting
PayablesReceivablesGeneral Ledger
FinanceCash controlInternational
exchange
Airline
Figure 1.1(B)
MarketingTraffic administration
ReservationsSchedulesTariffs (pricing)
SalesAdvertising

1 - 8© 2011 Pearson Education, Inc. publishing as Prentice Hall
MarketingSales
promotionAdvertisingSalesMarket research
Organizational Charts
OperationsFacilities
Construction; maintenanceProduction and inventory control
Scheduling; materials controlQuality assurance and controlSupply-chain managementManufacturing
Tooling; fabrication; assemblyDesign
Product development and designDetailed product specifications
Industrial engineeringEfficient use of machines, space,
and personnelProcess analysis
Development and installation ofproduction tools and equipment
Finance/ accountingDisbursements/
creditsReceivablesPayablesGeneral ledger
Funds ManagementMoney marketInternational
exchangeCapital requirements
Stock issueBond issue
and recall
Manufacturing
Figure 1.1(C)
1 - 9© 2011 Pearson Education, Inc. publishing as Prentice Hall
Why Study OM?1. OM is one of three major functions of
any organization, we want to study how people organize themselves for productive enterprise
2. We want (and need) to know how goods and services are produced
3. We want to understand what operations managers do
4. OM is such a costly part of an organization
1 - 10© 2011 Pearson Education, Inc. publishing as Prentice Hall
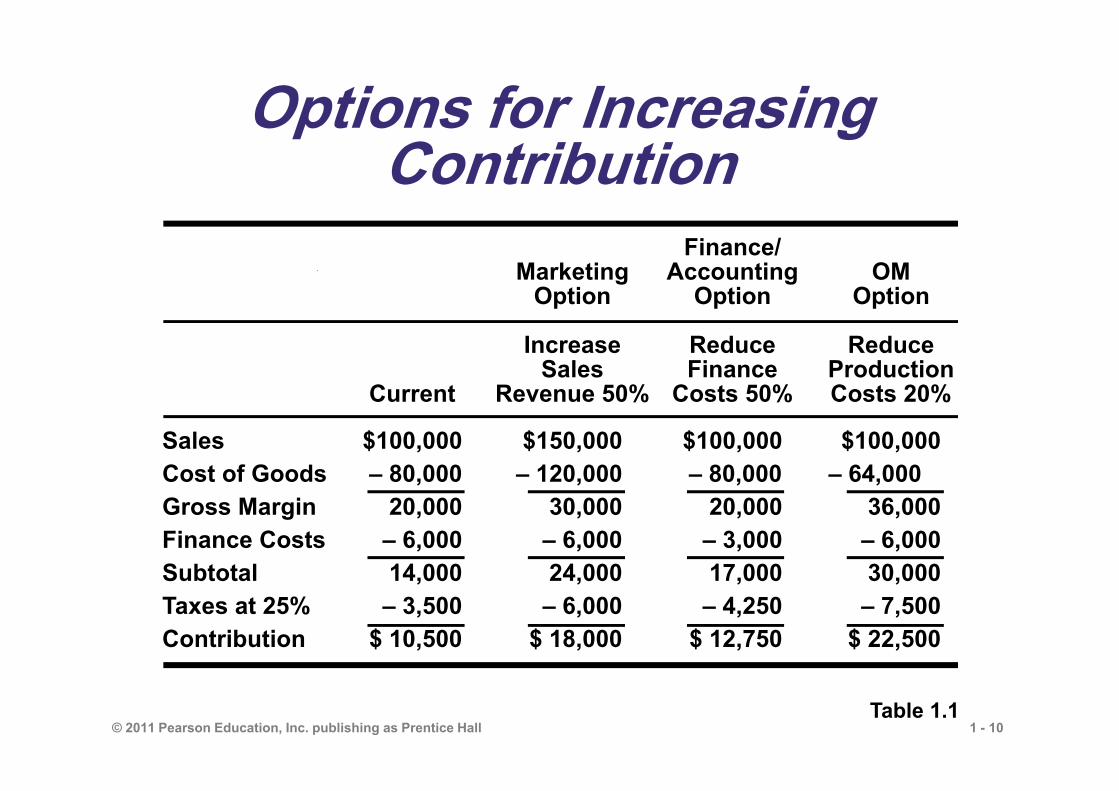
Options for Increasing Contribution
Table 1.1
Sales $100,000 $150,000 $100,000 $100,000Cost of Goods – 80,000 – 120,000 – 80,000 – 64,000Gross Margin 20,000 30,000 20,000 36,000Finance Costs – 6,000 – 6,000 – 3,000 – 6,000Subtotal 14,000 24,000 17,000 30,000Taxes at 25% – 3,500 – 6,000 – 4,250 – 7,500Contribution $ 10,500 $ 18,000 $ 12,750 $ 22,500
Finance/Marketing Accounting OM
Option Option Option
Increase Reduce ReduceSales Finance Production
Current Revenue 50% Costs 50% Costs 20%

1 - 11© 2011 Pearson Education, Inc. publishing as Prentice Hall
What Operations Managers Do
Planning Organizing Staffing Leading Controlling
Basic Management Functions

1 - 12© 2011 Pearson Education, Inc. publishing as Prentice Hall
Ten Critical DecisionsTen Decision Areas Chapter(s)
1. Design of goods and services 52. Managing quality 6, Supplement 63. Process and capacity 7, Supplement 7
design 4. Location strategy 85. Layout strategy 96. Human resources and 10
job design 7. Supply-chain 11, Supplement 11
management8. Inventory, MRP, JIT 12, 14, 169. Scheduling 13, 1510. Maintenance 17 Table 1.2

1 - 13© 2011 Pearson Education, Inc. publishing as Prentice Hall
The Critical Decisions1. Design of goods and services What good or service should we
offer? How should we design these
products and services? 2. Managing quality How do we define quality? Who is responsible for quality?
Table 1.2 (cont.)

1 - 14© 2011 Pearson Education, Inc. publishing as Prentice Hall
The Critical Decisions3. Process and capacity design What process and what capacity will
these products require? What equipment and technology is
necessary for these processes?4. Location strategy Where should we put the facility? On what criteria should we base the
location decision?
Table 1.2 (cont.)
1 - 15© 2011 Pearson Education, Inc. publishing as Prentice Hall
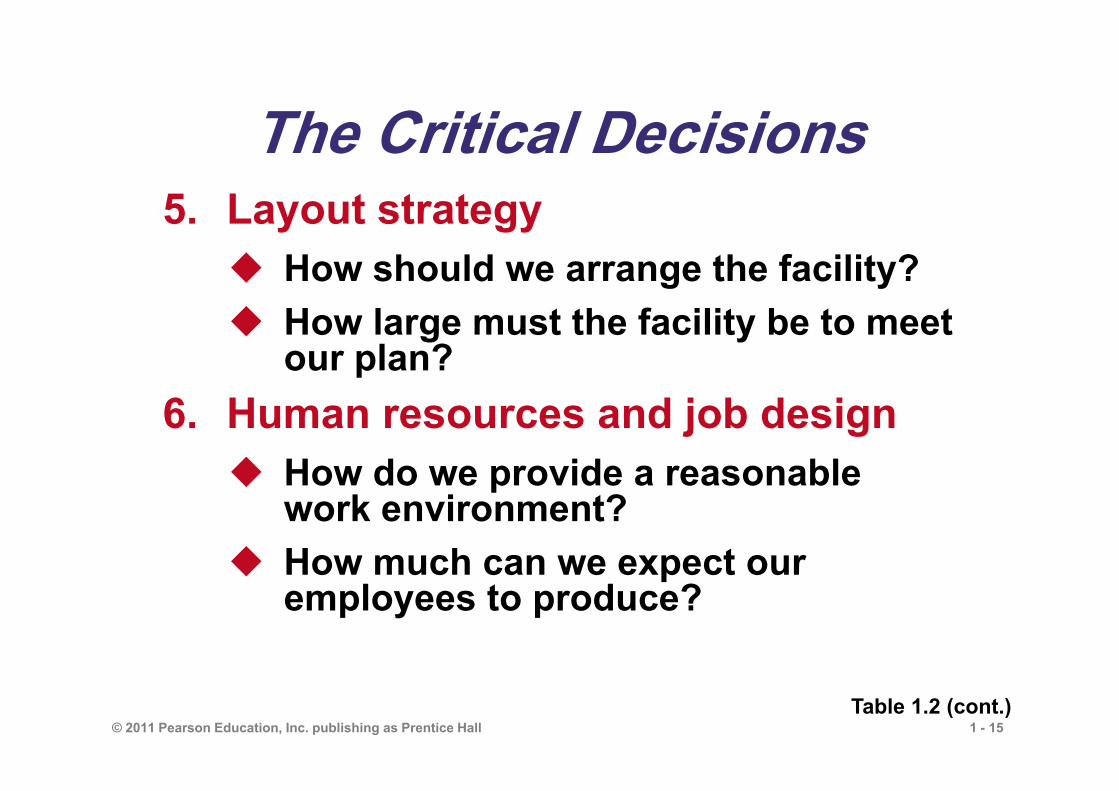
The Critical Decisions5. Layout strategy How should we arrange the facility? How large must the facility be to meet
our plan?6. Human resources and job design How do we provide a reasonable
work environment? How much can we expect our
employees to produce?
Table 1.2 (cont.)
1 - 16© 2011 Pearson Education, Inc. publishing as Prentice Hall
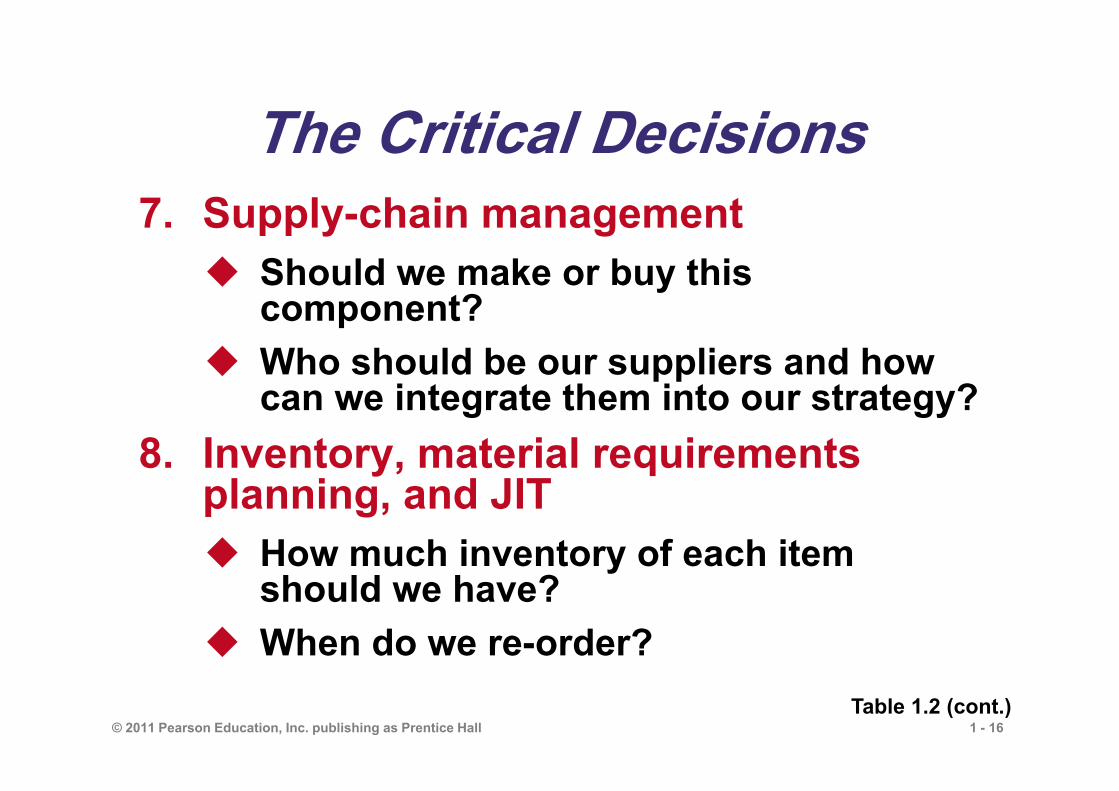
The Critical Decisions7. Supply-chain management Should we make or buy this
component? Who should be our suppliers and how
can we integrate them into our strategy?8. Inventory, material requirements
planning, and JIT How much inventory of each item
should we have? When do we re-order?
Table 1.2 (cont.)

1 - 17© 2011 Pearson Education, Inc. publishing as Prentice Hall
The Critical Decisions9. Intermediate and short–term
scheduling Are we better off keeping people on
the payroll during slowdowns? Which jobs do we perform next?
10.Maintenance How do we build reliability into our
processes? Who is responsible for maintenance?
Table 1.2 (cont.)

1 - 18© 2011 Pearson Education, Inc. publishing as Prentice Hall
Where are the OM Jobs? Technology/methods Facilities/space utilization Strategic issues Response time People/team development Customer service Quality Cost reduction Inventory reduction Productivity improvement

1 - 19© 2011 Pearson Education, Inc. publishing as Prentice Hall
New Challenges in OM
Global focus Just-in-timeSupply-chain
partneringRapid product
development, alliances
Mass customization
Empowered employees, teams
ToFrom Local or national focusBatch shipments Low bid purchasing
Lengthy product development
Standard products
Job specialization
1 - 20© 2011 Pearson Education, Inc. publishing as Prentice Hall
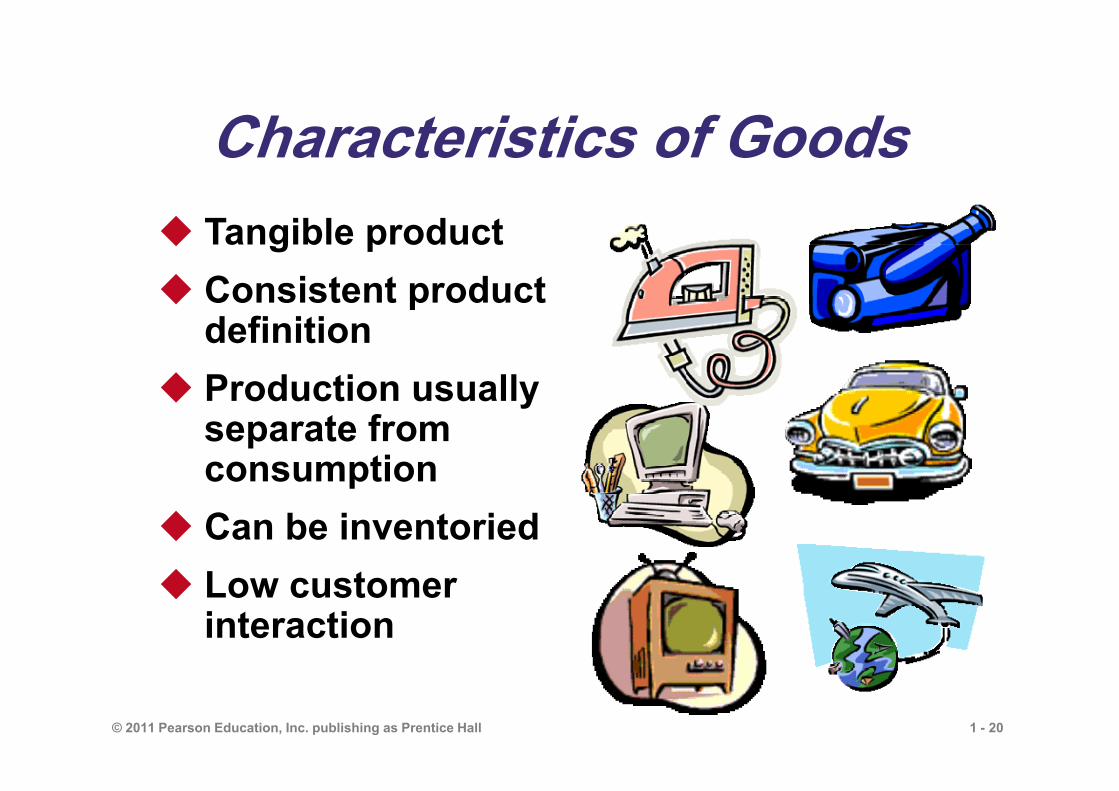
Characteristics of Goods Tangible product Consistent product
definition Production usually
separate from consumption
Can be inventoried Low customer
interaction

1 - 21© 2011 Pearson Education, Inc. publishing as Prentice Hall
Characteristics of Service Intangible product Produced and
consumed at same time Often unique High customer
interaction Inconsistent product
definition Often knowledge-based Frequently dispersed

1 - 22© 2011 Pearson Education, Inc. publishing as Prentice Hall
Industry and Services as Percentage of GDP
Services Manufacturing
Aus
tral
ia
Can
ada
Chi
na
Cze
ch R
ep
Fran
ce
Ger
man
y
Hon
g K
ong
Japa
n
Mex
ico
Rus
sian
Fed
Sout
h A
fric
a
Spai
n
UK US
90 −80 −70 −60 −50 −40 −30 −20 −10 −0 −

1 - 23© 2011 Pearson Education, Inc. publishing as Prentice Hall
Goods and ServicesAutomobile
ComputerInstalled carpeting
Fast-food mealRestaurant meal/auto repair
Hospital careAdvertising agency/
investment managementConsulting service/
teachingCounseling
Percent of Product that is a Good Percent of Product that is a Service
100% 75 50 25 0 25 50 75 100%| | | | | | | | |
1 - 24© 2011 Pearson Education, Inc. publishing as Prentice Hall
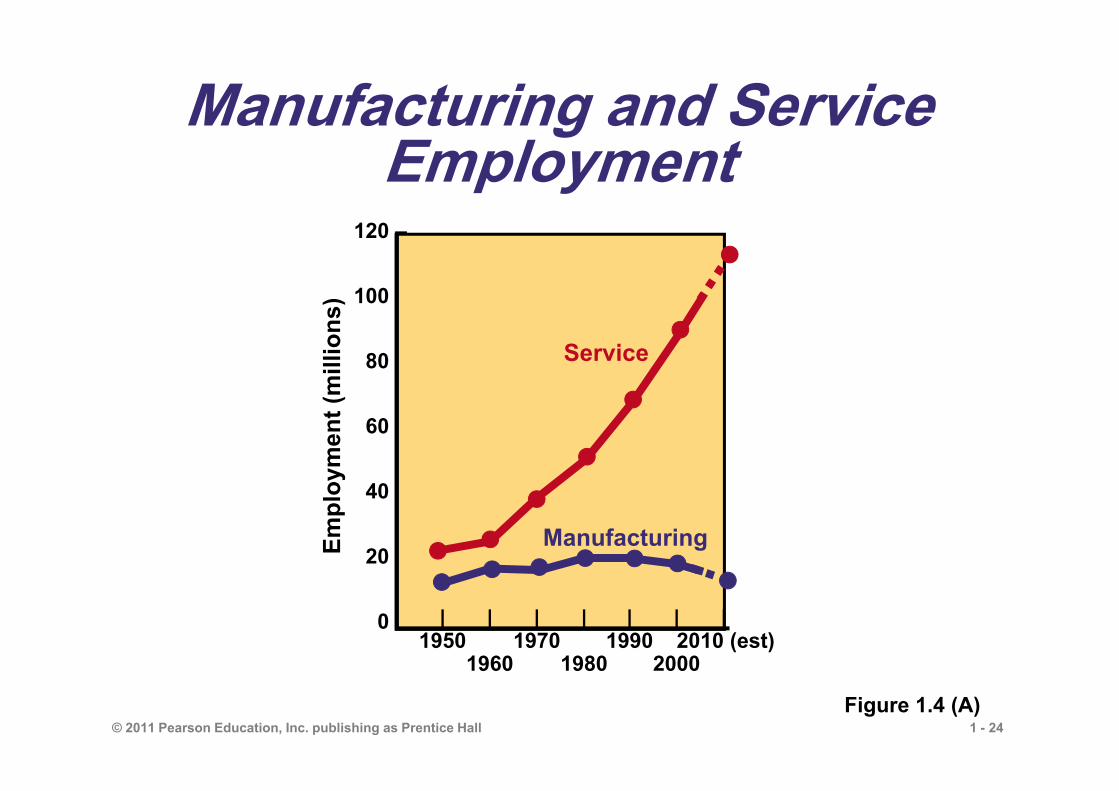
120 –
100 –
80 –
60 –
40 –
20 –
0 – | | | | | | |1950 1970 1990 2010 (est)
1960 1980 2000
Empl
oym
ent (
mill
ions
)
Manufacturing and Service Employment
Figure 1.4 (A)
Manufacturing
Service

1 - 25© 2011 Pearson Education, Inc. publishing as Prentice Hall
New Trends in OM Ethics Global focus Environmentally sensitive production Rapid product development Environmentally sensitive production Mass customization Empowered employees Supply-chain partnering Just-in-time performance

1 - 26© 2011 Pearson Education, Inc. publishing as Prentice Hall
Productivity Challenge
Productivity is the ratio of outputs (goods and services) divided by the inputs
(resources such as labor and capital)
The objective is to improve productivity!
Important Note!Production is a measure of output
only and not a measure of efficiency

1 - 27© 2011 Pearson Education, Inc. publishing as Prentice Hall
Feedback loop
Outputs
Goods and
services
Transformation
The U.S. economic system transforms inputs to outputs
at about an annual 2.5% increase in productivity per
year. The productivity increase is the result of a
mix of capital (38% of 2.5%), labor (10% of 2.5%), and
management (52% of 2.5%).
The Economic SystemInputs
Labor,capital,
management
Figure 1.6

1 - 28© 2011 Pearson Education, Inc. publishing as Prentice Hall
Improving Productivity at Starbucks
A team of 10 analysts continually look for ways to shave time. Some improvements:Stop requiring signatures on credit card purchases under $25
Saved 8 seconds per transaction
Change the size of the ice scoop
Saved 14 seconds per drink
New espresso machines Saved 12 seconds per shot
1 - 29© 2011 Pearson Education, Inc. publishing as Prentice Hall
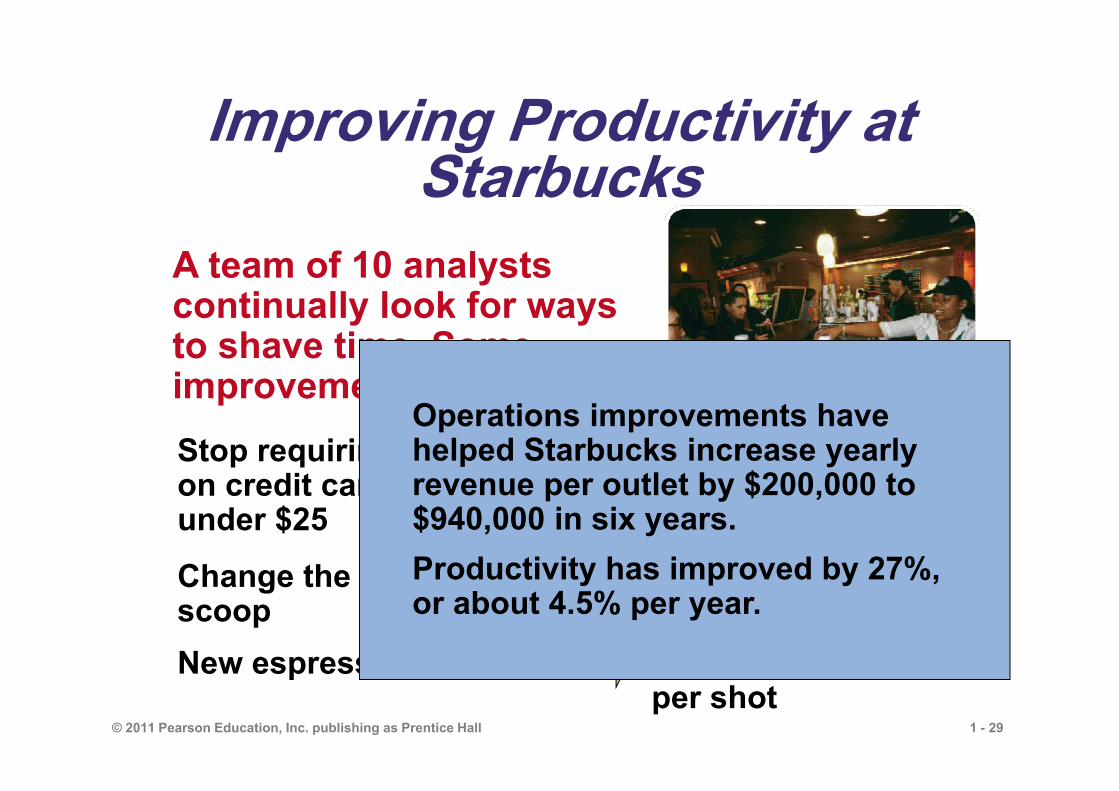
Improving Productivity at Starbucks
A team of 10 analysts continually look for ways to shave time. Some improvements:Stop requiring signatures on credit card purchases under $25
Saved 8 seconds per transaction
Change the size of the ice scoop
Saved 14 seconds per drink
New espresso machines Saved 12 seconds per shot
Operations improvements have helped Starbucks increase yearly revenue per outlet by $200,000 to $940,000 in six years.Productivity has improved by 27%, or about 4.5% per year.

1 - 30© 2011 Pearson Education, Inc. publishing as Prentice Hall
Measure of process improvement Represents output relative to input Only through productivity increases
can our standard of living improve
Productivity
Productivity =Units produced
Input used
1 - 31© 2011 Pearson Education, Inc. publishing as Prentice Hall
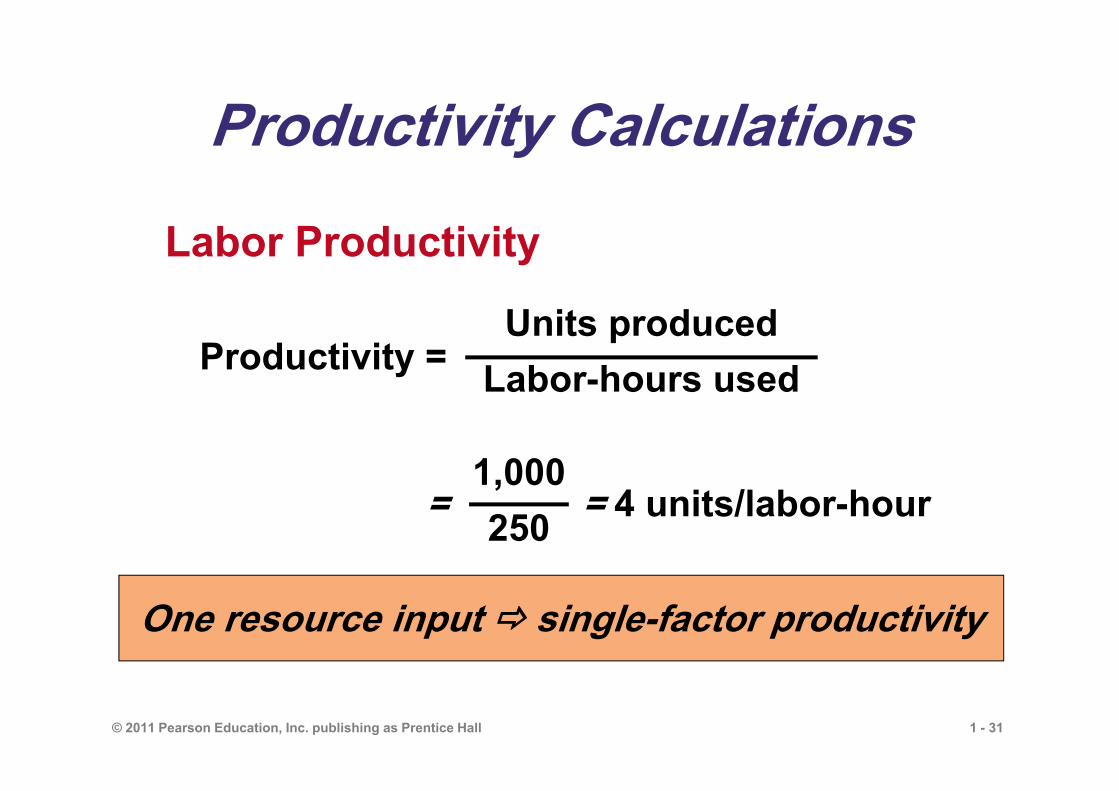
Productivity Calculations
Productivity =Units produced
Labor-hours used
= = 4 units/labor-hour1,000250
Labor Productivity
One resource input single-factor productivity
1 - 32© 2011 Pearson Education, Inc. publishing as Prentice Hall
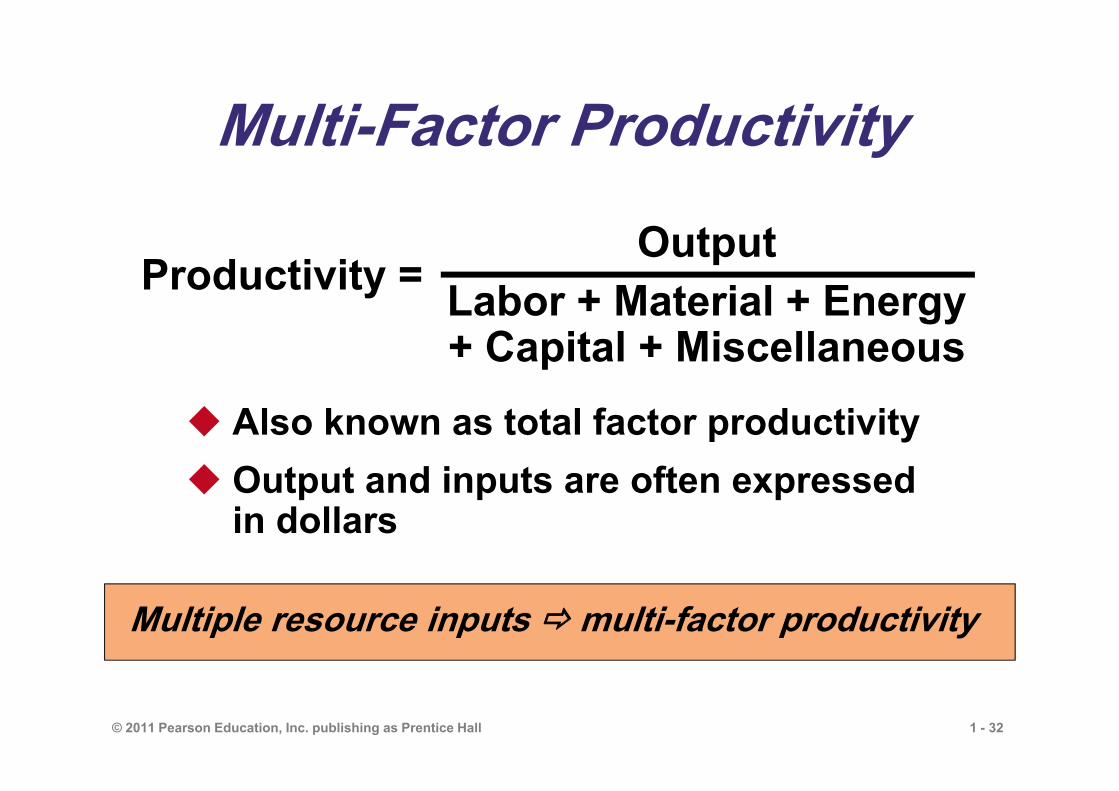
Multi-Factor Productivity
OutputLabor + Material + Energy + Capital + Miscellaneous
Productivity =
Also known as total factor productivity Output and inputs are often expressed
in dollars
Multiple resource inputs multi-factor productivity
1 - 33© 2011 Pearson Education, Inc. publishing as Prentice Hall
Measurement Problems1. Quality may change while the
quantity of inputs and outputs remains constant
2. External elements may cause an increase or decrease in productivity Precise units of measure may be
lacking

1 - 34© 2011 Pearson Education, Inc. publishing as Prentice Hall
Productivity Variables1. Labor - contributes
about 10% of the annual increase
2. Capital - contributes about 38% of the annual increase
3. Management -contributes about 52% of the annual increase

1 - 35© 2011 Pearson Education, Inc. publishing as Prentice Hall
Service Productivity
1. Typically labor intensive2. Frequently focused on unique
individual attributes or desires3. Often an intellectual task performed by
professionals4. Often difficult to mechanize5. Often difficult to evaluate for quality

1 - 36© 2011 Pearson Education, Inc. publishing as Prentice Hall
The Hard Rock Cafe
First opened in 1971 Now – 129 restaurants in over 40 countries
Rock music memorabilia Creates value in the form of good food
and entertainment 3,500+ custom meals per day in Orlando How does an item get on the menu? Role of the Operations Manager