draft final report cold tasks 3-5 28 12 2007 - eup network · final report draft version tasks 3 -5...
TRANSCRIPT

December 2007
Preparatory Studies for Eco-design Requirements of EuPs
(Tender TREN/D1/40-2005)
LOT 13: Domestic Refrigerators & Freezers
Final Report
Draft Version Tasks 3 -5
Lead contractor: ISIS
Contribution from
Ms Milena Presutto, ENEA (Tasks 1 and 5.1)
Mr Rainer Stamminger, University of Bonn (Tasks 2.3 and 3)
Mr Raffaele Scialdoni, ISIS (Task 5.2 and 5.3)
Mr Wiliam Mebane, ISIS (Task 2.4, 4 and 5.4)
Ms Rita Esposito, ISIS (Task 2.1 and 2.2)
Project Leader: Stefano Faberi, ISIS

Table of Contents
0 BRIEF SUMMARY OF THE STUDY TASKS ..................................................................236 0.3 DESCRIPTION OF TASK 3............................................................................................................................... 236 0.4 DESCRIPTION OF TASK 4............................................................................................................................... 237 0.5 DESCRIPTION OF TASK 5............................................................................................................................... 237
0.5.1 Subtask 5.1: Definition of Base Case for Refrigerators and Freezers .................................................... 237 0.5.2 Subtask 5.2: Product-specific inputs....................................................................................................... 239 0.5.3 Subtask 5.3: Base Case Environmental Impact Assessment ................................................................... 240 0.5.4 Subtask 5.4: Base Case Life Cycle Cost ................................................................................................. 241 0.5.5 Subtask 5.5: EU Totals (not yet carried out) .......................................................................................... 241 0.5.6 Subtask 5.6: EU25 Total System Impact (not yet carried out) ................................................................ 242
3 TASK 3: CONSUMER BEHAVIOUR AND LOCAL INFRASTRUCTURE .................243 3.1 CONTENT AND BASIC RESULTS OF THE CONSUMER SURVEY ......................................................................... 243
3.1.1 Data basis and objects of investigation of the survey ............................................................................. 243 3.1.2 Demography ........................................................................................................................................... 245 3.1.3 Living conditions..................................................................................................................................... 247 3.1.4 Consumer opinion about the topic “Household appliances” ................................................................. 255
3.2 IDENTIFICATION OF POSSIBLE BARRIERS TO ECO DESIGN INNOVATIONS ....................................................... 260 3.2.1 Life time of the appliances ...................................................................................................................... 260 3.2.2 Repairs.................................................................................................................................................... 266 3.2.3 Second-hand market ............................................................................................................................... 269 3.2.4 Food safety.............................................................................................................................................. 272
3.3 USER DEFINED PARAMETERS ........................................................................................................................ 273 3.3.1 Consumer behaviour in terms of energy consumption and saving.......................................................... 273 3.3.2 Results of the consumer survey ............................................................................................................... 281 3.3.3 Definition of the real life base case ........................................................................................................ 300
3.4 SUMMARY OF CONSUMER BEHAVIOUR ......................................................................................................... 313
4 TASK 4: PRODUCT SYSTEM ANALYSIS.......................................................................325 4.1 DESCRIPTION OF TASK 4............................................................................................................................... 325 4.2 SYSTEM BOUNDARY..................................................................................................................................... 326 4.3 REAL CONSUMER USE OF REFRIGERATORS AND FREEZERS............................................................................ 327
4.3.1 Ambient temperature............................................................................................................................... 327 4.3.2 Temperature settings, loading and door opening ................................................................................... 329 4.3.3 Consumer needs and trends .................................................................................................................... 330
4.4 ENRICHED USER/APPLIANCE INTERFACE....................................................................................................... 333 4.5 NEW UTILITY/APPLIANCE INTERFACE ........................................................................................................... 334 4.6 CEDA EU25 PRODUCT AND ENVIRONMENTAL MODEL ................................................................................ 335
5 TASK 5: DEFINITION OF BASE-CASE ...........................................................................339 5.1 SUBTASK 5.1: DEFINITION OF BASE CASE .................................................................................................... 339
5.1.1 The Analysis of the 2005 Technical Database ........................................................................................ 339 5.1.2 The Notary Report of the Industry Voluntary Commitment .................................................................... 344 5.1.3 The Sales Data for 2004 ......................................................................................................................... 354 5.1.4 The Standard Base Case Characteristics................................................................................................ 354 5.1.5 The Real Life Base Case Characteristics................................................................................................ 364
5.2 SUBTASK 5.2: PRODUCT-SPECIFIC INPUTS .................................................................................................... 364 5.2.1 The Selection of Real Models for Data Collection.................................................................................. 364 5.2.2 Base-cases............................................................................................................................................... 368 5.2.3 Data from manufacturers........................................................................................................................ 371

5.3 BASE-CASE ENVIRONMENTAL IMPACT ASSESSMENT................................................................................... 374 5.3.1 Considerations and assumptions to use inventory data in EuP Ecoreport ............................................. 374 5.3.2 LCA of cold models using EuP Ecoreport .............................................................................................. 376 5.3.3 Preliminary conclusions and remarks .................................................................................................... 376 5.3.4 The results from the SimaPro analysis and comparison with the EUP Ecoreport outputs..................... 387
5.4 BASE-CASE LIFE CYCLE COSTS ................................................................................................................... 393 5.4.1 Key economic assumptions ..................................................................................................................... 394 5.4.2 The analysis results................................................................................................................................. 394
5.5 EU TOTALS .................................................................................................................................................. 396
Appendix A: Life Cycle Inventory data....................................................................................... 398
Appendix B: EuP-Ecoreport data ................................................................................................ 410
Appendix C: SIMA-PRO data...................................................................................................... 426 NOTE: according to international standards dealing with quantities and units, the numbers in this study are written according to the following rules: − the comma “,“ is the separator between the integer and the decimal part of a number − numbers with more than three digits are divided by a blank in groups of three digits − in case of monetary values the numbers are divided by a dot in groups of three digits.

236
0 Brief summary of the Study Tasks
A summary of the tasks included in this second part of the interim report on the cold appliances study (tasks 3-5) is outlined in the following paragraphs
0.3 DESCRIPTION OF TASK 3 The behaviour of the consumer with household appliances influences the environmental impact because of the usage of resources like water and/or energy and/or chemicals.
With the help of an extensive consumer survey (almost 2500 households interviewed from 10 European countries) the task to identify the “real life” consumer behaviour concerning the use/handling with household appliances, especially refrigerators and freezers, is fulfilled and differences from the standard test conditions to real life conditions affecting the environmental impact are identified, including their effect on the real life energy consumption.
In European households refrigerators are available in the local infrastructure for almost 100 % of the households and in even 21 % of the households in this report a secondary refrigerator is available. In average these refrigerators are 1,4 years older than the primary refrigerator. All refrigerators and freezers normally remain in the household for 10 years and more, keeping the status of efficiency of the machine remaining as they were at the production of the gadget. Improvements will therefore take more than 10 years to get fully effective in the market.
Another possible barrier for energy saving innovations for cold appliances is the necessity of food protection. The decrease of energy consumption can only go as far as food safety is ensured. There is common understanding that perishable food should be stored at temperatures below 5 °C in a refrigerator and at -18 °C in a freezer. Other important factors influencing the energy consumption in real life are identified especially by the temperature of the ambient where the refrigerator or freezer stands and the amount of new food loaded into the machines which needs to be cooled down. Recommendations to place the refrigerator and freezer at the lowest possible ambient temperature and not to place hot food into them are important ways to reduce the amount of energy used.
But refrigerators and freezers in consumer homes do not always seem to be set to follow this recommendation. Ambient temperatures go up to 40 °C for a considerable amount of households investigated and down to temperatures of 0 °C. While the higher ambient temperatures are covered by the climate classes as defined, ambient temperatures lower than 10 °C are not foreseen at all. But more than 20 % of the households investigated in 10 European countries report to have minimum ambient temperatures lower than 10 °C where the refrigerator stands. One consequence of this is that the right temperature in the refrigerator and freezer is no longer maintained and the quality of food stored may suffer significant losses. In refrigerators/freezers of category 7 many gadgets do have only one compressor which is used to provide cooling for both compartments. The consequence is, that at lower ambient temperatures these machines may either fail to keep the right storage temperatures or they activate additional heating devices to cause the compressor to provide more cooling. This may cause considerable additional amounts of energy (up to 29 %) used as compared to a similar appliance with two compressor circles.
Consumer behaviour is also characterised by
• average temperature of the refrigerator is set at 5,0 °C at the correct level, but with relevant differences between countries

237
• average temperature of the freezer is at -16,7 °C again with differences between countries • the capacity of the refrigerator compartment is used to a good extend by the consumers, but
that of the freezer is used even more.
Summarising all of these findings about the consumer behaviour allows estimating the difference between the real life and standard base case energy consumption. Due to the lower ambient temperature in real life compared to the 25 °C used in the standard measurement will considerably reduce the energy taken by the gadgets. Part of this saving is balanced by cooling down food which is loaded and by cooling down the air which is exchanged when opening the door. So all in all the measured consumption following the standard is somehow taking care for this kind of real life behaviour. Not covered are the additional consumptions which may be used by cat. 7 refrigerators/freezers with just one compressor (and one thermostat) not operated within the temperature range of 20 to 30 °C. Here significant amounts of additional energy are used on which the consumer was not informed at the point of sale of the gadget.
0.4 DESCRIPTION OF TASK 4 The eco-design directive is referred to product design and not to systems or installations as a whole. However, Annex VII.4 considers the interaction of the specific EuP with the installation/system where it operates, implicitly stating that the possible effects of the EuP being part of a larger system are to be identified and evaluated. This task includes therefore a functional analysis of the system to which the product belongs, including a rough estimate of the overall impacts, for example from IPP studies like EIPRO and an assessment of how the integration of the product into the system and its design can improve its overall environmental performance.
0.5 DESCRIPTION OF TASK 5
0.5.1 Subtask 5.1: Definition of Base Case for Refrigerators and Freezers For this assessment average EU product(s) or representative product categories should be defined as the “Base case” for the whole EU 25. In general, the base case is by definition the average appliance on the European market, where the “Standard Base Case” (STBC) is defined according to the measurement standard or in EU legislation (in terms of appliance category, volume and energy consumption), while for the “Real Life Base Case” (RLBC) the characteristics of the average sold appliance will be considered. During the development of this Task, it will be evaluated if this differentiation is applicable to cold appliances. For refrigerators and freezers ten different categories have been already defined in the existing EU legislation (directive 94/2/EC) and more possibly could be added. In addition, the COLD-II study identified some 13 reference models on which a detailed analysis of the technological improvement was developed, but the time and budget limits of the present study do not allow to deal with such a large amount of base-case models. Taking into consideration all the available technical information, it was initially proposed to run this Task in two ways: 1) revision of the base-cases defined in previous COLD-II study, to evaluate their representativity
of the present market situation, update of the already developed technological impact analysis

238
and - if necessary - integration with additional options more related to environmental aspects other than energy consumption.
2) as alternative, definition of new average base-case models, maximum four, probably as: • average European overall appliance • average European refrigerator • average European fridge-freezer • average European freezer.
Under this second option, the selection of base case models will be done on the basis of the analysis of the latest technical database developed by CECED. CECED database have been developed since 1995 and are regularly presented to the EC and the Regulatory Committee responsible for the management of the EU energy labelling scheme. Cold appliances technical database include the parameters declared for the energy labelling and is therefore structured according to the 10 appliance categories defined in directive 94/2/EC. Once the overall approach is defined, the selection of the reference models will be mainly based on the analysis of the energy consumption and possibly the appliance volume. The energy consumption characteristics of the models will be expressed through their actual annual consumption values in kWh/year or specific consumption in kWh/litre (or kWh/equivalent_litre), or with their energy efficiency class. The database analysis will result in the identification of a virtual average reference model (or more than one) for each appliance group. This model will be then compared with the real models in the database: the models close to the “virtual average” could be considered as participating in the composition of the average itself, both in terms of technical characteristics and relevant brands & manufacturers. The technical characteristics of the selected real models will be averaged to evaluate how close the real average reference model is from the “virtual” one. This analysis will allow the validation of the chosen real average reference appliances, or will suggest the need of selecting a new set of models from the database or to accept more than one set. In addition, outcome of Tasks 2 and 3 will be taken into consideration. Once the real average reference model(s) is validated, its brand composition will be analysed, in term of number of models per each brand included in the selected real models. The results will be the percentage of each brand (and therefore of each manufacturer) concurring to the real average reference model in each appliance group. At this point, the identified manufacturers/brands will be asked to select a real appliance model (or more than one model) - possibly1 among the identified set in the technical database - and to provide the information included in the so called “Environmental Performance Questionnaire” (BOM and inventory data). for this reference model. Once the information is collected, all data will be weighted according to the previously mentioned brand/manufacturer composition, to create the ecological profile of the base case average reference washing machine and dishwasher models. As alternative, a more simple average of the data collected by the manufacturers could be used. The same procedure will be applied for the identification of the “best case” model(s) or “top of the range model(s)” in each appliance category. Top of the range models will be used to evaluate the gap already existing between the average and the best available appliances in the reference year. 1 Since the analysed technical database includes models produced in 2005 or before, manufacturers could select a reference model which is not among the identified set.

239
0.5.2 Subtask 5.2: Product-specific inputs Product-specific inputs have been, first of all collected and organised according to the “EuP Eco Report” requirements and taking into account the LCA ISO 14040 norms. Similarly, the methodology used for the LCA analysis has been, at first glance, based on the EuP-Ecoreport settings, but it was, as close as possible, also compared and aligned with the LCA standard methodology, in order to use (in the final version of the report) others LCA software and data (like, i.e. the Simapro tool) and databases). Primary input data came from direct communication with producers and/or, if not available, collected on sector specific or commercial data base (secondary data). These data have been considered both for the standard and (if identified) the real base cases. The product’s specific inputs were thus classified according to the following data sets: • General information on product type (reference models, efficiency class, volume ); • Production phase (raw materials, components and assembling):
- Used materials, related working processes (moulding, extrusion, wiring, ...), average distances from production sites, percentage of scrap, …)
- Energy consumption (electric - kWh, thermal – MJ as Natural Gas, Oil,….or different sources) for assembling
- Water (and others) consumption for assembling - Waste production - Waste water quality (BOD, COD, other indicators, …);
• Distribution of products (average distances and types of transport modes); • Use phase (average life, specific consumption, maintenance and repairs); • Packaging (type and weight); • End of Life (disposal, thermal valorisation, incineration, dismantling…). Production phase: a portion of the data-input inventory table sent to manufacturers for the production phase is:
from recycling net weight scrap gross
weight average distance
Mode of transport Material
(%) (kg) % (kg)
processing (on gross weight) (km)
Ferro metals Iron
Stainless steel ….. Non Ferro Metals
Aluminium Copper
….. Electronic equipments Plastics
ABS PP
PVC ….
Glass White
…. Refrigerating gas Rubber

240
Others Total weight Any other specification on material type, specific processes, was required and considered useful to complete the picture. All data were referred to be product specific (allocation procedure). If preassembled components has been indicated in inventory table, material composition and processing was required and used to define inventory. Distribution: the following data has been required:
• transport to final user: average distance and transport medium (at least more than one transport medium and specific distances covered);
• packaging management: indication on packaging recovery and disposal (as an alternative medium EU situation has been considered).
Use: the following data has been required:
• Average life • Efficiency Class • Energy consumption (kWh/year in case of refrigerators or freezers); • Refrigerating fluid consumption per year (quantity and type); • Ordinary Maintenance, as requested by producer for a specified working time; • Extra-ordinary maintenance (if possible, as suggested by producer or market analysis) • Noise (dB(A)).
Disposal: the following data has been required:
• indication on typical (or average) disposal system (if existing or known) and % and types of recycled materials.
Manufacturers produced a great amount of data, according to the data inventory sheet, but not always data were complete and congruent with requirements. Specific questions to producers were made and, according to the received answers, inventory profile of each equipment has been defined. In any case, as general rules it was stated (and agreed with producers) that if specific data were not available, average EU data have been used and, if only one manufacturer produced a data, that was considered for all the producers.
0.5.3 Subtask 5.3: Base Case Environmental Impact Assessment The environmental impact assessment has been performed for the Standard Base Case. The methodology used was based on the “EuP EcoReport”, specifying emissions and raw material consumption during the whole life cycle of the appliance. A life cycle assessment will be in parallel also carried out using a different specialised LCA module (as the “Simapro” one) in order to verify and validate the results obtained by the “EuP EcoReport”. The methodology used will comply with the ISO 14040 standards and will take into account the whole life cycle of products and their related impacts; results of this comparison will be produced in final report. According to the EuP methodology, output has been presented disaggregated by each Life Cycle Phase (assembling, use, distribution, end of life, ..), aggregated by damage category (e.g.: global warming, as weighted addition of greenhouse gases), as follow:

241
• global warming, • acid rain, • ozone depletion, • resource consumption • energy consumption It is worth noting that EuP-Ecoreport stops at Characterization phase. In order to evaluate the magnitude of damage among the different life cycle phase and compare the eco-profile outputs between different products and/or scenarios, it will be also analysed and discussed the subsequent LCA phases (normalisation, weighting, damage evaluation) by using tools like SimaPro6.
0.5.4 Subtask 5.4: Base Case Life Cycle Cost The life cycle costs, or net present value of the costs, to the consumer are calculated for each technological option beginning with the standard and real-life base case. The formula using the real cost of capital, interest – inflation, as suggested in the invitation to tender2, will be utilized. This implies that the average real (as opposed to nominal) future price of electricity over the next 15 years should be used in this calculation.
To standardize and make the results of the different lots comparable, it was suggested that the DG-TREN set a reference price for electricity to be used in these studies. The DG may also wish to standardize the real cost of capital that also would make all the LCC analysis of the different lots readily comparable. Nevertheless, an initial value between 0,14-0,15 Euro/kWh will be used for this study (the latest consumption weighted average of EU25 electricity prices, for the average household of 3500 kWh annual consumption, with taxes, for July 2006 is 0,1452 Euro/kWh), along with a real cost of capital of about 5%.
Sensitivity analysis will be applied to the main parameters here including purchase price and electricity price and the level of consumption per year of the representative cold appliances.
0.5.5 Subtask 5.5: EU Totals (not yet carried out) With regard to the total LCC data, the starting point is the individual LCC data for the real life base case (or the standard base case if no real life base case will be found) of the representative cold appliances estimated in Subtask 5.3. In general, the sales for the year 2005 and the cumulative sales from 2005 to 2020 will be estimated for EU25 for the representative models. The product of individual LCC and the 2005 sales gives the total life cycle costs for the base case models in 2005. Instead, the total cumulative sales, 2005 through 2020, cannot be simply multiplied times the LCC for 2005 to give the cumulative total, since LCC refers to the present year (2005) and the LCCs in question occur at each year over the product life. They must be discounted. So the average growth rate in sales for the EU25 is estimated and the total LCC is calculated for each year and discounted accordingly.
An effort will be made to estimate the LCC of representative new models coming to the market after the base case model, depending upon the availability of data. The total calculations will be performed as above.
2 We define, for the Standard and Real-Life Base-Case, the Life Cycle Costs. LCC = PP + PWF * OE, where LCC is Life Cycle Costs, PP is the purchase price, OE is the operating expense and PWF (Present Worth Factor) is PWF= {1 – 1/(1+ r) N }/r , in which N is the product life and r is the discount (interest-inflation) rate.
242
In addition to the total models sold in 2005, it is necessary to estimate the energy consumption of the existing stock for year 2005. This will allow the environmental impact to be estimated for the existing stock. Adding the impacts for the models of the base case, of the other new models for 2005 and the existing stock(less the new sales) we have the impact environmental impact for 2005 which can be compared to the results of the CEDA EU25 Input Output method, which will require some scaling, as described in Task 4. This comparison can be performed for washing machines which is an explicit product and product service (household laundry washing) in the CEDA model, but not for dishwashers which is not included as a distinct product.
Essentially repeating for each of the future years the calculation of the base case unit sales, other non-base case unit sales and the number of units in stock (minus new sales) along with their respective environmental impacts, the cumulative environmental impact and LCC for the next fifteen years can be estimated. The impact of production, use and disposal of the product group assumes post-RoHs3 and post-WEEE4 conditions. This cumulative result will constitute the “Business as Usual” scenario for the lifetime of the product. Actually it makes sense to discount the annual results. Discounting environmental impacts for the cumulative impact may be new to some environmentalists, however certainly most would agree that there is a loss in value from deferring these environmental improvements (the sooner the benefits the better). Total environmental impact without discounting will also be shown.
0.5.6 Subtask 5.6: EU25 Total System Impact (not yet carried out) For the year 2005 the results of Task 4, the environmental impact of the I/O model for CEDA code 540200 - “use of household refrigerators and freezers”, will be compared to the total environmental impacts given in Subtask 5.4 for year 2005, including those for sales of the base case models and for the other new models for year 2005 and for the existing stock in 2005, as previously described.
The steps necessary to make these two results as comparable as possible has been discussed in the description of Task 4. The guiding idea is to have the basic inputs of specific energy consumption and number of unit sales and units in the stock be the same for both methods. With this approach it will be possible to analyze and understand the differences in results, which will be due primarily to the addition of indirect inputs in the input output method and in the possible difference in environmental coefficients. Because we have controlled for inputs this is a good opportunity to better understand the two methods.
The other very important result will be the analysis of the environmental differences in the CEDA outputs between no use of off peak electricity (the normal use) and the use of off-peak electricity through the utilization of more silent machines during the night. While the economic advantages have been studied, the environmental impacts are less well established and constitute an important part of this research. Besides modelling a change in the input energy mix for the production of electricity, an attempt will be made to introduce the changes due to better utilization of the capacity for production and distribution of electricity.
3 RoHs directive: Directive 2002/95/EC of the European Parliament and of the Council of 27 January 2003 on the restriction of the use of certain hazardous substances in electrical and electronic equipment, O.J. L37, 13.02.2003. 4 WEEE directive: Directive 2002/96/EC of the European Parliament and of the Council of 27 January 2003 on waste electrical and electronic equipment (WEEE), O.J. L37, 13.02.2003.

243
3 Task 3: Consumer behaviour and local infrastructure
3.1 CONTENT AND BASIC RESULTS OF THE CONSUMER SURVEY
3.1.1 Data basis and objects of investigation of the survey The behaviour of the consumer with household appliances influences the environmental impact because of the usage of resources like water and/or energy and/or chemicals.
The aim of the consumer survey within this study is to identify the “real life” consumer behaviour concerning the use/handling with household appliances and to identify differences from the standard test conditions affecting the environmental impact. With the aid of an external market research institute5 2 497 European households of 10 European countries were interviewed via an online questionnaire. Suitable households (participants) were chosen following pre-defined criteria. 250 households per country were interviewed (exception: Czech Republic with only 247 households) (Figure 3.1). All in all the countries selected nearly represent 75 % of the European population. The participants were asked about their behaviour with selected household appliances and about their opinion on this topic and energy saving issues in general. Demographic data were recorded additionally.
Figure 3.1: geographic coverage and sample size of the survey6
5 ODC Services GmbH, 80636 Munich
6 Figure created with Map Creator Version.1.0 (free edition)

244
Households for this survey were selected on the one hand to represent the relevant population in their country as well as possible and on the other hand to fit with the need of this study.
Within the scheduling of the survey following criteria and quotes were chosen:
• Indicator of citizenship: total • Distribution of gender: not less than 50% female persons • Selected age groups:
o between 20 – 39 years o between 40 – 59 years o between 60 – 74 years
• Household size: 1, 2, 3, 4 and ≥4 persons
Also specific quotes about the existence of selected household appliances were set to be able to achieve a sufficient coverage of interested products and a better comparability of the results. So it was required that
• not less than 50 % of all questioned persons per country should possess a dishwasher,
• 100 % of all questioned persons per country should possess a washing machine,
• 100 % of all questioned persons per country should possess a refrigerator,
• not less than 70 % of all questioned persons per country should possess a freezer.
The quotation of gender and age-groups were made according to the aspect to reach persons which most likely are involved in housekeeping. Eurostat7 data of the distribution of the population by age group and household size for each country were used to recalculate the population following this quotation (Table 3.1) maximum differences of ± 5 % resulted between the given quotes mentioned before and the real participation in the survey (Table 3.1 and Appendix 3.1- 1).
7EUROSTAT:
http://epp.eurostat.ec.europa.eu/portal/page?_pageid=1996,45323734&_dad=portal&_schema=PORTAL&screen=welcomeref&open=/popul/popula/cens/cens_n2001/cens_nhou&language=de&product=EU_population_social_conditions&root=EU_population_social_conditions&scrollto=162

245
Table 3.1: population by household size and age group: comparison of results of own survey vs. Eurostatdata8 e.g.UK
Age group United Kingdom
20-39 years 40-59 years 60 and 74 yearstotal
1 person 4 % 5 % 5 % 14 %
2 persons 10 % 13 % 12 % 36 %
3 persons 10 % 9 % 2 % 21 %
4 persons 10 % 8% 1 % 19 % Eurostat 9
more than 4 persons 6 % 4 % 0 % 11 %
total 41 % 39 % 20 % 100 %
Age group
20-39 years 40-59 years 60 and 74 yearstotal
1 person 3,9 % 7,1 % 4,2 % 15,1 %
2 persons 11,6 % 12,2 % 10,6 % 34,4 %
3 persons 11,6 % 10,9 % 1,6 % 24,1 %
4 persons 8,0 % 8,7 % 1,0 % 17,7 % results own survey
more than 4 persons 4,8 % 3,9 % 0,0 % 8,7 %
total 39,9 % 42,8 % 17,4 % 100,0 %
Age group
20-39 years 40-59 years 60 and 74 years
1 person 0,1 % -2,1 % 0,8 % -1,1 %
2 persons -1,6 % 0,8 % 1,4 % 1,6 %
3 persons -1,6 % -1,9 % 0,4 % -3,1 %
4 persons 2,0 % -0,7 % 0,0 % 1,3 % Differences
more than 4 persons 1,2 % 0,1 % 0,0 % 2,3 %
total 1,1 % -3,8 % 2,6 % 0,0 %
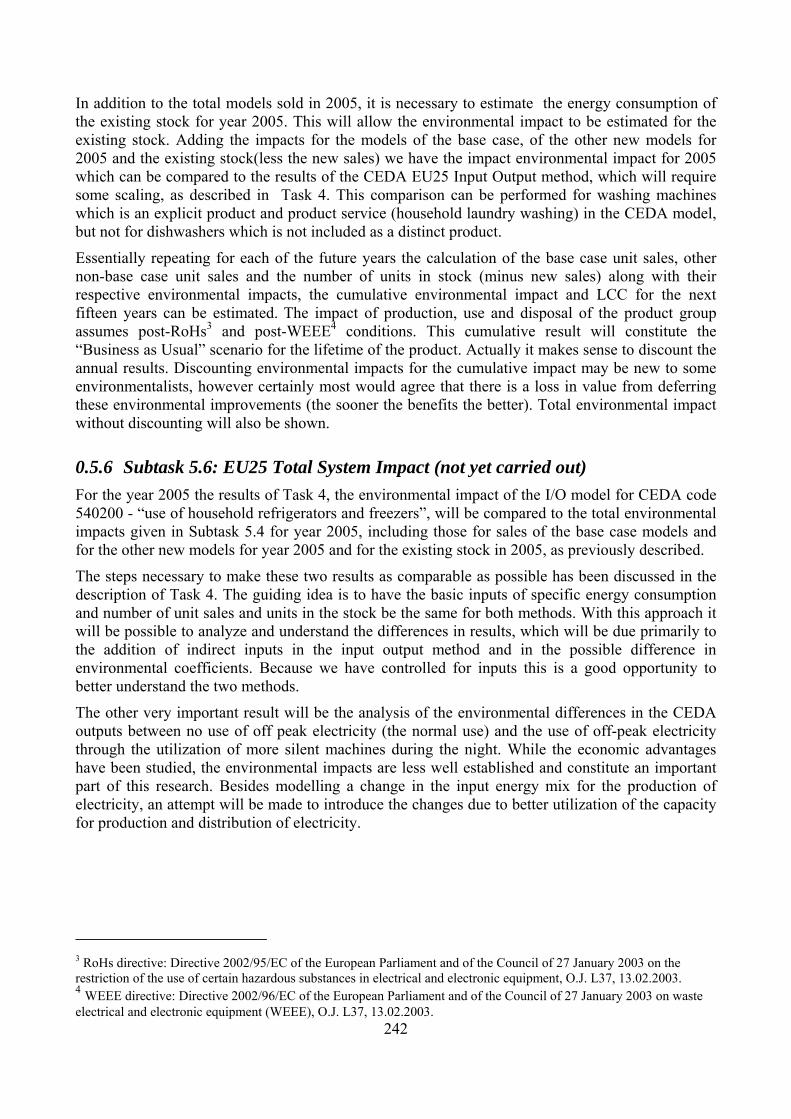
3.1.2 Demography Following the quotation by gender 56 % of all interviewed people are female and 44 % are male. The highest value with nearly 70 % of female persons can be found in our sample in United Kingdom and with over 60 % in Sweden (Figure 3.2). All in all the differences between the actual
8Own calculation: Population by household size and age group based on EUROSTAT data.
9Own calculation: via crosstabs of EUROSTAT.data of population by household size and age group.
246
gender distributions in European countries and the results of this survey are between less than 1 % and 18 % (Table 3.2).
Figure 3.2: distribution: gender of the interviewed persons (per country)
Table 3.2: results consumer survey: share of female persons (per country)
countries
UK DE IT FR ES SW PL HU FI CZ
female % of
country 68,8 % 59,6 % 60,8 % 50,0 % 50,8 % 62,4 % 50,8 % 50,0 % 56,8 % 47,4 %
Because of the self-defined quotation of age groups only people between 20 and 74 years of age were interviewed. People with an age between 20 and 39 years as well as 40 and 59 years amount to nearly 40 % of all interviewees. Between all European countries there are no significant differences; here the values lay between 39 – 42 %. The highest share of young participants could be calculated for Italy (47,6 %), Spain (46 %) and Poland (44,8 %) (Figure 3.3). Of all interviewed persons 19 % are between 60 and 74 years old. The highest share of people of this age-group can be found in our sample in Sweden (22 %), Hungary (20,8 %) and Germany (19,6 %).

247
Figure 3.3: distribution: age of the interviewed persons (per country)
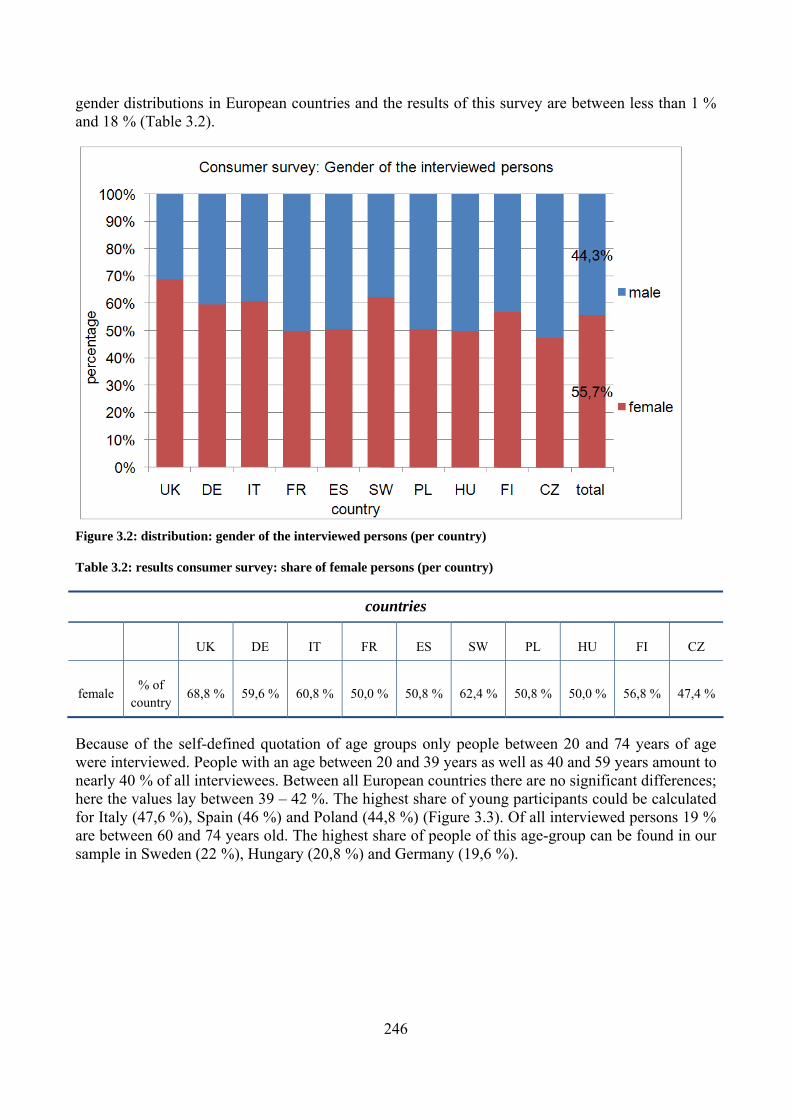
3.1.3 Living conditions Within this survey people were also asked to describe their kind of habitation. When the consumers were asked about this point 52 % of all European households (n = 2.497) said that they live in a city. Nearly 80 % of all Polish interviewed persons live in a city (Figure 3.4). This is the highest share of all European countries. Also over 60 % of all Spanish participants are city dwellers. A fourth of all households live in the suburbs of a city (25 %). Mostly British (42 %) and Czech (39 %) interviewees live at this place. The other countries show percentages between 14 and 28. The remaining European households (23 %) answered that they live in a rural area, especially a high share of British participants (40 %). Furthermore German (33 %), French (29 %) and Hungarian (28 %) households follow.
248
Figure 3.4: living environment of the interviewed persons (per country)
Nearly 60 % of all interviewed people live in a family household (Figure 3.5). This household type could be found mostly in our sample in Italy and Czech Republic with over 70 % and also in Poland and Hungary with over 66 % (Figure 3.6). Approximately 40 % of all family households consist of 3 or 4 persons and even 10 % over 4 persons (Figure 3.7).
Almost a fourth of all interviewed consumers (22 %) live in couple households, which are mostly represented by 2 -person households (18 %) (Figure 3.7). Especially in Finland and France this type of household could be determined with over 30 % (Figure 3.6).
Over 14 % of all participants live in a single-/one-person household. Particularly in Sweden 27,6 % and in Finland 18,4 % of all households are single-households.
With only 3,5 % the multi-person non family household was mentioned least frequently (Figure 3.5). With the exception of Italy, in all European countries the share in this type of household is marginal and shows values between 0,8 % and 5,2 % (Figure 3.6). Because of possible misunderstandings of the notation of the different types of households is it necessary to take a look at the number of persons in the households too.

249
Figure 3.5: distribution: type of household (all households)
Figure 3.6: distribution: type of household (per country)

250
Figure 3.7: distribution: by type of household and person per household (all households)
The detailed analysis of the answers to the question how many people are living in the household results an average of 2,9 people per household. In comparison with the average household size published by UNECE10, for those countries investigated here, an average difference of -0,3 people per household could be calculated (Table 3.3). The highest number of people with more than 4 persons could be determined in nearly 20 % of the Spanish and Polish households in our survey (Figure 3.8). Also nearly 30 % of all Italian, Spanish, Czech and Polish interviewees stated that there are 4 persons in their households. Following the consumer survey analysis the most single households could be calculated with nearly 30 % for Sweden and with 20 % for Finnish households. For the other analysed European countries between 8 and 16 % of singles could be calculated (Figure 3.8 & Appendix 3.1-2).
10 The Statistical Yearbook of the Economic Commission for Europe 2003. Online:
http://www.unece.org/stats/trends/ch2/2.1.xls

251
Table 3.3: average household (countries of this survey) (source: UNECE (2004))
EUROSTAT Consumer survey Δ Average
household size (EUROSTAT – Consumer
survey)
Countries Average household size Year Average
household size Year
Czech Republic 2,7 1998 2,9 -0,2
Finland 2,1 2001 2,6 -0,5
France 2,4 2001 2,9 -0,5
Germany 2,2 2001 2,6 -0,4
Hungary 2,6 2001 3,0 -0,4
Italy 2,6 2001 3,1 -0,5
Poland 3,1 1995 3,2 -0,1
Spain 2,9 2001 3,3 -0,4
Sweden 2,9 2001 2,4 0,5
United Kingdom 2,3 2001 2,7
2006
-0,4
Figure 3.8: number of people in households (per country)
In nearly 38 % of all European households of our survey at least one person is younger than 18 years. Figure 3.9 shows that in 17 % of all households lives one and in nearly 14 % live two persons under this age, mostly in France (46 %), Hungary (44 %), Poland (42 %) and Italy (41 %).

252
Households with the least share of people under 18 years could be found in Czech Republic (29,6 %), Sweden (33,6 %) and Spain (32,4 %) (Appendix 3.1- 3).
Figure 3.9: number of people under an age of 18 years (per country) living in household
Stock of household appliances
A total of 10 044 household appliances exist in all interviewed households (n = 2 497). Refrigerators and washing machines were reported with an ownership of 100 %, because of the predefined quota. 69 % (n = 1 722) of all households possess an automatic dishwasher and over 35 % (n = 893) a tumble dryer.
From the group of cold appliances approximately 75 % (n = 1 871) of all households own an upright freezer and nearly a fourth of all households own a chest freezer (22,6 %; n = 564). 14.2 % (n = 355) of all interviewees even mentioned to have both (Figure 3.10).

253
Figure 3.10: equipment of household appliances in % (all households)
Nearly all Swedish household possess an upright freezer (99,2 %) but only 4 % a chest freezer. For British households (91,2 %) a high share of freezers can be mentioned also. Additionally 33 % of all British participants mentioned that they have a chest freezer too. Only Finnish households show a higher share of chest freezers with nearly 40 %. Concerning the equipment with freezers values between 71 and 78 percentages for the other countries were calculated with the exception of Polish and French households. Here only approximately 57 % possess a freezer. The share of chest freezers is also very low in Polish households and in Czech households in comparison with the other countries with nearly 9 % respectively 11 %.

254
Figure 3.11: equipment of household appliances in % (per country)
One fourth of couple and family households have a chest freezer and over 70 % an upright freezer (Figure 3.12). One person households only show an equipment level of 10 % of chest freezers. The reason might be not enough space or that this appliance is unnecessary.
Figure 3.12: equipment of household appliances by type of household
255
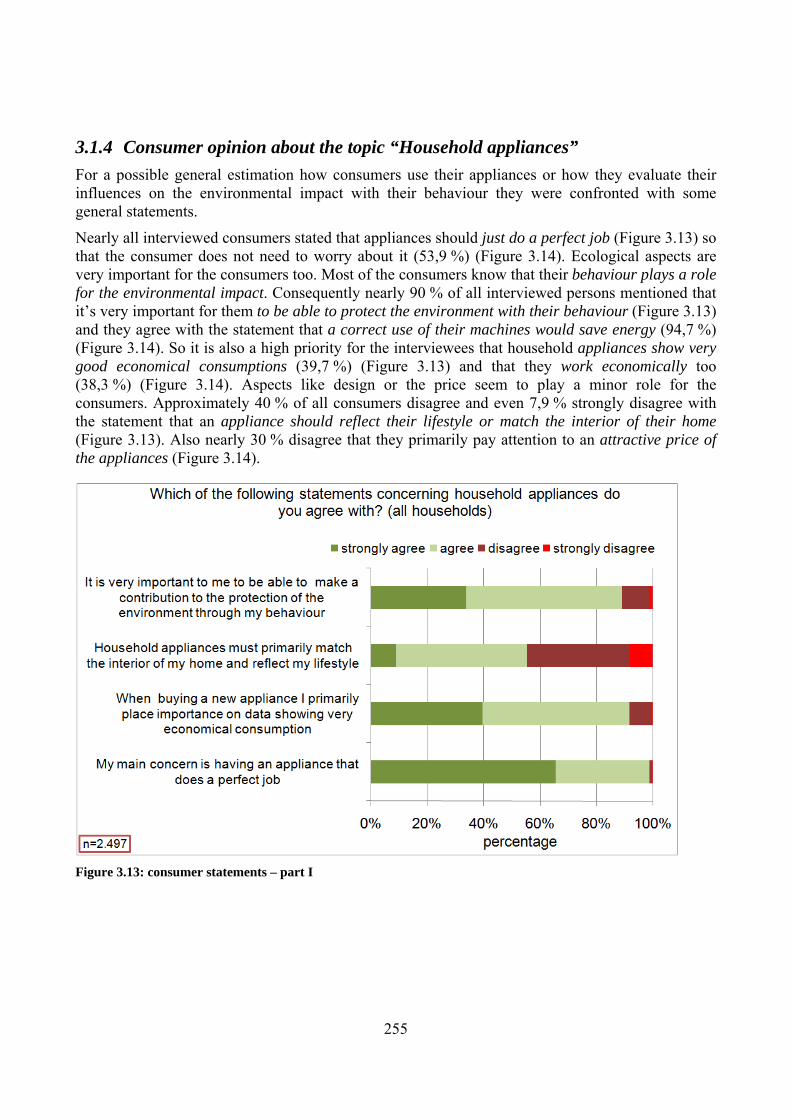
3.1.4 Consumer opinion about the topic “Household appliances” For a possible general estimation how consumers use their appliances or how they evaluate their influences on the environmental impact with their behaviour they were confronted with some general statements.
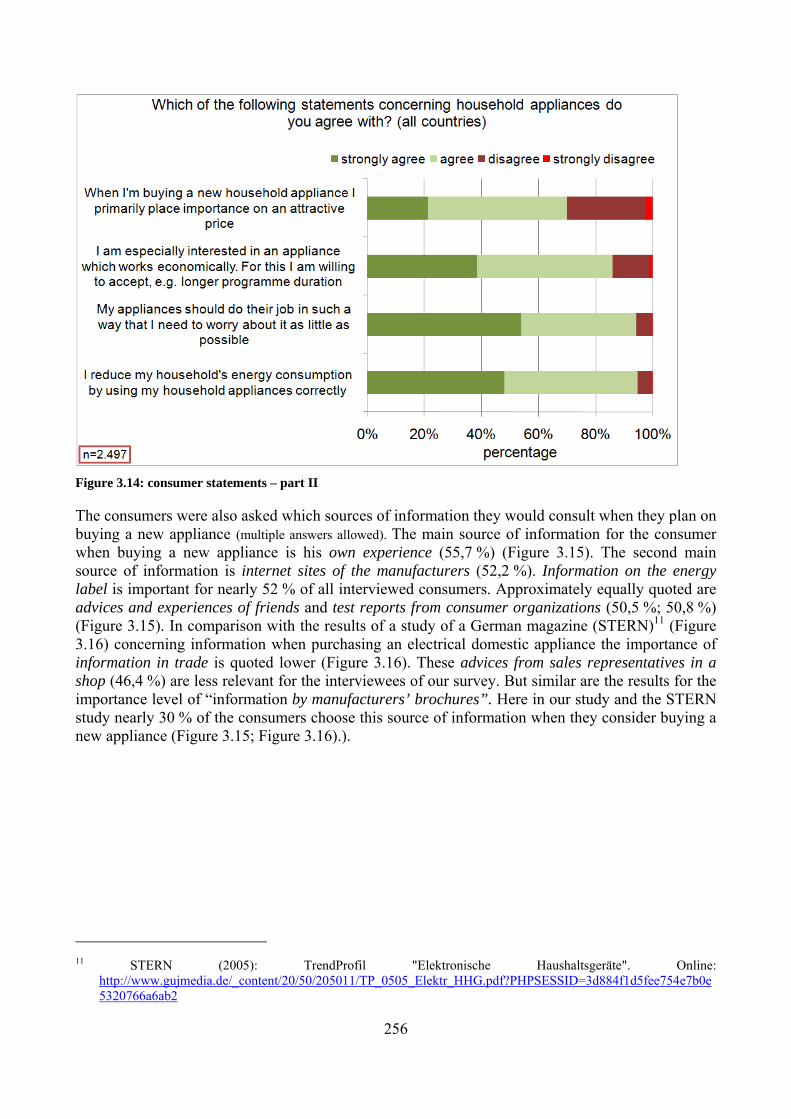
Nearly all interviewed consumers stated that appliances should just do a perfect job (Figure 3.13) so that the consumer does not need to worry about it (53,9 %) (Figure 3.14). Ecological aspects are very important for the consumers too. Most of the consumers know that their behaviour plays a role for the environmental impact. Consequently nearly 90 % of all interviewed persons mentioned that it’s very important for them to be able to protect the environment with their behaviour (Figure 3.13) and they agree with the statement that a correct use of their machines would save energy (94,7 %) (Figure 3.14). So it is also a high priority for the interviewees that household appliances show very good economical consumptions (39,7 %) (Figure 3.13) and that they work economically too (38,3 %) (Figure 3.14). Aspects like design or the price seem to play a minor role for the consumers. Approximately 40 % of all consumers disagree and even 7,9 % strongly disagree with the statement that an appliance should reflect their lifestyle or match the interior of their home (Figure 3.13). Also nearly 30 % disagree that they primarily pay attention to an attractive price of the appliances (Figure 3.14).
Figure 3.13: consumer statements – part I
256
Figure 3.14: consumer statements – part II
The consumers were also asked which sources of information they would consult when they plan on buying a new appliance (multiple answers allowed). The main source of information for the consumer when buying a new appliance is his own experience (55,7 %) (Figure 3.15). The second main source of information is internet sites of the manufacturers (52,2 %). Information on the energy label is important for nearly 52 % of all interviewed consumers. Approximately equally quoted are advices and experiences of friends and test reports from consumer organizations (50,5 %; 50,8 %) (Figure 3.15). In comparison with the results of a study of a German magazine (STERN)11 (Figure 3.16) concerning information when purchasing an electrical domestic appliance the importance of information in trade is quoted lower (Figure 3.16). These advices from sales representatives in a shop (46,4 %) are less relevant for the interviewees of our survey. But similar are the results for the importance level of “information by manufacturers’ brochures”. Here in our study and the STERN study nearly 30 % of the consumers choose this source of information when they consider buying a new appliance (Figure 3.15; Figure 3.16).).
11 STERN (2005): TrendProfil "Elektronische Haushaltsgeräte". Online:
http://www.gujmedia.de/_content/20/50/205011/TP_0505_Elektr_HHG.pdf?PHPSESSID=3d884f1d5fee754e7b0e5320766a6ab2

257
Figure 3.15: sources of information when purchasing a new appliance
Figure 3.16: results study STERN: sources of information when purchasing an electrical domestic appliance (STERN (2005)12
12 STERN (2005): TrendProfil "Elektronische Haushaltsgeräte". Online: http://www.gujmedia.de/_content/20/50/205011/TP_0505_Elektr_HHG.pdf?PHPSESSID=3d884f1d5fee754e7b0e5320
766a6ab2

258
For approximately 52 % of all participants of this survey information on the energy label is important for their buying decision (Figure 3.15). Within this survey the consumers were asked in more detail what information on the energy label they would expect (list of options was provided). For over 80 % the energy efficiency class and information about the water consumption are rated as very important (Figure 3.17). More than about 50 and 60 % of all interviewees mentioned and chose points which are already listed on the energy label today, like e.g. cleaning/washing performance (58,1 %), capacity (57,5 %), noise emission (55,4 %) or spin/drying performance (50,5 %). A bit lower in the reply quota information on the programme duration (45,2 %) is requested.
Referring to the energy consumption the consumer expects more information on the consumption per cycle per day (56,4 %) than on the annual consumption (34,1 %). Other detailed information on all programmes or features of the appliance or on programme and temperature used for the assessment are only wished by approximately 28 % of the consumers. Financial aspects like yearly or running cost (per cycle) are also requested by only about 32 % to 34 %.
Figure 3.17: energy label – expected information
A very low consumption of resources like water and/or energy is the most important aspect for the consumers when they plan on buying a new appliance (83,9 %) (Figure 3.18). Also for over 70 % of all interviewed persons a very good cleaning/washing performance has a high priority. More than half of all participants of this study pay attention to a low operating noise emission of the appliance. Accordingly a lot of consumers not only look at the purchase price of the machine (38,2 %) but also for a very good result on the energy label (36 %). More than one fourth of the consumers attend to a good dishes-/textile protection too. The other criteria like shorter programme duration, low detergent consumption or a large number of different programmes are only mentioned by between 15 and 18,5 % of the consumers. The least values are reached by a higher capacity (10,2 %) and an innovative aesthetic design (7,2 %).

259
Figure 3.18 : criteria when purchasing a new appliance

260
3.2 IDENTIFICATION OF POSSIBLE BARRIERS TO ECO DESIGN INNOVATIONS
After development it takes some time for new energy efficient appliances to penetrate the market. It depends on how often consumers buy new refrigerators/ freezers, this in turn is depended on the life time of the appliance, on repairs and the second-hand market. Another possible barrier for energy saving innovations for cold appliances is the necessity of food protection. The decrease of energy consumption can only go as far as food safety is ensured.
First available data on these subjects is presented followed by results of the conducted survey of consumers of the EU.
3.2.1 Life time of the appliances Consumers normally purchase an appliance and use it until it breaks before buying a new one. This implies that new refrigerator/ freezer models with innovative eco-designs only enter the households when an old appliance is replaced.
According to CECED13 the life time of refrigerators is 14 years and 17 years for freezers.
A study conducted by S.A.F.E.14 showed that 2 % of the participating households owned refrigerators manufactured between the years 1970 and 1979, 11 % owned appliances from the years 1980 to 1989, 37 % had refrigerators manufactured between 1990 and 1999, the remaining 50 % have appliances produced after 2000. The situation is similar for freezers. The same study showed that 2 % of the freezers owned were manufactured between 1970 and 1979, 15 % in the 1980s, 38 % were produced between 1990 and 1999 and 45 % after 2000.
MTP15 estimated the life times of different old appliances by using the stock model and optimising estimated sales data with actual sales (Table 3.4).
Table 3.4: assumed life span of different cold appliances (source: MTP15)
The consumer survey conducted for this study showed that more than 10 % of the main refrigerators in EU households are older than 10 years, with ages up to 25 years (Figure 3.19). Approximately 55 % of the appliances are less than 5 years old and therefore unlikely to be replaced in the near future.
13 CECED (2006): White Paper: Energy efficiency a shortcut to Kyoto targets. The vision of European home
appliance manufacturers, S.18 Online: http://www.ceced.org/IFEDE//easnet.dll/GetDoc?-APPL=1&DAT_IM=20429D&DWNLD=White Paper_Energy efficiency_Feb 2006_Final.pdf
14 S.A.F.E. SCHWEIZERISCHE AGENTUR FÜR ENERGIEEFFIZIENZ/ SWISS AGENCY FOR EFFICIENT ENERGY USE (2005): www.energy box.ch – Auswertung der Nutzerdatenbank, Online: http://www.energieeffizienz.ch-/files/auswertung_energybox.pdf
15 MTP MARKET TRANSFORMATION PROGRAMME (2006): BNC08: Assumptions underlying the energy projections for domestic cold appliances. Online: http://www.mtprog.com/ApprovedBriefingNotes/PDF-/MTP_BNC08_2006October31.pdf

261
Figure 3.19: cumulated age of the main refrigerators of all questioned households
A separated look at the average refrigerator ages in the different countries shows that they are similar. 50 % of the appliances are less than 3,5 to approx. 5 years old. 10 % of the cold appliances are older than 9 to 15 years (Figure 3.20). The average ages of main refrigerators in the different countries only differ by 1,7 years, the youngest being found in the UK (5,1 years), the oldest in Sweden and Finland with 6,8 years and 6,7 years, respectively (Figure 3.21).
Figure 3.20: cumulated age of the main refrigerators of all questioned households per country

262
Figure 3.21: average age of the main refrigerators of all questioned households per country
About 21 % of the participating households own a second refrigerator, particularly approximately 30 % of all Italian and Hungarian households (Figure 3.22).
Figure 3.22: share of second refrigerators in all questioned households
263
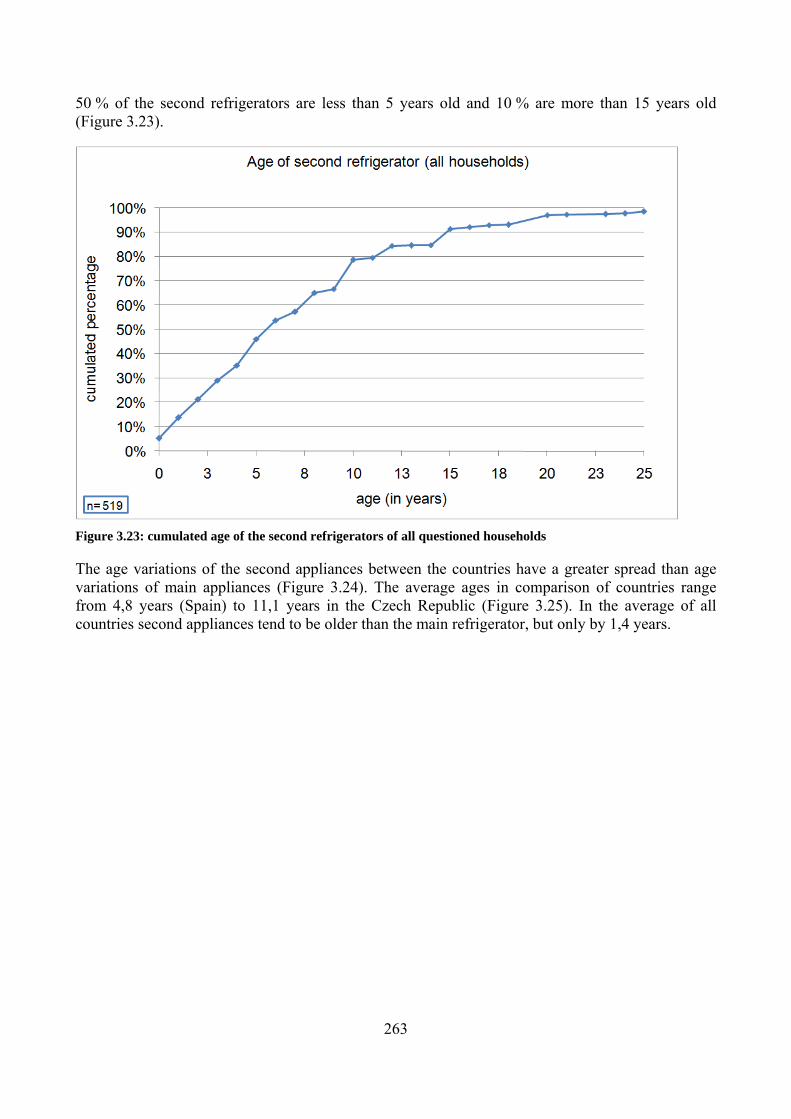
50 % of the second refrigerators are less than 5 years old and 10 % are more than 15 years old (Figure 3.23).
Figure 3.23: cumulated age of the second refrigerators of all questioned households
The age variations of the second appliances between the countries have a greater spread than age variations of main appliances (Figure 3.24). The average ages in comparison of countries range from 4,8 years (Spain) to 11,1 years in the Czech Republic (Figure 3.25). In the average of all countries second appliances tend to be older than the main refrigerator, but only by 1,4 years.

264
Figure 3.24: cumulated age of the second refrigerators of all questioned households per country
Figure 3.25: average age of the second refrigerators of all questioned households per country
Also the age of freezers was evaluated. The answers of all consumers which posses a chest freezer or upright freezer (n = 2 081) were analysed. The survey shows that 50 % of the freezers in all countries are younger than 5 years and 10 % older than approx. 15 years (Figure 3.26).

265
Figure 3.26: cumulated age of upright freezers/ chest freezers of all questioned households
A separated look at the average freezer ages in the different countries shows that they are very similar. 50 % of the appliances are less than 4 to approx. 6,5 years old. 10 % of the cold appliances are older than approx. 11 to 15 years (Figure 3.27).
Figure 3.27: cumulated age of upright freezers/ chest freezers of all questioned households per country
266
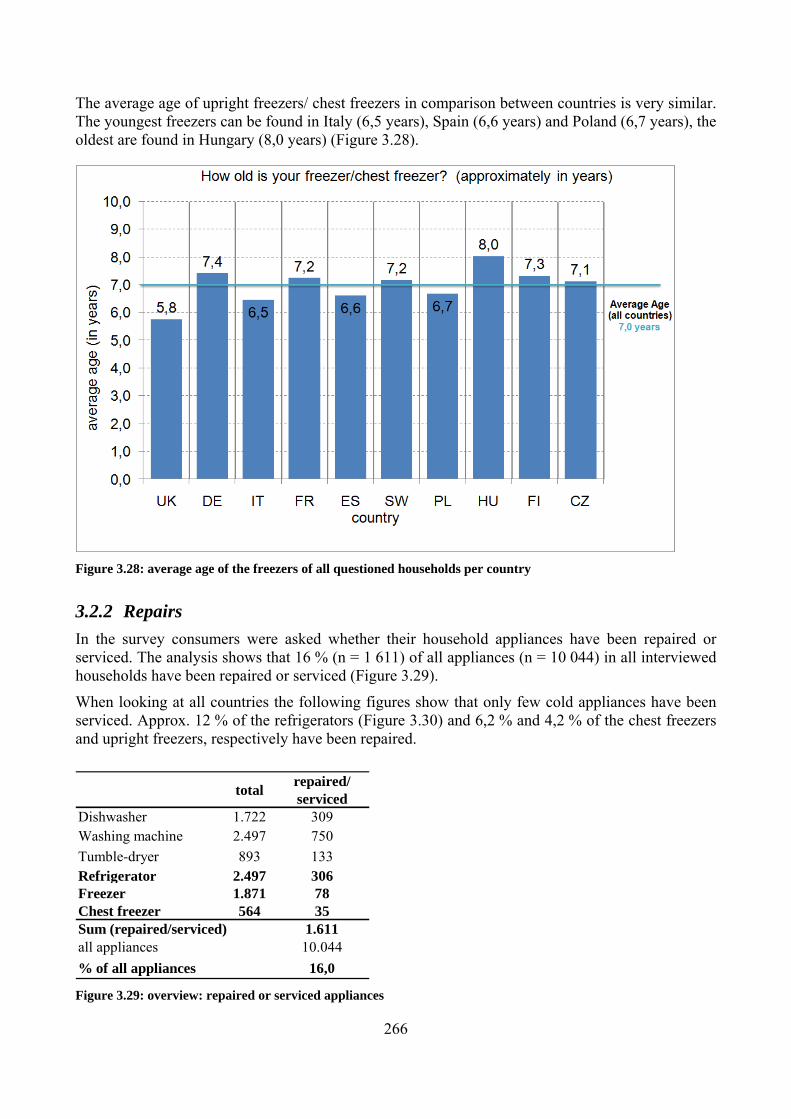
The average age of upright freezers/ chest freezers in comparison between countries is very similar. The youngest freezers can be found in Italy (6,5 years), Spain (6,6 years) and Poland (6,7 years), the oldest are found in Hungary (8,0 years) (Figure 3.28).
Figure 3.28: average age of the freezers of all questioned households per country
3.2.2 Repairs In the survey consumers were asked whether their household appliances have been repaired or serviced. The analysis shows that 16 % (n = 1 611) of all appliances (n = 10 044) in all interviewed households have been repaired or serviced (Figure 3.29).
When looking at all countries the following figures show that only few cold appliances have been serviced. Approx. 12 % of the refrigerators (Figure 3.30) and 6,2 % and 4,2 % of the chest freezers and upright freezers, respectively have been repaired.
total repaired/ serviced
Dishwasher 1.722 309Washing machine 2.497 750Tumble-dryer 893 133Refrigerator 2.497 306Freezer 1.871 78Chest freezer 564 35
1.611all appliances 10.044% of all appliances 16,0
Sum (repaired/serviced)
Figure 3.29: overview: repaired or serviced appliances

267
Figure 3.30: repaired or serviced appliances – cold appliances
Between 15 % and 20 % of refrigerators in Italy, Spain, Hungary and the Czech Republic have been repaired or serviced. The least share of appliances which have been repaired or serviced are determined in Germany and the UK followed by Sweden with less than or little more than 5 % (Figure 3.31).
Figure 3.31: cold appliances repaired or serviced per country

268
The average age of repaired or serviced refrigerators in Europe is 7,5 years. 50 % of these appliances are younger than 5,5 years and 90 % are younger than 15 years (Figure 3.32).
Figure 3.32 : age of repaired or serviced refrigerators in all households (EU)
The average age of repaired or serviced freezers in Europe is 8,5 years. 50 % of these appliances are younger than 6 years and 90 % are younger than 15 years (Figure 3.33).
Figure 3.33: age of repaired or serviced freezers (chest/upright freezer) in all households (EU)

269
3.2.3 Second-hand market
Another possible barrier for the implementation of eco-design innovations is the stock of second-hand purchased appliances in households. Often consumers choose to replace broken or missing apparatuses by second-hand appliances. These are often older refrigerators/freezers with worse performances in comparison with new appliances on the market.
It is also possible that there is an existent kitchen with refrigerator/ freezer in the new apartment/ house when moving.
30 % of the questioned households in the study by LEPTHIEN16 had a kitchen including a refrigerator already installed when they moved into their apartment/ house.
The survey shows that refrigerators are the appliances least frequently purchased second-hand of those evaluated. Only 4,9 % of the purchased refrigerators were pre-owned (Figure 3.35).
total second handDishwasher 1.722 114Washing machine 2.497 140Tumble-dryer 893 59Refrigerator 2.497 122Freezer 1.871 118Chest freezer 564 80Sum (second hand) 633all appliances 10.044% of all appliances 6,3 Figure 3.34: overview: second hand appliances
16 LEPTHIEN K. (2000): Umweltschonende Nutzung des Kühlgerätes im privaten Haushalt, Bonn, Rheinische Friedrich-
Wilhelms-Universität, Diss. oec.troph

270
Figure 3.35: appliances purchased second-hand
Chest freezers are the appliances most frequently purchased second-hand 14,2 %. 6,3 % of all freezers were previously owned before purchase (Figure 3.35).
When comparing countries it can be seen that chest freezers are most often bought second-hand in the Czech Republic, with 25 % of the appliances, and the UK, with more than 20 %. In Sweden none of the chest freezers are purchased second-hand. Upright freezers are most often bought pre-owned in Finland and Germany (more than 10 %), and least frequently in Italy. German households are the ones with the most second-hand refrigerators (approx. 9 %) followed by Finnish and British households (Figure 3.36).

271
Figure 3.36: cold appliances purchased second-hand per country
The average age of second-hand main refrigerators is 7 years. 50 % of the appliances are younger than 5 years, 90 % are younger than 13 years (Figure 3.37).
Figure 3.37: age of „second-hand“ main refrigerators in all households (EU)
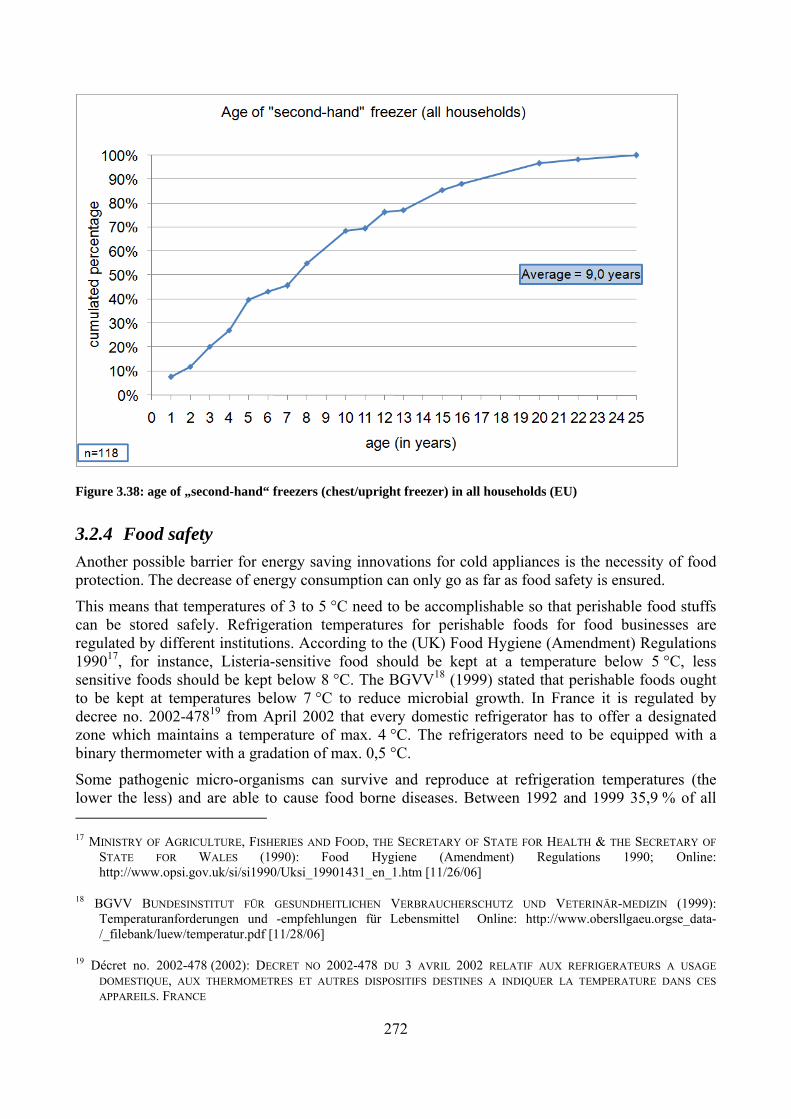
The average age of second-hand freezers is 9 years. 50 % of the appliances are younger than 7,5 years, 90 % are younger than 17 years (Figure 3.38).
272
Figure 3.38: age of „second-hand“ freezers (chest/upright freezer) in all households (EU)
3.2.4 Food safety Another possible barrier for energy saving innovations for cold appliances is the necessity of food protection. The decrease of energy consumption can only go as far as food safety is ensured.
This means that temperatures of 3 to 5 °C need to be accomplishable so that perishable food stuffs can be stored safely. Refrigeration temperatures for perishable foods for food businesses are regulated by different institutions. According to the (UK) Food Hygiene (Amendment) Regulations 199017, for instance, Listeria-sensitive food should be kept at a temperature below 5 °C, less sensitive foods should be kept below 8 °C. The BGVV18 (1999) stated that perishable foods ought to be kept at temperatures below 7 °C to reduce microbial growth. In France it is regulated by decree no. 2002-47819 from April 2002 that every domestic refrigerator has to offer a designated zone which maintains a temperature of max. 4 °C. The refrigerators need to be equipped with a binary thermometer with a gradation of max. 0,5 °C.
Some pathogenic micro-organisms can survive and reproduce at refrigeration temperatures (the lower the less) and are able to cause food borne diseases. Between 1992 and 1999 35,9 % of all 17 MINISTRY OF AGRICULTURE, FISHERIES AND FOOD, THE SECRETARY OF STATE FOR HEALTH & THE SECRETARY OF
STATE FOR WALES (1990): Food Hygiene (Amendment) Regulations 1990; Online: http://www.opsi.gov.uk/si/si1990/Uksi_19901431_en_1.htm [11/26/06]
18 BGVV BUNDESINSTITUT FÜR GESUNDHEITLICHEN VERBRAUCHERSCHUTZ UND VETERINÄR-MEDIZIN (1999): Temperaturanforderungen und -empfehlungen für Lebensmittel Online: http://www.obersllgaeu.orgse_data-/_filebank/luew/temperatur.pdf [11/28/06]
19 Décret no. 2002-478 (2002): DECRET NO 2002-478 DU 3 AVRIL 2002 RELATIF AUX REFRIGERATEURS A USAGE DOMESTIQUE, AUX THERMOMETRES ET AUTRES DISPOSITIFS DESTINES A INDIQUER LA TEMPERATURE DANS CES APPAREILS. FRANCE

273
registered intoxications were linked to consumption of contaminated food at home20. The WHO Surveillance programme for Germany evaluated the treatment of food which had been the cause of infection. It was found that in 1999 and 2000 the most frequently indicated treatment of the food was wrong storage in the refrigerator with 13 % and 23 %, respectively21.
According to the WHO inadequate temperatures were the cause for 44 % of food borne diseases in Europe. This includes insufficient cooling22.
3.3 USER DEFINED PARAMETERS
3.3.1 Consumer behaviour in terms of energy consumption and saving a) Refrigerator
Different institutions have dealt with the questions of how consumer behaviour with refrigerators influences energy consumption and how to alter this behaviour to save energy.
Consumer organisations give information on this matter through their consumer magazines. In Germany these are, i.e. STIFTUNG WARENTEST, ÖKOTEST and the AGV (Arbeitsgemeinschaft Verbraucherverbände e.V.). In the USA this is, i.e. the US DEPARTMENT OF ENERGY, and in Canada the MINISTRY OF ENERGY. Different Universities also research this matter, i.e. the University of Bonn, Germany, the Mississippi State University and University of Florida, USA.
The factors said to influence the energy consumption of a refrigerator are:
• interior temperature of the refrigerator • room temperature • loading of refrigerator/ insertion of goods • door openings • location near a heat source • possibility of ventilation • condition of gasket seals
Refrigerator temperature The interior temperature has a great influence on the energy consumption of the refrigerator. According to BÖHMER & WICKE23 (1998) a 13 % reduction of energy consumption is possible by
20 Kraemer J. (2002): Lebensmittelmikrobiologie, Verlag Eugen Ulmer, Stuttgart
21 WHO Surveillance Programme for Control of Foodborne Infections and Intoxications in Europe 8th Report 1999-2000 Country Reports: Germany, Online: http://www.bfr.bund.de/internet/8threport/CRs/deu.pdf
22 WHO (2004): Food and health in Europe: a new basis for action, WHO Regional Publications, European Series, No. 96
23 BÖHMER T. & WICKE L. (1998): Energiesparen im Haushalt – So schonen Sie Umwelt und Geldbeutel, Deutscher Taschenbuch Verlag

274
keeping the interior temperature at 7 °C instead of 5 °C. LEPTHIEN24 (2000) showed that by increasing the refrigerator temperature from 5 °C to 7-7,5 °C energy use can be reduced up to 28 %.
Different European studies25, 26, 27 show that the mean interior temperature of refrigerators lies between 6 and 7 °C. A study in New Zealand28 evaluated a mean temperature of 4,5 °C and a study in Malaysia29 found a mean temperature of 2 °C (Figure 3.39).
Figure 3.39: mean refrigerator temperature evaluated in different studies
According to JAMES & EVANS30 (1992a) 32,8 % of the 252 study participants adjust their refrigerator temperature according to the weather, lowering the temperature in summer. A survey31
24 LEPTHIEN K. (2000): Umweltschonende Nutzung des Kühlgerätes im privaten Haushalt, Bonn, Rheinische Friedrich-
Wilhelms-Universität, Diss. oec.troph
25 FLYNN O.M.J., BLAIR I. & MCDOWELL D. (1992): The efficiency and consumer operation of domestic refrigerators, Int. J. Refrig. 15, 307-312
26 JAMES S.J. & EVANS J. (1992a): Consumer handling of chilled foods: Temperature performance, Int. J. Refrig. 15, 299-306
27 LAGUERRE O., DERENS E. & PALAGOS B. (2002): Study of domestic refrigerator temperature and analysis of factors affecting temperature: a French survey, Int. J. Refrig. 25, 653-659
28 O’BRIEN G.D. (1997): Domestic refrigerator air temperatures and the public’s awareness of refrigerator use, Int. J. Environ. Health Res. 7, 141-148
29 RAHMAN S., MOHD SIDIK N., HASSAN M.H.J., MOHD ROM T. & JAUHARI I. (2005): Temperature Performance and Usage Conditions of Domestic Refrigerator-freezers in Malaysia, Transactions 12, 30-35
30 JAMES S.J. & EVANS J. (1992a): Consumer handling of chilled foods: Temperature performance, Int. J. Refrig. 15, 299-306

275
in the UK showed that 50 % of the 1 093 questioned people adjust their refrigerators according to ambient temperature, whereas 35 % never alter the setting.
Adequate temperature for food preservation In France it is regulated by decree no. 2002-47832 from April 2002 that every domestic refrigerator has to offer a designated zone which maintains a temperature of max. 4 °C. The refrigerators need to be equipped with a binary thermometer with a gradation of max. 0,5.
BEM & HECHELMANN33 (1994) as well as KREYENSCHMIDT34 (2003) show that the shelf life of poultry is highly reduced when kept at higher temperatures. When stored at 4 °C the quality of the meat samples was still acceptable after approx. 5-6 days whereas the same state of quality was reached after as little as 2-3 days at storage temperatures of 10 °C. According to ALMONACID-MERINO & TORRESE35 (1993) shelf-life of foods can be reduced significantly (20-30 %) when stored at room temperature even when this period is only a small fraction of total storage time (2-3 %). GILL36 (1986) reported that microbial growth is bisected when temperature is reduced by 10 °C.
Room temperature Room temperature also influences the energy use of refrigerators.
The HESSIAN MINISTRY OF ECONOMY, TRANSPORT, URBAN AND REGIONAL DEVELOPMENT37 (HMWVL 2005) stated that keeping a room temperature of 21-23 °C instead of 25 °C can save 16 % of energy use. As reported there a room temperature of 17-21 °C can save 32 % and a temperature of 13-17 °C can save 53 % of energy use. STIFTUNG WARENTEST38 (1994) indicates a reduced energy consumption of 47 % when the refrigerator is located in a room with a temperature of 16 °C instead of 25 °C whereas a higher temperature of 32 °C instead of 25 °C increases energy use by 55 %. According to PEART39 (1993) setting the house thermostat at approx. 18 °C in winter instead of 21 °C would save 12 kWh/ year. The Study of LEPTHIEN40 (2000) shows that refrigerators use 18 to 19 % less energy in a room which has a temperature of 20 °C instead of 25 °C. According
31 SPRIEGEL G. (1991): Food Safety in the Home, Nutr. Food. Sci. 133, 14-1 32 Décret no. 2002-478 (2002): DECRET NO 2002-478 DU 3 AVRIL 2002 RELATIF AUX REFRIGERATEURS A USAGE
DOMESTIQUE, AUX THERMOMETRES ET AUTRES DISPOSITIFS DESTINES A INDIQUER LA TEMPERATURE DANS CES APPAREILS. FRANCE
33 BEM Z. & HECHELMANN H. (1994): Kühlung und Kühllagerung von Fleisch – Mikrobiologische Vorgänge, Fleischwirtschaft 74, 916-924
34 KREYENSCHMIDT J. (2003): Modellierung des Frischeverlustes von Fleisch sowie des Entfärbeprozesses von Temperatur-Zeit-Integratoren zur Festlegung von Anforderungsprofilen für die produktbegleitende Temperaturüberwachung, Diss. Universität Bonn, Agrimedia Verlag, Bergen Dumme
35 ALMONACID-MERINO S.F. & TORRESE J.A. (1993): Mathematical models to evaluate temperature abuse effects during distribution of refrigerated solid foods, J. Food. Eng. 20, 223- 245
36 GILL C.O. (1986) The Control of Microbial Spoilage in Fresh Meats, In: Pearson A.M., T.R. (eds.): Advances in Meat Research – Meat and Poultry Microbiology, Macmillian Publishers LTD, 49-88
37 HMWVL HESSISCHES MINISTERIUM FÜR WIRTSCHAFT, VERKEHR UND LANDESENTWICKLUNG (Hrsg.) (2005): Strom effizient nutzen – Wegweiser für Privathaushalte zur wirtschaftlichen Stromeinsparung ohne Komfortverzicht
38 STIFTUNG WARENTEST (1994): Umwelt geschont – Strom gespart, In: Test 3, 36-39 39 PEART V. (1993): The Refrigerator Energy Use Story, EES 51, Florida Cooperative Extension Service, Institute of
Food and Agricultural Sciences, University of Florida 40 LEPTHIEN K. (2000): Umweltschonende Nutzung des Kühlgerätes im privaten Haushalt, Bonn, Rheinische Friedrich-
Wilhelms-Universität, Diss. oec.troph

276
to BÖHMER & WICKE41 (1998) a reduction of the kitchen temperature of 1 °C decreases the energy consumption by 8 % (Figure 3.40).
When reducing the surrounding temperature of a refrigerator-freezer it is important to know whether the appliance has two compressors or one compressor with a magnet valve controlling two separate circulations. If this is not the case, the compressor will stop cooling when the surrounding temperature is below about 16 °C and the freezing compartment will defrost. Some appliances have a so called “winter switch” with causes the refrigerator light to burn even with closed door to heat up the refrigerator compartment. This energy input into the cooling compartment will cause the compressor to start again, keeping the freezer compartment cold. This mechanism increases energy consumption42, 43.
JAMES & EVANS44 (1992a) found that 72,2 % of the 252 surveyed kitchens had an ambient temperature between 17 and 23 °C (mean 20,6 °C).
Figure 3.40: possible energy decrease after reduction of room temperature as evaluated in different studies
41 BÖHMER T. & WICKE L. (1998): Energiesparen im Haushalt – So schonen Sie Umwelt und Geldbeutel, Deutscher
Taschenbuch Verlag 42 PLATZ B. (2007): Kühlgefrierkombinationen - heimlich brennt das Licht, broadcast from 03.02.2007 17:03 Uhr (NDR) http://daserste.ndr.de/ardratgebertechnik/archiv/haushalt_garten/t_cid-3646502_.html [02/20/2007] 43 NIPKOW J. (2002): Klimaklassen von Haushalt-Kühl-/Gefriergeräten, S.A.F.E Schweizerische Agentur für
Energieeffizienz/ Swiss agency for efficient energy use (www.energieeffizienz.ch) 44 JAMES S.J. & EVANS J. (1992a): Consumer handling of chilled foods: Temperature performance, Int. J. Refrig. 15,
299-306

277
Insertion of goods
The insertion and storage of hot or cold goods in the refrigerator is also reported as having influence on the energy consumption of the refrigerator. BÖHMER & WICKE45 (1998) stated that the insertion of food or storage containers into the refrigerator uses 10 % of the energy consumption. Bisecting the insertion can only save 5 % of energy use. On the other hand a lot of energy can be wasted by setting hot goods into the refrigerator. Cooling of food with a temperature of 50 °C uses thrice the energy than cooling of food with a temperature of 20 °C. LEPTHIEN46 (2000) found that thawing frozen food in the refrigerator can reduce energy consumption up to 26 %. Thawing of frozen foods inside the refrigerator also protects food from getting to warm and from increased bacterial growth47.
A Study in New Zealand48 shows that 48 % of the 50 questioned people rarely and 30 % never place hot foods into the refrigerator and that 70 % always cool their foods adequately before placing them into the refrigerator.
Door openings
Consumer information given by Ministries or Universities advises people to open the refrigerator door as infrequently as possible. According to PEART49 (1993) forty door openings per day can add 50 to 120 kWh per year to the energy bill. GRAHAM50 (1997) gives advice to install vinyl flaps to the refrigerator to keep cool air from escaping to save up to 10-20 % of energy use. BÖHMER & WICKE51 (1998) report that losses through air change make up 3 % of the total energy consumption of a refrigerator. The study by LEPTHIEN52 (2000) showed that 20 door openings per day generate an increase of energy consumption of 1 to 6 %. According to LIU et al.53 (2004) 50 five second door openings within 10 hours generate an increase in energy consumption of 5-10 % at an ambient temperature of 15 °C. JAMES & EVANS54 (1992b) evaluated the effect of door openings on the refrigerator temperature and found that after a 3-minute door opening it took one hour to reduce the temperature within 1 °C of the original temperature.
45 BÖHMER T. & WICKE L. (1998): Energiesparen im Haushalt – So schonen Sie Umwelt und Geldbeutel, Deutscher
Taschenbuch Verlag 46 LEPTHIEN K. (2000): Umweltschonende Nutzung des Kühlgerätes im privaten Haushalt, Bonn, Rheinische Friedrich-
Wilhelms-Universität, Diss. oec.troph 47 SØRENSEN L.B.: Frozen Food Legilation, Bulletin of the IIR, No 2002-4 48 O’BRIEN G.D. (1997): Domestic refrigerator air temperatures and the public’s awareness of refrigerator use, Int. J.
Environ. Health Res. 7, 141-148 49 PEART V. (1993): The Refrigerator Energy Use Story, EES 51, Florida Cooperative Extension Service, Institute of
Food and Agricultural Sciences, University of Florida 50 GRAHAM F. (1997): Refrigerators & Freezers, Mississippi State University Extension Service, Online:
http://msucares.com/newsletters/housing/19970411.html (last modified 31-Aug-01) [11/03/2006]
51 BÖHMER T. & WICKE L. (1998): Energiesparen im Haushalt – So schonen Sie Umwelt und Geldbeutel, Deutscher Taschenbuch Verlag
52 LEPTHIEN K. (2000): Umweltschonende Nutzung des Kühlgerätes im privaten Haushalt, Bonn, Rheinische Friedrich-Wilhelms-Universität, Diss. oec.troph
53 LIU D.-Y., CHANG W.-R. & LIN J.-Y. (2004): Performance comparison with effect of door opening on variable and fixed frequency refrigerator/freezers, Appl. Therm. Eng. 24, 2281-2292
54 JAMES S.J. & EVANS J. (1992b): The temperature performance of domestic refrigerators, Int. J. Refrig. 15, 313-319

278
LIU et al.53(2004) also evaluated the effect of door openings of the freezer compartment on the energy consumption of refrigerator-freezers with an ambient temperature of 30 °C. Depending on the model 15 door openings within 10 hours increase the energy consumption by 0,5-4 %.
According to the study by LAGUERRE et al.55 (2002) 19 % of the 143 questioned people open their refrigerator less than 10 times a day, 43 % open the refrigerator 10 to 20 times a day and 38 % open it more than 20 times. A study in Malaysia56 found that 8 % of 26 questioned households open their refrigerator less than 10 times a day, 73 % 10 to 20 times a day and 19 % open the refrigerator more than 20 times a day (Figure 3.41).
Figure 3.41: frequency of door openings per day as evaluated in two studies
Location
Another common advice is not to set the refrigerator next to a heat source, like an oven, dishwashing machine etc. or into direct sunlight57, 58, 59. LEPTHIEN60 (2000) evaluated the effect of an oven next to the refrigerator on the energy consumption. It was found that the increase in energy use was very little (approx. 1 %).
55 LAGUERRE O., DERENS E. & PALAGOS B. (2002): Study of domestic refrigerator temperature and analysis of factors
affecting temperature: a French survey, Int. J. Refrig. 25, 653-659 56 RAHMAN S., MOHD SIDIK N., HASSAN M.H.J., MOHD ROM T. & JAUHARI I. (2005): Temperature Performance and
Usage Conditions of Domestic Refrigerator-freezers in Malaysia, Transactions 12, 30-35 57 PEART V. (1993): The Refrigerator Energy Use Story, EES 51, Florida Cooperative Extension Service, Institute of
Food and Agricultural Sciences, University of Florida 58 BÖHMER T. & WICKE L. (1998): Energiesparen im Haushalt – So schonen Sie Umwelt und Geldbeutel, Deutscher
Taschenbuch Verlag 59 HMWVL HESSISCHES MINISTERIUM FÜR WIRTSCHAFT, VERKEHR UND LANDESENTWICKLUNG (Hrsg.) (2005): Strom
effizient nutzen – Wegweiser für Privathaushalte zur wirtschaftlichen Stromeinsparung ohne Komfortverzicht 60 LEPTHIEN K. (2000): Umweltschonende Nutzung des Kühlgerätes im privaten Haushalt, Bonn, Rheinische Friedrich-
Wilhelms-Universität, Diss. oec.troph

279
JAMES & EVANS61 (1992a) evaluated how frequently the refrigerator is placed near a heat source. Results are that in 25,5 % of the 252 surveyed households the refrigerator had potential heat sources on one side and in 1,2 % a potential heat source on both sides. 13,6 % of the refrigerators were free standing and 59,8 % were located away from heat sources but had a kitchen unit or wall on either one or both sides. In France62 30 % of the 143 questioned households had a refrigerator located near a heat source and 14 % were built-in. RAHMAN et al.63 (2005) found that 77 % of the surveyed refrigerators were positioned near a heat source (oven, rice cooker, microwave, kettle, etc.) and 23 % were standing away from a heat source.
There is not much literature on the availability of space for ventilation so the heat can be transported away from the back of the refrigerator. LEPTHIEN64 (2000) found that a complete inhibition of air circulation did not alter the energy consumption although the temperature between the condenser and the wall increased 3 to 5 °C. O’BRIEN65 (1997) found that 62 % of the 50 households questioned had inadequate space around the refrigerator, accordingly 38 % left adequate space.
Condition of gasket seals
The condition of gasket seals is another characteristic which is pointed out to consumers66, 67, 68, 69. Heat losses of refrigerators depend – amongst others – on the quality of the door seals70.
JAMES & EVANS71 (1992a) found that 60 % of the refrigerator door seals in the 252 observed households were in excellent or good shape while 10 % were described as poor (torn and perished).
Consumer attitudes towards buying an energy saving refrigerator model
61 JAMES S.J. & EVANS J. (1992a): Consumer handling of chilled foods: Temperature performance, Int. J. Refrig. 15,
299-306 62 LAGUERRE O., DERENS E. & PALAGOS B. (2002): Study of domestic refrigerator temperature and analysis of factors
affecting temperature: a French survey, Int. J. Refrig. 25, 653-659 63 RAHMAN S., MOHD SIDIK N., HASSAN M.H.J., MOHD ROM T. & JAUHARI I. (2005): Temperature Performance and
Usage Conditions of Domestic Refrigerator-freezers in Malaysia, Transactions 12, 30-35 64 LEPTHIEN K. (2000): Umweltschonende Nutzung des Kühlgerätes im privaten Haushalt, Bonn, Rheinische Friedrich-
Wilhelms-Universität, Diss. oec.troph 65 O’BRIEN G.D. (1997): Domestic refrigerator air temperatures and the public’s awareness of refrigerator use, Int. J.
Environ. Health Res. 7, 141-148 66 PEART V. (1993): The Refrigerator Energy Use Story, EES 51, Florida Cooperative Extension Service, Institute of
Food and Agricultural Sciences, University of Florida 67 KNIGHT P.A. (1996): Your energy savings – a resident’s handbook – Midwest edition, sponsored by U.S. Department
of Energy, Illinois, Department of Commerce and Community Affairs, Chicago Rehab Network, Bickerdike Redevelopment Corporation, ComEd, and Argonne National Laboratory.
68 GRAHAM F. (1997): Refrigerators & Freezers, Mississippi State University Extension Service, Online: http://msucares.com/newsletters/housing/19970411.html (last modified 31-Aug-01) [11/03/2006]
69 ONTARIO MINISTRY OF ENERGY (2006): Refrigerator, Online: http://www.energy.gov.on.ca-/index.cfm?fuseaction=conservation.tips_refrigerator (© 2006) [11/03/2006]
70 COLD II – The revision of energy labelling and minimum energy efficiency standards for domestic refrigeration appliances – FINAL REPORT 2000
71 JAMES S.J. & EVANS J. (1992a): Consumer handling of chilled foods: Temperature performance, Int. J. Refrig. 15, 299-306

280
A survey72 of 1 000 Italian and 1 000 German consumers showed that 84 % of Italians and 63 % of Germans preferred a refrigerator with energy class A rather that class C, 8 % of Italian respondents and 21 % of German respondents indicated they did not. According to this evaluation between 76 and 80 % of the Italian consumers and 53 - 56 % of German consumers were interested in buying an energy efficient refrigerator for a higher purchasing price when this meant that they could save on the electricity bill.
LEPTHIEN73 (2000) asked 100 people whether energy consumption and environmental compatibility of a refrigerator were important to them when buying a new appliance. This was considered very important to 58 % and 54 %, respectively.
Summary/ conclusion
Studies and literature show that a change of behaviour can help decrease energy consumption of cold appliances. From what has been found, the following recommendations can be given to consumers for energy saving purposes:
• Increasing of interior temperature of the refrigerator to approximately 7 °C, if no perishable food is stored,
• Place the refrigerator in a room of 20 °C temperature (or lower where applicable), • Cooling of prepared food to room temperature before placing into refrigerator, • Defrosting frozen food inside the refrigerator, • Replacement of old by new and more efficient refrigerator or freezer, • Selection of a refrigerator/freezer unit with two compressors or one compressor with a magnet
valve controlling two separate circulations, • Exchanging loose or torn gaskets to ensure leak-proof closing of the door.
Advising consumers to open the refrigerator door less frequently or to relocate the appliance further away from potential heat sources does not seem necessary because the influence of these factors is little.
b) Freezer
Because there is not much literature available dealing with the consumer behaviour with freezers in terms of energy consumption, it can only be assumed that consumers handle their freezers in a similar manner as their refrigerators.
72 COLD II – The revision of energy labelling and minimum energy efficiency standards for domestic refrigeration
appliances – FINAL REPORT 2000 73 LEPTHIEN K. (2000): Umweltschonende Nutzung des Kühlgerätes im privaten Haushalt, Bonn, Rheinische Friedrich-
Wilhelms-Universität, Diss. oec.troph

281
3.3.2 Results of the consumer survey a) Refrigerator
An important role for the performance and energy consumption of a refrigerator plays the ambient temperature of the room where the appliance stands. Accordingly the participating household of the consumer survey in 10 European countries were asked what the minimum and maximum temperatures are of the room where the refrigerator is placed. The analysis of the answers of all households (n = 2 497) shows that the average maximum temperature is 24,4 °C (Figure 3.42). In approximately 30% of all households the maximum room temperatures is between 20 and 23 °C, especially in Germany more than 65 % of all consumers answered that the ambient temperature reached maximal 23 °C, and additional 24 % less than 31 °C. But in some countries like in Spain (10,8 %) or in Italy (6,0 %) the ambient room temperature in the room where the refrigerator stands reached values of over 36 °C (Figure 3.42).
The average minimum ambient temperature is 14,6 °C (Figure 3.43).
Approximately 44 % of all households have minimum temperatures in the room where the refrigerator stands of between 16°C - 19°C. In United Kingdom and Spain between 40 % up to over 50 % of all households have an ambient room temperature of under 11 °C and even in some countries like UK, Germany, Italy or Spain over 20 % of the consumers answered that the minimum ambient temperature lies at less than 7 °C.
Especially Italian, Spanish and Hungarian households presented the highest temperatures which also had the lowest temperatures (Figure 3.42). Interesting are also the results of northern countries. Here e.g. in Finnish and Swedish households the minimum temperature is higher in comparison with the other countries while these countries have the coldest maximum temperatures (Figure 3.42).
Figure 3.42: refrigerator: maximum ambient room temperature per countries

282
Figure 3.43: refrigerator: minimum ambient room temperature per countries
When the results of the data/statements of maximum and minimum ambient room temperatures are set in contrast with each other an average room temperature in all households of 19,5 °C can be calculated (Figure 3.44).
Furthermore a total of 49,7 % of all consumers said that they have a minimum respectively maximum room temperature of 15 °C or lower (Figure 3.44). Actually in 23,5 % of all households temperatures of 11 °C or lower are reached. On the other hand in 3,6 % of all interviewed households the room temperature lies at 36 °C or higher (Figure 3.44).
More than 40 % of all households mentioned a minimum temperature between 16 and 19 °C and over 30 % a maximum temperature of between 20 and 23 °C. But although a high share of consumers (28,6 %) answered that the maximum temperature of the room where the refrigerator stands reached more than 24 °C up to 27 °C.
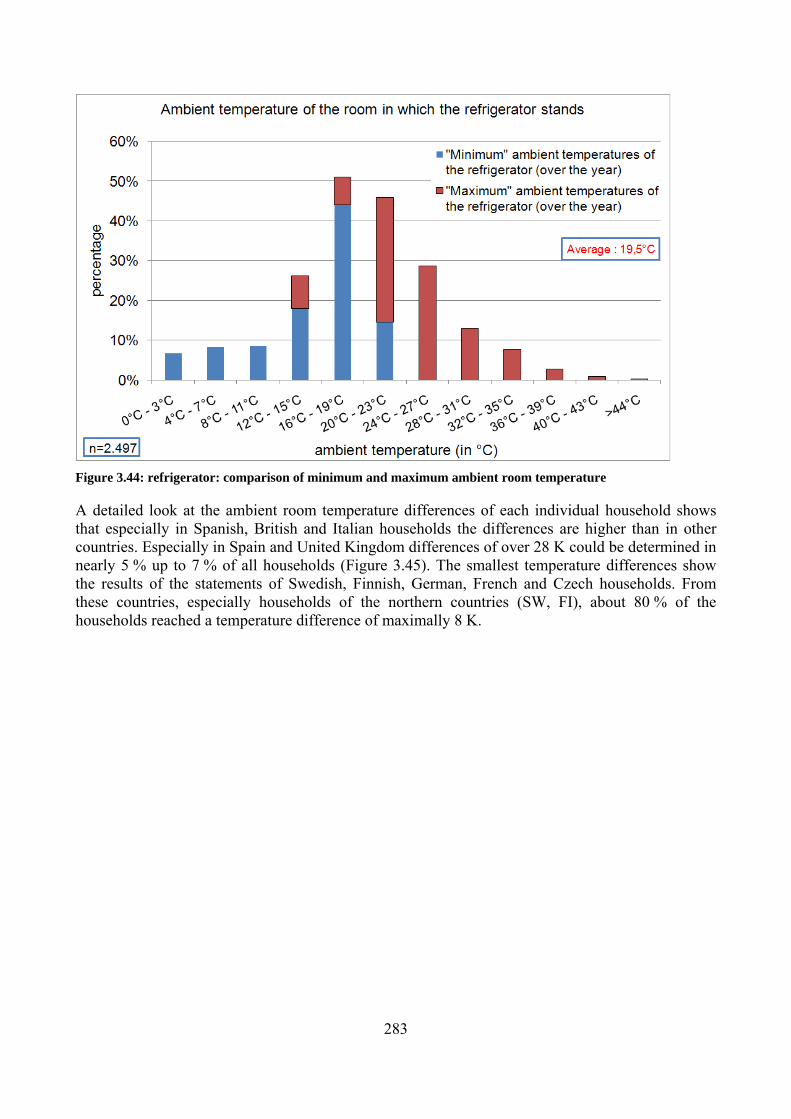
283
Figure 3.44: refrigerator: comparison of minimum and maximum ambient room temperature
A detailed look at the ambient room temperature differences of each individual household shows that especially in Spanish, British and Italian households the differences are higher than in other countries. Especially in Spain and United Kingdom differences of over 28 K could be determined in nearly 5 % up to 7 % of all households (Figure 3.45). The smallest temperature differences show the results of the statements of Swedish, Finnish, German, French and Czech households. From these countries, especially households of the northern countries (SW, FI), about 80 % of the households reached a temperature difference of maximally 8 K.

284
Figure 3.45: refrigerator: temperature differences - Location of the appliances
Figure 3.46: refrigerator: frequency of temperature differences - location of the appliances
About 32 % of all households can be characterized by a temperature difference of the ambient room temperature where the refrigerator stands of less than 8 K and about 80 % of all interviewed households show temperature differences of ≤ 12 K. In approximately 20 % of all participating households temperature differences are ≥ 16 K (Figure 3.46). These data can be interpreted as two

285
different placements of refrigerators: either it is placed in a heated room (e.g. kitchen) with relatively constant temperatures over the year or it is placed in an unheated room (e.g. garage, balcony, household working room or cellar) with temperatures following more or less the ambient temperature change during the year.
To represent the real life behaviour of consumers in using a refrigerator, data about the actual temperature setting of the refrigerator were collected too. In average the actual temperature setting, when possible, adjusted in degree Celsius, is 5,0 °C (Figure 3.47). 20 % of all participants adjust their refrigerator to temperatures from 6,5 up to12 degree Celsius (Figure 3.48).
Figure 3.47: refrigerator: temperature adjustment in °C

286
Figure 3.48: refrigerator: temperature adjustment in °C (all households)
The detailed analysis of the temperature adjustment of those consumers which could adjust their temperature in degree Celsius in all countries shows that the average values range between 3,7 °C of British and 6,0 °C of Swedish refrigerators (Figure 3.49). These average temperatures show that the adjustment in all countries is set mostly following recommended values. But anyhow a detailed look at the distribution of setting in all countries (Figure 3.47) shows that between nearly 5 % up to 30 % (e.g. Swedish households) choose temperatures in a critical range higher than 8 °C.

287
Figure 3.49: refrigerator: average temperature adjustment in °C (per country)
Those consumers which did not have the possibility to adjust the temperature by degree Celsius setting were asked to quote the number of their adjustment possibilities together with the minimum and maximum setting. Unfortunately a high share couldn't give an answer because they don’t know (53,2 %) or they answered uncertainly (Figure 3.51). 32,2 % (n = 803 of 2 497 hh) of all interviewed consumers answered that they have a temperature and a number adjustment. The reason could be that these consumers didn’t understand the questions.
48,5 % of all participating households owning a refrigerator mentioned that they change the temperature setting of the appliance (Figure 3.50). Especially Italian and French households show this behaviour with nearly 60 %. At least nearly 40 % of Swedish households (38 %) and German (39,6 %) and Czech (39,7 %) participants take care about changing the temperature setting conditions. The main reason for the consumers for changing the setting is the outside temperature (57 %) (Figure 3.51). Also the grade of filling (45,7 %) of the appliances plays an important role for the consumer when they vary the Celsius or numbered setting. One fourth mentioned that the type of food influences their behaviour too. Only a minor share of the interviewees (12,5 %) answered that they act intuitively.
288
Figure 3.50: refrigerator: temperature changing (per country)
Figure 3.51: refrigerator: reasons for temperature changing (per country)
The most consumers described their charging of the refrigerator as sometimes completely full and sometimes less full (62 %) (Table 3.5). Especially the results for Spanish and Hungarian households show that here about over 70 % of all those interviewed agree with this statement (Figure 3.52). These households and additionally Italian households show the highest share of households which describe the refrigerator as full most of the time. Their values lie about 8 percentages above the

289
average of all participating households with 11,3 %. Nearly a quarter of all households say that their refrigerator is more or less half full all the time (Table 3.5), varying between 17 and 32 %. An exception is the result of Hungary where only 9 % of all households fill their refrigerator more or less full all the time (Figure 3.52).
Table 3.5: refrigerator: load size (n = 2.497)
My refrigerator is completely full most of the time 11,3 %
My refrigerator is sometimes completely full and sometimes less full 62,0 %
My refrigerator is more or less half full all the time 22,7 %
My refrigerator is often only partly full 3,9 %
Figure 3.52: refrigerator: load size per country
The analysis of the different household structures shows that especially in single-/one person households (35,4 %) only the half capacity of the refrigerator is used all the time (Figure 3.53). With increasing number of persons in households this behaviour decreases and the space of the refrigerator is used more completely. The share of households which described the charge of their refrigerator as completely full most of the time grows from 6,5 % in one-person household up to 16,5 % in a more than 4 person household. The same positive correlation can be noticed for the description of a sometimes completely full and sometimes less full refrigerator. Here the growth between single households and more person households which described their charge of refrigerator in this way reached nearly 22 %. If more people are living in the household probably also more exchange of food will happened.

290
Figure 3.53: refrigerator: load size per number of persons in household
Concerning the object of investigation of “loading” a refrigerator the consumers were asked if they cool prepared food down before placing it into the refrigerator. Approximately 80 % of all consumers mentioned that they cool down prepared food, especially Hungarian consumers act in this way (93,2 %) (Figure 3.54). Most carelessly according to their answers behave Swedish, Polish and Spanish participants because of their lower agreement to this statement. Even 10 % of them answered that they never cool down food before placing it into the refrigerator (Figure 3.54).
291
Figure 3.54: refrigerator: cool down of prepared food
b) Freezer
All participating households with a freezer (n = 2 081) were asked what the maximum and minimum temperature of the room is in which their freezer stands.
Following the analysis of all answers an average temperature of 18,1 °C could be calculated (Figure 3.55) as the arithmetic mean of the maximum and minimum temperature quoted. Over 30 % of all households have their freezers standing in a room with temperatures between 16 and 19 °C. In over the half of all households the freezer stands in a room with a maximum ambient room temperature between 20 °C and 27 °C (Figure 3.55). Together 38,6 % of all households mentioned that the minimum room temperature where their freezer stands reaches values below 11 °C down to 0 °C. Furthermore a total of 66,8 % of all consumers said that they have a minimum respectively maximum room temperature under 16 °C (Figure 3.55). Actually in 38,6 % of all households temperatures of 11 °C or lower are reached. On the other hand in 4,6 % of all interviewed households the room temperature lies at 36 °C or above (Figure 3.44).

292
Figure 3.55: freezer: comparison of minimum and maximum ambient room temperature
The average minimum temperature reached 12,7 °C (Figure 3.56).
In some countries, especially United Kingdom or Spain, in over 50 % of all households the minimum temperature is below 11 °C. Interesting are the results for the northern countries like Sweden and Finland, where the minimum ambient temperatures in nearly 80 % of all households lay above 12 °C and even 30 % between 20 to 23 °C (Figure 3.56).
The analysis of the answers of all consumers to the question what the maximum ambient room temperature is results an average temperature of 23,6 °C (Figure 3.57). Especially in nearly 13 % of all Spanish households the maximum room temperature is even above 36 °C.
In contrast to that in one fourth of all German households a maximum temperature of 15 °C is reached.

293
Figure 3.56: freezer: minimum ambient room temperature per countries
Figure 3.57: freezer: maximum ambient room temperature per countries
About 52 % of all households can be characterized by a temperature difference (Figure 3.58) of the ambient room temperature where the freezer stands of less than 12 K. In approximately 16 % of all participating households temperature differences are > 16 K.
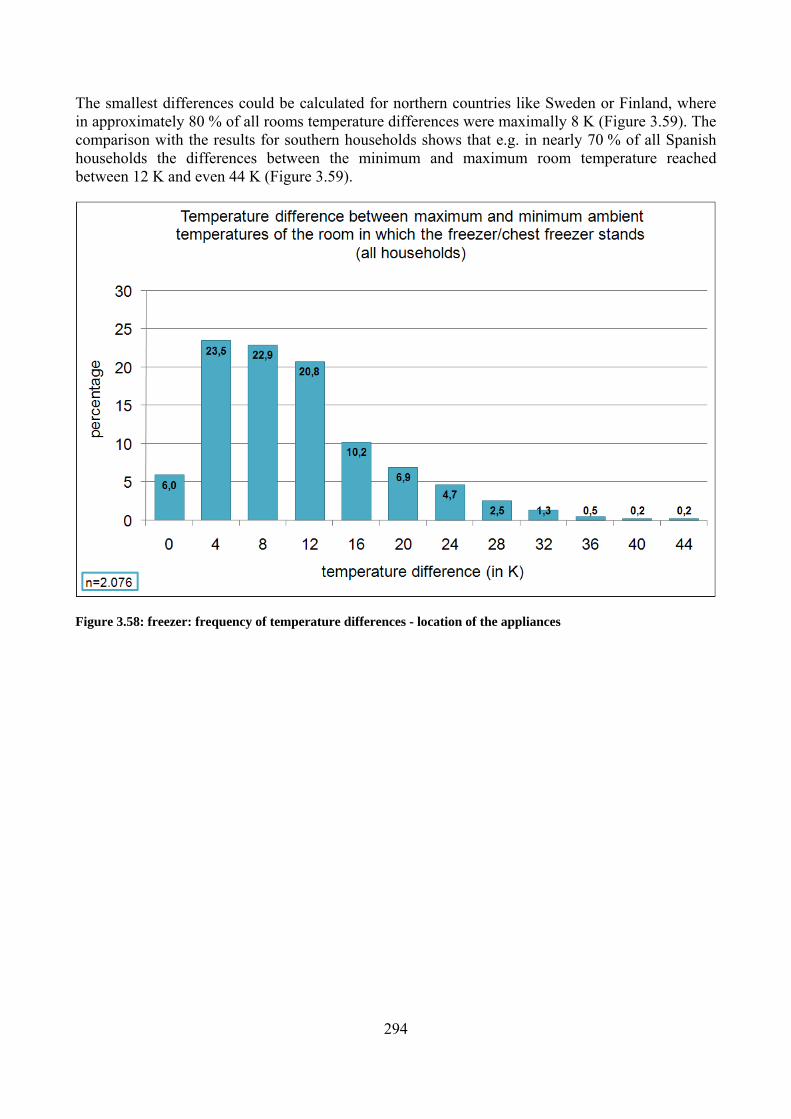
294
The smallest differences could be calculated for northern countries like Sweden or Finland, where in approximately 80 % of all rooms temperature differences were maximally 8 K (Figure 3.59). The comparison with the results for southern households shows that e.g. in nearly 70 % of all Spanish households the differences between the minimum and maximum room temperature reached between 12 K and even 44 K (Figure 3.59).
Figure 3.58: freezer: frequency of temperature differences - location of the appliances

295
Figure 3.59: freezer: temperature differences - location of the appliances
These data can be interpreted as two different placements for the freezers: either it is placed in a heated room (e.g. kitchen) with relatively constant temperatures over the year or it is placed in an unheated room (e.g. garage, balcony, household working room or cellar) with temperatures following more or less the ambient temperature change during the year.
In addition to the room temperature also the adjustment of the cool appliances plays an important role for the energy performance and efficiency. The analysis of the question what the actual temperature adjustment in degree Celsius of the freezer is results an average of -16,7° C (Figure 3.60). Between the interviewed countries only differences plus or minus one degree on the average temperature setting can be noticed. Just French consumers state a very low temperature setting with in average nearly -19 °C (Figure 3.60).

296
Figure 3.60: freezer: average temperature adjustment in °C (per country)
For consumers which have an appliance without an indicator showing centigrade the adjustment in numbered setting was asked too. Approximately 50 % of the participants don’t know what possible settings their appliance has. Therefore this question was not analysed any further.
Only 23,4 % of all participating households say that they change their temperature setting sometimes (Figure 3.61). Mostly Finnish consumers change their temperature adjustment (39,5 %). Least frequently German and British households act in this way, with approximately 12,5 %. The share of the remaining countries lay between 22,1 and 28 %. Approximately 75 % of all asked consumers say that they change the temperature of their freezer according to how full it is (Figure 3.62). Also the outside temperature plays an important role for changing the adjustment for 35 % of all participants. Only nearly 10 % act by intuition or/and their habit.

297
Figure 3.61: freezer: temperature changing (per country)
Figure 3.62: freezer: reasons for temperature changing (per country)
About half of all households describe the charge of their freezer as sometimes completely full and sometimes less full (Table 3.6). Also a high share of nearly 35 % of all asked consumers says that their freezer is completely full all the time. For nearly 20 % of the consumers the freezer seems to be oversized because they used only a part (3,5 %) or the half size (13,6 %) of the freezer.

298
Table 3.6: freezer: load size (n=2.081)
My freezer/chest freezer is completely full most of the time 34,6 %
My freezer/chest freezer is sometimes completely full and sometimes less full 48,4 %
My freezer/chest freezer is more or less half full all the time 13,6 %
My freezer/chest freezer is often only partly full 3,5 %
Especially in Hungarian and Czech households the most space of the freezer is used (completely full most of the time ∼50 %) (Figure 3.63). The shares of households which used only a part of the freezer are marginal with between 1 % (UK) and 9 % (IT). French and Hungarian consumers never use the capacity of a freezer in this way (0 %).
Figure 3.63: freezer: load size per country
In single-/one person households the share of freezers which are only filled partly reached nearly 8 %, more than thrice of the results of the other household types (Figure 3.64). 19,3 % of all single households also only use the half size of the freezer. With increasing number of persons in a household the share of freezers which are often completely full and sometimes less full grows. In comparison with this the share of completely full freezers decreases if more people live in the household. Maybe the exchange of food in households with a lot of people is higher than in only two or three person households, where the duration of storage may be longer.

299
Figure 3.64: freezer: load size per number of persons in household

300
3.3.3 Definition of the real life base case As it has been shown (s. chap 3.3.2) consumers’ behaviour and usage is very different between themselves, but also between their behaviour and usage and what is defined in the standard base case, used for calculating the energy efficiency and energy saving. These differences are summarised here as far as they effect the energy consumption of refrigerators or freezers.
a) Refrigerator
All calculations and assumptions are based on the criteria of cold appliances of cat.7 and the behaviour of a 2,9 person household, which was the average household size of this consumer survey.
The factors which are seen as relevant for the energy consumption and which are not included in the standard base case but representative for the real life consumer behaviour are:
• Room/ambient temperature,
• The “cooling performance”,
• exchange of food
• storage/insertion of hot items
• door openings.
Room/ambient temperature
In real life the consumer survey (s. chap. 3.3.2) has shown that the average ambient room temperature where the refrigerator stands is 19,5 °C which is lower than the temperature used in the standard base case test (25 °C). The effect of a reduction of the room temperature examined in several studies and the results are summarised in Table 3.7. In average an energy reduction of 5,8 % per degree can be calculated. For a temperature difference of 5,5 K between the results of the consumer survey and standard base case conditions an energy reduction of 31,9 % can be calculated. Based on the annual energy consumption of the standard base case of cat.7 (= 324,4 kWh) the energy consumption in this ‘real life base case situation’ will be reduced to 220,9 kWh/year (Table 3.12).

301
Table 3.7: change of ambient temperature – effect on energy reduction
study
original ambient
temperature in °C
new ambient
temperature in °C
temperature difference in K
energy
reduction
energy
reduction
per K
HMWVL, 2005 25 22 3 16 % 5,3 %
HMWVL, 2005 25 19 6 32 % 5,3 %
HMWVL, 2005 25 15 10 53 % 5,3 %
Stiftung Warentest,1994 25 16 9 47 % 5,2 %
Stiftung Warentest,1994 32 25 7 55 % 7,9 %
Lepthien, 2000 25 20 5 18,50 % 3,7 %
Böhmer & Wicke, 1998 25 24 1 8 % 8,0 %
Peart, 1993 21 18 3 12 kWh/year 4 kWh/year
average energy reduction per K 5,8 %
temperature difference (standard base case - consumer survey) 5,5 K
energy reduction 31,9 %
Regarding the ambient temperature the result of the consumer survey shows that nearly half of all households have temperatures below 16 °C (Figure 3.65). In detail 18 % of all households mentioned that the ambient minimum temperature reaches values between 12 and 15 °C (Figure 3.65). These temperatures are below the lower limit temperature of the climatic classes N, ST and T. Also approximately 24 % of the participants said that the room has a minimum temperature between 0 °C and 11 °C (Figure 3.65) what is below the lower limit of climatic class N.
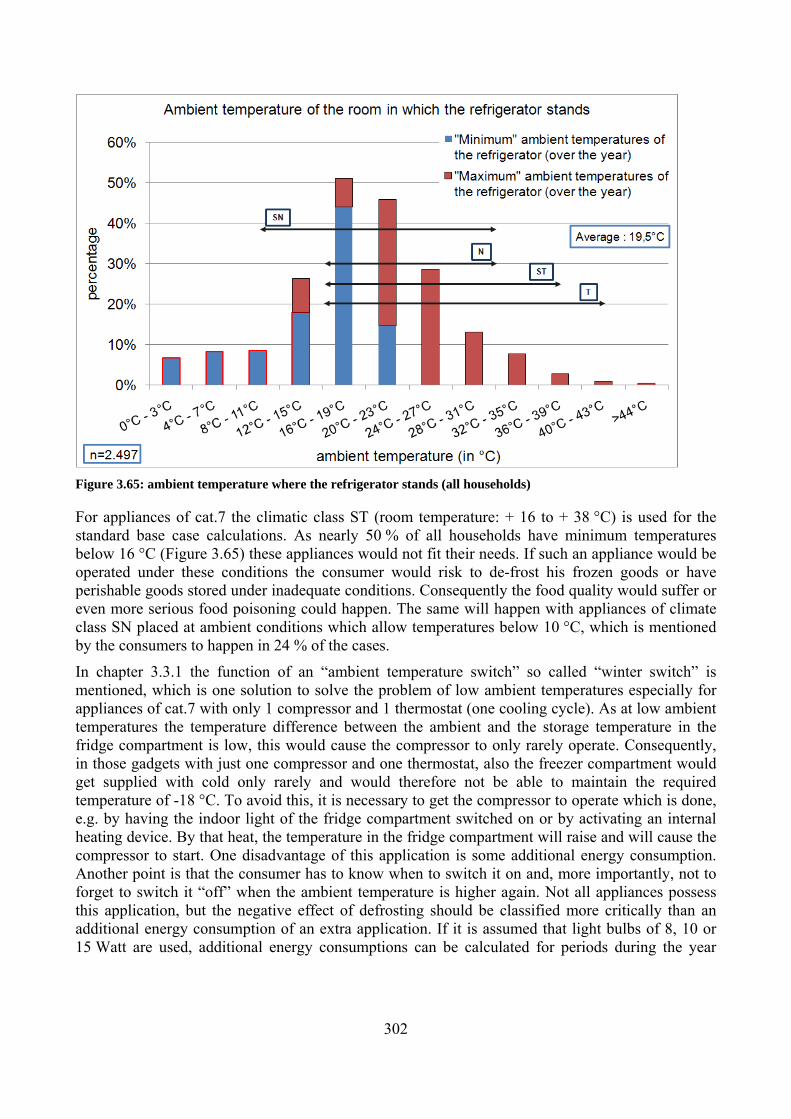
302
Figure 3.65: ambient temperature where the refrigerator stands (all households)
For appliances of cat.7 the climatic class ST (room temperature: + 16 to + 38 °C) is used for the standard base case calculations. As nearly 50 % of all households have minimum temperatures below 16 °C (Figure 3.65) these appliances would not fit their needs. If such an appliance would be operated under these conditions the consumer would risk to de-frost his frozen goods or have perishable goods stored under inadequate conditions. Consequently the food quality would suffer or even more serious food poisoning could happen. The same will happen with appliances of climate class SN placed at ambient conditions which allow temperatures below 10 °C, which is mentioned by the consumers to happen in 24 % of the cases.
In chapter 3.3.1 the function of an “ambient temperature switch” so called “winter switch” is mentioned, which is one solution to solve the problem of low ambient temperatures especially for appliances of cat.7 with only 1 compressor and 1 thermostat (one cooling cycle). As at low ambient temperatures the temperature difference between the ambient and the storage temperature in the fridge compartment is low, this would cause the compressor to only rarely operate. Consequently, in those gadgets with just one compressor and one thermostat, also the freezer compartment would get supplied with cold only rarely and would therefore not be able to maintain the required temperature of -18 °C. To avoid this, it is necessary to get the compressor to operate which is done, e.g. by having the indoor light of the fridge compartment switched on or by activating an internal heating device. By that heat, the temperature in the fridge compartment will raise and will cause the compressor to start. One disadvantage of this application is some additional energy consumption. Another point is that the consumer has to know when to switch it on and, more importantly, not to forget to switch it “off” when the ambient temperature is higher again. Not all appliances possess this application, but the negative effect of defrosting should be classified more critically than an additional energy consumption of an extra application. If it is assumed that light bulbs of 8, 10 or 15 Watt are used, additional energy consumptions can be calculated for periods during the year

303
when the room would usually be heated. For the calculation the heating degree days74 respectively heating days of each country are used. When the average temperature of the day is under the “heating limit temperature” of 15 °C this day is called “heating day”. Heating degree days are summations of negative differences between the mean daily temperature and room (base) temperature of 18 °C. With published data75 of average temperatures per month for each country the average temperature of the heating period was determined. As heating period these months are chosen which reached only temperatures ≤ 15 °C. For example for United Kingdom an average temperature of the heating period (outside temp. ≤ 15 °C) of 8,6 °C could be calculated using the changes of temperatures during the year (Table 3.8).
Table 3.8: e.g. calculation: heating days and average temperature of the heating period (e.g. UK)
Month °C
JANUARY 4
FEBRUARY 4
MARCH 6
APRIL 8
MAY 12
JUNE 15
JULY 17
AUGUST 17
SEPTEMBER 14
OCTOBER 11
NOVEMBER 7
DECEMBER 5
average temp. heating period 8,6
The number of heating days Z [d] is calculated by the following
formula:
Z [d] = G/ (ti - tz )
G [Kd] = number of heating degree days
ti = 18°C (base temperature)
tz = average outside temperature during the heating period
With the heating degree days’ data published by the World Resources Institute (2003) the heating days were determined (
74 World Resources Institute: Kevin Baumert and Mindy Selman (2003): Data Note - Heating and Cooling Degree
Days. Online: http://cait.wri.org/downloads/DN-HCDD.pdf
75 http://www.eurometeo.com/english/climate

304
Table 3.9).
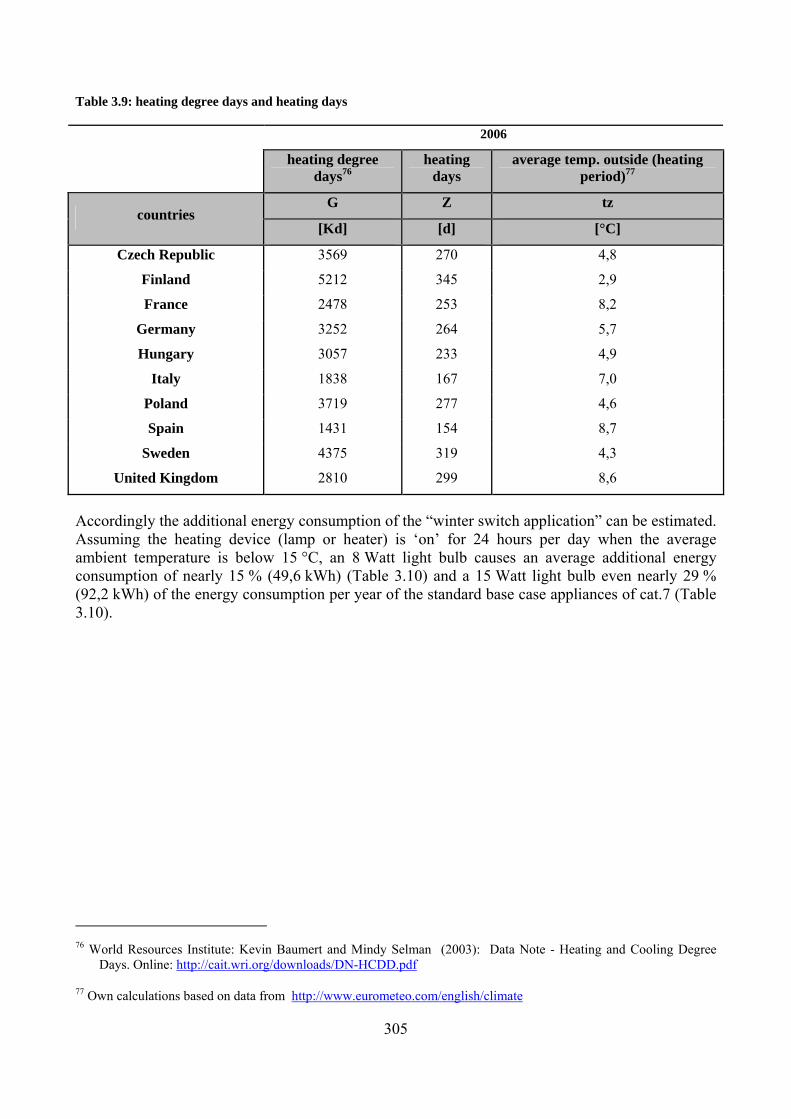
305
Table 3.9: heating degree days and heating days
2006
heating degree days76
heating days
average temp. outside (heating period)77
G Z tz countries
[Kd] [d] [°C]
Czech Republic 3569 270 4,8
Finland 5212 345 2,9
France 2478 253 8,2
Germany 3252 264 5,7
Hungary 3057 233 4,9
Italy 1838 167 7,0
Poland 3719 277 4,6
Spain 1431 154 8,7
Sweden 4375 319 4,3
United Kingdom 2810 299 8,6
Accordingly the additional energy consumption of the “winter switch application” can be estimated. Assuming the heating device (lamp or heater) is ‘on’ for 24 hours per day when the average ambient temperature is below 15 °C, an 8 Watt light bulb causes an average additional energy consumption of nearly 15 % (49,6 kWh) (Table 3.10) and a 15 Watt light bulb even nearly 29 % (92,2 kWh) of the energy consumption per year of the standard base case appliances of cat.7 (Table 3.10).
76 World Resources Institute: Kevin Baumert and Mindy Selman (2003): Data Note - Heating and Cooling Degree
Days. Online: http://cait.wri.org/downloads/DN-HCDD.pdf
77 Own calculations based on data from http://www.eurometeo.com/english/climate

306
Table 3.10: additional energy consumption – „winter switch“-option
winter - switch (15 watt light bulb)
winter - switch (10 watt light bulb)
winter - switch (8 watt light bulb)
* based on cat.7: 324,4 kWh kWh additional energy
consumption (%*) kWh additional energy consumption (%*) kWh additional energy
consumption (%*)
Czech Republic 97,2 30,0 % 64,8 20,0 % 51,8 16,0 %
Finland 124,3 38,3 % 82,8 25,5 % 66,3 20,4 %
France 91,2 28,1 % 60,8 18,7 % 48,7 15,0 %
Germany 94,9 29,3 % 63,3 19,5 % 50,6 15,6 %
Hungary 83,7 25,8 % 55,8 17,2 % 44,7 13,8 %
Italy 60,2 18,5 % 40,1 12,4 % 32,1 9,9 %
Poland 99,6 30,7 % 66,4 20,5 % 53,1 16,4 %
Spain 55,5 17,1 % 37,0 11,4 % 29,6 9,1 %
Sweden 115,0 35,4 % 76,6 23,6 % 61,3 18,9 %
United Kingdom 107,6 33,2 % 71,7 22,1 % 57,4 17,7 %
average 92,9 28,6 % 61,9 19,1 % 49,6 15,3 %
In those appliances which only have one compressor and one thermostat unneeded energy is consumed also when the appliance is placed at an ambient temperature which is higher than the measurement temperature of the standard base case. As under these conditions the compressor will tend to operate more frequently than under the standardized testing conditions, the freezer compartment will get considerably cooler than -18 °C and may therefore have higher energy losses. No published studies are available which would allow estimating this effect in terms of additional energy consumption.
The “cooling performance”
Refrigerators are used to cool down food (used in general terms here for everything stored in a refrigerator) and to keep them at these conditions. The standard base case only covers the storage of food under a constant temperature. The daily exchange of food under the conditions of ambient temperature and temperature adjustment of the refrigerator plays an important role for the energy consumption too.
Important aspects, which are not covered in the standard base case, are the
• exchange of food, • storage/insertion of hot items, • door openings.
With the assumption of a daily exchange of food of 2 kg (here represented by water) per person and per household, a total amount of 5,8 kg needs to be cooled down from ambient condition to the storage temperature for an average household of 2,9 persons. The consumer survey analysis resulted an average storage temperature setting of 5 °C of the refrigerator and an average ambient temperature of 19,5 °C (Figure 3.65). A necessary energy of 23,8 kWh/year for a 2,9 person household can be calculated by the following formula:

307
Energy needed = Heat load per day / COP78 ⋅ 365 days/year
Heat load = 5,8 kg ⋅ 14,5 K ⋅ 4,19 kJ/kgK = 352,4 kJ
= 0,0979 kWh
Energy needed = 0,0979 kWh/day / 1,5 ⋅ 365 days/year
= 23,8 kWh/year
For single- and four persons households the necessary energy consumption for cooling down inserted food would result in 8,2 kWh and 65,6 kWh per year, respectively.
Storage of hot items:
The consumer survey analysis shows that nearly 20 % (Figure 3.54) do not always cool down hot items or cooked food before inserting them in the refrigerator (15 % “sometimes”, 5 % “never”). This behaviour causes an additional energy increase.
With the assumptions of an amount of 0,25 kg hot food (represented by water) at 40 °C inserted per person and per household, the refrigerator additionally has to cool this down about ΔT = 20,5 K to the ambient temperature of 19,5 °C. Accordingly this allows to estimate an extra energy consumption for a 2,9 person household of 4,2 kWh/year (1,4 kWh/year for a single person household and 5,8 kWh/year for a four persons household).
Calculation: Insertion hot items - Energy consumption per year
Energy needed = Heat load per day / COP79 ⋅ 365 days/year
Heat load = 0,725 kg ⋅ 4,19 kJ/kgK ⋅ 20,5 K= 62,27 kJ
= 0,0173 kWh
Energy needed = 0,0173 kWh/day : 1,5 ⋅ 365 days/year
= 4,2 kWh/year
78 COP (coefficient of performance) assumed to be 1,5
79 COP (coefficient of performance) assumed to be 1,5

308
Door openings
With insertion and storage of food the door has to be opened and will be left open for some time. This will mainly cause cold air to pour out and to be replaced by air from the ambient. This effect and the additional energy needed to cool down the replaced air are not covered by the standard base case, as tests are done with closed door only. Table 3.11 summarises the results of studies which investigated the energy consumption increase depending on the door opening.
In average an additional energy consumption of 0,002903 kWh per door opening can be calculated.
Table 3.11: energy consumption studies with door opening
study door opening/ household(/person))
increase energy consumption
energy consumption
(standard base case)*
kWh/door opening
[do] [kWh/year] [kWh/year] [kWh/do]
PEART (1993) 40/hh 50-120
kWh/year = 85 ----- 0,005822
LEPTHIEN (2000) 20/hh 1-6 %
(aver.3,5 %) = 11,35 324,4 0,001555
LIU (2004) 50/hh 5-10 %
(aver.7,5 %) = 24,33 324,4 0,001333
THOMAS (2007) 8,2/p
*(cat.7) average energy consumption per door opening 0,002903
A recent consumer behaviour study about the storage of food in Europe80 observed an average door opening of a refrigerator of 8,2 times per day per person. With the average energy consumption per opening and this frequency the energy consumption for a 2,9 person household is 25,2 kWh/year (single household: 8,7 kWh/year – four person household: 34,8 kWh/year).
The comparison of the energy consumption of the real-life base case (RLBC) and the standard base case (STBC) shows that the total amount of energy used is surprisingly similar (Table 3.12). This is especially due to the lower ambient temperature of the location of the refrigerator in the households, where the energy consumption is considerably reduced. All other factors not considered in the measurement according to the standard are not so relevant as to balance the high ambient temperature of the measurement conditions. Only for refrigerators/freezers of category 7 with mainly one compressor and one thermostat a considerable additional amount of energy is needed when they are placed in an unheated room and are therefore affected by low and high ambient temperatures. As this depends on the local conditions no definite answer about the additional energy can be given. It may even be much higher than estimated here. Unfortunately the consumer is 80 Thomas, Simone (2007): Diss.: Erhebung des Verbraucherverhaltens bei der Lagerung verderblicher
Lebensmittel in Europa [Consumer behavior with the storage of perishable food in Europe]. (will be published) Online: http://www.shaker.de/online-gesamtkatalog/booklist.asp?ID=1707429&CC=54012&Reihe=423
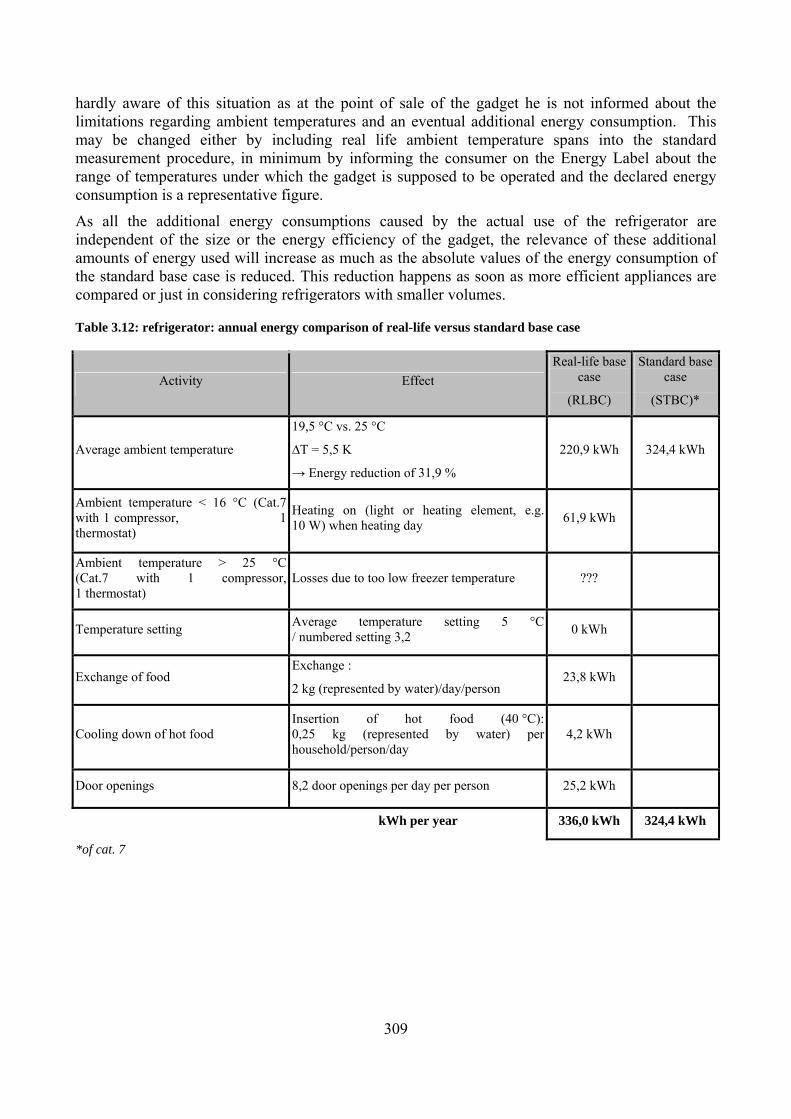
309
hardly aware of this situation as at the point of sale of the gadget he is not informed about the limitations regarding ambient temperatures and an eventual additional energy consumption. This may be changed either by including real life ambient temperature spans into the standard measurement procedure, in minimum by informing the consumer on the Energy Label about the range of temperatures under which the gadget is supposed to be operated and the declared energy consumption is a representative figure.
As all the additional energy consumptions caused by the actual use of the refrigerator are independent of the size or the energy efficiency of the gadget, the relevance of these additional amounts of energy used will increase as much as the absolute values of the energy consumption of the standard base case is reduced. This reduction happens as soon as more efficient appliances are compared or just in considering refrigerators with smaller volumes.
Table 3.12: refrigerator: annual energy comparison of real-life versus standard base case
Activity Effect Real-life base
case
(RLBC)
Standard base case
(STBC)*
Average ambient temperature
19,5 °C vs. 25 °C
∆T = 5,5 K
→ Energy reduction of 31,9 %
220,9 kWh 324,4 kWh
Ambient temperature < 16 °C (Cat.7 with 1 compressor, 1 thermostat)
Heating on (light or heating element, e.g. 10 W) when heating day 61,9 kWh
Ambient temperature > 25 °C (Cat.7 with 1 compressor, 1 thermostat)
Losses due to too low freezer temperature ???
Temperature setting Average temperature setting 5 °C / numbered setting 3,2 0 kWh
Exchange of food Exchange :
2 kg (represented by water)/day/person 23,8 kWh
Cooling down of hot food Insertion of hot food (40 °C): 0,25 kg (represented by water) per household/person/day
4,2 kWh
Door openings 8,2 door openings per day per person 25,2 kWh
kWh per year 336,0 kWh 324,4 kWh
*of cat. 7

310
b) Freezer All calculations and assumptions are based on the criteria of cold appliances of cat.8 and 9 and the behaviour of a 2,9 person household, which was the average household size of this consumer survey.
The factors which are seen as relevant for the energy consumption under real life conditions and which are not included in the standard base case are the:
• Room/ambient temperature • Temperature setting of the appliances • Insertion of goods/loading of freezer
Room/ambient temperature and setting of the appliance
The average ambient room temperature where the freezer stands was reported to be 18,1 °C (Figure 3.66) which is lower than the ambient temperature used in the standard base case test with 25 °C. Taking a linear dependency between the temperature difference (ambient – storage) and the energy consumption an energy reduction of 2,3 % per degree can be calculated. For the ambient temperature difference of 6,9 K between the results of the consumer survey and standard base case conditions an energy reduction of 16 % would be reached. As the temperature setting in the freezer compartment was found to be at -16,7 °C (Figure 3.60) an additional reduction of the energy consumption of 3 % compared to the standard base case has to be incorporated.
Figure 3.66: ambient temperature where the freezer stands (all households)
For appliances of cat.8 and 9 the average energy consumption, based on the values of the standard base cases, is 287,5 kWh/year. Under the circumstances of the results of the consumer survey with an average ambient temperature of 18,1 °C and a temperature setting of the freezer of -16,7 °C an energy consumption of 232,7 kWh could be determined (see calculation below) in comparison with

311
the standard base case settings with an ambient temperature of 25 °C and a temperature setting of the appliance of -18 °C. On inspection of only the temperature difference of 6,9 K between the results of the consumer survey and standard base case conditions of the ambient temperature an energy reduction of 16% would lower the annual consumption to 241,4 kWh/year (Table 3.13).
Calculation: Energy reduction per degree
Standard base case (cat.8 & 9)*:
Room temperature = 25 °C
Temperature setting = -18 °C
ΔT = 25 °C - (-18 °C) = 43 K
Energy consumption/degree: 287,5 kWh* / 43K = 6,7 kWh/K
Results consumer survey:
Average room temperature = 18,1 °C
Average temperature setting = -16,7 °C
ΔT = 18,1 °C – (-16,7 °C) = 34,8 K
Energy consumption: 6,7 kWh/K 34,8 K = 232,7 kWh

312
Insertion of food / Loading of freezer
In assuming a daily exchange of food of 0,125 litre (represented by water) per day and person the additional energy needed to freeze this food (heating capacities for water assumed) from ambient temperature to average freezer temperature for a 2,9 person household can be calculated as follows:
Energy needed/year = Heat load/day / COP (coefficient of performance) ⋅ 365 days/year
Heat load:
1). 0,3625 kg ⋅ 18,1 K ⋅ 4,19 kJ/kgK = 27,5 kJ
2). 0,3625 kg ⋅ 16,7 K ⋅ 2,10 kJ/kgK = 25,4 kJ
3). 0,3625 kg ⋅ 332,5 kJ/kg = 120,5 kJ (Freezing energy)
Heat load/day
= (27,5 kJ + 25,4 kJ +120,5 kJ)/day = 173,4 kJ/day = 0,0481 kWh/day
Energy needed/year = Heat load/day : COP81 ⋅ 365 days/year
= 0,0481 kWh/day : 1,5 ⋅ 365 days/year
= 11,7 kWh/year
Regarding door opening of a freezer no real life consumer behaviour data were available. As this is assumed to be done seldom, no effect on the total energy consumption was considered.
Table 3.13: freezer: annual energy comparison of real-life versus standard base case
Activity Effect Real-life base
case
(RLBC)
Standard base case
(STBC) aver. Cat 8/9
Average ambient temperature
18,1 °C vs. 25 °C
∆T = 6,9 K
→ Energy reduction of 16 %
241,4 kWh 287,5 kWh
Average temperature setting -16,7 °C vs. – 18,0 °C ∆T = 1,3 K
→ Energy reduction of 3 % -8,6 kWh
Exchange of food (“Cooling performance”)
Exchange (assumption):
0,125 kg (represented by water)/day/person
+11,7 kWh
81 COP (coefficient of performance) assumed to be 1,5
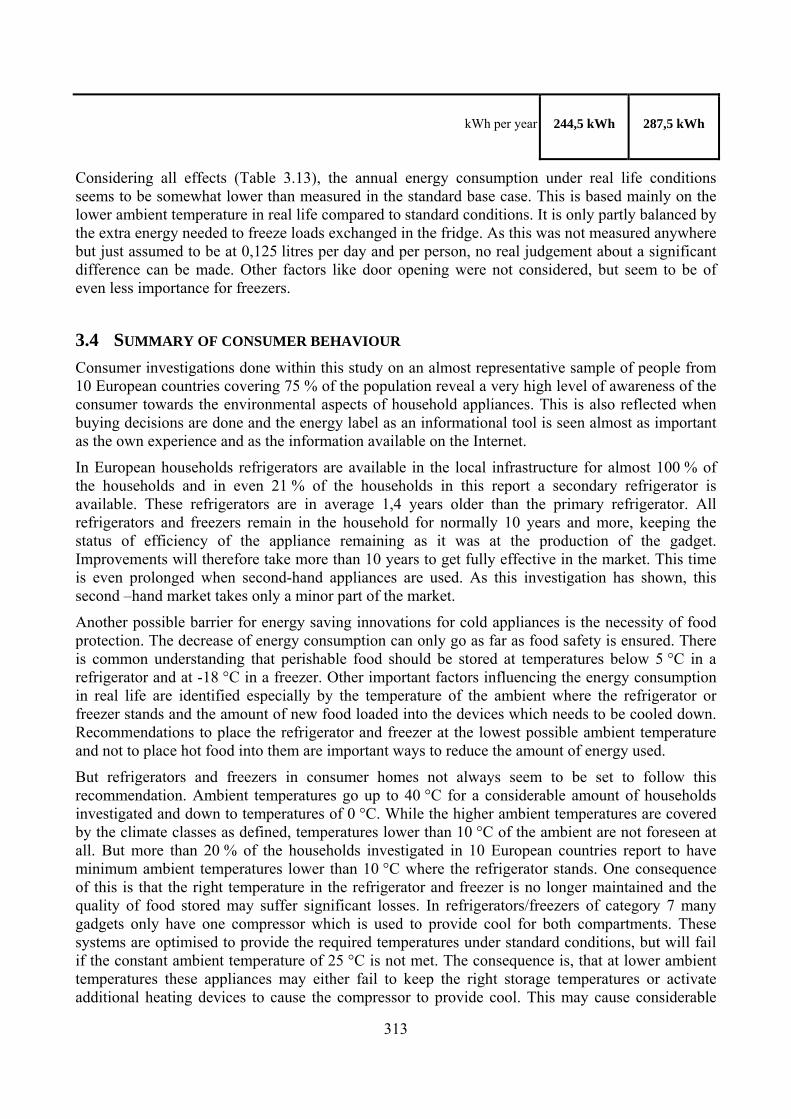
313
kWh per year 244,5 kWh 287,5 kWh
Considering all effects (Table 3.13), the annual energy consumption under real life conditions seems to be somewhat lower than measured in the standard base case. This is based mainly on the lower ambient temperature in real life compared to standard conditions. It is only partly balanced by the extra energy needed to freeze loads exchanged in the fridge. As this was not measured anywhere but just assumed to be at 0,125 litres per day and per person, no real judgement about a significant difference can be made. Other factors like door opening were not considered, but seem to be of even less importance for freezers.
3.4 SUMMARY OF CONSUMER BEHAVIOUR Consumer investigations done within this study on an almost representative sample of people from 10 European countries covering 75 % of the population reveal a very high level of awareness of the consumer towards the environmental aspects of household appliances. This is also reflected when buying decisions are done and the energy label as an informational tool is seen almost as important as the own experience and as the information available on the Internet.
In European households refrigerators are available in the local infrastructure for almost 100 % of the households and in even 21 % of the households in this report a secondary refrigerator is available. These refrigerators are in average 1,4 years older than the primary refrigerator. All refrigerators and freezers remain in the household for normally 10 years and more, keeping the status of efficiency of the appliance remaining as it was at the production of the gadget. Improvements will therefore take more than 10 years to get fully effective in the market. This time is even prolonged when second-hand appliances are used. As this investigation has shown, this second –hand market takes only a minor part of the market.
Another possible barrier for energy saving innovations for cold appliances is the necessity of food protection. The decrease of energy consumption can only go as far as food safety is ensured. There is common understanding that perishable food should be stored at temperatures below 5 °C in a refrigerator and at -18 °C in a freezer. Other important factors influencing the energy consumption in real life are identified especially by the temperature of the ambient where the refrigerator or freezer stands and the amount of new food loaded into the devices which needs to be cooled down. Recommendations to place the refrigerator and freezer at the lowest possible ambient temperature and not to place hot food into them are important ways to reduce the amount of energy used.
But refrigerators and freezers in consumer homes not always seem to be set to follow this recommendation. Ambient temperatures go up to 40 °C for a considerable amount of households investigated and down to temperatures of 0 °C. While the higher ambient temperatures are covered by the climate classes as defined, temperatures lower than 10 °C of the ambient are not foreseen at all. But more than 20 % of the households investigated in 10 European countries report to have minimum ambient temperatures lower than 10 °C where the refrigerator stands. One consequence of this is that the right temperature in the refrigerator and freezer is no longer maintained and the quality of food stored may suffer significant losses. In refrigerators/freezers of category 7 many gadgets only have one compressor which is used to provide cool for both compartments. These systems are optimised to provide the required temperatures under standard conditions, but will fail if the constant ambient temperature of 25 °C is not met. The consequence is, that at lower ambient temperatures these appliances may either fail to keep the right storage temperatures or activate additional heating devices to cause the compressor to provide cool. This may cause considerable

314
additional amounts of energy (up to 29 %) used than compared to a similar appliance with two compressor circles. At higher ambient temperatures these machines will – while keeping the temperature in the refrigerator compartment at the right value – provide more cool to the freezer compartment as needed to keep the desired temperature. Also this may cause unnecessary energy consumptions. Only about one quarter of the consumers adjust their temperature setting according to the outside temperature to somehow balance this effect.
Consumer behaviour is also characterised by
• an average temperature of the refrigerator set at 5,0 °C at the correct level, but with relevant differences between countries,
• an average temperature of the freezer at -16,7 °C, again with differences between countries, • the capacity of the refrigerator compartment which is used to a good extent by the
consumers, but that of the freezer is even more filled.
Summarising all of this information about the consumer behaviour allows estimating the difference between the real life and standard base case energy consumption. Due to the lower ambient temperature in real life compared to the 25 °C used in the standard measurement will considerably reduce the energy taken by the gadgets. Part of this saving is balanced by cooling down food which is loaded and by cooling down the air which is exchanged when opening the door. So all in all the measured consumption following the standard is somehow taking care of this kind of real life behaviour.
Not covered are the additional consumptions which may be used by cat. 7 refrigerators/freezers with just one compressor (and one thermostat) not operated within the temperature range of 20 to 30 °C. Here significant amounts of additional energy are used about which the consumer was not informed at the point of sale of the gadget.

315
APPENDIX
Appendix 3.1- 1 population by household size and age group: comparison results own survey vs. Eurostat data82
Age group
United Kingdom 20-39 years 40-59 years 60 and 74 years
total
1 person 3,9% 7,1% 4,2% 15,1%
2 persons 11,6% 12,2% 10,6% 34,4%
3 persons 11,6% 10,9% 1,6% 24,1%
4 persons 8,0% 8,7% 1,0% 17,7% results own survey
more than 4 persons 4,8% 3,9% 0,0% 8,7%
total 39,9% 42,8% 17,4% 100,0%
Age group
20-39 years 40-59 years 60 and 74 years total
1 person 4% 5% 5% 14%
2 persons 10% 13% 12% 36%
3 persons 10% 9% 2% 21%
4 persons 10% 8% 1% 19% Eurostat*
more than 4 persons 6% 4% 0% 11%
total 41% 39% 20% 100%
Age group
20-39 years 40-59 years 60 and 74 years
1 person 0,1% -2,1% 0,8% -1,1%
2 persons -1,6% 0,8% 1,4% 1,6%
3 persons -1,6% -1,9% 0,4% -3,1%
4 persons 2,0% -0,7% 0,0% 1,3% Differences
more than 4 persons 1,2% 0,1% 0,0% 2,3%
total 1,1% -3,8% 2,6% 0,0%
82Own calculation: Population by household size and age group based on EUROSTAT data.
* Own calculations: crosstabs with EUROSTAT data of population by age group and household size

316
Age group France
20-39 years 40-59 years 60 and 74 years total
1 person 5,9% 3,9% 3,9% 13,8%
2 persons 9,1% 11,0% 11,8% 31,9%
3 persons 9,8% 9,8% 2,0% 21,7%
4 persons 11,0% 7,9% 1,2% 20,1% results own survey
more than 4 persons 7,5% 5,1% 0,0% 12,6%
total 43,3% 37,8% 18,9% 100,0%
Age group
20-39 years 40-59 years 60 and 74 years total
1 person 6% 4% 4% 15%
2 persons 9% 11% 12% 32%
3 persons 10% 9% 2% 22%
4 persons 11% 8% 1% 19% Eurostat*
more than 4 persons 7% 5% 0% 12%
total 42% 38% 20% 100%
Age group
20-39 years 40-59 years 60 and 74 years total
1 person 0,1% 0,1% 0,1% 1,2%
2 persons -0,1% 0,0% 0,2% 0,1%
3 persons 0,2% -0,8% 0,0% 0,3%
4 persons 0,0% 0,1% -0,2% -1,1% Differences
more than 4 persons -0,5% -0,1% 0,0% -0,6%
total -1,3% 0,2% 1,1% 0,0%
Age group Czech Republic
20-39 years 40-59 years 60 and 74 years total
1 person 4,0% 5,3% 4,0% 13,4%
2 persons 6,1% 10,9% 9,3% 26,3%
3 persons 12,1% 11,3% 2,0% 25,5%
4 persons 15,0% 10,1% 1,2% 26,3% results own survey
more than 4 persons 5,3% 3,2% 0,0% 8,5%
total 42,5% 40,9% 16,6% 100,0%

317
Age group
20-39 years 40-59 years 60 and 74 years total
1 person 5% 5% 5% 14%
2 persons 6% 11% 10% 27%
3 persons 12% 11% 2% 25%
4 persons 15% 10% 1% 25% Eurostat*
more than 4 persons 5% 3% 0% 9%
total 42% 40% 18% 100%
Age group
20-39 years 40-59 years 60 and 74 years total
1 person 1,0% -0,3% 1,0% 0,6%
2 persons -0,1% 0,1% 0,7% 0,7%
3 persons -0,1% -0,3% 0,0% -0,5%
4 persons 0,0% -0,1% -0,2% -1,3% Differences
more than 4 persons -0,3% -0,2% 0,0% 0,5%
total -0,5% -0,9% 1,4% 0,0%
Age group Germany
20-39 years 40-59 years 60 and 74 years total
1 person 6,3% 6,0% 4,8% 17,2%
2 persons 11,8% 14,8% 12,7% 39,3%
3 persons 10,3% 9,4% 1,8% 21,5%
4 persons 9,4% 6,0% 0,0% 15,4% results own survey
more than 4 persons 3,9% 2,7% 0,0% 6,6%
total 41,7% 39,0% 19,3% 100,0%
Age group
20-39 years 40-59 years 60 and 74 years total
1 person 7% 5% 5% 18%
2 persons 8% 14% 16% 38%
3 persons 9% 9% 2% 21%
4 persons 9% 7% 0% 17% Eurostat*
more than 4 persons 4% 3% 0% 7%
total 38% 38% 24% 100%

318
Age group
20-39 years 40-59 years 60 and 74 years total
1 person 0,7% -1,0% 0,2% 0,8%
2 persons -3,8% -0,8% 3,3% -1,3%
3 persons -1,3% -0,4% 0,2% -0,5%
4 persons -0,4% 1,0% 0,0% 1,6% Differences
more than 4 persons 0,1% 0,3% 0,0% 0,4%
total -3,7% -1,0% 4,7% 0,0%
Age group Spain
20-39 years 40-59 years 60 and 74 years total
1 person 3,1% 2,0% 3,1% 8,2%
2 persons 6,3% 5,5% 7,8% 19,5%
3 persons 10,9% 7,8% 5,1% 23,8%
4 persons 13,7% 11,7% 2,0% 27,3% results own survey
more than 4 persons 11,7% 7,8% 1,6% 21,1%
total 45,7% 34,8% 19,5% 100,0%
Age group
20-39 years 40-59 years 60 and 74 years total
1 person 3% 2% 3% 7%
2 persons 7% 5% 8% 20%
3 persons 11% 8% 5% 24%
4 persons 14% 12% 2% 28% Eurostat*
more than 4 persons 11% 8% 2% 21%
total 45% 35% 20% 100%
Age group
20-39 years 40-59 years 60 and 74 years total
1 person -0,1% 0,0% -0,1% -1,2%
2 persons 0,8% -0,5% 0,2% 0,5%
3 persons 0,1% 0,2% -0,1% 0,2%
4 persons 0,3% 0,3% 0,0% 0,7% Differences
more than 4 persons -0,7% 0,2% 0,4% -0,1%
total -0,7% 0,2% 0,5% 0,0%

319
Age group Finland
20-39 years 40-59 years 60 and 74 years total
1 person 7,6% 7,2% 5,2% 19,9%
2 persons 10,0% 13,9% 12,4% 36,3%
3 persons 7,6% 9,6% 1,6% 18,7%
4 persons 8,4% 7,6% 0,0% 15,9% results own survey
more than 4 persons 5,2% 4,0% 0,0% 9,2%
total 38,6% 42,2% 19,1% 100,0%
Age group
20-39 years 40-59 years 60 and 74 years total
1 person 7% 7% 5% 20%
2 persons 10% 14% 11% 35%
3 persons 8% 9% 2% 19%
4 persons 8% 7% 0% 16% Eurostat*
more than 4 persons 5% 4% 0% 10%
total 38% 43% 19% 100%
Age group
20-39 years 40-59 years 60 and 74 years total
1 person -0,6% -0,2% -0,2% 0,1%
2 persons 0,0% 0,1% -1,4% -1,3%
3 persons 0,4% -0,6% 0,4% 0,3%
4 persons -0,4% -0,6% 0,0% 0,1% Differences
more than 4 persons -0,2% 0,0% 0,0% 0,8%
total -0,6% 0,8% -0,1% 0,0%
Age group Hungary
20-39 years 40-59 years 60 and 74 years total
1 person 1,9% 3,9% 5,1% 10,9%
2 persons 6,2% 10,9% 9,7% 26,8%
3 persons 11,7% 10,9% 3,1% 25,7%
4 persons 11,7% 9,3% 1,6% 22,6% results own survey
more than 4 persons 7,8% 5,1% 1,2% 14,0%

320
total 39,3% 40,1% 20,6% 100,0%
Age group
20-39 years 40-59 years 60 and 74 years total
1 person 2% 4% 5% 11%
2 persons 6% 11% 10% 27%
3 persons 11% 11% 3% 25%
4 persons 12% 9% 1% 23% Eurostat*
more than 4 persons 8% 5% 1% 15%
total 40% 40% 20% 100%
Age group
20-39 years 40-59 years 60 and 74 years total
1 person 0,1% 0,1% -0,1% 0,1%
2 persons -0,2% 0,1% 0,3% 0,2%
3 persons -0,7% 0,1% -0,1% -0,7%
4 persons 0,3% -0,3% -0,6% 0,4% Differences
more than 4 persons 0,2% -0,1% -0,2% 1,0%
total 0,7% -0,1% -0,6% 0,0%
Age group Italy
20-39 years 40-59 years 60 and 74 years total
1 person 4,2% 4,5% 3,2% 12,0%
2 persons 8,4% 5,8% 7,5% 21,8%
3 persons 12,0% 10,4% 4,2% 26,6%
4 persons 14,9% 11,4% 1,6% 27,9% results own survey
more than 4 persons 6,5% 4,5% 0,6% 11,7%
total 46,1% 36,7% 17,2% 100,0%
1 person 3% 3% 4% 9%
2 persons 7% 6% 10% 23%
3 persons 12% 10% 5% 27%
4 persons 13% 12% 2% 27% Eurostat*
more than 4 persons 6% 5% 1% 13%

321
total 41% 36% 23% 100%
Age group
20-39 years 40-59 years 60 and 74 years total
1 person -1,2% -1,5% 0,8% -3,0%
2 persons -1,4% 0,2% 2,5% 1,2%
3 persons 0,0% -0,4% 0,8% 0,4%
4 persons -1,9% 0,6% 0,4% -0,9% Differences
more than 4 persons -0,5% 0,5% 0,4% 1,3%
total -5,1% -0,7% 5,8% 0,0%
Age group Poland
20-39 years 40-59 years 60 and 74 years total
1 person 3,2% 4,0% 3,6% 10,7%
2 persons 4,0% 8,3% 7,9% 20,2%
3 persons 9,9% 10,3% 3,2% 23,4%
4 persons 11,9% 9,9% 1,2% 23,0% results own survey
more than 4 persons 11,9% 9,1% 1,6% 22,6%
total 40,9% 41,7% 17,5% 100,0%
Age group
20-39 years 40-59 years 60 and 74 years total
1 person 3% 4% 4% 10%
2 persons 4% 8% 8% 20%
3 persons 10% 10% 3% 23%
4 persons 12% 10% 1% 23% Eurostat*
more than 4 persons 12% 9% 2% 23%
total 42% 41% 18% 100%
Age group
20-39 years 40-59 years 60 and 74 years total
1 person -0,2% 0,0% 0,4% -0,7%
2 persons 0,0% -0,3% 0,1% -0,2%
3 persons 0,1% -0,3% -0,2% -0,4%
4 persons 0,1% 0,1% -0,2% 0,0% Differences
more than 4 persons 0,1% -0,1% 0,4% 0,4%

322
total 1,1% -0,7% 0,5% 0,0%
Age group Sweden
20-39 years 40-59 years 60 and 74 years total
1 person 12,5% 8,6% 5,9% 27,0%
2 persons 7,8% 12,1% 15,2% 35,2%
3 persons 7,0% 7,0% 1,2% 15,2%
4 persons 7,4% 7,8% 0,0% 15,2% results own survey
more than 4 persons 3,5% 3,9% 0,0% 7,4%
total 38,3% 39,5% 22,3% 100,0%
Age group
20-39 years 40-59 years 60 and 74 years total
1 person 12% 9% 6% 27%
2 persons 8% 12% 15% 35%
3 persons 7% 7% 1% 15%
4 persons 8% 8% 0% 16% Eurostat*
more than 4 persons 3% 4% 0% 7%
total 38% 40% 23% 100%
Age group
20-39 years 40-59 years 60 and 74 years total
1 person -0,5% 0,4% 0,1% 0,0%
2 persons 0,2% -0,1% -0,2% -0,2%
3 persons 0,0% 0,0% -0,2% -0,2%
4 persons 0,6% 0,2% 0,0% 0,8% Differences
more than 4 persons -0,5% 0,1% 0,0% -0,4%
total -0,3% 0,5% 0,7% 0,0%

323
Appendix 3.1- 2 Population by household size (results of this survey vs. Eurostat data)
People per household
CZ DE ES FR IT HU PL FI UK SW
1 person 30,3% 35,8% 20,3% 31,0% 24,9% 26,2% 24,8% 37,3% 30,2%
2 persons 28,2% 33,8% 25,2% 31,1% 27,1% 28,8% 23,2% 31,5% 33,9%
3 persons 18,9% 14,5% 21,2% 16,2% 21,6% 19,7% 19,9% 13,6% 15,5%
4 persons 17,5% 11,5% 21,5% 13,8% 19,0% 16,5% 18,0% 11,1% 13,4%
Source: EUROSTAT (2005)83
more than 4 persons 5,2% 4,4% 11,8% 7,9% 7,5% 8,7% 14,1% 6,5% 7,0%
no data
CZ DE ES FR IT HU PL FI UK SW
1 person 13,4% 16,0% 8,4% 13,2% 12,4% 11,2% 10,8% 20,0% 16,0% 26,8%
2 persons 26,3% 40,4% 19,6% 32,4% 20,0% 26,8% 22,0% 36,4% 32,8% 35,6%
3 persons 25,5% 22,0% 23,6% 21,6% 26,4% 26,4% 26,4% 18,4% 24,0% 15,2%
4 persons 26,3% 14,8% 27,6% 20,4% 29,2% 22,4% 21,2% 16,0% 18,0% 15,2%
Results survey
more than 4 persons 8,5% 6,8% 20,8% 12,4% 12,0% 13,2% 19,6% 9,2% 9,2% 7,2%
CZ DE ES FR IT HU PL FI UK
1 person -17% -20% -12% -18% -12% -15% -14% -17% -14%
2 persons -2% 7% -6% 1% -7% -2% -1% 5% -1%
3 persons 7% 7% 2% 5% 5% 7% 6% 5% 8%
4 persons 9% 3% 6% 7% 10% 6% 3% 5% 5%
Differences
more than 4 persons 3% 2% 9% 4% 5% 4% 6% 3% 2%
83
http://epp.eurostat.ec.europa.eu/extraction/retrieve/en/theme3/cens/cens_nheco?OutputDir=EJOutputDir_1244&user=unknown&clientsessionid=2D0572A025FB02509B4413EF05D8A0DC.extraction-worker-1&OutputFile=cens_nheco.htm&OutputMode=U&NumberOfCells=72&Language=en&OutputMime=text%2Fhtml&

324
Appendix 3.1- 3 Population: Households with persons under an age of 18 years (results of this survey vs. Eurostat data. For Sweden, Finland, Poland no data available)

325
4 Task 4: Product system analysis
4.1 DESCRIPTION OF TASK 4 The eco-design directive is referred to product design and not to systems or installations as a whole. However, Annex VII.4 considers the interaction of the specific EuP with the installation/system where it operates, implicitly stating that the possible effects of the EuP being part of a larger system are to be identified and evaluated. This task includes therefore a functional analysis of the system to which the product belongs, including a rough estimate of the overall impacts, for example from IPP studies like EIPRO and an assessment of how the integration of the product into the system and its design can improve its overall environmental performance. Apparently, refrigerators and freezers do not have a strong impact on the installation system that would require modification to the inputs of other subsystems or sectors. Some heat is transferred to the kitchen environment, however a much larger amount comes from other appliances (stoves and ovens) and is in any case already considered through thermostatic control of temperature set in space heating requirements. As such, the existing results of the CEDA EU25 Product and Environmental Model as applied to the use of refrigerators and freezers can be used directly. This is taken as an opportunity to make a controlled comparison between the CEDA top down and LCC bottom up approaches. The environmental impact for use of refrigerators and freezers is given for the EU-25 in vector – A332, CEDA code 540200 – the use of household refrigerators and freezers, which involves both new unit sales and the consumption of electricity for using the new and existing units. What is required is a normalization for inputs between CEDA and LCC methods. Namely unit sales, that is the total new sales for 2005 estimated in Task 5.4, should be scaled to the number of units used in CEDA EU-25. Average prices will make possible this conversion. The sales from production to households of “pure” products such as refrigerators and freezers are given in matrix A12 of the CEDA model. Dividing these sales by the average price should give us unit sales and permit scaling to achieve comparison with the bottom up results to be performed in Subtask 5.6. Also in the CEDA EU-25 model, electricity consumption for these products is given as electricity services (utilities) to the household sector for refrigerators and freezers. This energy consumption, given by dividing by average electricity price, must be normalized for both new purchased units and existing units of the stock. The idea is that the same specific consumption (kWh/year per appliance) should be used for the new sales in 2005 in the CEDA EU25 model and the bottom up LCC approach. The same should be attempted for the existing stock consumption; a different, greater specific consumption will result for existing stock. Also the number of units: base case sales, other sales in 2005 and those in the existing stock (less new sales) for 2005 should be the same inputs for the two methods. If the inputs can be made to be the same, then the differences in results will be due to considering the direct and indirect effects of the input output matrix. Since the input output approach is more complete in its inclusion of the secondary input, such as those materials (and other goods), transport (and other services) and capital inputs to utilities production. With the inversion of the matrix in the

326
input output approach all of the indirect inputs are included. These secondary and tertiary inputs are not always included in LCC analysis and to the extent that they are excluded we would expect more environmental impacts from the input output model. Of course, this assumes that environmental parameters are similar. If the specific energy parameters and the units sold and being used in the stock cannot be scaled to render the inputs comparable between the two methods, either a new simulation with the CEDA EU25 model or a new simulation of the base case, other new models and the stock should be made to enable the correct comparison, using the same units and electricity inputs. In the case of a simulation with CEDA EU25, a minimum amount of support by the authors or the EC will be required.
4.2 SYSTEM BOUNDARY The eco-design directive is referred to product design and not to systems or installations as a whole. However, Annex VII.4 considers the interaction of the specific EuP with the installation/system where it operates, implicitly stating that the possible effects of the EuP being part of a larger system are to be identified and evaluated. This Task includes therefore a functional analysis of the system to which the product belongs, including an assessment of how the integration of the product into the system can change overall energy and environmental performance. Particular attention is given to the actual ambient conditions in which the refrigerators and freezers are used and the other aspects of utilization that that are not included in base cases described in Task 5, such as load and door opening. Probably the most important element in the system is man himself, in the form of user of the appliance and electric utility. The primary objective of this Task is to explore from a systematic point of view the elements, not considered in the base cases, which influence the present and future energy/environmental impact of appliances. Thus we briefly review the results of the consumer use of cold appliances, fully presented in Task 3, and then proceed to the analysis of changing consumer needs, the enriched user/appliance interface and finally the new utility/appliance interface. The part of the task regarding the use of the CEDA EU25 Product and Environmental Model is in a preliminary phase and not yet presented. It was preferred to give priority to specific systems issues that emerged in real use of the appliance and future needs and trends of the consumer. This was necessary for a better understanding of the base cases and long-term scenarios. Apparently, refrigerators and freezers do not have a strong impact on the installation system that would require modification to the inputs of other subsystems or sectors. Some heat is transferred to the kitchen environment, however a much larger amount comes from other appliances (stoves and ovens) and is in any case already considered through thermostatic control of temperature set in space heating requirements. Undoubtedly, this is a very reductive interpretation of the system boundary, characteristic of the 1990’s but not taking into consideration of the advances made in consumer electronics in the last decade. The system boundary we consider is widened to include: i) the kitchen or place of use within the home; ii) the product user, in particular how he/she actually uses the appliance and his/her changing needs for refrigeration and freezing; iii) the enriched user/appliance interface made possible by less and less expensive electronics, displays and Internet; and finally the possibility of a new utility/appliance interface regarding demand side management. This is illustrated in Figure 4.1.

327
Figure 4.1: System elements and boundary
4.3 REAL CONSUMER USE OF REFRIGERATORS AND FREEZERS The results of the study on consumer base case are summarised here, for the complete presentation and discussion of this subject refer to Task 3.
4.3.1 Ambient temperature A surprising result from the survey undertaken in this study for the description of the consumer behaviour - and involving 2.500 European households - was that the average minimum ambient temperature given by respondents was reported at a quite low 15 °C. Seventy percent of households declared to have minimum temperatures below 18 °C; twenty to thirty percent of the households reported to have minimum temperatures below 7 °C, as shown in Figure 2 concentrated in the UK, Italy and Spain.

328
Figure 4.2: Minimum ambient temperatures of the kitchen (or where the refrigerator is located)
The average temperature reported was 19,5 °C considerably below the 25 °C used in the standard test procedures (described in Task 1). The consumer may not accurately represent the temperature behind the refrigerator where the heat exchange is occurring, which might be somewhat higher than the average ambient temperature given that the exchanger is warm and some installations may not have completely free air flow. The maximum temperatures are also surprisingly high: some of the same countries, Spain and Italy (along with Hungary), representing 20% of the households surveyed, had maximum temperatures over 32 °C. In any case, the average temperature is very likely considerably below 25° C the standard test temperature on which the European energy consumption measurements are based. Energy consumption is very sensitive to the ambient temperature: a 1°C reduction in ambient temperature produces a 6% decrease in electricity consumption. The concern is that some users may purchased appliances in an inappropriate climate class84, underestimating their room temperature, which in some cases may not be the kitchens. This is of particular concern with the combination refrigerator-freezers with one compressor and one thermostat, which under extreme cold conditions, outside the range of their climate class, could require extra heating to keep the freezer above the minimum temperature (at which the compressor can function). More detailed surveys and measurements are appropriate to address this situation. In any case increased emphasis should be given to the choice of appropriate climate class of appliances – included in all the forms of consumer information/advice before the purchase, on the appliance, on web sites and in the store. Also for freezers the ambient temperatures were reported much lower than the standard; specifically the average room temperature for category eight and nine freezers was 18 °C, slightly less than that of refrigerators possibly due to the fact that freezers are opened less frequently and thus can be kept in more remote places such as a basement. Forty percent of the household reported rooms with minimum temperatures less than 12 °C, outside the N climatic range, but included in the 84 Climate classes: SN from 10° C to 32° C; SN from 16° C to 32 ° C; ST from 16° C to 38° C; and T from 18° C to 38°C.
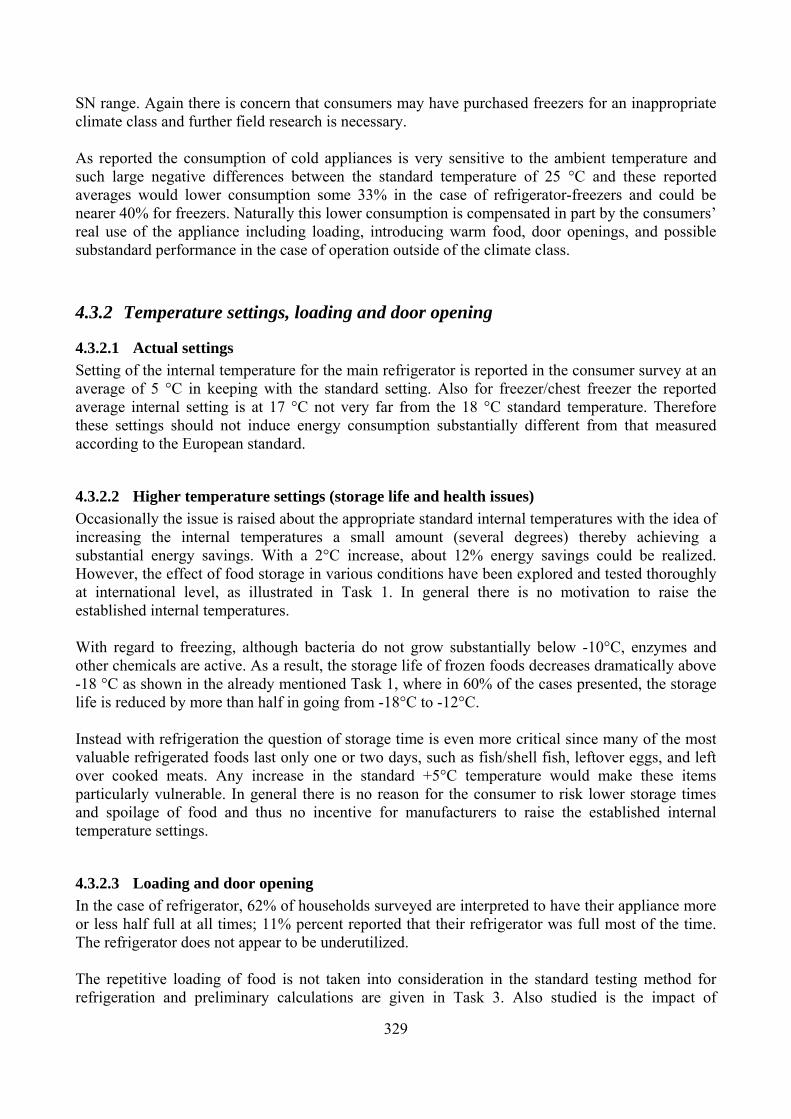
329
SN range. Again there is concern that consumers may have purchased freezers for an inappropriate climate class and further field research is necessary. As reported the consumption of cold appliances is very sensitive to the ambient temperature and such large negative differences between the standard temperature of 25 °C and these reported averages would lower consumption some 33% in the case of refrigerator-freezers and could be nearer 40% for freezers. Naturally this lower consumption is compensated in part by the consumers’ real use of the appliance including loading, introducing warm food, door openings, and possible substandard performance in the case of operation outside of the climate class.
4.3.2 Temperature settings, loading and door opening
4.3.2.1 Actual settings Setting of the internal temperature for the main refrigerator is reported in the consumer survey at an average of 5 °C in keeping with the standard setting. Also for freezer/chest freezer the reported average internal setting is at 17 °C not very far from the 18 °C standard temperature. Therefore these settings should not induce energy consumption substantially different from that measured according to the European standard.
4.3.2.2 Higher temperature settings (storage life and health issues) Occasionally the issue is raised about the appropriate standard internal temperatures with the idea of increasing the internal temperatures a small amount (several degrees) thereby achieving a substantial energy savings. With a 2°C increase, about 12% energy savings could be realized. However, the effect of food storage in various conditions have been explored and tested thoroughly at international level, as illustrated in Task 1. In general there is no motivation to raise the established internal temperatures. With regard to freezing, although bacteria do not grow substantially below -10°C, enzymes and other chemicals are active. As a result, the storage life of frozen foods decreases dramatically above -18 °C as shown in the already mentioned Task 1, where in 60% of the cases presented, the storage life is reduced by more than half in going from -18°C to -12°C. Instead with refrigeration the question of storage time is even more critical since many of the most valuable refrigerated foods last only one or two days, such as fish/shell fish, leftover eggs, and left over cooked meats. Any increase in the standard +5°C temperature would make these items particularly vulnerable. In general there is no reason for the consumer to risk lower storage times and spoilage of food and thus no incentive for manufacturers to raise the established internal temperature settings.
4.3.2.3 Loading and door opening In the case of refrigerator, 62% of households surveyed are interpreted to have their appliance more or less half full at all times; 11% percent reported that their refrigerator was full most of the time. The refrigerator does not appear to be underutilized. The repetitive loading of food is not taken into consideration in the standard testing method for refrigeration and preliminary calculations are given in Task 3. Also studied is the impact of

330
occasionally inserting warm food and the opening of the refrigerator door, which also has been studied internationally. The result of all these loadings and opening of the door, which is certainly much more near true consumer usage of the refrigerator, results in an increase over the base case energy consumption of 16%. It is recalled that operating in much lower ambient temperatures was estimated to decrease the base case consumption by 33%. Given that some appliances may occasionally operate outside their correct climatic class would increase consumption. These compensating factors appear to make the characteristics of the base case measured according to the European standard fairly realistic in the case of refrigerators. Results for freezers (both upright and chest) are analogous. Users report in 34% of the households that the freezer is completely full most of the time and in 48% report it is sometimes completely full and sometimes less full, indicating high utilization on the whole. As in the previous situation the estimates were made for normal loading (hot foods were not introduced into the freezer) and door openings. These resulted in a smaller correction than the refrigerator case due to the fact that amount of the loadings are less and door openings are much less frequent. The additional consumption for this more realistic use of freezers is in the order of one or two percent compared to the energy consumption measured according to the EN standard.
4.3.3 Consumer needs and trends There is a trend to toward slightly larger refrigerators and freezers internal volumes. This trend can be seen from an analysis of the CECED database over the last decade in Table 4.1. The arithmetic average over all cold appliance models produced is shown. Since the number of models for each category is approximately proportional to the number of unit produced and consumed, this average over all models is near the average of all models sold for each year. The average net volume over all categories has gone from 229 to 252 litre, an increase of 10% or 24 litre over the decade. This increase in volume has been widespread: in every appliance category (underlined) where there has been relative frequency growth, there was volume growth. And the converse is true: in the declining categories, volumes have been decreasing. An examination of the equivalent volume reveals that the growth of 24 litre of net volume produced an increase of 32 litre in equivalent volume. Thus the volume growth came from both an increase in freezer volume and refrigeration volume. This trend is thought to represent the changing need of the consumer to engage in less frequent food shopping; and thus the need for buying and storing more food products. It could also be due to a change in family size, but this is declining. Higher incomes might imply a little more food, but more of the income usually goes to discretionary spending. Less time and fewer trips for food shopping could also be a choice by consumer to increase time for other activities.
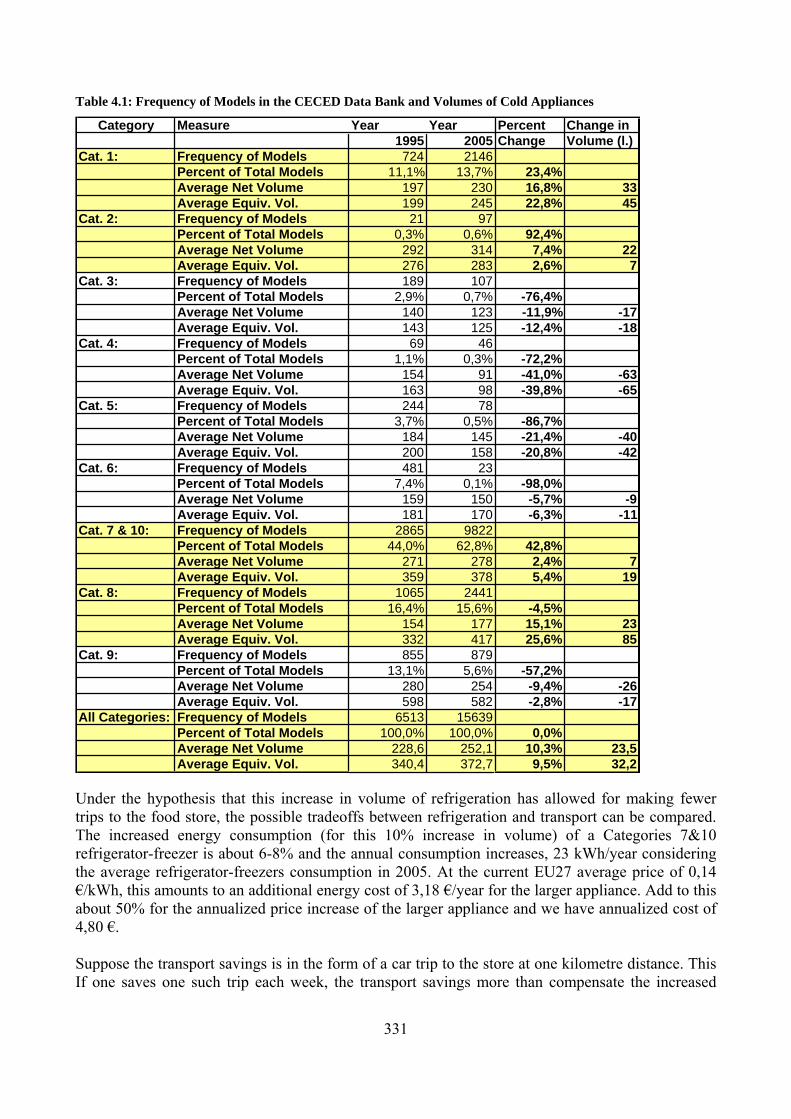
331
Table 4.1: Frequency of Models in the CECED Data Bank and Volumes of Cold Appliances
Category Measure Year Year Percent Change in1995 2005 Change Volume (l.)
Cat. 1: Frequency of Models 724 2146Percent of Total Models 11,1% 13,7% 23,4%Average Net Volume 197 230 16,8% 33Average Equiv. Vol. 199 245 22,8% 45
Cat. 2: Frequency of Models 21 97Percent of Total Models 0,3% 0,6% 92,4%Average Net Volume 292 314 7,4% 22Average Equiv. Vol. 276 283 2,6% 7
Cat. 3: Frequency of Models 189 107Percent of Total Models 2,9% 0,7% -76,4%Average Net Volume 140 123 -11,9% -17Average Equiv. Vol. 143 125 -12,4% -18
Cat. 4: Frequency of Models 69 46Percent of Total Models 1,1% 0,3% -72,2%Average Net Volume 154 91 -41,0% -63Average Equiv. Vol. 163 98 -39,8% -65
Cat. 5: Frequency of Models 244 78Percent of Total Models 3,7% 0,5% -86,7%Average Net Volume 184 145 -21,4% -40Average Equiv. Vol. 200 158 -20,8% -42
Cat. 6: Frequency of Models 481 23Percent of Total Models 7,4% 0,1% -98,0%Average Net Volume 159 150 -5,7% -9Average Equiv. Vol. 181 170 -6,3% -11
Cat. 7 & 10: Frequency of Models 2865 9822Percent of Total Models 44,0% 62,8% 42,8%Average Net Volume 271 278 2,4% 7Average Equiv. Vol. 359 378 5,4% 19
Cat. 8: Frequency of Models 1065 2441Percent of Total Models 16,4% 15,6% -4,5%Average Net Volume 154 177 15,1% 23Average Equiv. Vol. 332 417 25,6% 85
Cat. 9: Frequency of Models 855 879Percent of Total Models 13,1% 5,6% -57,2%Average Net Volume 280 254 -9,4% -26Average Equiv. Vol. 598 582 -2,8% -17
All Categories: Frequency of Models 6513 15639Percent of Total Models 100,0% 100,0% 0,0%Average Net Volume 228,6 252,1 10,3% 23,5Average Equiv. Vol. 340,4 372,7 9,5% 32,2
Under the hypothesis that this increase in volume of refrigeration has allowed for making fewer trips to the food store, the possible tradeoffs between refrigeration and transport can be compared. The increased energy consumption (for this 10% increase in volume) of a Categories 7&10 refrigerator-freezer is about 6-8% and the annual consumption increases, 23 kWh/year considering the average refrigerator-freezers consumption in 2005. At the current EU27 average price of 0,14 €/kWh, this amounts to an additional energy cost of 3,18 €/year for the larger appliance. Add to this about 50% for the annualized price increase of the larger appliance and we have annualized cost of 4,80 €. Suppose the transport savings is in the form of a car trip to the store at one kilometre distance. This If one saves one such trip each week, the transport savings more than compensate the increased

332
refrigerator-freezer energy consumption. With the European average automobile consuming 6,5 litre petrol/km., this amounts to 6,9 litre of petrol/year or 8,30 € at an average price of 1,20 €/litre. In general, as illustrated in Figure 4.3, the consumer can save: travelling less and cooling more, although the real motivation is probably more satisfactory use of his time. The economic breakeven is about 60 km of trips (30 round trips of 2 km) not taken per year. This would imply one less trip every 12 days. In terms of primary energy, there is the same type of advantage as shown in Figure 4.4. Surprisingly the primary energy breakeven is at about the same point around 60 kilometres. Figure 4.3: Cooling and driving tradeoffs: comparison of cost of extra cooling volume vs. savings in fewer trips to food store
0
2
4
6
8
10
12
14
0 50 100 150Annual trips to food store saved (km)
Ann
ual f
uel c
ost s
aved
(Eur
o)
fuel cost saved cost for larger volume appliance

333
Figure 4.4: Comparison of primary energy used for increased volume of refrigerators vs. primary energy saved by reducing the kilometres of trips driven to the food store
0
2
4
6
8
10
12
0 50 100 150Annual trips to food store saved (km)
Ann
ual P
rim
ary
Ene
rgy
save
d (k
g oi
l equ
ival
ent)
fuel saved primary energy electricity primary energy for 10% larger volume appliance
4.4 ENRICHED USER/APPLIANCE INTERFACE Less and less expensive displays, consumer electronics and Internet make possible a much fuller user/cold appliance interface. More measuring devices are incorporated for better control. The consumer is gradually expecting more information about the operation of all his/her products, from automobiles to appliances. In the case of refrigerators and freezers there can be a green light to indicate everything is operating properly and more models are beginning to give information about internal temperatures. Another simple feature would be a display reminding the user that he/she had made certain special settings such as fast freezing, or set the internal temperatures at some exceptional setting considerably different from the standard one. If user is reminded of these exceptional settings he/she can better manage their prompt normalization to standard operating conditions, saving energy. Taking the intelligence of the appliance one step further, the refrigerator or the freezer can manage itself this normalization procedure, setting the internal temperature settings back to normal after a certain amount of time or after the work of additional cooling has become much smaller (and the food reached the proper temperature). The status of seasonal summer/winter switches could be indicated or managed by the appliance based on external temperatures or time. Another area of obvious interest is the indication of abnormal conditions. Courteous or humorous reminders of abnormal conditions, such as prolonged opening of the appliance door would be appreciated and would save energy. An indication of abnormal ambient temperatures could be of help, for example a high temperature near the area of the heat exchanger possibly indicating that ventilation was blocked or that the heat exchanger required cleaning.
334
Larger machines such as automobiles can support diagnostic functions anticipating or avoiding certain malfunctions. Given the lower cost basis for household appliances these maintenance functions are probably too costly, however the more expensive top-of-the-line products may be able to incorporate some. The other area of fascinating new application is the use of radio-frequency identification (RDIF) on food products. These should become commonplace in supermarkets and larger stores within several years. The refrigerator or freezer equipped with a RDIF reader would know what was inside the appliance. This could be seen either on a display screen incorporated in the door or on a computer screen via Internet. A comparison to a list of standard contents would indicate what was lacking and thus constitute a shopping list. For food products that are consumed gradually the RDIF reader could register how many times they were removed/replaced. The appliance electronics or home personal computer could make an estimate of the amount of food products remaining, for even a more accurate shopping list. For products labelled with expiration dates, the appliance/computer could inform the household when certain items were about to expire. Certainly one of the main determinants of the amount of energy required would be the degree that the additional features, such as display screens and computing power, are embodied in the cold appliance or are found on the home personal computer. From a systems point of view the use of a screen and computing power already in the home computer appears to be the best option in terms of energy and environmental impact. It also would allow the consumer to have a central control of all large appliances in addition to the heating/cooling and security system. Some minimum display and functions will probably be provided for those that do not use a home personal computer. For example, display of internal temperatures and warning messages of abnormal conditions could be provided as part of the cold appliance, also for those who do not have a home computer. Devices such as the RDIF reader and digital communication circuitry (for communication with the computer/Internet are required to be in the refrigerator or the freezer if their functions are to be utilized. At the extreme we can have combined appliances, refrigerator/television (screen on the door) or refrigerator/personal computer. Some of these products have begun to appear, however their market penetration appears to be very limited. Energy labelling or other policy measures for such combined appliances would be complicated from a system point of view. For the moment they can be ignored because of the limited number produced.
4.5 NEW UTILITY/APPLIANCE INTERFACE Household electricity demand usually has a strong daily peak between late afternoon and early evening. This peak power requirement causes additional power stations and transmission/ distribution capacity to be built. Even if conventional power stations can absorb part of the peak this implies that normally some stations are working at lower utilization levels and lower efficiency. Better management of peak loads or dynamic demand control (DDC) thus can yield significant energy and capital savings for electric utilities. For appliances that are used discontinuously, such as washing/drying appliances this involves the shift of their time of application to other periods such late night and the familiar use of delay timers

335
on the appliances and of consumer incentives through night tariffs. Instead continuously used appliances such as refrigerators, freezers and air conditioners under DDC can be made to delay or anticipate their on-cycle (or intensify/diminish it) during the periods of high grid load, with little impact on average temperatures. Grid load is easily sensed from the mains frequency that dips slightly under periods of high gird load. DDC appliances therefore need no user intervention. As in the case of night use of washing machines and dishwashers there is no energy savings for the consumer and special night tariffs have been devised to divide the benefits between the user and the utility. The same principle could be extended to the use of DDC, where the utility and client have a direct relationship. This DDC method has been tested on domestic refrigerators in laboratory trials and shows that internal temperatures can remain under control while responding to high grid load.85 No cost information is available as the interfaces are still under development and testing, but presumably the electronics required would be massed produced and utility savings in capacity and energy would offset the cost of the electronics. The power of such an extra chip in the appliance should be negligible, in the order of 0,001 Watt86. If effectiveness is confirmed in wider testing, the detection and control chip could begin to be incorporated into refrigerators and freezes within the decade.
4.6 CEDA EU25 PRODUCT AND ENVIRONMENTAL MODEL 1.8 CEDA EU product and environmental model (Version Cold, Task 4) The outputs of CEDA I/O model of EIPRO are given for year 2003. Unfortunately data and outputs do not exist for more recent years and it outside the scope and means of the present study to update and run this model on more recent data. Therefore we have attempted to take the output of our study and convert it to the conditions of CEDA I/O model.
The first step to use the CEDA model is to extract the total environmental impacts for all economic activity. These are given as scores per impact category in Table 5.1.1 Normalisation values for the EU-25 used in the EIPRO study.87
The total EU-25 impacts in year 2003 for the three impact categories (in common) are:
Global warming GWP100: 4,71E+12 kg CO2 eq/yr
Acidification: (incl. fate, average Europe total , A&B ) 4,31E+10 kg SO2 eq/yr
Eutrophication: (fate not incl.) 1,05E+10 kg PO4 eq/yr
The other impact categories are not in common with that of the methods used in the present study.
85 Market Transformation Programme, Briefing Note XS41: Dynamic demand control of domestic appliances, 30 Mar 2007,www.mtprog.com 86 Personal communication with Simon Leach, Senior Scientist (Domestic Appliances), Intertek RPT, Milton Keynes, MK5 8NL, U.K: 87 Page 97, Annex 5: Annexes to Chapter 5, Environmental Impact of Products (EIPRO), Annex Report, May 2006, Report EUR 22284 EN.
336
These totals are multiplied times their fractional shares of impact for use of household refrigerators and freezers (code 540200) from shares table of the same report.88
The above vector product is divided by the number of families in EU-25 in year 2003, namely 182,126,800 as indicated in the Table 1. The result is the EU-25 environmental impacts per family, per year, for the use of refrigerators and freezers as shown in the sixth column of the table.
From our study, we utilize the environmental impacts reported in Task 3, dividing them by 15 years to obtain the annual impact and multiplying these single product impacts by their respective ownership levels (98,21% for refrigerators and 47,92% for freezers) to obtain the average family impact as illustrated in the last columns of the Table 4.2. From the present study environmental impacts of combination refrigerators/freezers (appliance cold 7) was used together with that for freezers, the average of upright and horizontal freezers (appliance cold 8 and 9).
This now can be compared with the family impact of the I/O model, indicated in the sixth column with that of the present study shown in the adjacent column.
88 Page 179, Annex 5: Annexes to Chapter 5, Environmental Impact of Products (EIPRO), Annex Report, May 2006,
Report EUR 22284 EN.

337
Table 4.2: Comparison of Environmental Annual Impact Per Family (EU -25) for the Use of Refrigerators and Freezers
Comparison for Refrigerators and Freezers:EU25 (2003) EU25 (2003) EU25 (2003) Present Study Present Study
EU25 (2003) Value Fraction due to: Total due to Aver. Family due to (,9821*Refr. + Aver. Refr. (Cold 7)Units (from I/O Model) Summarized Themes Use of Refr + Frez. Use of Refr + Frez. Use of Refr + Frez. 0,4792*Frez.)/15 (over 15 yr. life)kg antimony eq./yr. 1,33E+10 Abiotic depletion 1,17E-02 1,56E+08 0,854kg CO2 eq./yr. 4,71E+12 Global Warming GWP100 1,77E-02 8,34E+10 457,742 311,190 2493,000kg CFC-11 eq./yr. 3,69E+07 Ozone layer depletion 9,82E-03 3,62E+05 0,002kg 1,4-dichlorobenzene eq./yr. 1,91E+12 Human toxicity htp inf. 1,16E-02 2,22E+10 121,652kg 1,4-dichlorobenzene eq./yr. 1,29E+12kg 1,4-dichlorobenzene eq./yr. 5,75E+15kg 1,4-dichlorobenzene eq./yr. 2,64E+11
1,92E+15 Ecotoxicity score(avg.of 3) 1,15E-02 2,20E+13 121056,449kg ethylene eq./yr. 3,84E+10 Photochemical oxidation 8,31E-03 3,19E+08 1,752kg SO2 eq./yr. 4,31E+10 Acidification 2,95E-02 1,27E+09 6,981 1,897 14,994kg PO4---eq./yr. 1,05E+10 Eutrophication 4,11E-03 4,32E+07 0,237 0,040 0,063

338
As can be seen the values are considerably different. If we take the ratio of the I/O model values to that of the present study the ratios are: 1,4, 4,0 and 5,0 for global warming, acidification and eutrophication respectively. While the global warming comparison might be considered acceptable, perhaps due to the fact that the EU-25 average refrigerators and freezers are older and less efficient than our average model and due to the fact that with the indirect inputs of the I/O model the requirements should be more inclusive and thus somewhat greater; such large differences in acidification and eutrophication are not reasonable.
Furthermore, the same methodology of comparison was applied to the washing machines and the ratio of the I/O model impact to present study impacts resulted in factors of 5, 15 and 130 respectively.
We could continue to apply such large difference to the various totals and scenarios; however, it is meaningless without understanding the differences at the more fundamental single family or single appliance level, including the inputs to the I/O model. We do not rule out the possibility that we have misread or misunderstood the I/O model results. It is suggested that these results be posted for comments.

339
5 Task 5: Definition of Base-Case89
5.1 SUBTASK 5.1: DEFINITION OF BASE CASE The feasibility of the first approach for the selection of the base case (13 base cases as developed within the COLD-II study) was evaluated during the first stakeholder meeting against the alternative approach forecasting a reduced number of base cases. The outcome of the discussion was that four base cases are sufficient to describe cold appliances: 1. refrigerator (representing categories 1-6) 2. refrigerator-freezer (representing categories 7 and 10) 3. upright freezers (representing category 8) 4. chest freezers (representing category 9) The following note accompanied also the decision: to be pointed out that no manufacturer, stakeholder or expert will say that any policy measure proposed by the European Commission on the basis of the study output is not valid because the LCC/LCA has not been developed for a product category. This decision (and the note) was circulated, as part of the meeting minutes, on the cold appliances project website with apparently no stakeholder/expert having any negative comment on objection.
5.1.1 The Analysis of the 2005 Technical Database The 2005 technical database collected by CECED includes 15.639 models, divided into the 10 categories defined in the energy labelling directive 94/2/EEC (Table 5.1). The analysis started with the validation of the collected data, mainly in terms of the coherence between the declared Energy Efficiency Class of each model and the relevant annual energy consumption, which implies a coherence of the declared appliance category with the number and type of compartments, their temperature and volume and the presence of other features such as the No-frost system or the built-in possibility. Some additional prescriptions were done to the initial classification in the 10 categories: • appliances with only a cellar compartment have been (re)classified as Category 2, where instead
a more restrictive interpretation of the labelling directive would have classified them as Category 10. However, if the temperature of the cellar compartment is +10°C no difference in the outcome (calculated energy efficiency class) can occur;
• two door appliances having - in addition to one or more 4 star frozen food compartment - a cellar and/or a chill compartment have been classified as Category 10, together with more-than-two-door models. Again, if the design temperature of the compartments remains the same as described in the categories 1-7 of the labelling directive no difference in outcome can occur. This disaggregation of the appliances have been done to evaluate the amount of models with different features compared with the average appliances;
89 Note: the paragraph numbering of this report starts with the number five to be consistent with the final report paging.

340
• refrigerators having in addition to a +5°C compartment a 0°C (chiller) compartment have been considered Category 1 (even if they should possibly be classified as Category 10).
Table 5.1: Distribution of the models by category in the original and the corrected 2005 database
Category Models in the source
database Models in the corrected
database (number) (number) (%) (number) (%)
1 2.111 13,5 2.204 14,1 2 106 0,7 97 0,62 3 142 0,91 107 0,68 4 47 0,30 46 0,29 5 79 0,51 78 0,50 6 20 0,13 23 0,15 7 9.572 61,2 9.535 61,0 8 2.478 15,8 2.441 15,6 9 870 5,56 879 5,62
10.7 214 1,37 229 1,46 Total 15.639 100 15.639 100
The data declared for the best and the worst models were particularly examined for errors as far as the appliances being at the border between two energy efficiency classes. In the validation of the energy efficiency classes, the following additional assumption were made: • cellar temperature has been always considered +10°C (resulting in a Ωc = 0,75), since the exact
design temperature is not known • appliances with an EEI exceeding by 0,1% an energy efficiency class threshold have been
considered as belonging to the most performing class90. The overall process, lead to the following models found non coherent, at least for one of the declared parameters:
Codes n % of non coherent models % over the database
a 86 5,28 0,55 b 201 12,3 1,29 c 683 41,9 4,37
cat* 84 (120) 5,16 0,54 out 509 31,2 3,25 v 66 4,05 0,42
Total 1.629 100 10,42 *when the category is the only non-coherent parameter, into brackets the number of models with a re-assessed category where: - code “a” = calculated EE class better than the declared one - code “b” = borderline model, EEI exceeding by 0,1% the class thresholds - code “c” = probable typing mistake occurred, model has been subsequently corrected 90 for example a model with EEI = 75,1 is considered in class B, while from a strict calculation point of view it should be classified as class C. This because the distinction between a model with EEI = 74,98 and a model with EEI = 75,05 is actually not possible. The difference in EEI can easily be due to a rounding of the compartments volume or of the annual energy consumption.

341
- code “cat” = declared appliance category to be checked, the model has been reclassified into the (considered) correct category on the basis of the elements listed in the database
- code “out” = calculated energy efficiency class worse than the declared one - code “v” = problems with volumes declaration (gross/net or compartments volumes), for most
of the models the volumes have been subsequently corrected. In the end, 509 models (3,2% over the 15.639 total models) were found non-coherent with the relevant energy labelling declaration and have been corrected; 294 of them (43%) were “out of production” models, that is models no more produced in 2005 but still in the database because still sold in the European market. The comparison of the distribution of the models in the energy efficiency classes for the original and the correct database (Table 5.2) shows that the difference between the two databases is negligible. 61% of the models in the validated database belong to Category 7 and 1,5% to Category 10, therefore refrigerator-freezers together are 62,5% of the total models. Upright freezer, with 15,6% is the second most important category, followed by Category 1 (refrigerators without low temperature compartment). Chest freezers (Category 9) follows, accounting only for 5,6% of the models. All the other appliance categories together do not arrive at 2,3% of the total models. The main characteristics of the cold appliance models are presented in Tables 5.3 and 5.4. Gross and net volume, equivalent volume, energy consumption, energy efficiency index and noise in the former, and refrigerant and foaming agent, climatic class and others in the latter. Finally, the models with 2 compressors are 1.356 (or 13,9%) and those with two thermostats 1.333 (or 13,6%), out of 8.071 models declared with 2 doors (or 82,5%) and 968 models (or 9,9%) have both 2 thermostats and 2 compressors. Table 5.2: Comparison of the models distribution in energy efficiency classes in the 2005 original and validated database
All models Refrigerators Freezers original db validated db original db validated db original db validated db
Energy Efficiency
class (n) (%) (n) (%) (n) (%) (n) (%) (n) (%) (n) (%) A++ 290 1,85 288 1,84 133 1,1 131 1,1 157 4,7 157 4,7 A+ 3.164 20,2 3.108 19,9 2.356 19,1 2.269 18,4 808 24,3 839 25,3A 8.837 56,5 8.635 55,2 7.690 62,4 7.547 61,3 1.147 34,6 1.088 32,8B 2.977 19,0 3.133 20,0 2.134 17,3 2.308 18,7 843 25,4 825 24,8C 365 2,33 466 2,98 3 0,02 64 0,5 362 10,9 402 12,1D 2 0,01 7 0,04 2 0,1 7 0,2 E 0 0,0 2 0,01 2 0,1 F 0 0,0 0 0,0 G 0 0,0 0 0,0
Total 15.635 100 15.639 100 12.316 100 12.319 100 3.319 100 3.320 100

342
Table 5.3: Gross & net volume, equivalent volume, energy consumption, energy efficiency index and noise for the cold appliance models in the CECED 2005 technical database
Gross volume Net volume Energy consumption Equivalent volume En. efficiency index Noise Categories min max average min max average min max average min max average min max average min max average
(n) (litre) (litre) (kWh/year) (litre) (EEI) (dB(A)) 1 90 413 236 88 403 231 83,0 241,0 159,7 88,0 477,6 245,5 29,6 78,3 52,9 33 46 38 2 153 414 321 150 390 314 131,0 226,0 164,2 112,5 383,7 282,7 40,4 72,4 53,0 33 40 37 3 70 160 130 67 155 123 102,0 211,0 182,1 68,3 156,8 125,5 38,9 74,9 66,3 35 41 39 4 60 160 103 45 155 91 120,0 208,0 177,4 49,4 158,9 98,1 53,3 79,2 69,6 35 40 38 5 123 323 165 106 290 145 165,0 277,0 217,6 117,9 315,5 158,4 53,2 75,0 68,8 35 44 39 6 120 207 154 118 202 150 207,0 285,0 249,9 137,6 222,7 170,0 54,7 74,9 72,2 34 42 39 7 108 660 294 98 627 277 124,1 786,0 324,1 119,9 1.047,7 377,6 28,0 89,8 54,4 33 48 40 8 50 367 202 45 335 177 135,0 540,2 274,5 96,8 1.037,2 416,6 29,1 105,1 56,3 35 45 40 9 57 601 260 57 572 254 134,0 595,0 300,1 122,6 1.475,8 581,8 27,4 108,2 64,4 37 49 42
10.7 180 523 328 160 501 289 190,0 657,0 336,1 190,6 781,3 443,9 27,3 77,7 50,6 32 45 40 Average 268 251 289,0 372,6 55,2 33 49 40
1-6 60 414 230 45 403 223 83,0 285,0 163,7 49,4 477,6 235,9 29,6 79,2 54,4 33 46 38 7&10.7 108 660 294 98 627 277 124,1 786,0 324,4 119,9 1.047,7 379,2 27,3 89,8 54,3 32 48 40

343
Table 5.4: Refrigerant and foaming agents, climatic class and other characteristics of the cold appliance models in the CECED 2005 technical database
Fresh food compart. volume
Frozen food compt. volume Built-in No-Frost Refrigerant Foaming agent Climatic Class Categories
min max average min min average Yes No Yes No HFC HC Other HFC HC Other ST T Other (n) (litre) (litre) (n) (n) (n) (n) (models number) (models number) (models number) 1 88 403 229 792 1412 146 2.058 60 1.914 228 195 1.812 184 1.266 317 621 2 153 242 199 0 97 0 97 2 95 0 0 97 0 38 22 37 3 62 148 115 24 83 0 107 45 57 5 7 95 5 75 6 26 4 37 148 77 11 35 0 46 13 25 8 19 27 0 5 0 41 5 92 260 129 3 75 0 78 53 24 0 2 67 0 26 7 45 6 101 184 133 14 9 0 23 3 20 0 9 14 0 1 1 21 7 79 413 210 11,0 214,0 66,8 1.810 7.725 1.599 7.936 811 7.979 739 643 8.428 449 5.135 1.564 2.836 8 45,0 335,0 176,9 339 2.102 315 2.126 99 2.169 173 233 2.077 113 870 868 703 9 57,0 572,0 253,9 0 879 68 811 75 768 36 217 576 36 444 140 295
10.7 34 362 174 17,0 119,0 68,2 44 188 100 132 10 199 19 0 207 21 106 79 47 Tot./Aver. 3.037 12.606 2.228 13.415 1.171 13.251 1.208 1.325 13.401 808 7.966 3.004 4.673
1-6 37 403 217 844 1.711 146 2.409 176 2.135 241 232 2.112 189 1.411 353 791 7&10.7 34 413 209 11 214 67 1.854 7.913 1.699 8.068 821 8.178 758 643 8.635 470 5.241 1.643 2.883

344
The annual energy consumption of all the models in the as function of the equivalent volume is presented in Figure 5.1. In Figure 5.2 the models in Categories 1-6 are presented, in Figure 5.3 those in Category 7, in Figure 5.4 those in Category 8 and in Figure 5.5 models in Category 9. The specific energy consumption (in kWh/year equiv_litre) for al the models as function of the equivalent volume is presented in Figure 5.6. The combination of the energy efficiency classes for the models in the ten Categories the technical database, and the aggregated categories to be used for the definition of the base case, is presented in Table 5.5. The same data are shown in Figure 5.7. Table 5.5: Distribution of the cold appliance models in the energy efficiency classes
Category EE Class A++ A+ A B C D E F G Total
(n) 33 496 1.346 319 10 2.204 Category 1 (%) 1,5 22,5 61,1 14,5 0,45 100 (n) 19 59 19 97 Category 2 (%) 19,6 60,8 19,6 100 (n) 4 30 73 107 Category 3 (%) 3,74 28 68,2 100 (n) 10 26 10 46 Category 4 (%) 21,7 56,5 21,7 100 (n) 14 64 78 Category 5 (%) 17,9 82,1 100 (n) 2 21 23 Category 6 (%) 8,7 91,3 100 (n) 96 1.660 6.002 1.735 42 9.535 Category 7 (%) 1,0 17,4 62,9 18,2 0,44 100 (n) 93 548 1.076 605 118 1 2.441 Category 8 (%) 3,8 22,4 44,1 24,8 4,8 0,04 100 (n) 64 291 12 220 284 7 1 879 Category 9 (%) 7,3 33,1 1,4 25,0 32,3 0,80 0,11 100 (n) 2 90 84 51 2 229 Category 10 (%) 0,87 39,3 36,7 22,3 0,87 100 (n) 33 519 1.461 522 20 2.555 Category 1-6 (%) 1,3 20,3 57,2 20,4 0,78 100 (n) 98 1.750 6.086 1.786 44 9.764 Category 7&10 (%) 1,0 17,9 62,3 18,3 0,45 100
5.1.2 The Notary Report of the Industry Voluntary Commitment The industry voluntary commitment defined by CECED in 2002 for cold appliances foresee that an annual Notary Report is delivered to the Commission and Member States. The Notary Report includes the number of units produced/imported for each category and the corresponding weighted average energy consumption (in kWh/year). The report for the year 2005 is available, therefore both the 2004 and 2005 report outcomes are presented. In 2005 about 19,1 million cold appliances were produced/imported for the EU25 market by the signatories of the voluntary commitment: 3,3 million units of Categories 1-6, (17,0%) and 11,8 million (61,3%) for Categories 7&10; Upright freezers were 2,5 million units (or 13,3%) while chest freezers were 1,6 million units (or 8,4%) of the total. In 2004 the share was 3,9 million units

345
Figure 5.1: Energy consumption as function of the equivalent volume for the cold appliance models in the 2005 CECED technical database
0,0
100,0
200,0
300,0
400,0
500,0
600,0
700,0
800,0
0 200 400 600 800 1000 1200 1400 1600
Equivalent volume (litre)
Ene
rgy
cons
umpt
ion
(kW
h/ye
ar)
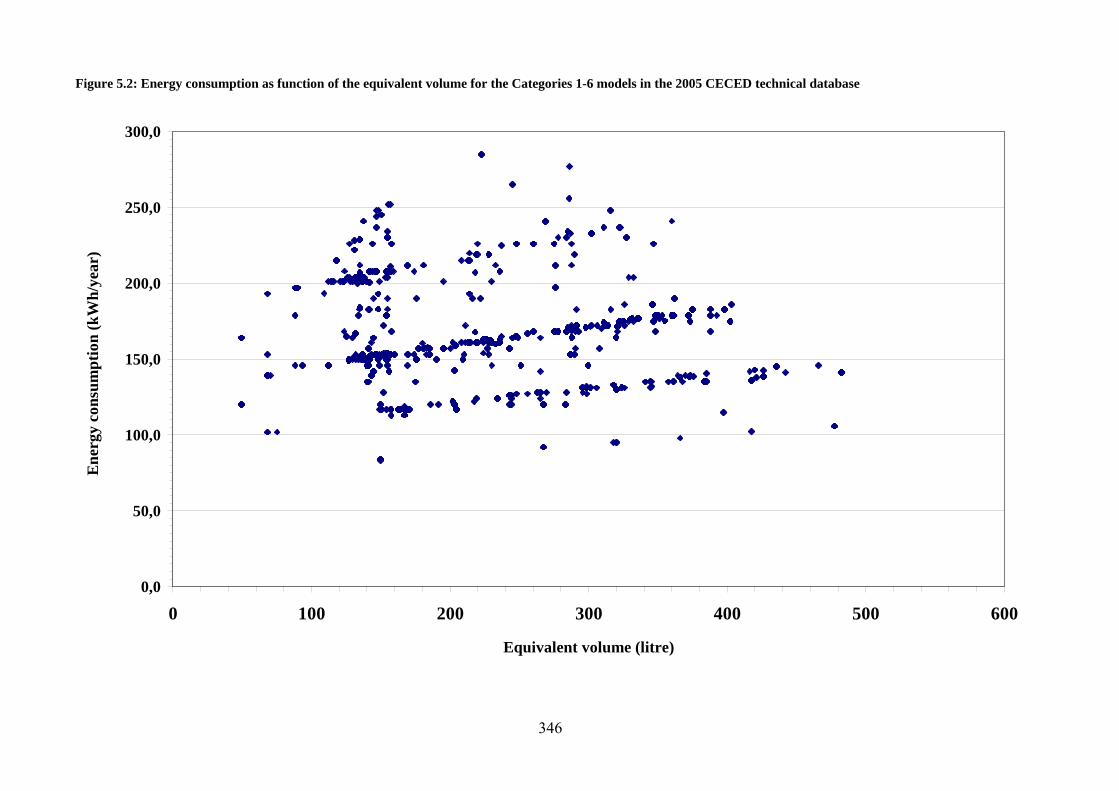
346
Figure 5.2: Energy consumption as function of the equivalent volume for the Categories 1-6 models in the 2005 CECED technical database
0,0
50,0
100,0
150,0
200,0
250,0
300,0
0 100 200 300 400 500 600
Equivalent volume (litre)
Ene
rgy
cons
umpt
ion
(kW
h/ye
ar)

347
Figure 5.3: Energy consumption as function of the equivalent volume for the Category 7 models in the 2005 CECED technical database
0,0
100,0
200,0
300,0
400,0
500,0
600,0
700,0
800,0
0 100 200 300 400 500 600 700 800 900 1000 1100
Equivalent volume (litre)
Ene
rgy
cons
umpt
ion
(kW
h/ye
ar)

348
Figure 5.4: Energy consumption as function of the equivalent volume for the Category 8 models in the 2005 CECED technical database
0,0
100,0
200,0
300,0
400,0
500,0
600,0
0 100 200 300 400 500 600 700 800 900 1000 1100
Equivalent volume (litre)
Ene
rgy
cons
umpt
ion
(kW
h/ye
ar)
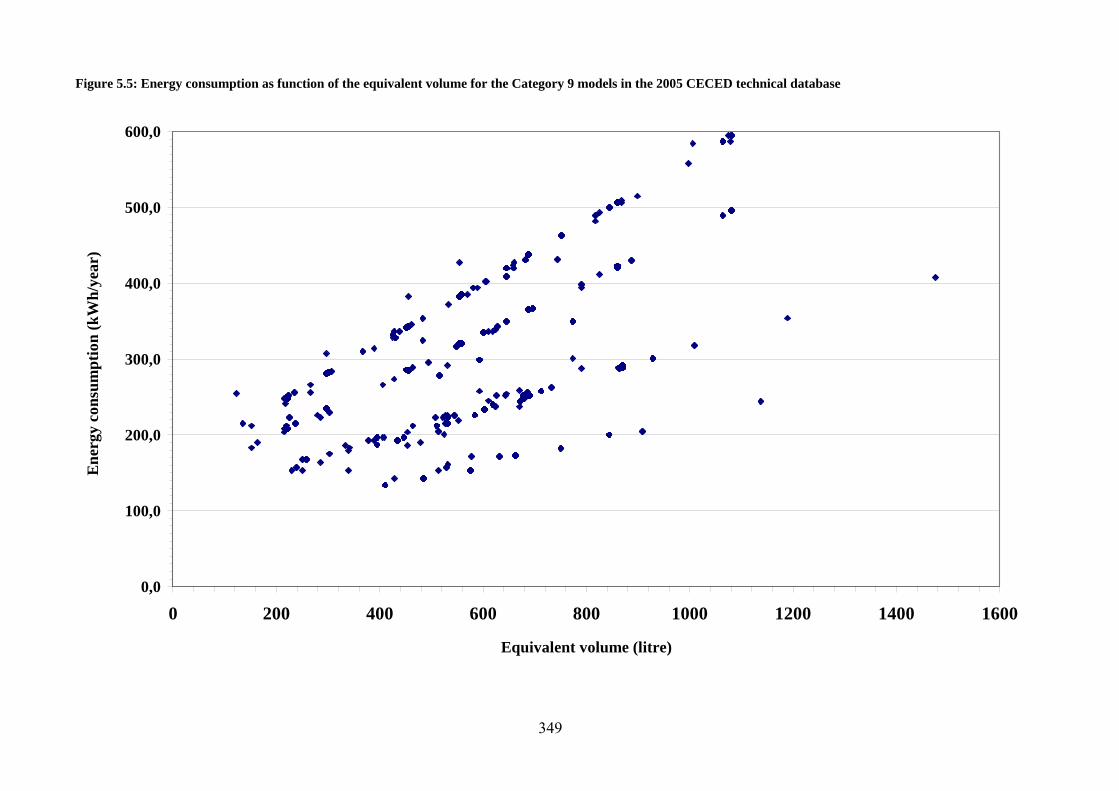
349
Figure 5.5: Energy consumption as function of the equivalent volume for the Category 9 models in the 2005 CECED technical database
0,0
100,0
200,0
300,0
400,0
500,0
600,0
0 200 400 600 800 1000 1200 1400 1600
Equivalent volume (litre)
Ene
rgy
cons
umpt
ion
(kW
h/ye
ar)

350
Figure 5.6: Specific energy consumption as function of the equivalent volume for the models in the 2005 CECED technical database
0,00
0,50
1,00
1,50
2,00
2,50
3,00
3,50
0 200 400 600 800 1000 1200 1400 1600
Equivalent volume (litre)
Spec
ific
ener
gy c
onsu
mpt
ion
(kW
h/ye
ar e
quiv
_litr
e)

351
Figure 5.7: Energy efficiency of the cold appliance categories in the 2005 CECED technical database
Category 1 Category 2 Category 3
A+22,5%
A61,1%
B14,5%
A++1,5%
C0,5%
A+19,6%
A60,8%
B19,6%
A++0,0%
A28,0%
B68,2%
A+3,7%
A++0,0%
Category 4 Category 5 Category 6
A21,7%
B56,5%
A+0,0%
C21,7%
A++0,0%
A17,9%
B82,1%
A+0,0%
A++0,0%
A8,7%
B91,3%
A+0,0%
A++0,0%
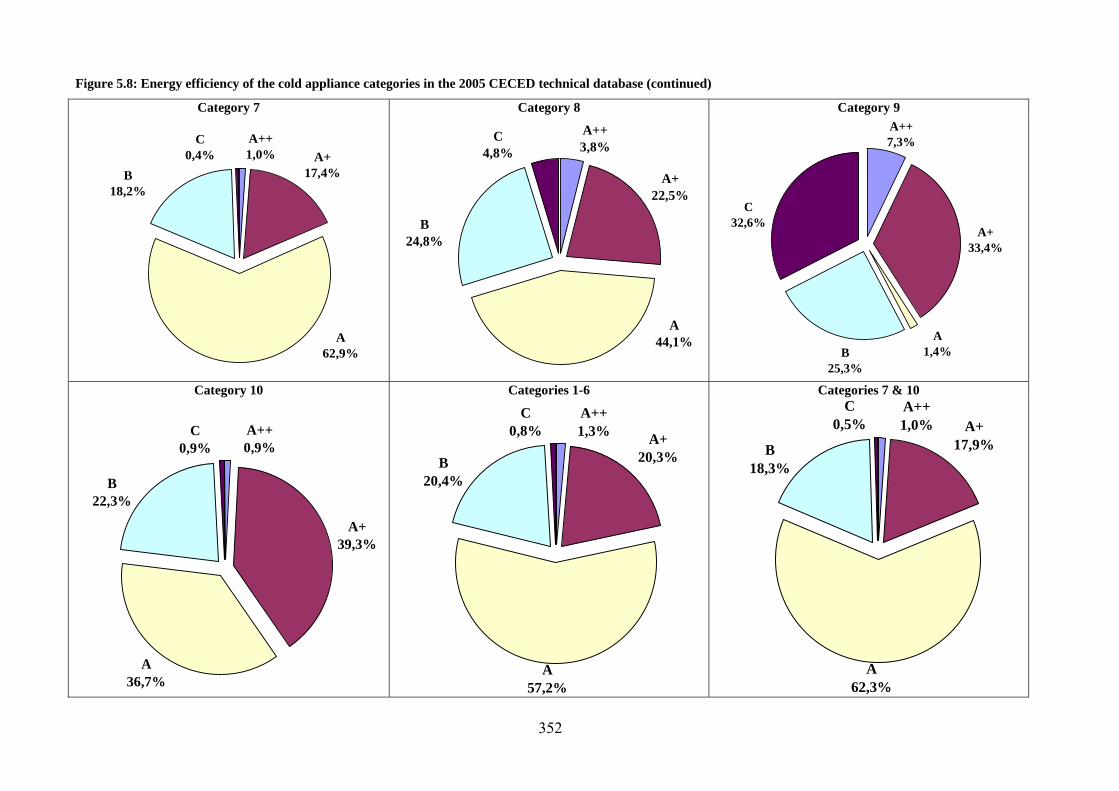
352
Figure 5.8: Energy efficiency of the cold appliance categories in the 2005 CECED technical database (continued)
Category 7 Category 8 Category 9
A62,9%
B18,2%
A+17,4%
C0,4%
A++1,0%
A44,1%
B24,8%
A+22,5%
C4,8%
A++3,8%
A1,4%B
25,3%
A+33,4%
C32,6%
A++7,3%
Category 10 Categories 1-6 Categories 7 & 10
A36,7%
B22,3%
A+39,3%
C0,9%
A++0,9%
A57,2%
B20,4%
A+20,3%
C0,8%
A++1,3%
A
62,3%
B18,3%
A+17,9%
C0,5%
A++1,0%

353
in Categories 1-6, (19,4%), 11,8 million (58,3%) in Categories 7&10, 2,7 million units in Category 8 (or 13,4%) and 1,8 million units (or 8,8%) in Category 9, for a total of about 20,3 million units. In general there is a good correspondence between the number of models in the technical database in 2005 and the production/import for 2005 (Table 5.6) and the distribution of the models in the energy efficiency classes (Table 5.7). Table 5.6: Comparison between the outcome of the Notary Reports 2004-2005 and the technical database 2005 for cold appliances
Technical database 2005 Notary report 2004 Notary report 2005 Category models models models
(number) (number) (%) EEI (103 units) (%) EEI* (103 units) (%) EEI*
1 2.204 14,1 52,9 2.737 13,5 56,7 2.549 13,3 54,8 2 97 0,62 53,0 69 0,34 52,1 130 0,68 53,1 3 107 0,68 66,3 519 2,56 73,2 336 1,75 69,1 4 46 0,29 69,6 149 0,73 75,0 46 0,24 65,0 5 78 0,50 68,8 235 1,16 70,6 186 0,97 69,8 6 23 0,15 72,2 229 1,13 55,2 16 0,08 73,1 7 9.535 61,0 54,4 11.691 57,6 58,4 11.600 60,5 56,1 8 2.441 15,6 56,3 2.726 13,4 60,3 2.542 13,3 56,4 9 879 5,62 64,4 1.792 8,83 73,2 1.608 8,39 66,6 10 229 1,46 51,0 141 0,70 60,6 162 0,84 49,6
Total 15.639 100 55,23 20.288 100 60,35 19.175 100 57,19 *estimated from Notary Report data Table 5.7: Comparison between the outcome of the Notary Report 2004 and the technical database 2005 for the energy efficiency of cold appliances
Technical database 2005 Notary report 2004 Notary report 2005 Category models models models
(number) (number) (%) EEI (103 units) (%) EEI (103 units) (%) EEI
A++ 288 1,84 29,4 81 0,40 29,42 210 1,10 29,44 A+ 3.108 19,9 40,9 1.852 9,13 40,47 2.786 14,5 40,83 A 8.635 55,2 54,0 10.591 52,2 53,25 10.886 56,8 53,90 B 3.133 20,0 70,5 6.225 30,7 71,35 4.622 24,1 71,63 C 466 2,98 86,6 1.225 6,04 87,84 666 3,47 87,63 D 7 0,04 94,4 274 1,35 98,33 1 0,01 97,83 E 2 0,01 106,7 42 0,21 104,77 4 0,02 104,10F 0 0,0 -- 0,531 0,003 120,9 0 0 0 G 0 0,0 -- -- -- -- 0 0 0
Total 15.639 100 55,23 20.291 100 60,35 19.175 100 57,19 Only the average EEI from the models in the technical database (shown in the fourth column of Table 5.7) and the average production/import weighted EEI from the notary report (shown in the last column of the same Table) differ of about 5 points.

354
5.1.3 The Sales Data for 2004 Sales data were collected by GfK, a market research firm specialised in household appliances, for 2002 and 200491. Cold appliance sales for 13 Western Europe (AT, BE, DE, DK, ES, FI, FR, GB, GR, IT, NL, PT, SE) and 8 Eastern Europe (CZ, EE, HU, LT, LV, PL, SI, SK) countries were collected by energy efficiency class and other parameters. The results are presented in Table 5.8, and compared with the analysis of the technical database for the 2005 and the Notary Report for 2004. In the 21 covered countries 14,3 million units were sold, 56,0% of which in class A and 30,0% in class B. Compared with the analysis of the CECED 2004 technical database a 3,3% difference is found for the class B appliances, a 6% for the class A and a 7,2% for the class A+. The difference with the 2004 Notary Report is 6 million units, but there is a good agreement with the break-down by energy efficiency class. Table 5.8: Comparison between the GfK sales data for 2004 and the technical database for cold appliances for 2004
Technical database
Notary Report Western
Europe Eastern Europe EU total
2004 2004
Energy efficiency
class (n) (n) (n) (%) (%) (%)
A++ 20.811 25 20.836 0,15 1,00 0,40 A+ 724.853 56.297 781.150 5,47 12,8 9,13 A 6.865.883 1.138.703 8.004.586 56,0 50,9 52,2 B 3.730.621 559.360 4.289.981 30,0 26,6 30,7 C 798.017 81.535 879.552 6,16 7,02 6,04 D 40.800 1.002 41.802 0,29 1,55 1,35 E 5.330 93 5.423 0,04 0,18 0,21 F 1.902 1 1.903 0,01 0 0,003 G 5.973 1 5.974 0,04 0 --
Unknown 236.929 20.192 257.121 1,80 -- -- Total 12.431.120 1.857.210 14.288.330 100 100 100
5.1.4 The Standard Base Case Characteristics 5.1.4.1 First choice: the average model in the technical database Taking into consideration the analysis developed in the previous paragraphs, the proposed characteristics of the four standard base cases are: • Refrigerator (average of categories 1-6):
free-standing, without No-Frost, one door gross volume: 230 litre net volume: 223 litre energy consumption: 163,7 kWh/year (energy efficiency class A, EEI ≅ 54,4) max climatic class: ST refrigerating agent: HC
91 data for 2005 were too costly for the study budget.

355
foaming agent: HC noise: 38 dB(A)
• Refrigerator-freezer (average of categories 7 & 10):
free-standing, without No-Frost, two doors, top mounted freezer, one thermostat/compressor gross volume: 294 litre net volume: 277 litre fresh food compartment volume 209 litre frozen food compartment volume: 67 litre (4 stars) energy consumption: 324,4 kWh/year (energy efficiency class A, EEI ≅ 54,3) max climatic class: ST refrigerating agent: HC foaming agent: HC noise: 40 dB(A)
• Upright freezer (average of category 8):
free-standing, without No-Frost gross volume: 202 litre net volume: 178 litre frozen food compartment volume: 178 litre (4 stars) energy consumption: 274,5 kWh/year (energy efficiency class A/B, EEI ≅ 56,3) max climatic class: any class refrigerating agent: HC foaming agent: HC noise: 40 dB(A)
• Chest freezer (average of category 9):
free-standing, without No-Frost gross volume: 260 litre net volume: 254 litre frozen food compartment volume: 254 litre (4 stars) energy consumption: 300,6 kWh/year (energy efficiency class B, EEI ≅ 64,4) max climatic class: ST or SN/N refrigerating agent: HC foaming agent: HC/HFC noise: 42 dB(A)
In Tables 5.9-5.12 the characteristics of the four base cases are compared with different average appliances and top of the range models, found in the CECED technical database and in specialised journals. In the same Table, the characteristics of the standard base cases and the corresponding real models selected in the COLD-II study are shown. It is clear, from comparison of the ideal base-case model characteristics with the real base-case model characteristics, that it was not always possible to find models on the market that had features consistent with the ideal ones. 5.1.4.2 Possible alternatives: other frequent model(s) groups in the technical database Through the analysis developed in the following paragraph 5.2.1 a number of possible alternative base cases have been identified and are shown in Figures 5.8-5.12 for the four appliance categories. For refrigerators and upright freezers two other frequent models groups were identified, one larger and one smaller than the category average. For refrigerator-freezers and chest freezers only one models group was identified, larger than the category average.

356
Table 5.9: Results of the improvements for the average refrigerator (categories 1-6) and comparison with the standard base case alternatives in 2005
Cat. Energy consump.
Gross volume
Net volume
Fresh food c.
Frozen food c.
Refriger. agent
Foaming agent Noise Weight Model
(n) (kWh/year)
EEI/ EE Class
(litre) (litre) (litre) (litre)
Climatic class
(type) (type) dB(A) (kg) COLD-II study base cases 1-6
average model 1 249,4 71,4 -- 151,6 -- -- -- -- -- real model 1 223 80,2/C -- 142 142 N -- -- -- --
average model 2 237,9 65,7 -- n.a. -- -- -- -- --
real model 2 241 74,2/B -- 377 241 136 cellar N -- -- -- --
average model 3 257,7 85 -- 187,3 169,1 18,2 -- -- -- -- -- real model 3 226 80,1/C -- 158 151 7 SN -- -- -- --
average model 4 243,5 86 -- 123,1 112,2 10,9 -- -- -- -- -- real model 4 201 74,9/B -- 112 97 15 N/ST -- -- -- --
average model 5 280,5 85,6 -- 141 126,9 14,1 -- -- -- -- -- real model 5 219 70/B -- 136 119 17 N -- -- -- --
average model 6 299,8 81,6 -- 143,4 125,7 17,7 -- -- -- -- -- real model 6 251 74,5/B -- 138 123 15 N -- -- -- --
Production wgt. average, 2004 1-6 n.a. 63,8 n.a. n.a. n.a. n.a. n.a. n.a. n.a. Technical db average, 2005 1-6 163,7 54,4 230 223 ST HC HC 38 n.a. Standard base case, 2005
Alternative 1 (average model) 1 163,7 54,4 230 223 ST HC HC 38 n.a. Alternative 2 (smaller refrigerator) 1 150 53,5 156 153 ST HC HC 37 n.a.
Alternative 3 (larger refrigerator) 1 170 53 300 290 N/SN/ST HC HC 40 n.a. Top of the range, db 2005:
energy consumption 1 83 29,6/A++ 153 150 SN Other Other 36 n.a. EEI 1 83 29,6/A++ 153 150 SN Other Other 36 n.a.
noise 1 120 39,7/A+ 187 185 ST HC HC 33 n.a. *low temperature compartment volume

357
Table 5.10: Results of the improvements for the average refrigerator-freezer (category 7&10.7) and comparison with the standard base case alternatives in 2005
Cat. Energy consump.
Gross volume
Net volume
Fresh food compart. volume
Frozen food comp.
volume
Refriger. agent
Foaming agent Noise Weight Model
(n) (kWh/year)
EEI/ EE
class (litre) (litre)
Climatic class
(litre) (litre) (type) (type) dB(A) (kg) COLD-II study base cases 7
average model (1-door) 7 403,4 ~75 -- 165,4 -- 145,3 20,1 -- -- -- -- real model (1-door) 7 292 60,5/B -- 212 ST 195 17 -- -- -- --
aver. model (2-door manual defrost) 7 530 ~75 -- 284 -- 214 70 -- -- -- -- real model (2-door, BM) 7 555 89,3/C -- 295 N 195 100 -- -- -- -- real model (2-door, TM) 7 511 80,3/C -- 351 N 283 68 -- -- -- --
average model (2-door NoFrost) 7 640,5 >75 -- 347,2 -- 266 81,2 -- -- -- -- real model (2-door, TM, NF) 7 617 89,5/C -- 379 N 304 75 -- -- -- -- real model( 2-door, SbS, NF) 7 710 69,6/B -- 567 ST/T 389 177 -- -- -- --
Production wgt. average, 2004 7 n.a. 58,4 n.a. n.a. n.a. n.a. n.a. n.a. n.a. n.a. n.a. Technical db average, 2005 7&10 324,4 54,3 294 277 ST 209 67 HC HC 40 n.a. Standard base case, 2005
Alternative 1 (average model) 7 324,4 54,3 294 277 ST 209 67 HC HC 40 n.a. Alternative 2 (larger model) 7 337,5 54,0 327 311 any 225 87 any HC 40,5 n.a.
Top of the range, db 2005: n.a.
energy consumption 7 124,1 29,6/ A++ 138 131 SN 115 16 Other Other 38 n.a.
EEI 10.7 190,0 27,3/A++ 303 284 T 200/
15 chill 69 HC HC 37 n.a.
noise 10.7 405,2 74,3 /B 278 255 N 175/
39 chill 41 HC HC 32 n.a.

358
Table 5.11: Results of the improvements for the average upright freezer (category 8) and comparison with the standard base case alternatives in 2005
Cat. Energy consump.
Gross volume
Net volume
Frozen food comp.
volume
Refriger. agent
Foaming agent Noise Weight Model
(n) (kWh/year)
EEI/ EE Class
(litre) (litre)
Climatic class max
(litre) (type) (type) dB(A) (kg) COLD-II study base case: 8
Average model 8 371,5 81,7 -- 117,4 -- 117,4 -- -- -- -- Real model 8 361 95,2/D -- 92 N 92 -- -- -- --
Production wgt. average, 2004 8 n.a. 60,3 n.a. n.a. n.a. n.a. n.a. n.a. n.a. n.a. Technical db average, 2005 8 274,5 56,3 202 177 any 177 HC HC 40 n.a. Standard base case, 2005
Alternative 1 (average model) 8 274,5 56,3 202 178 any 178 HC HC 40 n.a. Alternative 2 (smaller freezer) 8 208 53,7 110 100 any 100 HC/Others HC/Others 40 n.a.
Alternative 3 (larger freezer) 8 269 54,0 230 206 any 206 HFC/HC HC/Others 40 n.a. Top of the range, db 2005:
energy consumption 8 135,0 29,6/A++ 104 101 T 101 Other Other 42 n.a. EEI 8 193,0 29,1/A++ 288 250 T 250 HC HFC 39 n.a.
noise 8 197,0 41,7/A+ 110 94 T 94 HC HC 35 n.a.

359
Table 5.12: Results of the improvements for the average chest freezer (category 9) and comparison with the standard base case alternatives in 2005
Cat. Energy consump.
Gross volume
Net volume
Frozen food comp.
volume
Refriger. agent
Foaming agent Noise Weight Model
(n) (kWh/year)
EEI/ EE Class
(litre) (litre)
Climatic class max
(litre) (type) (type) dB(A) (kg) COLD-II study base case: 9
Average model 9 370 100,2 -- 169,6 -- 169,6 -- -- -- -- Real model 9 270 76,6/C -- 179 N 179 -- -- -- --
Production wgt. average, 2004 9 n.a. 73,2 n.a. n.a. n.a. n.a. n.a. n.a. n.a. n.a. Technical db average, 2005 9 300,1 64,4 260 254 ST/SN-N 254 HC HC 42 n.a. Standard base case, 2005
Alternative 1 (average model) 9 300,6 64,4 260 254 ST/SN-N 254 HC HC 42 n.a. Alternative 2 (larger freezer) 9 320 75 262 257 N/ST/T 257 HC HC/HFC 42,5 n.a.
Top of the range, db 2005: energy consumption 9 134,0 27,9/A++ 163 159 T 159 HC HC 43 n.a.
EEI 9 153,0 27,4/A++ 229 223 T 223 HC HC 39 n.a. noise 9 197,1 39,7/A+ 198 189 ST 189 HC HC 37 n.a.

360
Figure 5.9: Energy consumption as function of the volume for the Categories 1-6 models in the 2005 CECED technical database and possible alternative for the base case selection
0,0
50,0
100,0
150,0
200,0
250,0
300,0
0 50 100 150 200 250 300 350 400 450Net volume (litre)
Ene
rgy
cons
umpt
ion
(kW
h/ye
ar)
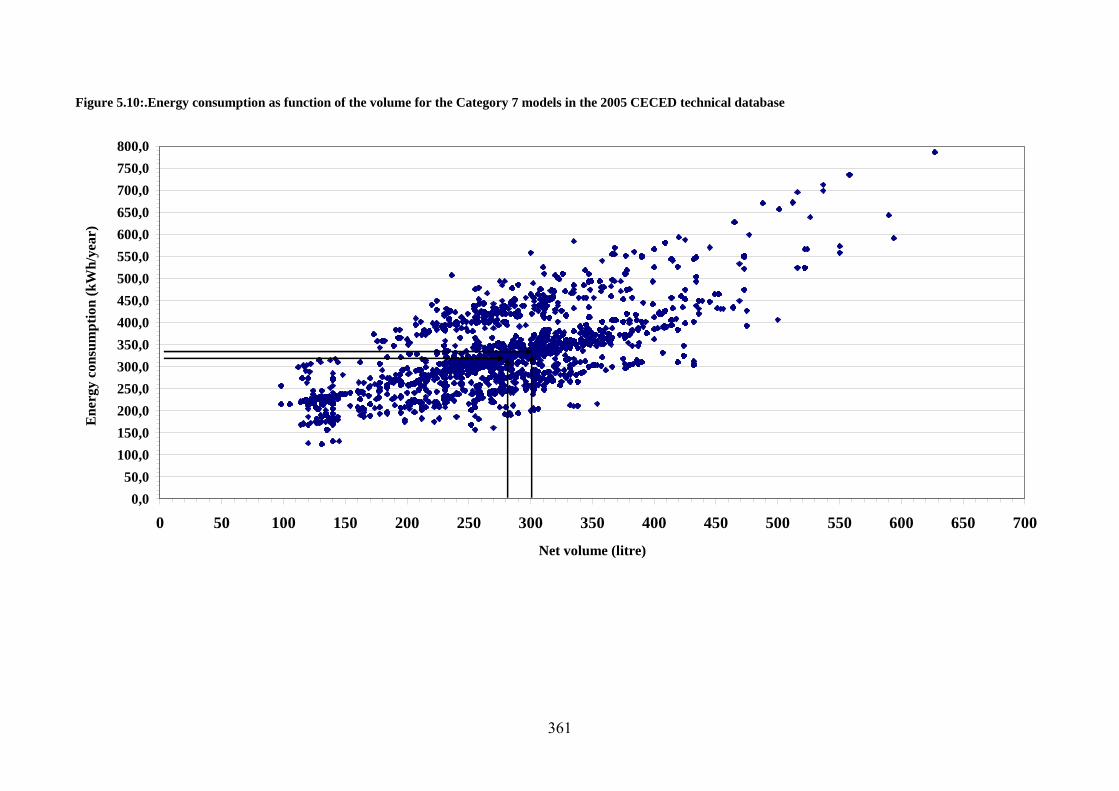
361
Figure 5.10:.Energy consumption as function of the volume for the Category 7 models in the 2005 CECED technical database
0,050,0
100,0150,0200,0250,0300,0350,0400,0450,0500,0550,0600,0650,0700,0750,0800,0
0 50 100 150 200 250 300 350 400 450 500 550 600 650 700
Net volume (litre)
Ene
rgy
cons
umpt
ion
(kW
h/ye
ar)

362
Figure 5.11: Energy consumption as function of the volume for the Category 8 models in the 2005 CECED technical database
0,0
50,0
100,0
150,0
200,0
250,0
300,0
350,0
400,0
450,0
500,0
550,0
600,0
0 50 100 150 200 250 300 350 400
Net volume (litre)
Ene
rgy
cons
umpt
ion
(kW
h/ye
ar)

363
Figure 5.12: Energy consumption as function of the volume for the Category 9 models in the 2005 CECED technical database
0,0
50,0
100,0
150,0
200,0
250,0
300,0
350,0
400,0
450,0
500,0
550,0
600,0
0 50 100 150 200 250 300 350 400 450 500 550 600 650Net volume (litre)
Ene
rgy
cons
umpt
ion
(kW
h/ye
ar)

364
In general the number of real models in the alternative groups of similar models is lower than or close to the number of models found for the category average. Therefore there are no real advantages in the use an alternative group of models instead of the average model in the database as standard base case.
5.1.5 The Real Life Base Case Characteristics In general, for the definition of the “Real Life Base Case” (RLBC) the characteristics of the average sold appliance are considered. However, during the development of Task 3, it was evaluated that this differentiation is not useful for cold appliances. All the collected information on the consumer behaviour allowed to estimate the difference between the energy consumption under real life and standard conditions. Due to the lower ambient temperature in real life, compared to the 25°C used in the European standard, the energy consumption of the cold appliances is considerably lowered. Part of this saving is balanced by the cooling of new loaded food and the air which is exchanged when opening the door. So all in all the measured energy consumption under standardised consumption is somehow taking care of the real life behaviour, including the possible additional energy consumption for refrigerator-freezers operated at very low ambient temperatures.
5.2 SUBTASK 5.2: PRODUCT-SPECIFIC INPUTS Product-specific inputs are necessary for the development of the LCA and are collected for the following life phases:
• Production (raw materials, components and assembling) • Distribution of products (average distances and types of transport modes) • Use (average life, specific consumption, maintenance and repairs) • Packaging (type and weight) • End of Life (disposal, thermal valorisation, incineration, dismantling…)
These data will be collected and organised according to the “EuP Eco Report” requirements and to the LCA ISO 14040 norms. Similarly, the methodology used for the LCA assessment will be, at first glance, based on the EuP-Ecoreport settings, but it will be, as close as possible, also compared and aligned with the LCA standard methodology by using others LCA software and data (like, i.e. the Simapro tool and databases).
Primary input data come from direct communication with producers and/or, if not available, collected on sector specific or commercial data base (secondary data) for both the standard and (if identified) the real base cases. Product-specific inputs are gathered through a specific “BOM and Inventory Data Template” prepared by the study Team to simplify and standardise the elementary information collection.
Manufacturers are requested to collect the information listed in the BOM and Inventory Data Template for a real appliance they produce, whose characteristics are as close as possible to those of the identified standard base cases.
5.2.1 The Selection of Real Models for Data Collection To facilitate manufacturers data collection task a specific research has been developed in the CECED 2005 technical database to evaluate (i) how many real models do exist close to the standard

365
base cases; (ii) how close the characteristics of these models comply with those of the base cases; (iii) other frequent model(s) in the database and their possible selection as alternative base case(s) 5.2.1.1 Availability of average models in the technical database The analysis lead to the identification of four sets of real models, close to the average model proposed as standard base case, with the following characteristics: • Refrigerator (average of categories 1-6),
free-standing, without No-Frost, Category 1 gross volume: 221-253 litre net volume: 219-236 litre dimensions:
- height: 117-129 cm - length: 54,0-59,3 cm
energy consumption: 160-163,2 kWh/year (EEI ≅ 53,5-54,9) max climatic class: ST refrigerating agent: HC/Others foaming agent: HC/Others noise: 34-41 dB(A) 65 models were found in the described range.
• Refrigerator-freezer (average of categories 7 & 10):
free-standing, without No-Frost, two doors, one thermostat/compressor, Category 7 gross volume: 267-293 litre net volume: 275-278 litre dimensions:
- height: 143-186 cm - length: 54-60 cm
fresh food compartment volume 199-219 litre frozen food compartment volume: 61-78 litre (4 stars) energy consumption: 307-329 kWh/year (EEI ≅ 53,5- 55,1) max climatic agent: ST refrigerating fluid: HC foaming agent: HC noise: 38-44 dB(A) 206 models were found in the described range.
• Upright freezer (average of category 8):
free-standing, without No-Frost gross volume: 190-210 litre net volume: 164-190 litre dimensions:
- height: 123-156 cm - length: 59,3-66 cm
frozen food compartment volume: 164-190 litre (4 stars) energy consumption: 248-273 kWh/year (EEI ≅ 54,2-59) max climatic class: any class refrigerating agent: HC/Others foaming agent: HC/HFC noise: 36-43 dB(A) 92 models were found in the described range.
• Chest freezer (average of category 9):
free-standing, without No-Frost gross volume: 257-265 litre net volume: 247-260 litre dimensions:
366
- height: 85-89 cm - length: 93,5-119 cm
frozen food compartment volume: 247-260 litre (4 stars) energy consumption: 292-321 kWh/year (energy efficiency class B, EEI ≅ 70-75) max climatic class: N/ST/T refrigerating agent: HC foaming agent: HC/HFC noise: 38-45 dB(A) 34 models were found in the described range.
The number of real models presenting characteristics similar to the relevant standard base case is not extremely large for some appliance categories, but hopefully sufficient to allow most of the producers to provide the relevant BOM and inventory data. In fact, if a too low number of real models is found, the implicit risk is that some manufacturers will not be able provide the BOM and inventory data because, although producing cold appliances, none of their own models is sufficiently close to the standard base cases characteristics. On the other side, if the collected BOM and inventory data refer to models with too different characteristics, then the averaged data input in the LCA will not be representative of the single models. In both cases the development of a representative LCA will be critical. 5.2.1.2 Other frequent model(s) in the technical database A second attempt was run to evaluate the possibility to find, in the technical database, a large number of real cold appliance models with similar characteristics, and then to evaluate if the average characteristics of this group(s) of models can be proposed as an alternative base case(s). For refrigerators two alternative groups of similar models could be identified: • Alternative 2 - Refrigerator (average of categories 1-6):
free standing, without No-Frost gross volume: 154-158 litre net volume: 151-155 litre dimensions:
- height: 82-87,8 cm - length: 54,1-59,5 cm
energy consumption: 146-154 kWh/year (energy efficiency class A, EEI ≅ 52-55) max climatic class: ST refrigerating agent: HC/Others foaming agent: HC/Others noise: 35-39 dB(A) 53 models were found in the described range.
• Alternative 3 - Refrigerator (average of categories 1-6):
free standing, without No-Frost gross volume: 285-320 litre net volume: 284-293 litre dimensions:
- height: 143-160 cm - length: 59,5-60,0 cm
energy consumption: 168-172 kWh/year (energy efficiency class A, EEI ≅ 51,5-55) max climatic class: N/SN/ST refrigerating agent: HC foaming agent: HC noise: 38-42 dB(A) 52 models were found in the described range.
367
In Table 5.13 the average characteristics of the two alternative groups of models are shown and compared with the initially proposed average model characteristics. For refrigerator-freezers one alternative group of similar models could be identified: • Alternative 2 - Refrigerator-freezer (average of categories 7&10):
free standing, without No-Frost, two doors, one thermostat/compressor gross volume: 308-346 litre net volume: 303-319 litre dimensions:
- height: 175-191 cm - length: 59,3-60 cm
fresh food compartment volume 220-229 litre frozen food compartment volume: 82-92 litre (4 stars) energy consumption: 329-346 kWh/year (EEI ≅ 53,3- 55,1) max climatic class: N/SN/ST refrigerating agent: HC/HFC/Others foaming agent: HC noise: 38-43 dB(A) 166 models were found in the described range.
In Table 5.14 the average characteristics of this group are shown and compared with the initially proposed average model characteristics. For upright freezers two alternative groups of similar models could be identified: • Alternative 2 - Upright freezer (average of category 8):
free standing, without No-Frost gross volume: 217-243 litre net volume: 202-210 litre dimensions:
- height: 145-160 cm - length: 59,3-66 cm
frozen food compartment volume: 202-210 litre (4 stars) energy consumption: 266-271 kWh/year (EEI ≅ 53,8-54,3) max climatic class: any class refrigerating agent: HFC/HC foaming agent: HC/Others noise: 37-42 dB(A) 99 models were found in the described range.
• Alternative 3 - Upright freezer (average of category 8):
free standing, without No-Frost gross volume: 101-120 litre net volume: 95-104 litre dimensions:
- height: 82-85 cm - length: 55-60 cm
frozen food compartment volume: 95-104 litre (4 stars) energy consumption: 204-212 kWh/year (EEI ≅ 52,6-54,9) max climatic class: any class refrigerating agent: HC/Others foaming agent: HC/Others noise: 38-42 dB(A) 97 models were found in the described range.
In Table 5.15 the average characteristics of the two alternative groups of models are shown and compared with the initially proposed average model characteristics.

368
For chest freezers one alternative group of similar models could be identified: • Alternative 2 - Upright freezer (average of category 8):
free standing, without No-Frost gross volume: 261-265 litre net volume: 255-260 litre dimensions:
- height: 87.89 cm - length: 94-119 cm
frozen food compartment volume: 255-260 litre (4 stars) energy consumption: 317-321 kWh/year (EEI ≅ 75) max climatic class: N/ST/T refrigerating agent: HC foaming agent: HC/HFC noise: 40-45 dB(A) 33 models were found in the described range.
The only parameter significantly modified compared with Alternative 1 is the energy efficiency index. In Table 5.16 the average characteristics of this group are shown and compared with the initially proposed average model characteristics. In general the number of real models in the alternative groups of similar models is lower or close to the average of the category in the database. Therefore there are no clear advantages in the use of an alternative group of models instead of the average models in the database as standard base cases.
5.2.2 Base-cases According to the findings of paragraph 5.1, here below are summarized the characteristics of the four models chosen as base-cases.
1. Refrigerator (average of categories 1-6): free-standing, without No-Frost, one door gross volume: 230 litre net volume: 223 litre energy consumption: 163,7 kWh/year (energy efficiency class A, EEI ≅ 54,4) max climatic class: ST refrigerating agent: HC foaming agent: HC noise: 38 dB(A)
2. Refrigerator-freezer (average of categories 7 & 10):
free-standing, without No-Frost, two doors, top mounted freezer, one thermostat/compressor gross volume: 294 litres net volume: 277 litres fresh food compartment volume 209 litres frozen food compartment volume: 67 litres (4 stars) energy consumption: 324,4 kWh/year (energy efficiency class A, EEI ≅ 54,3) max climatic class: ST refrigerating agent: HC foaming agent: HC noise: 40 dB(A)

369
Table 5.13: Average characteristics of the alternative groups of similar models in the CECED 2005 technical database for refrigerators (Categories 1-6)
Cat. Energy consump.
Specific en.cons.
Gross volume
Net volume
Refriger. agent
Foaming agent Noise Real
models Model (n) (kWh/year) (kWh/y l)
EEI/ EE Class
(litre) (litre)
Climatic class
(type) (type) dB(A) (n) Technical db average, 2005 1-6 163,7 0,734 54,4 230 223 ST HC HC 38 -- Model groups:
Alternative 1 (average model) 1 163,7 0,734 54,4 230 223 ST HC HC 38 65 Alternative 2 (smaller refrigerator) 1 150 0,980 53,5 156 153 ST HC HC 37 53
Alternative 3 (larger refrigerator) 1 170 0,586 53 300 290 N/SN/ST HC HC 40 52 Table 5.14: Average characteristics of the alternative groups of similar models in the CECED 2005 technical database for refrigerator-freezers (Categories 7&10.7)
Cat. Energy consump.
Gross volume
Net volume
Fresh food compart. volume
Frozen food comp.
volume
Refriger. agent
Foaming agent Noise Real
models Model (n) (kWh/year)
EEI/ EE
class (litre) (litre)
Climatic class
(litre) (litre) (type) (type) dB(A) (n) Technical db average, 2005 7&10 324,4 54,3 294 277 ST 209 67 HC HC 40 n.a. Model groups:
Alternative 1 (average model) 7 324,4 54,3 294 277 ST 209 67 HC HC 40 206 Alternative 2 (larger model) 7 337,5 54,0 327 311 any 225 87 any HC 40,5 166

370
Table 5.15: Average characteristics of the alternative groups of similar models in the CECED 2005 technical database for upright freezers (Category 8)
Cat. Energy consump.
Gross volume
Net volume
Frozen food comp.
volume
Refriger. agent
Foaming agent Noise Real
models Model
(n) (kWh/year)
EEI/ EE class
(litre) (litre)
Climatic class max
(litre) (type) (type) dB(A) (n) Technical db average, 2005 8 274,5 56,3 202 177 any 177 HC HC 40 n.a. Model groups:
Alternative 1 (average model) 8 274,5 56,3 202 177 any 177 HC HC 40 92 Alternative 2 (smaller freezer) 8 208 53,7 110 100 any 100 HC/Others HC/Others 40 97
Alternative 3 (larger freezer) 8 269 54,0 230 206 any 206 HFC/HC HC/Others 40 99 Table 5.16: Average characteristics of the alternative groups of similar models in the CECED 2005 technical database for chest freezers (Category 9)
Cat. Energy consump.
Gross volume
Net volume
Frozen food comp.
volume
Refriger. agent
Foaming agent Noise Real
models Model
(n) (kWh/year)
EEI/ EE class
(litre) (litre)
Climatic class max
(litre) (type) (type) dB(A) (n) Technical db average, 2005 9 300,1 64,4 260 254 ST/SN-N 254 HC HC 42 n.a. Model groups:
Alternative 1(average model) 9 300,1 64,4 260 254 ST/SN-N 254 HC HC 42 34 Alternative 2 (less efficient freezer) 9 320 75 262 257 N/ST/T 257 HC HC/HFC 42,5 33
371
3. Upright freezer (average of category 8):
free-standing, without No-Frost gross volume: 202 litres net volume: 178 litres frozen food compartment volume: 178 litres (4 stars) energy consumption: 274,5 kWh/year (energy efficiency class A/B, EEI ≅ 56,3) max climatic class: any class refrigerating agent: HC foaming agent: HC noise: 40 dB(A)
4. Chest freezer (average of category 9): free-standing, without No-Frost gross volume: 260 litres net volume: 254 litres frozen food compartment volume: 254 litres (4 stars) energy consumption: 300,6 kWh/year (energy efficiency class B, EEI ≅ 64,4) max climatic class: ST or SN/N refrigerating agent: HC foaming agent: HC/HFC noise: 42 dB(A)
5.2.3 Data from manufacturers For each of the above outlined models, the manufacturers have been required to fill specific inventory tables as described below.
The following table shows the data provided from manufacturers for each of the four categories.
Appliances Code Data from manufacturers
Refrigerator (average of categories 1-6)
COLD 1 5
Refrigerator-freezer (average of categories 7 & 10)
COLD 7 5
Upright freezer (average of category 8)
COLD 8 5
Chest freezer (average of category 9)
COLD 9 4
The majority of the data sheets provided by the manufacturers were in line with the requirements of the consultant and quite complete. The following are the main remarks regarding the data provided initially:
• Only some producers have provided data on specific devices or operative situations (as: stand-by mode, off-mode, information on maintenance, end of life data)
• Production: o Material: data are sufficiently complete; some manufacturers produced data on
“assembled components” (mainly compressors), without indication on the material composition.
o Scrap: general data (% and EoL) do not represent all materials used;

372
o Processing: information is provided, sometimes it is exhaustive, often it is generic and incomplete;
o Transport: data (average kms and transport mode) are often complete, but sometimes, the data are not available;
• Assembly: data are generally complete; sometimes units of measure are not that required in inventory data sheets;
• Use phase: data are occasionally incomplete and units of measure are not that required in inventory data sheets;
• End of Life: some producers provided congruent indications, some data are difficult to understand and to use.
In order to have clarification and additional information regarding the received data, the following comments and questions were sent to the producers:
• Production: generally only total weight for compressor and some “objects” were available; also composition could be useful if available. If no data was available, data from other producers (at least one has furnished compressor weight and material composition) have been used.
• Processing: sometimes only generic data is available; if possible specify details. As an alternative data from other producers has been used. When no % was indicated we have supposed 100% of that process. Sometimes there is no data for compressor and ferrous materials.
• Scrap and EoL: When no data is available or only partial data for materials is presented, data from other producers have been be used.
• End of life: When no indications or only generic indications are present, the EU average for each material or data form other producers have been used. Clarification regarding specific recovery systems were requested.
Up to now answers from three producers have been received, as summarised:
Production: Data on compressor composition have been received from two producers. In any case, there is general agreement on the data to use from others producers.
Processing: A brief description of the processing used in its own factories has been received from a producer. Also in this case, general agreement has been reached on the data to be used from other producers.
Scrap and EoL: No more data is available. Agreement was reached to use data from other producers (when available).
End of life: Clarification and indications regarding specific systems have been received. There is general agreement on the use of EU average figures and data on specific recovery systems.
Taking into account these indications, in order to define the “average models”, the following assumptions and simplifications have been made:
• Production: o Integration of “similar” or “analogous” materials; o Detailed data for assembled components is divided in the inventory table as part of
“main categories”, as ferrous metals, non ferrous metals, plastics, etc; o For assembled components, without indication of material composition, data have
been used only to define the total weight, but they were not taken into consideration for average material composition;

373
o As general approach of “linear average” was used for available data; if data was given from one producer only, this case was used without elaboration;
o For scrap, EoL of scrap and processing data from producers that gave the most complete and detailed data have been used;
o For the average distance calculation, average values of Km for each model were considered (by the weighted average of km of transport for each material); a new weighted average has been made with obtained data, according to the total weight of each model.
• Assembling: o Unit of measure conversion was applied, when necessary; o Obtained data have been used in the “linear average approach”;
• Use phase: o Unit of measure conversion was applied, when necessary; o Obtained data have been used in the “linear average approach”;
• End of Life: o Available data were often not comparable and construction was not easy. In this case
most complete and congruent data were used, as representative of the average model.
Here following averages models are presented. It has to be noted that:
• Production, assembly, use, and end of life phases are shown separately for every average model;
• For the production phase: o scrap percentage and end of life have been assumed to be always the same,
independent of the model; figures have been selected from an overview of all cold models;
o also for main processing, it was assumed to be always the same, independent of the model; figures have been selected from an overview of all cold models;
o for transport, we have calculated average km for every model and then a second average km for every average model; in this way fours figures, one for every cold model, have been obtained
o For compressors, two manufacturers produced data on material composition; according to this the following average composition for compressor was used:
Compressor (%) Fe / cast iron 0,840Cu 0,105Al 0,020Plastics 0,011Lubricating oil 0,025
• For end of life, according to the received data, average values for different processes (recycling, energy recovery, dismantling, land filling) were used, often, for all the materials.

374
5.3 BASE-CASE ENVIRONMENTAL IMPACT ASSESSMENT In this subtask product specific inputs, developed in sub-task 5.3 for cold appliances, are used to define environmental profile and impact analysis .
The system used is the EuP EcoReport, version 5 (see http://www.eupproject.org/) ; by this system it is possible to indicate the environmental impact analysis, specifying for:
• Raw Materials, Manufacturing, transport; • Distribution; • Use; • End-of-Life Phase.
EuP Ecoreport outputs are expressed as:
• Material consumption; • Other resources and Waste as:
o Total energy (including electricity); o Water (process and cooling); o Waste (hazardous and non-hazardous)
• Emission (air) as : o GWP; o ODP; o Acidification; o VOC; o POP; o Heavy metals; o PAHs; o Particulate matter (PM, dust).
• Emission (water) as : o Heavy metals; o Eutrophication; o POP.
5.3.1 Considerations and assumptions to use inventory data in EuP Ecoreport In order to use inventory data from subtask 5.2 in EuP Ecoreport methodology, some considerations and assumptions are required.
The main elements to be considered are:
• Production phase: o Data on Scrap, processing (“manufacturing” in EuP Ecoreport) and
transport cannot be used; fixed values are already considered in value reported in EuP. Only for “sheet metal scrap” it is possible to adjust %.
• Distribution phase: o Only “volume of packaged final product” can be used; values for transport
(distance and medium) and materials used for packaging are already considered in EuP.
• End of life phase : o Only landfill % and plastics re-use and recycling % can be used in EuP;
other parameters are already considered as fixed values.

375
For production phase we have also to take into account that not all the materials reported in Subtask 5.2 are in the EuP Ecoreport data base.
Accordingly, the following assumptions have been made:
A For some materials a direct correspondence with items in EuP data base is possible.
B For some materials only by specific assumptions and simplifications it is possible to have a correspondence with items in EuP data base. The following correspondences have been used:
o Ferrous metals as Cast Iron; o Mixed steel + plastic as Stainless 18/8; o Steel other as Stainless 18/8; o Steel strip as St sheet galv.; o Solder & braze as solder SnAg4Cu0.5; o Elastomer as LDPE; o PET as HDPE; o POM as HDPE; o PPO as PP; o TPE as LDPE; o Butyl rubber as LDPE; o Paint as coating powder; o Rubber as LDPE; o Thermostat as Controller board; o Wood as cardboard; o Refrigerant:
Refrigerant in inventory data from producers is expressed as
o Refrigerant and o Refrigerant HC
In EuP Ecoreport Refrigerant is only considered in “Disposal & recycling” as “Substances released during product life and land filling”, but not in Production phase.
According to the data in EuP data base and with the possibility to select only a kind of refrigerant we have chosen to use R290 a (full HC refrigerant : Propane); we think that this is not totally true and it is possible that also different kind of refrigerating medium are used (as R 134a) but at the moment this seems the best solution.
C For some materials no correspondence is possible ; in this case materials’ weight is split on the weight of the other materials, according to their percentage . Materials without correspondence are :
o Ag; o Foamed Cabinet; o Plastics, others; o Plastics; o Adhesive tape; o Desiccant; o Glue; o Others; o Lubricating oil; o Accumulator; o Magnet; o Handle; o PCB;
376
o EPE o Thermo paste
According to assumptions reported in point B and C the EuP environmental profiles for Cold 1, Cold 7, Cold 8 and Cold 9 are as follows.
5.3.2 LCA of cold models using EuP Ecoreport In Appendix B “EUP Ecoreport data” the detail of the input and output figures obtained by EuP Ecoreport software are shown.
For each model it is reported: • input tables (production phase, assembling, use, end of life); • output tables (Materials, Other Resources & Waste, Emissions (Air), Emissions (Water)) As outlined above, for some materials it has not been possible to have correspondence between inventory data from producers and EuP Ecoreport data base: the amount of these materials have been added to the weight of the other materials, according to their percentage. In order to show inventory data as in inventory data sheets from producers for average models (§5.2), we reported in bracket (near the name of each material) “original” average weight. Final weight used in EuP Ecoreport is in the central column of input sheet.
5.3.3 Preliminary conclusions and remarks It is worth noting that some materials have no correspondence in the categories included in the EuP Ecoreport data base. This occurred for the following weight percentage:
- 1,1 % for Cold 1; - 0,9 % for Cold 7; - 1,5 % for Cold 8; - 4,3 % for Cold 9.
Assumptions were made for other materials to find a correspondence with existing categories:
- 9,4 % for Cold 1; - 10,8 % for Cold 7; - 14,8 % for Cold 8; - 31,5 % for Cold 9.
This means that between 10,5% and 34,8% of the materials do not have a direct correspondence in the EuP Ecoreport data base; this fact has to be taken into consideration for the analysis of the appliances environmental impacts in the EuP Ecoreport output.
Moreover, it is also important to remember that in the EuP database:
• The environmental impact for transport is included in materials environmental impacts; this means that the production phase outputs account also the impact and consumption due to transport.
• In the distribution phase the impact due to the Packaging includes the transport to retailer;
In the second part of the study we will investigate to which extent these simplifications affect the final LCA results, for the moment, based on the assumptions we made on the materials substitution and the EuP database results we find that:
• the production and use phases are responsible for the majority of environmental impact;

377
• for the use phase, energy consumption and water use are the most relevant elements (for both process and cooling) , while for the production phase the wastes are more relevant;
• regarding emissions in air, the use phase is most relevant for Greenhouse gases, and acidification while for the production phase yields higher impact of POP, heavy metals and PAHs; and the distribution phase is relevant for particulate matter (three times the total of Production and Use phases) and VOCs;
In the following paragraphs the graphic outputs and tables from the EuP method are finally shown.
5.3.3.1 Impact and consumption for COLD 1
Going into details, Figures 5.13 to 5.17, show the energy and water consumption as well the air, water and wastes impacts of the COLD 1 models.
The figures clearly show that the higher energy and water consumption levels are found in the use phase (Figure 5.13) while the production phase is responsible for the higher quota of the waste production (Figure 5.14). The emissions to air (Figure 5.15) are shared between the production and use phases but in a different way: GWP and acid rain are higher in the use phase while POP, Heavy metals and PAH are mainly emitted from the production one. Particulate matter emissions and VOCs are finally mainly produced during the distribution phase (these are the typical PM10 emitted by Diesel motors). The emissions to water (Figure 5.16) are mainly provided by the production phase especially for what concerns the heavy metals. Finally Figure 5.17 provides the overall synthesis of all the environmental impact of this class of appliances. Figure 5.13: COLD1 – Energy and water consumptions
Production -Total Distribution
UseEnd of life -
Total
Total Energy (GER) MJ
of which, electricity (in primary MJ) MJ
Water (process) ltr
Water (cooling) ltr
-10.000,00
-
10.000,00
20.000,00
30.000,00
40.000,00
50.000,00
60.000,00
70.000,00

378
Figure 5.14: COLD1 – Waste production
Production - TotalDistribution
UseEnd of life - Total
TOTAL
Waste, hazardous/ incinerated g
Waste, non-haz./ landfill g-
20.000,00
40.000,00
60.000,00
80.000,00
100.000,00
120.000,00
Figure 5.15: COLD1 – Emissions (air)
Pro
duct
ion
- Tot
al
Dis
tribu
tion
Use
End
of l
ife -
Tota
l
TOTA
L
Greenhouse Gases in GWP100 kg CO2 eq.
Acidification, emissions g SO2 eq.Volatile Organic Compounds (VOC) g
Persistent Organic Pollutants (POP) ng i-TeqHeavy Metals mg Ni eq.
PAHs mg Ni eq.Particulate Matter (PM, dust) g
-1.000,00
-
1.000,00
2.000,00
3.000,00
4.000,00
5.000,00
6.000,00
7.000,00
8.000,00

379
Figure 5.16: COLD1 – Emissions (water)
Production - TotalDistribution
UseEnd of life - Total
TOTAL
Eutrophication g PO4
Heavy Metals mg Hg/20-
100,00
200,00
300,00
400,00
500,00
600,00
700,00
800,00
900,00
Figure 5.17: COLD1 – % of impacts on LCA
0%
10%
20%
30%
40%
50%
60%
70%
80%
90%
100%
Total E
nergy
(GER)
Water (
proce
ss)
Waste,
non-h
az./ l
andfi
ll
Waste,
haza
rdous
/ incin
erated
Greenh
ouse
Gas
es in
GWP10
0
Acidific
ation
, emiss
ions
Volatile
Orga
nic C
ompo
unds
(VOC)
Persist
ent O
rganic
Poll
utants
(POP)
Heavy
Meta
lsPAHs
Particu
late M
atter
(PM, d
ust)
Heavy
Meta
ls
Eutrop
hicati
on
End of life - Recycling
End of life - Disposal
Use
Distribution
Production - Manufacturing
Production - Material
5.3.3.2 Impact and consumptions for COLD 7 For this appliance the environmental impact analysis, shown in Figures 5.18-5.21, is practically the same of the COLD 1 case. The only difference concerns the VOCs emissions in air (Figure 5.20); for this class of models, the use phase has impact values higher than the distribution phase (but the

380
values are not very different). Also in this case the overall impacts are summarised in Figure 5.21 (LCA % of COLD 7).
Figure 5.18: COLD7 – Energy and water consumptions
Production -Total Distribution
UseEnd of life -
Total
Total Energy (GER) MJ
of which, electricity (in primary MJ) MJ
Water (process) ltr
Water (cooling) ltr
-20.000,00
-
20.000,00
40.000,00
60.000,00
80.000,00
100.000,00
120.000,00
140.000,00
Figure 5.19: COLD7 – Waste production
Production - TotalDistribution
UseEnd of life - Total
TOTAL
Waste, hazardous/ incinerated g
Waste, non-haz./ landfill g-
20.000,00
40.000,00
60.000,00
80.000,00
100.000,00
120.000,00
140.000,00
160.000,00

381
Figure 5.20: COLD7 – Emissions (air)
Pro
duct
ion
- Tot
al
Dis
tribu
tion
Use
End
of l
ife -
Tota
l
TOTA
L
Greenhouse Gases in GWP100 kg CO2 eq.
Acidification, emissions g SO2 eq.Volatile Organic Compounds (VOC) g
Persistent Organic Pollutants (POP) ng i-TeqHeavy Metals mg Ni eq.
PAHs mg Ni eq.Particulate Matter (PM, dust) g
-2.000,00
-
2.000,00
4.000,00
6.000,00
8.000,00
10.000,00
12.000,00
14.000,00
16.000,00
Figure 5.21: COLD7 – Emissions (water)
Production - TotalDistribution
UseEnd of life - Total
TOTAL
Eutrophication g PO4
Heavy Metals mg Hg/20-
200,00
400,00
600,00
800,00
1.000,00
1.200,00
1.400,00
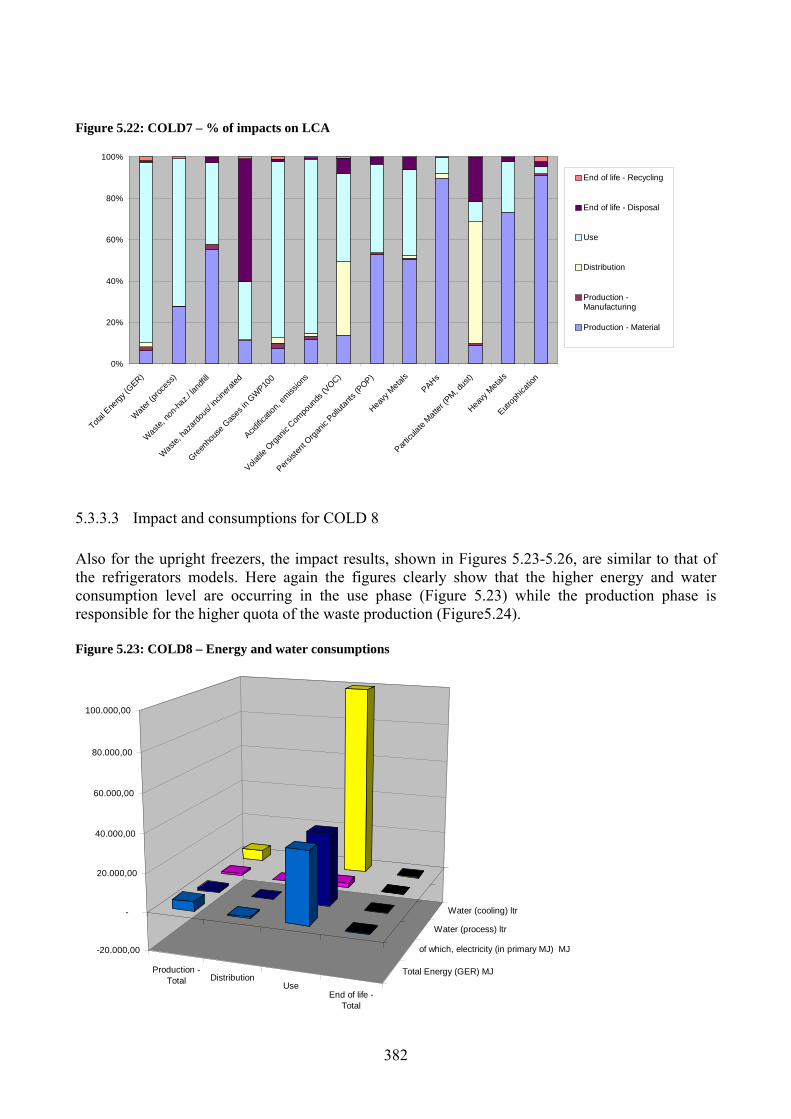
382
Figure 5.22: COLD7 – % of impacts on LCA
0%
20%
40%
60%
80%
100%
Total E
nergy
(GER)
Water (
proce
ss)
Waste,
non-h
az./ l
andfi
ll
Waste,
haza
rdous
/ incin
erated
Greenh
ouse
Gas
es in
GWP10
0
Acidific
ation
, emiss
ions
Volatile
Orga
nic C
ompo
unds
(VOC)
Persist
ent O
rganic
Poll
utants
(POP)
Heavy
Meta
lsPAHs
Particu
late M
atter
(PM, d
ust)
Heavy
Meta
ls
Eutrop
hicati
on
End of life - Recycling
End of life - Disposal
Use
Distribution
Production -Manufacturing
Production - Material
5.3.3.3 Impact and consumptions for COLD 8 Also for the upright freezers, the impact results, shown in Figures 5.23-5.26, are similar to that of the refrigerators models. Here again the figures clearly show that the higher energy and water consumption level are occurring in the use phase (Figure 5.23) while the production phase is responsible for the higher quota of the waste production (Figure5.24). Figure 5.23: COLD8 – Energy and water consumptions
Production -Total Distribution
UseEnd of life -
Total
Total Energy (GER) MJ
of which, electricity (in primary MJ) MJ
Water (process) ltr
Water (cooling) ltr
-20.000,00
-
20.000,00
40.000,00
60.000,00
80.000,00
100.000,00

383
Figure 5.24: COLD8 – Waste production
Production - TotalDistribution
UseEnd of life - Total
TOTAL
W aste, hazardous/ incinerated g
W aste, non-haz./ landfill g-
20.000,00
40.000,00
60.000,00
80.000,00
100.000,00
120.000,00
140.000,00
For emissions to air (Figure 5.25) GWP, acid rain and VOC are more relevant in the use phase while POP, Heavy metals and PAH are mainly emitted from the production phase, and the distribution phase produces the higher quota of PM dust emissions. Finally also in this case the emissions to water (Figure 5.26) are mainly provided by the production phase especially for what concerns the heavy metals. The overall situation is summarised in Figure 5.27 (LCA% of COLD 8). Figure 5.25: COLD8 – Emissions (air)
Pro
duct
ion
- Tot
al
Dis
tribu
tion
Use
End
of l
ife -
Tota
l
TOTA
L
Greenhouse Gases in GWP100 kg CO2 eq.
Acidification, emissions g SO2 eq.Volatile Organic Compounds (VOC) g
Persistent Organic Pollutants (POP) ng i-TeqHeavy Metals mg Ni eq.
PAHs mg Ni eq.Particulate Matter (PM, dust) g
-2.000,00
-
2.000,00
4.000,00
6.000,00
8.000,00
10.000,00
12.000,00

384
Figure 5.26: COLD8 – Emissions (water)
Production - TotalDistribution
UseEnd of life - Total
TOTAL
Eutrophication g PO4
Heavy Metals mg Hg/20-
200,00
400,00
600,00
800,00
1.000,00
1.200,00
Figure 5.27: COLD8 – % of impacts on LCA
0%
20%
40%
60%
80%
100%
Total E
nergy
(GER)
Wate
r (pro
cess
)
Was
te, no
n-haz
./ lan
dfill
Was
te, ha
zardo
us/ in
cinera
ted
Greenh
ouse
Gas
es in
GW
P100
Acidific
ation
, emiss
ions
Volatile
Orga
nic C
ompo
unds
(VOC)
Persist
ent O
rganic
Poll
utants
(POP)
Heavy
Meta
ls
PAHs
Particu
late M
atter
(PM, d
ust)
Heavy
Meta
ls
Eutrop
hicati
on
End of life - Recycling
End of life - Disposal
Use
Distribution
Production -Manufacturing
Production - Material
5.3.3.4 Impact and consumptions for COLD 9 Figures 5.28 – 5.32 show the output result for the chest freezers. In practical there are no differences with the results concerning the upright freezers and it is possible to affirm that, form the environmental point of view, the freezers’ profile is practically the same.

385
Figure 5.28: COLD9 – Energy and water consumptions
Production -Total Distribution
UseEnd of life -
Total
Total Energy (GER) MJ
of which, electricity (in primary MJ) MJ
Water (process) ltr
Water (cooling) ltr
-20.000,00
-
20.000,00
40.000,00
60.000,00
80.000,00
100.000,00
120.000,00
140.000,00
Figure 5.29: COLD9 – Waste production
Production - TotalDistribution
UseEnd of life - Total
TOTAL
Waste, hazardous/ incinerated g
Waste, non-haz./ landfill g-
20.000,00
40.000,00
60.000,00
80.000,00
100.000,00
120.000,00
140.000,00

386
Figure 5.30: COLD9 – Emissions (air)
Pro
duct
ion
- Tot
al
Dis
tribu
tion
Use
End
of l
ife -
Tota
l
TOTA
L
Greenhouse Gases in GWP100 kg CO2 eq.
Acidification, emissions g SO2 eq.Volatile Organic Compounds (VOC) g
Persistent Organic Pollutants (POP) ng i-TeqHeavy Metals mg Ni eq.
PAHs mg Ni eq.Particulate Matter (PM, dust) g
-2.000,00
-
2.000,00
4.000,00
6.000,00
8.000,00
10.000,00
12.000,00
14.000,00
16.000,00
Figure 5.31: COLD9 – Emissions (water)
Production - TotalDistribution
UseEnd of life - Total
TOTAL
Eutrophication g PO4
Heavy Metals mg Hg/20-
200,00
400,00
600,00
800,00
1.000,00
1.200,00

387
Figure 5.32: COLD9 – % of impacts on LCA
0%
20%
40%
60%
80%
100%
Total E
nergy
(GER)
Water (
proce
ss)
Waste,
non-h
az./ l
andfi
ll
Waste,
haza
rdous
/ incin
erated
Greenh
ouse
Gas
es in
GWP10
0
Acidific
ation
, emiss
ions
Volatile
Orga
nic C
ompo
unds
(VOC)
Persist
ent O
rganic
Poll
utants
(POP)
Heavy
Meta
lsPAHs
Particu
late M
atter
(PM, d
ust)
Heavy
Meta
ls
Eutrop
hicati
on
End of life - Recycling
End of life - Disposal
Use
Distribution
Production -Manufacturing
Production - Material
5.3.4 The results from the SimaPro analysis and comparison with the EUP Ecoreport outputs
As explained before EuP Ecoreport has some limits regarding the material data base (lack of data), transportatin (included as a fixed amount in material characteristics) and end of life (only partially considered).
In order to assess compliance of EuP results with real environmental impact, a comparison with data from a well know LCA software has been performed.
The software is the SimaPro and in appendix C its characteristics are described; the comparison was made for one Cold appliance: Cold 7 – Refrigerator - Freezer
In Appendix C all SimaPro outputs have been reported as characterisation chart: assembling, use and end of life.
5.3.4.1 Steps of the comparison Correspondence of materials used in Cold 7 manufacture with SimaPro Database As reported before, in the SimaPro software there are available many databases and it is also possible for the user to create specific record. In this way it is possible, and it was possible for us, to reduce consistently the number of data present in the inventory data sheet without any deterioration of the correspondence in the SimaPro implementation.
In the same way also the number of materials for which assumptions were made to find a correspondence with existing categories was reduced.
In Appendix C are shown the input tables in the SimaPro method for the COLd7 base case models. Comparing these tables with the original data of the base case models (see Appendix A) it is possible to underline that using SimaPro it was possible to find a proper correspondence quickly

388
for almost all materials or processes. It was not possible to find a proper correspondence for the following materials:
o Ag, TPE and cleaning agent.
In these tables also reported, where necessary, are notes explaining the correspondence of the material or processes selected by the SimaPro database and the original data of the base case model.
Main assumptions in SimaPro application In order to implement the SimaPro software, the following assumptions were made regarding the inventory data of the chosen base case model (COLD 7):
- For Assembling
o Scraps: valuating data provided from producers, it was possible to consider the scrap percentage equal to 5% for metals and to 1% for other materials (mainly plastics); In this way, the simulation of assembly has been made on the gross weight of materials composing the machine;
o Processing: once more, valuating data from producers it was possible to consider a sort of average indication for the type of processing needed for each material during the assembly phase (simplified approach); in this way it was possible to find a list of typical processes for different class of materials (steels, iron, plastics, PVCs, expanded plastics);
o Processing: in order to avoid an iper-evaluation of impacts deriving from processing of materials and on the basis of information provided from producers, as general rule metals have been assumed to be processed as 50% of total weight and plastics as 70%.
o Transport: according to received data, it has been calculated for each model an average km for transport of materials for the assembly phase. Because the need in the SimaPro to set both the average km (in terms of t km) and the transport medium, on the basis on general considerations on data provided from producers, average km has been sub-divided as following:
70% truck 30% ship
- For Use: in this case it was possible to use all data provided from producers. In addition, in order to take into account of spare parts as provided from producers (about 300g per life cycle, corresponding to 0,45% of the total weight of the COLD 7 average model), they has been accounted for as a production of 0,45% of a COLD7 model. For transport in use phase the use of a van less than 3,5 tons was considered.
- End of life: according to the data received from producers, the % of treatments for the appliances at the end of life have been calculated and reported in SimaPro data input (Appendix C). It has to be underlined how in EuP-Ecoreport, end of life was an “internal preassembled calculation methodology” as % and final destinations of some materials; it could be considered as a “partially close system”, while in SimaPro it was possible to use data from producers. For this reason it was decided to show outputs from SimaPro and EuP-Ecoreport “with and without End of life” outputs and to make comparison on outputs “without end of life phase” to reduce differences.
Adapting Ecoindicator 95 environmental impact assessment method to EuP-Ecoreport output indicators

389
Environmental indicators (environmental assessment methods) available in SimaPro SW refer to various databases and are different from those used in EuP-Ecoreport ones.
In order to make “comparable” these Environmental indicators a “modified ecoindicator95 method” has been set up and applied to SimaPro outputs.
In Table 5.17 Environmental indicators and related units used as outputs in EuP-Ecoreport have been reported, while in Table 5.18 same data, referred to SimaPro outputs have been reported (as in Ecoindicator 95 method).
Table 5.17: Output indicators in EuP-Ecoreport method
Other Resources & Waste Total Energy (GER) PJ of which, electricity (in primary PJ) PJ Water (process) mln. m3 Water (cooling) mln. m3 Waste, non-haz./ landfill kt Waste, hazardous/ incinerated kt Emissions (Air) Greenhouse Gases in GWP100 mt CO2 eq.Ozone Depletion, emissions t R-11 eq. Acidification, emissions kt SO2 eq. Volatile Organic Compounds (VOC) kt Persistent Organic Pollutants (POP) g i-Teq Heavy Metals ton Ni eq. PAHs ton Ni eq. Particulate Matter (PM, dust) kt Emissions (Water) Heavy Metals ton Hg/20 Eutrophication kt PO4 Persistent Organic Pollutants (POP) g i-Teq Table 5.18: Output indicators in Ecoindicator95 method
Environmental impact unit greenhouse kg CO2 ozone layer kg CFC11 acidification kg SO2 eutrophication kg PO4 heavy metals kg Pb carcinogens kg B(a)P winter smog kg SPM summer smog kg C2H4 pesticides kg act.subst. energy resources MJ LHV solid waste kg
In appendix C the methodology used to compare SimaPro and EuP-Ecoreport outputs has been reported and explained.

390
In any case, it was not possible to adapt exactly the “Ecoindicator 95 method” to the EuP-Ecoreport mrethod because of lack a complete list of components in many indicators and related weight in EuP methodology.
In the following Table 5.19 the “compliance” between EuP-Ecoreport indicators and “modified SimaPro indicators” has been reported.
Table 5.19: Complaince between SimaPro (Eco-indicator 95 rev EuP) and EuP-Ecoreport list of output
Eup
Simapro
8 - TotalEnergy
(GER)
12 (+13) -
waste
14 - Greenho
use Gases in GWP10
0
15 - Ozone Depleti
on, emissio
ns
16 - Acidificat
ion, emissions
17 - Volatile Organic Compou
nds (VOC)
18 - Persist
ent Organi
c Polluta
nts (POP)
19 - Heav
y Meta
ls
19,1 -
PAHs
20 - Particul
ate Matter (PM, dust)
21 - Heav
y Meta
ls
22 - Eutrophica
tion
23 - Persist
ent Organi
c Polluta
nts (POP)
8 - energy resources ok 12 (+13) - solid waste p
14 - Greenhou
se ok
15 - ozone layer ok 16 -
Acidification
ok
17 - summer smog – VOCs
p
18 - POP (air) p
19 - Heavy metals (air)
p
19,1 - PAHs (air)
no
20 - winter smog - P.M.
p
21 - Heavy metals (water)
p
22 - Eutrophic
ation p
23 - POP (water) p - heavy metals
- Carcinoge
ns
- Pesticides
In the Table 5.19 we have:
• For SimaPro indicator:

391
o blue color means that the indicator has been modified (in terms of weight factor of some single components) to be in compliance with EuP;
o orange color means a new indicator for SimaPro software, “elaborated” so as replicate the EuP one.
• For compliance index:
o “Ok” means a good compliance between SimaPro and EuP indicators; o “P” means partial compliance between SimaPro and EuP indicators due to relevant
differences of numbers of components taken into account and, sometimes, to the kind of components itself.
o “No” means practically low compliance between SimaPro and EuP indicators. This is true only for PAHs, in fact in EuP methodology a “weight coefficient” equal to 20 for all PAHs has been used, without a list of kind of PAH considered.
5.3.4.2 SimaPro vs. EuP-Ecoreport output In the following Table 5.20 LCA outputs from SimaPro with Ecoindicator 95 – revised according to EuP Method have been reported for COLD 7- refrigerator-freezers, while in the following Table 5.22 the LCA output from EuP-Ecoreport has been reported.
Table 5.20: COLD 7 – LCA output (Ecoindicator95-rev. EuP method) adapted to that of EuP-Ecoreport
Row in EuP-Ecoreport Impact category Unit COLD7 assembling Use cold 7 EoL Total
8 energy resources MJ LHV 1,15E+04 7,19E+04 -1,11E+03 8,23E+04
12 (+13) solid waste kg 3,31E+02 2,34E+02 -4,51E+01 5,20E+02
14 greenhouse kg CO2 6,00E+02 3,09E+03 -5,94E+01 3,63E+03
15 ozone layer kg CFC11 6,36E-04 2,11E-03 -2,77E-05 2,72E-03
16 acidification kg SO2 6,29E+00 2,33E+01 -2,63E-01 2,94E+01
17 summer smog - VOCs kg C2H4 3,73E-01 8,02E-01 -6,77E-02 1,11E+00
18 POP (air) kg TE eq 1,52E-09 1,28E-09 4,60E-11 2,85E-09
19 Heavy metals (air) kg Ni eq 6,82E-04 5,65E-03 -1,83E-05 6,32E-03
19,1 PAHs (air) kg PAH/20 eq 2,13E-06 2,77E-06 -7,91E-07 4,11E-06
20 winter smog - P.M. kg SPM 4,89E+00 1,94E+01 -1,56E-01 2,41E+01
21 Heavy metals (water) kg Hg/20 eq 4,82E-03 3,07E-02 -8,49E-04 3,46E-02
22 eutrophication kg PO4 2,88E-01 8,22E-01 -2,33E-02 1,09E+00
23 POP (water) kg TE eq 0,00E+00 0,00E+00 0,00E+00 0,00E+00
heavy metals kg Pb 5,03E-03 2,44E-02 -3,59E-04 2,91E-02
carcinogens kg B(a)P 3,05E-05 8,15E-05 -4,24E-05 6,96E-05
pesticides kg act.subst 0,00E+00 0,00E+00 0,00E+00 0,00E+00
According to Simapro outputs, the use phase and production phase have to be considered as more relevant than others regarding environmental impacts; this has been considered true also for EuP Ecoreport outputs. The main difference was in the comparison of environmental impact relevance between use and production phase.
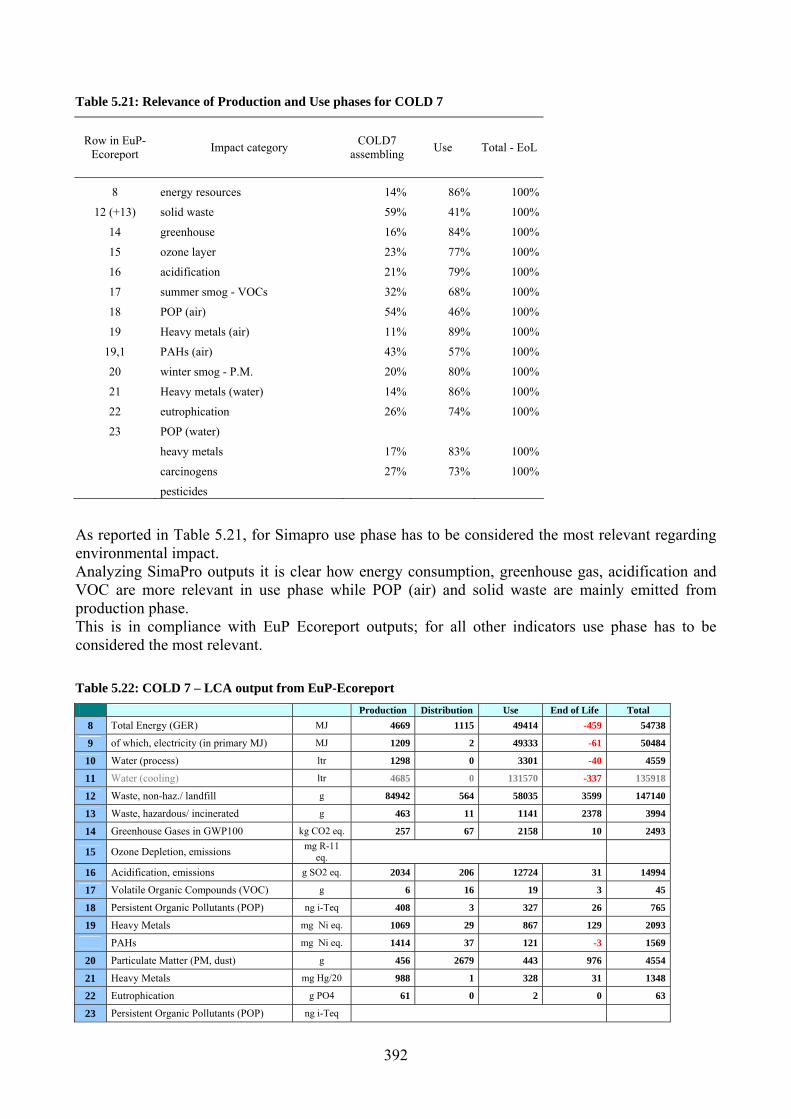
392
Table 5.21: Relevance of Production and Use phases for COLD 7
Row in EuP-Ecoreport Impact category COLD7
assembling Use Total - EoL
8 energy resources 14% 86% 100%
12 (+13) solid waste 59% 41% 100%
14 greenhouse 16% 84% 100%
15 ozone layer 23% 77% 100%
16 acidification 21% 79% 100%
17 summer smog - VOCs 32% 68% 100%
18 POP (air) 54% 46% 100%
19 Heavy metals (air) 11% 89% 100%
19,1 PAHs (air) 43% 57% 100%
20 winter smog - P.M. 20% 80% 100%
21 Heavy metals (water) 14% 86% 100%
22 eutrophication 26% 74% 100%
23 POP (water)
heavy metals 17% 83% 100%
carcinogens 27% 73% 100%
pesticides
As reported in Table 5.21, for Simapro use phase has to be considered the most relevant regarding environmental impact. Analyzing SimaPro outputs it is clear how energy consumption, greenhouse gas, acidification and VOC are more relevant in use phase while POP (air) and solid waste are mainly emitted from production phase. This is in compliance with EuP Ecoreport outputs; for all other indicators use phase has to be considered the most relevant. Table 5.22: COLD 7 – LCA output from EuP-Ecoreport Production Distribution Use End of Life Total
8 Total Energy (GER) MJ 4669 1115 49414 -459 54738
9 of which, electricity (in primary MJ) MJ 1209 2 49333 -61 50484
10 Water (process) ltr 1298 0 3301 -40 4559
11 Water (cooling) ltr 4685 0 131570 -337 135918
12 Waste, non-haz./ landfill g 84942 564 58035 3599 147140
13 Waste, hazardous/ incinerated g 463 11 1141 2378 3994
14 Greenhouse Gases in GWP100 kg CO2 eq. 257 67 2158 10 2493
15 Ozone Depletion, emissions mg R-11 eq.
16 Acidification, emissions g SO2 eq. 2034 206 12724 31 14994
17 Volatile Organic Compounds (VOC) g 6 16 19 3 45
18 Persistent Organic Pollutants (POP) ng i-Teq 408 3 327 26 765
19 Heavy Metals mg Ni eq. 1069 29 867 129 2093
PAHs mg Ni eq. 1414 37 121 -3 1569
20 Particulate Matter (PM, dust) g 456 2679 443 976 4554
21 Heavy Metals mg Hg/20 988 1 328 31 1348
22 Eutrophication g PO4 61 0 2 0 63
23 Persistent Organic Pollutants (POP) ng i-Teq

393
Going into details comparing Simapro and EuP outputs in Table 5.23 LCA output from EuP-Ecoreport has been reported.
Table 5.23: COLD 7 – comparison for LCA output with EuP-Ecoreport vs. SimaPro.
Row in EuP-Ecoreport Impact category Unit COLD7 assembling Use Total - EoL
8 energy resources MJ LHV 146,58% 45,50% 54,23%
12 (+13) solid waste kg 287,82% 295,51% 290,97%
14 greenhouse kg CO2 133,54% 43,01% 52,58%
15 ozone layer kg CFC11
16 acidification kg SO2 209,28% 83,47% 100,82%
17 summer smog - VOCs kg C2H4 6108,48% 4122,48% 4418,38%
18 POP (air) kg TE eq 273,70% 291,63% 281,15%
19 Heavy metals (air) kg Ni eq -36,24% 552,24% 227,46%
19,1 PAHs (air) kg PAH/20 eq -99,85% -97,71% -99,68%
20 winter smog - P.M. kg SPM 972,66% 4278,17% 2601,52%
21 Heavy metals (water) kg Hg/20 eq 387,63% 9252,67% 2597,15%
22 eutrophication kg PO4 371,84% 40994,78% 1661,46%
23 POP (water) kg TE eq
Main considerations and remarks on Simapro vs. EuP outputs
• Regarding the main “classic” indicators, as Energy resources, green house gas and acidification, total values reported can be considered in compliance with EuP ones; Simapro outputs were higher mainly because of better data accuracy, mainly on materials used and assembly and the energy sources environmental impact definition. It has to be underlined that these indicators are to be considered in compliance with EuP outputs. For these indicators it was confirmed that use phase is more relevant than production phase and with the same ratio.
• For VOC’s and Heavy Metals (water) the difference could be mainly due to the higher number of compounds considered in Simapro database as contributors to the environmental indicator, compared with a lower number in EuP.
• PAHs value in EuP was higher than in Simapro output; this could be due to the different calculation methodology used in EuP (MEEuP report) and Simapro (Ecoindicator 95 modified).
• For all the other indicators general higher values in SimaPro output have been reported; this was due to the greater number of data considered in SimaPro and also due to the not incomplete compliance between Simapro and EuP indicators.
It is interesting to underline as in SimaPro use phase is responsible for about 72% of environmental impact, while for EuP this value is about 50%.
5.4 BASE-CASE LIFE CYCLE COSTS

394
The Life Cycle Costs (LCC) for the various base cases are estimated given the economic assumptions, including the consumer prices for various models. The LLC of the base case is the starting point for the optimisation of the technology options in Task 6 and will be re-presented in that context.
5.4.1 Key economic assumptions The key common economic and financial assumptions, discussed in Task 2.4, are summarized here: • Product life 15 years (with a sensitivity analysis for 10, 12 and 17 years) • Discount rate 5%/year (PWF =10,38; 11,27 for 10, 12, 15 and 17 years) • Electricity price 0,17 €/kWh • Maintenance & repairs 5,5 €/year = 82,5 € in 15y • Disposal & recycling 61 €/life • Refrigerators price (Cat.1): 345,1 € • refrigerator-freezers price: 485,0 € • upright & chest freezers price: 328,0 €
The standard base-case annual energy consumption (from Task 5.2) and efficiency are:
Standard base case EEI Energy consumption
(description) (EEI) (kWh/year) refrigerator, Cat.1-6 54,4 163,7 refrigerator-freezer, Cat.7&10 54,3 324,4 upright freezer, Cat. 8 56,3 274,5 chest freezer, Cat. 9 64,4 300,6 Using these parameters the LCC is calculated in the following paragraph for the basic parameter combination. A sensitivity analysis is here presented only for the appliance lifetime, which has an immediate impact on the operating costs, while the sensitivity for the other parameters will be presented in Task 6.
5.4.2 The analysis results The Life Cycle Cost for the consumer is the sum of the purchase price plus the discounted annual costs and the discounted end of life cost of recycling and disposal as shown in Table 5.24
The life cycle costs are more than double the purchase price in most cases, indicating the importance of the annual operating costs in particular the electricity, which will be subject to reduction in Task 6.

395
Table 5.24: Life Cycle Costs of Base Cases of Refrigerators and Freezers
Standard Base Case Consumer price
Energy consumption
Annual energy costs
Annual maintenance
costs
Recycling & disposal costs (at end of life)
LCC at 10 years
LCC at 12 years
LCC at 15 years
LCC at 17 years
(description) (€) (kWh/year) (€/year) (€/year) (€) (€) (€) (€) (€) Refrigerators 345 163,7 27,83 5,50 61,00 640 674 720 747
Refrigerator-freezers 485 324,4 55,15 5,50 61,00 991 1.057 1.144 1.195 Upright freezers 328 274,5 46,67 5,50 61,00 768 824 899 943 Chest freezers 328 300,6 51,10 5,50 61,00 803 864 945 993
396
5.5 EU TOTALS
For the cold appliances the lifetime energy consumption, life cycle cost, and life cycle environmental impacts are aggregated for the total units sold in 2005 in EU-25.
This is calculated for the base case and BAT models, using the characteristics of the models described in the Tasks 5 and 6, together with the stock and market data from Task 2. In addition to the total environmental impacts, the partial impacts are shown, including disposal assuming post-RoHS and post-WEEE conditions.
The 2005 total for the base case represents today’s situation of the average models sold. A total for year 2005 was also calculated for the BAT model and these values are subtracted from those of the base case, this difference representing the potential maximum of technological savings from the substitution of all the base case models by the BAT model. This is a theoretical maximum savings potential as certainly BAT penetration will not reach 100%, however the number of models sold will increase slowly from the level in year 2005.
The lifetime energy consumption and life cycle costs are shown for the single models and for the total of year 2005 in Table 5.25.
Table 5.25: Average Freezer and Refrigerators: Lifetime Energy Consumption and Life Cycle Costs for Single Models and for Total Models Sold in Year 2005 in EU-25
AVERAGE FREEZERS (AVERAGE OF CAT. 8 & 9)Single Model (Avg of Cat 8 & 9) Year 2005 (EU-25 Sales = 4.600.000 units)
Characteristics Base BAT Potential Savings 100% Base 100% BAT Potential
SavingsLifetime Energy Consumption (kWh) 287,55 140,2 147,35 1,32E+09 6,45E+08 6,78E+08
Life Cycle Costs (Euro) 922 991 -69 4,24E+09 4,56E+09 -3,17E+08
AVERAGE REFRIGERATORS (30% Cat. 1-6; 70% Cat.7 & 10)Single Model (30% /70%): Year 2005 (EU-25 Sales = 14.200.000 units)
Characteristics Base BAT Potential Savings 100% Base 100% BAT Potential
SavingsLifetime Energy Consumption (kWh) 276,19 154,29 121,9 3,92E+09 2,19E+09 1,73E+09
Life Cycle Costs (Euro) 1016,8 1164 -147,2 1,44E+10 1,65E+10 -2,09E+09
As indicated, the arithmetic average of the characteristics of Categories 8 and 9 is used to represent overall freezers; instead for refrigerators, a 30% weight is used for Categories 1 through 6, and a 70% weight for Categories 7 and 10. The potential energy savings per unit is slightly higher in the case of freezers, however this impact is diminished by the fact that number of refrigerators sold is more than three times that of freezers.
The maximum savings potentials for the aggregate amount in year 2005 are illustrated in Figure 5.33.

397
Figure 5.33: Maximum Potential Lifetime Savings for Models Sold in Year 2005 EU-25
Energy
LCC
Freezers
Refrigerators
-2,50E+09
-2,00E+09
-1,50E+09
-1,00E+09
-5,00E+08
0,00E+00
5,00E+08
1,00E+09
1,50E+09
2,00E+09
Average Freezers and Refrigerators: Maximum Potential Savings Year 2005 in EU-25 (Electricity in kWh and LCC in Euro)
Freezers Refrigerators
As shown the refrigerators would produce almost triple the energy savings of freezers, however at a greater cost to the user. A detailed analysis of life cycle costs is given in Task 6, including that of the intermediate LLCC model.

397
Appendix A Life Cycle Inventory data
Table A.1: Cold1 average model Life Cycle Inventory
PRODUCTION
Materials type Material
COLD1 AVERAGE MODEL
(g) Ferrous metals Ferrous metals 8.089 Iron 762 Mixed steel+plastic 56 Stainless Steel 62 Steel other 2.064 Steel strip 9.444 Steel tube & wire 282 Steel 384 Ferrous metals TOT 21.143 Non ferrous metals Ag 4 Al 863 AL sheet 71 AL tube 86 Cu 1.825 Cu tube 28 solder & braze 2 Non ferrous metals TOT 2.879 Packaging Cardboard 1.444 EPS 1.034 PE - foil 248 PP 31 Wood 10 Packaging TOT 2.767 Plastics ABS 766 Elastomers 24 EPS - Insulation 3 Foamed Cabinet - PA 57 PE 53 PET 2 Plastics, others 174 POM 26 PP 922 PPO 17 PS 5.769 PU Foam - Insulation 3.798 PUR 2.128 PVC (excl. wire insul.) 348 TPE 2 Plastics 60 Plastics TOT 14.148 Various Adhesive tape 9 Dessicant 2
Electronic, boards, switches, lamp etc 83
Glass 5.110 Glue 80 Magnet 46

398
Materials type Material
COLD1 AVERAGE MODEL
(g) Others 3 Paint 64 Paper (booklets etc) 195 Refrigerant 28 Refrigerant HC 5 Rubber 49 Running capacitor 2 Thermostat 147 Wiring 242 Lubricating oil 140 Various TOT 6.204 TOTAL 47.141
SCRAP
Materials Scrap (%)
Scrap End of
Life Ferrous metals
3 Recycled 90%
Non ferrous metals
1 Recycled 90%
Plastics 1,5 Recycled 90%
Various 0,5 Recycled 90%
Packaging 1,5 Recycled 90%
PROCESSING
Materials Processing Ferrous metals
Forming
Non ferrous metals
Forming/Wiring
Plastics Extrusion/Injection moulding
Various Assembling Packaging Cutting/Assembling
TRANSPORT
Average km COLD1 = 1.235,83 km
70 % TRUCK
30% SHIP
ASSEMBLING
COLD1 AVERAGE MODEL

399
Electricity 31,495 kWh Heat 11,59 kWh Water 0,048 m3 Other materials
lubricant 27 g cleaning agent 8 g nitrogen 43 g Argon 5 g Oxigen 27 g Helium 1,7 g
Volume of packaged final product 0,549 m3
USE
COLD1 AVERAGE
MODEL Product Life (years) 14,00 Electricity
On-mode: Consumption per YEAR 160,54 On-mode: n. of hours, cycles, settings, etc. / year
Standby-mode: Consumption per hour Standby-mode: n. of hours / year
Off-mode: Consumption per hour Off-mode: n. of hours / year
TOTAL over Product Life Heat
Avg. Heat Power Output No. of hours / year
Type and efficiency TOTAL over Product Life
Consumables (excl. spare parts) Water
Auxiliary material 1 Auxiliary material 2 Auxiliary material 3 Auxiliary material 4 Auxiliary material 5 Auxiliary material 6 Auxiliary material 7 Auxiliary material 8 Auxiliary material 9
Auxiliary material 10 Auxiliary material 11
Maintenance, Repairs, Service n. of km over Product-Life 18,93
Spare parts Spare parts (functional components) 0,04
Spare parts (aesthetic components- non functional) 0,30 Spare parts (object 50 thermostat) 0,03 Spare parts (object 7 compressor) 0,02
400
END OF LIFE
Cold1 AVERAGE
MODEL (%)
recycling 84,50
energy recovery 10,00
landfilling 5,50
Table A.2: Cold7 average model Life Cycle Inventory
PRODUCTION
Materials type Material
COLD7 AVERAGE MODEL
(g) Ferrous metals Ferrous metals 15.262 Iron 711 Mixed steel+plastic 7 Stainless Steel 860 Steel 3.328 Steel other 1.373 Steel strip 9.198 Ferrous metals TOT 30.738 Non ferrous metals Ag 4 Al 1.343 Cu 1.893 Zn 169 Non ferrous metals TOT 3.408 Packaging Cardboard 2.673 EPS 1.239 PE foil 257 PP 35 Wood 10 Packaging TOT 4.214 Plastics ABS 840 Elastomers 4 EPS 38 PA 20 PC 5 PE 37 PE foil 45 PET 3 Plastics, others 140 POM 5 PP 1.549 PS 8.900 PU foam - insulation 6.223 PUR 1.712 PVC (excl. wire insul.) 352 TPE 3 Plastics 81 Plastics TOT 19.958 Various Adhesive tape 14 color/paint 9 Glass 6.219 Glue 127

401
Materials type Material
COLD7 AVERAGE MODEL
(g) Paper 272 Refrigerant 49 Rubber 202 Thermostat 146 Wiring 273 Electronic, boards, switches, lamp etc 155 Lubricating oil 190 Various TOT 7.654 TOTAL 65.972
SCRAP
Materials Scrap (%)
Scrap End of
Life Ferrous metals
3 Recycled 90%
Non ferrous metals
1 Recycled 90%
Plastics 1,5 Recycled 90%
Various 0,5 Recycled 90%
Packaging 1,5 Recycled 90%
PROCESSING
Materials Processing Ferrous metals
Forming
Non ferrous metals
Forming/Wiring
Plastics Extrusion/Injection moulding
Various Assembling Packaging Cutting/Assembling
TRANSPORT
Average km COLD7 = 1.467 km
70 % TRUCK
30% SHIP
ASSEMBLING

402
COLD7 AVERAGE
MODEL Energy (kWh)
Electricity 25,34 Heat 15,69
Mechanical Water (m3) 0,228 Other materials (g)
lubricant 27,000 cleaning agent 8,000
nitrogen 84,000 Argon 5,000
Oxigen 27,000 Volume of packaged final product (m3) 0,784
USE PHASE
COLD7 AVERAGE MODEL
Product Life 15 years Electricity
On-mode: Consumption per year 313,15 kWh On-mode: n. of hours, cycles, settings, etc. / year Standby-mode: Consumption per hour Standby-mode: n. of hours / year Off-mode: Consumption per hour Off-mode: n. of hours / year
TOTAL over Product Life Heat Avg. Heat Power Output No. of hours / year Type and efficiency
TOTAL over Product Life Consumables (excl. spare parts)
Water Auxiliary material 1 Auxiliary material 2 Auxiliary material 3 Auxiliary material 4 Auxiliary material 5 Auxiliary material 6 Auxiliary material 7 Auxiliary material 8 Auxiliary material 9 Auxiliary material 10 Auxiliary material 11
Maintenance, Repairs, Service n. of km over Product-Life 14,30 km/product life Spare parts or Spare parts (object functional) 0,14 n/product life Spare parts (object aesthetic) 0,40 n/product life bottom glass shelf with profiles
glass shelves with profiles 151,00 (g/product life ?)
thermostat 134,00 (g/product life ?)

403
END OF LIFE
COLD7
AVERAGE MODEL
Dismantling 2,50 recycling 80,00 energy recovery 12,00 landfilling 5,50
Table A.3: Cold 8 average model Life Cycle Inventory
PRODUCTION
Materials type Material COLD8
AVERAGE MODEL
Ferrous metals Ferrous metals 9.928 Iron 437 Mixed steel+plastic 603 Stainless Steel 43 Steel 2.880 Steel strip 9.729 Steel tube & wire 1.347 Ferrous metals TOT 24.966 Non ferrous metals Ag 4 Al 694 AL tube 16 Cu 1.570 Cu tube 46 solder & braze 2 Non ferrous metals TOT 2.332 objects Accumulator 272 Handle 65 objects TOT 337 packaging Cardboard 1.935 EPS 1.046 Others (packaging) 24 PE - foil 328 PP 22 Wood 10 packaging TOT 3.365 Plastics ABS 999 Elastomers 8 EPS - Insulation 2 PA 55 PE 580 Plastics, others 116 POM 21 PP 1.865 PPO 7 PS 10.322 PU Foam - Insulation 6.524 PUR 1.986

404
Materials type Material COLD8
AVERAGE MODEL
PVC (excl. wire insul.) 529 SAN 1.232 TPE 6 Plastics 73 Plastics TOT 24.326 Various Adhesive tape 0 Butyl rubber 19 Capacitor 11 Dessicant 2
Electronic, boards, switches, lamp etc 240
Glue 5 Magnet 46 Others 1 Paint 142 Paper (booklets etc) 182 PCB 9 Refrigerant 53 Refrigerant HC 12 Rubber 27 Thermostat 88 Wiring 268 Lubricating oil 170 Various TOT 1.274 TOTAL 56.601
SCRAP
Materials Scrap (%)
Scrap End of
Life Ferrous metals
3 Recycled 90%
Non ferrous metals
1 Recycled 90%
Plastics 1,5 Recycled 90%
Various 0,5 Recycled 90%
Packaging 1,5 Recycled 90%
PROCESSING
Materials Processing Ferrous metals
Forming
Non ferrous metals
Forming/Wiring
Plastics Extrusion/Injection moulding

405
Various Assembling Packaging Cutting/Assembling
TRANSPORT
Average km COLD8 = 563,51 km
70 % TRUCK
30% SHIP
ASSEMBLING
COLD8 AVERAGE
MODEL Energy (kWh)
Electricity 26,51 Electricity (assembling+lighting) Electricity (heating buildings) Heat 16,8 Heat (assembling) Heat (heating buildings) Mechanical
Water (m3) 0,180 Other materials (g) Lubricant 27 Cleaning agent 8 Nitrogen 43 Argon 5 Oxigen 27 Helium 1,7 Volume of packaged final product (m3) 0,5216
USE
COLD8 AVERAGE
MODEL Product Life years 14,00 Electricity - On-mode: Consumption per hour, cycle, setting, etc. kWh 254,43 On-mode: n. of hours, cycles, settings, etc. / year hrs. Standby-mode: Consumption per hour kWh Standby-mode: n. of hours / year - Off-mode: Consumption per hour kWh Off-mode: n. of hours / year - TOTAL over Product Life - Heat -

406
COLD8 AVERAGE
MODEL Avg. Heat Power Output kW No. of hours / year hrs. Type and efficiency 1 TOTAL over Product Life - Consumables (excl. spare parts) - Water m3/year Auxiliary material 1 kg/ year Auxiliary material 2 kg/ year Auxiliary material 3 kg/ year Auxiliary material 4 kg/ year Auxiliary material 5 kg/ year Auxiliary material 6 kg/ year Auxiliary material 7 kg/ year Auxiliary material 8 - Auxiliary material 9 - Auxiliary material 10 - Auxiliary material 11 - Maintenance, Repairs, Service - n. of km over Product-Life km/product life 2,75 Spare parts g/product life 27,00 or Spare parts (functionals) n/product life 0,10 Spare parts (aesthetics) n/product life 0,15
END OF LIFE
COLD8 AVERAGE
MODEL Dismantling 9 recycling 71 energy recovery 13 landfilling 6
Table A.4: Cold 9 average model Life Cycle Inventory
PRODUCTION
Materials type Material
COLD9 AVERAGE
MODEL Ferrous metals Iron 6.538 Mixed steel+plastic 163 Steel other 1.780 Steel strip 9.055 Ferrous metals 8.554 Ferrous metals TOT 26.089 Non ferrous metals Al 3.216 Cu 1.189 Non ferrous metals TOT 4.406 packaging Cardboard 1.472 EPE (protections) 33 EPS 1.729
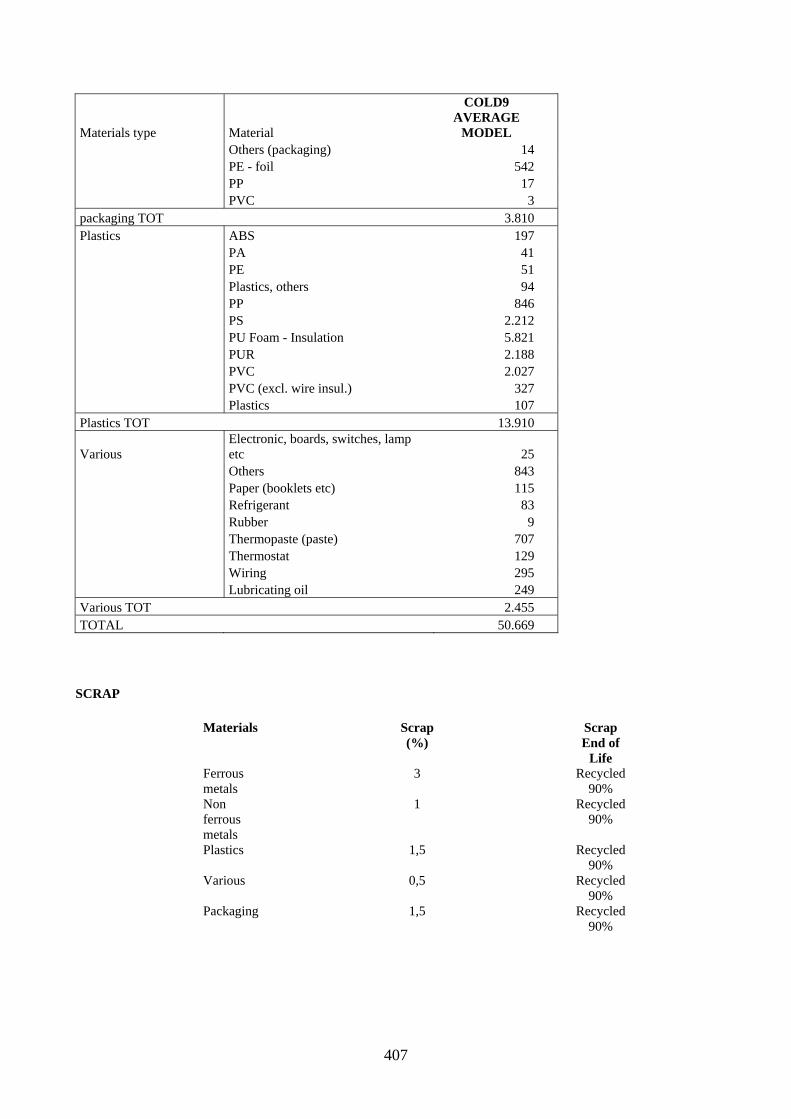
407
Materials type Material
COLD9 AVERAGE
MODEL Others (packaging) 14 PE - foil 542 PP 17 PVC 3 packaging TOT 3.810 Plastics ABS 197 PA 41 PE 51 Plastics, others 94 PP 846 PS 2.212 PU Foam - Insulation 5.821 PUR 2.188 PVC 2.027 PVC (excl. wire insul.) 327 Plastics 107 Plastics TOT 13.910
Various Electronic, boards, switches, lamp etc 25
Others 843 Paper (booklets etc) 115 Refrigerant 83 Rubber 9 Thermopaste (paste) 707 Thermostat 129 Wiring 295 Lubricating oil 249 Various TOT 2.455 TOTAL 50.669
SCRAP
Materials Scrap (%)
Scrap End of
Life Ferrous metals
3 Recycled 90%
Non ferrous metals
1 Recycled 90%
Plastics 1,5 Recycled 90%
Various 0,5 Recycled 90%
Packaging 1,5 Recycled 90%
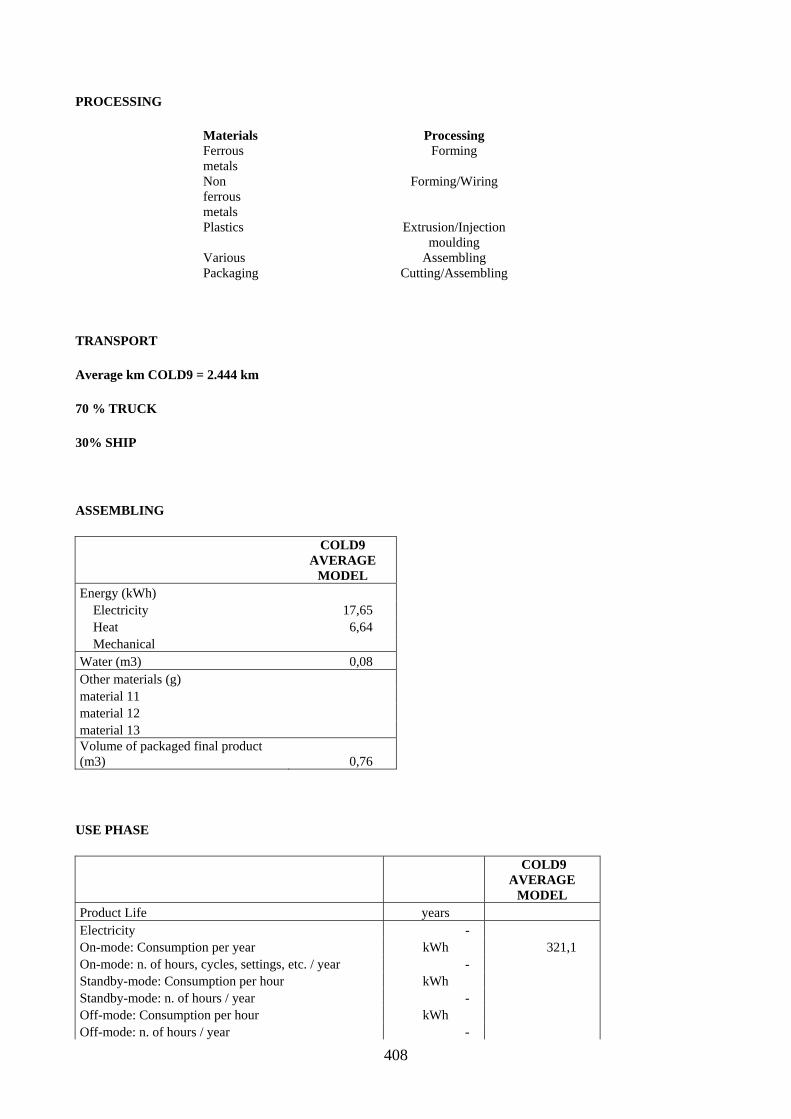
408
PROCESSING
Materials Processing Ferrous metals
Forming
Non ferrous metals
Forming/Wiring
Plastics Extrusion/Injection moulding
Various Assembling Packaging Cutting/Assembling
TRANSPORT
Average km COLD9 = 2.444 km
70 % TRUCK
30% SHIP
ASSEMBLING
COLD9 AVERAGE
MODEL Energy (kWh)
Electricity 17,65 Heat 6,64 Mechanical
Water (m3) 0,08 Other materials (g) material 11 material 12 material 13 Volume of packaged final product (m3) 0,76
USE PHASE
COLD9 AVERAGE
MODEL Product Life years Electricity - On-mode: Consumption per year kWh 321,1 On-mode: n. of hours, cycles, settings, etc. / year - Standby-mode: Consumption per hour kWh Standby-mode: n. of hours / year - Off-mode: Consumption per hour kWh Off-mode: n. of hours / year -

409
COLD9 AVERAGE
MODEL TOTAL over Product Life - Heat - Avg. Heat Power Output kW No. of hours / year hrs. Type and efficiency 1 TOTAL over Product Life - Consumables (excl. spare parts) - Water m3/year Auxiliary material 1 kg/ year Auxiliary material 2 kg/ year Auxiliary material 3 kg/ year Auxiliary material 4 kg/ year Auxiliary material 5 kg/ year Auxiliary material 6 kg/ year Auxiliary material 7 kg/ year Auxiliary material 8 - Auxiliary material 9 - Auxiliary material 10 - Auxiliary material 11 - Maintenance, Repairs, Service - n. of km over Product-Life km/product life Spare parts g/product life or Spare parts (functional) n/product life 0,15 Spare parts (aesthetic) n/product life 0,2
END OF LIFE
COLD9 AVERAGE
MODEL (%) Dismantling - Recycling 83
ferrous metals 49 non ferrous metals 8
plastics 14 glass -
packaging 12 Energy recovery 12
plastics - wood - paper - PUR 12
Land filling 5

410
Appendix B: EuP-Ecoreport data
Table A.5: COLD 1 – Refrigerator – INPUT in EuP-Ecoreport
Version 5 VHK for European Commission 28 Nov. 2005 Document subject to a legal notice (see below)
ECO-DESIGN OF ENERGY-USING PRODUCTS
EuP EcoReport: INPUTS Assessment of Environmental Impact
Nr Product name Date Author
1 COLD 1 08/05/2007 CUTAIA-SCIALDONI
Pos MATERIALS Extraction & Production Weight Category Material or Process nr Description of component in g Click &select select Category first !
1 Ferrous metals ( 8089 g) 8184,6 3-Ferro 23-Cast iron
2 Iron ( 762 g) 771,0 3-Ferro 23-Cast iron
3 Mixed steel+plastic ( 56 g) 56,7 3-Ferro 25-Stainless 18/8 coil
4 Stainless Steel ( 62 g) 62,7 3-Ferro 25-Stainless 18/8 coil
5 Steel other ( 2064 g) 2088,4 3-Ferro 25-Stainless 18/8 coil
6 Steel strip ( 9444 g) 9555,6 3-Ferro 21-St sheet galv.
7 Steel tube & wire ( 282 g) 285,3 3-Ferro 22-St tube/profile
8 Steel ( 384 g) 388,5 3-Ferro 25-Stainless 18/8 coil
9 Ag ( 4 g)
10 Al ( 863 g) 873,2 4-Non-ferro 26-Al sheet/extrusion
11 AL sheet ( 71 g) 71,8 4-Non-ferro 26-Al sheet/extrusion
12 AL tube ( 86 g) 87,0 4-Non-ferro 26-Al sheet/extrusion
13 Cu ( 1825 g) 1846,6 4-Non-ferro 29-Cu wire
14 Cu tube ( 28 g) 28,3 4-Non-ferro 30-Cu tube/sheet
15 solder & braze ( 2 g) 2,0 6-Electronics 52-Solder SnAg4Cu0.5
16 ABS ( 766 g) 775,1 1-BlkPlastics 10-ABS
17 Elastomers ( 24 g) 24,3 1-BlkPlastics 1-LDPE
18 EPS - Insulation ( 3 g) 3,0 1-BlkPlastics 6-EPS
19 Foamed Cabinet ( 0 g)
20 PA ( 57 g) 57,7 2-TecPlastics 11-PA 6
21 PE ( 53 g) 53,6 1-BlkPlastics 2-HDPE
22 PET ( 2 g) 2,0 1-BlkPlastics 2-HDPE
23 Plastics, others ( 174 g)
24 POM ( 26 g) 26,3 1-BlkPlastics 2-HDPE
25 PP ( 922 g) 932,9 1-BlkPlastics 4-PP
26 PPO ( 17 g) 17,2 1-BlkPlastics 4-PP
27 PS ( 5769 g) 5837,2 1-BlkPlastics 5-PS
28 PU Foam - Insulation ( 3798 g) 3842,9 2-TecPlastics 16-Flex PUR
29 PUR ( 2128 g) 2153,2 2-TecPlastics 15-Rigid PUR
30 PVC (excl. wire insul.) ( 348 g) 352,1 1-BlkPlastics 8-PVC
31 TPE ( 2 g) 2,0 1-BlkPlastics 1-LDPE
32 Plastics ( 60 g)
33 Adhesive tape ( 9 g)

411
34 Dessicant ( 2 g)
35 Electronic, boards, switches, lamp etc ( 83 g) 83,9810382 6-Electronics 98-controller board
36 Glass ( 5110 g) 5.170 7-Misc. 54-Glass for lamps
37 Glue ( 80 g)
38 Magnet ( 46 g)
39 Others ( 3 g)
40 Paint ( 64 g) 64,7564632 5-Coating 39-powder coating 41 Paper (booklets etc) ( 195 g) 197,304849 7-Misc. 57-Office paper
42 Refrigerant (see in Disposal)
43 Refrigerant HC (see in Disposal)
44 Rubber ( 49 g) 49,5791671 1-BlkPlastics 1-LDPE
45 Running capacitor ( 2 g) 2,02363948 6-Electronics 98-controller board
46 Thermostat ( 147 g) 148,737501 6-Electronics 98-controller board
47 Wiring ( 242 g) 244,860376 4-Non-ferro 29-Cu wire
48 Lubricating oil ( 140 g)
TOTAL 44343 Pos MANUFACTURING Weight Percentage Category index (fixed) nr Description in g Adjust
201 OEM Plastics Manufacturing (fixed) 14129 20
202 Foundries Fe/Cu/Zn (fixed) 8956 34
203 Foundries Al/Mg (fixed) 0 35
204 Sheetmetal Manufacturing (fixed) 13212 36
205 PWB Manufacturing (fixed) 2 53
206 Other materials (Manufacturing already included) 8044
207 Sheetmetal Scrap (Please adjust percentage only) 396 3% 37
Pos DISTRIBUTION (incl. Final Assembly) Answer Category index (fixed)
nr Description
208 Is it an ICT or Consumer Electronics product <15 kg ? NO 59 0
209 Is it an installed appliance (e.g. boiler)? 0 NO 60 1
62 1
210 Volume of packaged final product in m3 in m3 0,549 63 0
Pos USE PHASE unit Subtotals
nr Description
211 Product Life in years 14 years
Electricity
212 On-mode: Consumption per hour, cycle, setting, etc. 160,54 kWh 160,54
213 On-mode: No. Of hours, cycles, settings, etc. / year 1 #
214 Standby-mode: Consumption per hour 0 kWh 0
215 Standby-mode: No. Of hours / year 0 #
216 Off-mode: Consumption per hour 0 kWh 0
217 Off-mode: No. Of hours / year 0 #
TOTAL over Product Life 2,25 MWh (=000 kWh) 65
Heat

412
218 Avg. Heat Power Output 0 kW
219 No. Of hours / year 0 hrs.
220 Type and efficiency (Click & select)
16 85-not applicable
TOTAL over Product Life
0,00 GJ
Consumables (excl, spare parts) material
221 Water 0 m3/year 83-Water per m3
222 Auxilliary material 1 (Click & select) 0 kg/ year 85-None
223 Auxilliary material 2 (Click & select) 0 kg/ year 85-None
224 Auxilliary material 3 (Click & select) 0 kg/ year 85-None
Maintenance, Repairs, Service
225 No. of km over Product-Life 18,93 km / Product Life 86 226 Spare parts (fixed, 1% of product materials & manuf.) 443 g
Pos DISPOSAL & RECYCLING unit Subtotals
nr Description
Substances released during Product Life and Landfill
227 Refrigerant in the product (Click & select) 33 g 9-R290
228 Percentage of fugitive & dumped refrigerant 0%
229 Mercury (Hg) in the product 0 g Hg
230 Percentage of fugitive & dumped mercury 0%
Disposal: Environmental Costs perkg final product
231 Landfill (fraction products not recovered) in g en % 2217 5% 88-fixed
232 Incineration (plastics & PWB not re-used/recycled) 1414 g 91-fixed
233 Plastics: Re-use & Recycling ("cost"-side) 11939 g 92-fixed
Re-use, Recycling Benefit in g % of plastics
fraction
234 Plastics: Re-use, Closed Loop Recycling (please edit%) 0 0% 4
235 Plastics: Materials Recycling (please edit% only) 11939 85% 4
236 Plastics: Thermal Recycling (please edit% only) 1413 10% 72
237 Electronics: PWB Easy to Disassemble ? (Click&select) 1 YES 98
238 Metals & TV Glass & Misc. (95% Recycling) 28701 fixed

413
Table A.6: COLD 1 – Refrigerator – OUTPUT from EuP-Ecoreport
Nr Life cycle Impact per product: Date Author
1 COLD 1 39210 CUTAIA-SCIALDONI
Life Cycle phases --> PRODUCTION DISTRI- USE END-OF-LIFE* TOTAL
Resources Use and Emissions Material Manuf. Total BUTION Disposal Recycl. Total Materials unit
1 Bulk Plastics g 8075 808 7268 8075 0
2 TecPlastics g 6054 605 5448 6054 0
3 Ferro g 21393 1070 20323 21393 0
4 Non-ferro g 3152 158 2994 3152 0
5 Coating g 65 3 62 65 0
6 Electronics g 237 236 1 237 0
7 Misc. g 5368 268 5099 5368 0
Total weight g 44343 3148 41195 44343 0
see note!
Other Resources & Waste debet credit
8 Total Energy (GER) MJ 2637 802 3439 797 23679 324 659 -335 27580
9 of which, electricity (in primary MJ) MJ 407 482 889 2 23608 0 43 -43 24456
10 Water (process) ltr 835 7 843 0 1582 0 29 -29 2396
11 Water (cooling) ltr 3138 226 3364 0 62965 0 239 -239 66090
12 Waste, non-haz./ landfill g 72030 2568 74598 411 28108 2757 168 2588 105705
13 Waste, hazardous/ incinerated g 343 0 343 8 547 1415 27 1388 2286
Emissions (Air)
14 Greenhouse Gases in GWP100 kg CO2 eq. 143 45 187 48 1035 24 17 7 1278
15 Ozone Depletion, emissions mg R-11 eq. negligible
16 Acidification, emissions g SO2 eq. 1371 192 1563 148 6096 60 40 21 7827
17 Volatile Organic Compounds (VOC) g 4 0 5 11 10 2 0 2 28
18 Persistent Organic Pollutants (POP) ng i-Teq 341 4 345 2 158 19 0 19 524
19 Heavy Metals mg Ni eq. 576 10 586 21 421 87 0 87 1114
PAHs mg Ni eq. 955 0 955 27 66 0 2 -2 1045
20 Particulate Matter (PM, dust) g 263 30 293 1877 300 679 5 674 3144
Emissions (Water)
21 Heavy Metals mg Hg/20 690 0 690 1 159 21 0 21 871
22 Eutrophication g PO4 40 0 40 0 1 1 1 0 42
23 Persistent Organic Pollutants (POP) ng i-Teq negligible
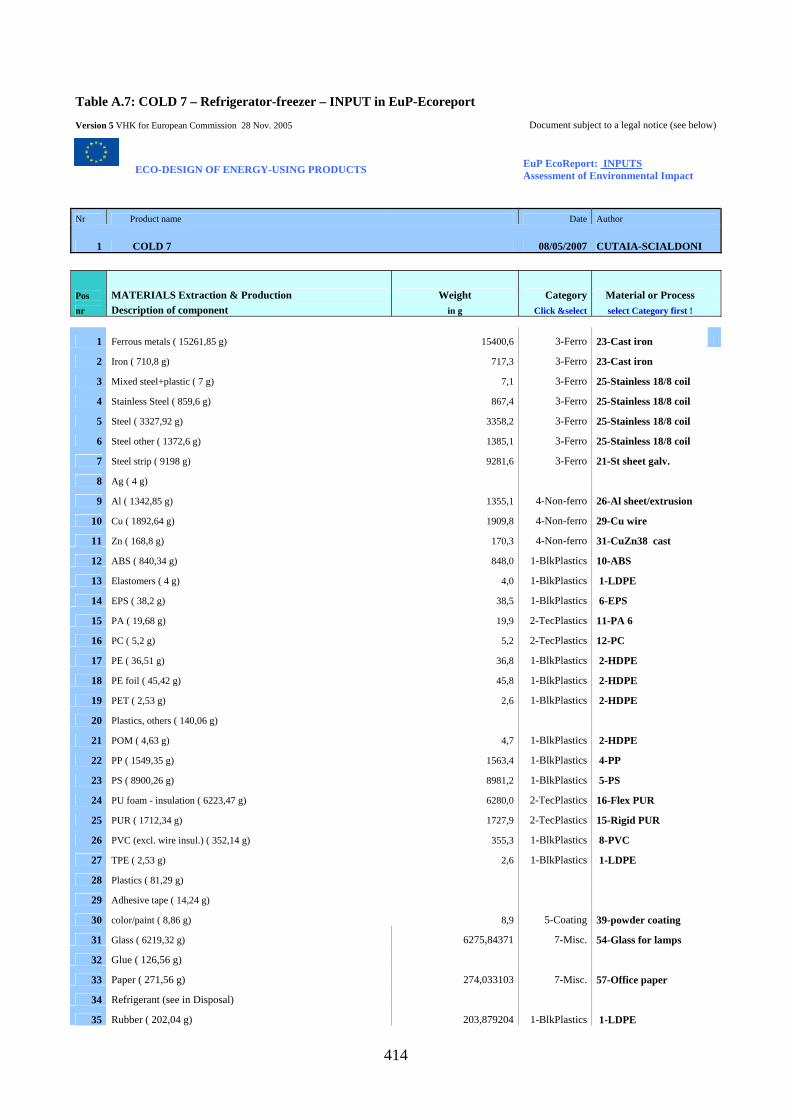
414
Table A.7: COLD 7 – Refrigerator-freezer – INPUT in EuP-Ecoreport
Version 5 VHK for European Commission 28 Nov. 2005 Document subject to a legal notice (see below)
ECO-DESIGN OF ENERGY-USING PRODUCTS
EuP EcoReport: INPUTS Assessment of Environmental Impact
Nr Product name Date Author
1 COLD 7 08/05/2007 CUTAIA-SCIALDONI
Pos MATERIALS Extraction & Production Weight Category Material or Process nr Description of component in g Click &select select Category first !
1 Ferrous metals ( 15261,85 g) 15400,6 3-Ferro 23-Cast iron
2 Iron ( 710,8 g) 717,3 3-Ferro 23-Cast iron
3 Mixed steel+plastic ( 7 g) 7,1 3-Ferro 25-Stainless 18/8 coil
4 Stainless Steel ( 859,6 g) 867,4 3-Ferro 25-Stainless 18/8 coil
5 Steel ( 3327,92 g) 3358,2 3-Ferro 25-Stainless 18/8 coil
6 Steel other ( 1372,6 g) 1385,1 3-Ferro 25-Stainless 18/8 coil
7 Steel strip ( 9198 g) 9281,6 3-Ferro 21-St sheet galv.
8 Ag ( 4 g)
9 Al ( 1342,85 g) 1355,1 4-Non-ferro 26-Al sheet/extrusion
10 Cu ( 1892,64 g) 1909,8 4-Non-ferro 29-Cu wire
11 Zn ( 168,8 g) 170,3 4-Non-ferro 31-CuZn38 cast
12 ABS ( 840,34 g) 848,0 1-BlkPlastics 10-ABS
13 Elastomers ( 4 g) 4,0 1-BlkPlastics 1-LDPE
14 EPS ( 38,2 g) 38,5 1-BlkPlastics 6-EPS
15 PA ( 19,68 g) 19,9 2-TecPlastics 11-PA 6
16 PC ( 5,2 g) 5,2 2-TecPlastics 12-PC
17 PE ( 36,51 g) 36,8 1-BlkPlastics 2-HDPE
18 PE foil ( 45,42 g) 45,8 1-BlkPlastics 2-HDPE
19 PET ( 2,53 g) 2,6 1-BlkPlastics 2-HDPE
20 Plastics, others ( 140,06 g)
21 POM ( 4,63 g) 4,7 1-BlkPlastics 2-HDPE
22 PP ( 1549,35 g) 1563,4 1-BlkPlastics 4-PP
23 PS ( 8900,26 g) 8981,2 1-BlkPlastics 5-PS
24 PU foam - insulation ( 6223,47 g) 6280,0 2-TecPlastics 16-Flex PUR
25 PUR ( 1712,34 g) 1727,9 2-TecPlastics 15-Rigid PUR
26 PVC (excl. wire insul.) ( 352,14 g) 355,3 1-BlkPlastics 8-PVC
27 TPE ( 2,53 g) 2,6 1-BlkPlastics 1-LDPE
28 Plastics ( 81,29 g)
29 Adhesive tape ( 14,24 g)
30 color/paint ( 8,86 g) 8,9 5-Coating 39-powder coating
31 Glass ( 6219,32 g) 6275,84371 7-Misc. 54-Glass for lamps
32 Glue ( 126,56 g)
33 Paper ( 271,56 g) 274,033103 7-Misc. 57-Office paper
34 Refrigerant (see in Disposal)
35 Rubber ( 202,04 g) 203,879204 1-BlkPlastics 1-LDPE
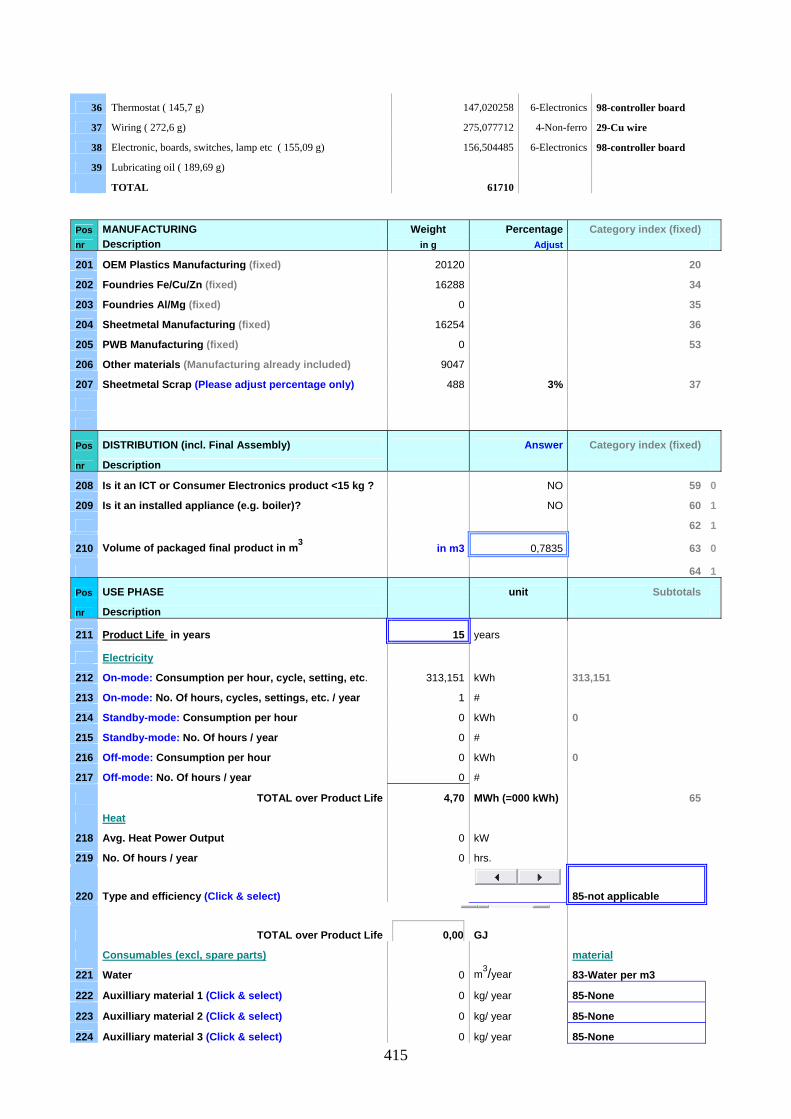
415
36 Thermostat ( 145,7 g) 147,020258 6-Electronics 98-controller board
37 Wiring ( 272,6 g) 275,077712 4-Non-ferro 29-Cu wire
38 Electronic, boards, switches, lamp etc ( 155,09 g) 156,504485 6-Electronics 98-controller board
39 Lubricating oil ( 189,69 g)
TOTAL 61710 Pos MANUFACTURING Weight Percentage Category index (fixed) nr Description in g Adjust
201 OEM Plastics Manufacturing (fixed) 20120 20
202 Foundries Fe/Cu/Zn (fixed) 16288 34
203 Foundries Al/Mg (fixed) 0 35
204 Sheetmetal Manufacturing (fixed) 16254 36
205 PWB Manufacturing (fixed) 0 53
206 Other materials (Manufacturing already included) 9047
207 Sheetmetal Scrap (Please adjust percentage only) 488 3% 37
Pos DISTRIBUTION (incl. Final Assembly) Answer Category index (fixed)
nr Description
208 Is it an ICT or Consumer Electronics product <15 kg ? NO 59 0
209 Is it an installed appliance (e.g. boiler)? 0 NO 60 1
62 1
210 Volume of packaged final product in m3 in m3 0,7835 63 0
64 1
Pos USE PHASE unit Subtotals
nr Description
211 Product Life in years 15 years
Electricity
212 On-mode: Consumption per hour, cycle, setting, etc. 313,151 kWh 313,151
213 On-mode: No. Of hours, cycles, settings, etc. / year 1 #
214 Standby-mode: Consumption per hour 0 kWh 0
215 Standby-mode: No. Of hours / year 0 #
216 Off-mode: Consumption per hour 0 kWh 0
217 Off-mode: No. Of hours / year 0 #
TOTAL over Product Life 4,70 MWh (=000 kWh) 65
Heat
218 Avg. Heat Power Output 0 kW
219 No. Of hours / year 0 hrs.
220 Type and efficiency (Click & select)
0 85-not applicable
TOTAL over Product Life
0,00 GJ
Consumables (excl, spare parts) material
221 Water 0 m3/year 83-Water per m3
222 Auxilliary material 1 (Click & select) 0 kg/ year 85-None
223 Auxilliary material 2 (Click & select) 0 kg/ year 85-None
224 Auxilliary material 3 (Click & select) 0 kg/ year 85-None

416
Maintenance, Repairs, Service
225 No. of km over Product-Life 18,93 km / Product Life 86 226 Spare parts (fixed, 1% of product materials & manuf.) 617 g
Pos DISPOSAL & RECYCLING unit Subtotals
nr Description
Substances released during Product Life and Landfill
227 Refrigerant in the product (Click & select) 48,71 g 4-R134a
228 Percentage of fugitive & dumped refrigerant 0%
229 Mercury (Hg) in the product 0 g Hg
230 Percentage of fugitive & dumped mercury 0%
Disposal: Environmental Costs perkg final product
231 Landfill (fraction products not recovered) in g en % 3085 5% 88-fixed
232 Incineration (plastics & PWB not re-used/recycled) 2414 g 91-fixed
233 Plastics: Re-use & Recycling ("cost"-side) 16599 g 92-fixed
Re-use, Recycling Benefit in g % of plastics
fraction
234 Plastics: Re-use, Closed Loop Recycling (please edit%) 503 3% 4
235 Plastics: Materials Recycling (please edit% only) 16096 80% 4
236 Plastics: Thermal Recycling (please edit% only) 2414 12% 72
237 Electronics: PWB Easy to Disassemble ? (Click&select) 0 YES 98
238 Metals & TV Glass & Misc. (95% Recycling) 39510 fixed

417
Table A.8: COLD 7 – OUTPUT from EuP-Ecoreport
Nr Life cycle Impact per product: Date Author
1 COLD 7 39210 CUTAIA-SCIALDONI
Life Cycle phases --> PRODUCTION DISTRI- USE END-OF-LIFE* TOTAL
Resources Use and Emissions Material Manuf. Total BUTION Disposal Recycl. Total Materials unit
1 Bulk Plastics g 12087 1450 10636 12087 0
2 TecPlastics g 8033 964 7069 8033 0
3 Ferro g 31017 1551 29466 31017 0
4 Non-ferro g 3710 186 3525 3710 0
5 Coating g 9 0 8 9 0
6 Electronics g 304 304 0 304 0
7 Misc. g 6550 327 6222 6550 0
Total weight g 61710 4782 56927 61710 0
see note!
Other Resources & Waste debet credit
8 Total Energy (GER) MJ 3560 1109 4669 1115 49414 481 940 -459 54738
9 of which, electricity (in primary MJ) MJ 543 667 1209 2 49333 0 61 -61 50484
10 Water (process) ltr 1288 10 1298 0 3301 0 40 -40 4559
11 Water (cooling) ltr 4372 313 4685 0 131570 0 337 -337 135918
12 Waste, non-haz./ landfill g 81396 3546 84942 564 58035 3836 237 3599 147140
13 Waste, hazardous/ incinerated g 463 0 463 11 1141 2415 37 2378 3994
Emissions (Air)
14 Greenhouse Gases in GWP100 kg CO2 eq. 195 62 257 67 2158 35 25 10 2493
15 Ozone Depletion, emissions mg R-11 eq. negligible
16 Acidification, emissions g SO2 eq. 1768 266 2034 206 12724 88 58 31 14994
17 Volatile Organic Compounds (VOC) g 6 0 6 16 19 3 0 3 45
18 Persistent Organic Pollutants (POP) ng i-Teq 403 5 408 3 327 26 0 26 765
19 Heavy Metals mg Ni eq. 1056 12 1069 29 867 129 0 129 2093
PAHs mg Ni eq. 1414 0 1414 37 121 0 3 -3 1569
20 Particulate Matter (PM, dust) g 415 41 456 2679 443 982 6 976 4554
Emissions (Water)
21 Heavy Metals mg Hg/20 988 0 988 1 328 31 0 31 1348
22 Eutrophication g PO4 60 1 61 0 2 2 1 0 63
23 Persistent Organic Pollutants (POP) ng i-Teq negligible

418
Table A.9: COLD 8 – Upright freezer – INPUT in EuP-Ecoreport
Version 5 VHK for European Commission 28 Nov. 2005 Document subject to a legal notice (see below)
ECO-DESIGN OF ENERGY-USING PRODUCTS
EuP EcoReport: INPUTS Assessment of Environmental Impact
Nr Product name Date Author
1 COLD 8 08/05/2007 CUTAIA-SCIALDONI
Pos MATERIALS Extraction & Production Weight Category Material or Process nr Description of component in g Click &select select Category first !
1 Ferrous metals ( 9927,79 g) 10084,51517 3-Ferro 23-Cast iron
2 Iron ( 437,2 g) 444,1017735 3-Ferro 23-Cast iron
3 Mixed steel+plastic ( 603 g) 612,5191432 3-Ferro 25-Stainless 18/8 coil
4 Stainless Steel ( 42,8 g) 43,47565395 3-Ferro 25-Stainless 18/8 coil
5 Steel ( 2879,6 g) 2925,05825 3-Ferro 25-Stainless 18/8 coil
6 Steel strip ( 9728,6 g) 9882,178668 3-Ferro 21-St sheet galv.
7 Steel tube & wire ( 1347 g) 1368,264156 3-Ferro 22-St tube/profile
8 Ag ( 4 g)
9 Al ( 694,28 g) 705,2360542 4-Non-ferro 26-Al sheet/extrusion
10 AL tube ( 16 g) 16,25258091 4-Non-ferro 26-Al sheet/extrusion
11 Cu ( 1570 g) 1594,783486 4-Non-ferro 29-Cu wire
12 Cu tube ( 45,6 g) 46,31985561 4-Non-ferro 30-Cu tube/sheet
13 solder & braze ( 2,2 g) 2,234729876 4-Non-ferro 31-CuZn38 cast
14 Accumulator ( 272 g)
15 Handle ( 65 g)
16 ABS ( 999,4 g) 1015,176835 1-BlkPlastics 10-ABS
17 Elastomers ( 8 g) 8,126290457 1-BlkPlastics 1-LDPE
18 EPS - Insulation ( 2,4 g) 2,437887137 1-BlkPlastics 6-EPS
19 PA ( 55,2 g) 56,07140415 2-TecPlastics 11-PA 6
20 PE ( 580 g) 589,1560581 1-BlkPlastics 2-HDPE
21 Plastics, others ( 116,2 g)
22 POM ( 20,6 g) 20,92519793 1-BlkPlastics 2-HDPE
23 PP ( 1865,2 g) 1894,64462 1-BlkPlastics 4-PP
24 PPO ( 7,2 g) 7,313661411 1-BlkPlastics 4-PP
25 PS ( 10322,4 g) 10485,35258 1-BlkPlastics 5-PS
26 PU Foam - Insulation ( 6523,8 g) 6626,786711 2-TecPlastics 16-Flex PUR
27 PUR ( 1985,8 g) 2017,148449 2-TecPlastics 15-Rigid PUR
28 PVC (excl. wire insul.) ( 529 g) 537,4 1-BlkPlastics 8-PVC
29 SAN ( 1232,2 g) 1251,7 1-BlkPlastics 9-SAN
30 TPE ( 6,2 g) 6,3 1-BlkPlastics 1-LDPE
31 Plastics ( 72,7 g)
32 Adhesive tape ( 0,4 g)
33 Butyl rubber ( 19 g) 19,3 1-BlkPlastics 1-LDPE
34 Capacitor ( 10,6 g) 10,7673349 6-Electronics 44-big caps & coils
35 Dessicant ( 2 g)

419
36 Electronic, boards, switches, lamp etc ( 240,2 g) 243,991871 6-Electronics 98-controller board
37 Glue ( 5 g)
38 Magnet ( 45,6 g)
39 Others ( 0,6 g)
40 Paint ( 141,6 g) 143,835341 5-Coating 39-powder coating 41
42 Paper (booklets etc) ( 182,4 g) 185,279422 7-Misc. 57-Office paper
43 PCB ( 8,8 g)
44 Refrigerant (see in Disposal) ( 53 g)
45 Refrigerant HC (see in Disposal) ( 12,4 g)
46 Rubber ( 26,6 g) 27,0199158 1-BlkPlastics 1-LDPE
47 Thermostat ( 88,4 g) 89,7955096 6-Electronics 98-controller board
48 Wiring ( 268 g) 272,23073 4-Non-ferro 29-Cu wire
49 Lubricating oil ( 169,63 g)
TOTAL 53236
Pos MANUFACTURING Weight Percentage Category index (fixed) nr Description in g Adjust
201 OEM Plastics Manufacturing (fixed) 24565 20
202 Foundries Fe/Cu/Zn (fixed) 10531 34
203 Foundries Al/Mg (fixed) 0 35
204 Sheetmetal Manufacturing (fixed) 14231 36
205 PWB Manufacturing (fixed) 11 53
206 Other materials (Manufacturing already included) 3898
207 Sheetmetal Scrap (Please adjust percentage only) 427 3% 37
Pos DISTRIBUTION (incl. Final Assembly) Answer Category index (fixed)
nr Description
208 Is it an ICT or Consumer Electronics product <15 kg ? NO 59 0
209 Is it an installed appliance (e.g. boiler)? 0 NO 60 1
62 1
210 Volume of packaged final product in m3 in m3 0,5216 63 0
64 1
Pos USE PHASE unit Subtotals
nr Description
211 Product Life in years 14 years
Electricity
212 On-mode: Consumption per hour, cycle, setting, etc. 254,4284 kWh 254,4284
213 On-mode: No. Of hours, cycles, settings, etc. / year 1 #
214 Standby-mode: Consumption per hour 0 kWh 0
215 Standby-mode: No. Of hours / year 0 #
216 Off-mode: Consumption per hour 0 kWh 0
217 Off-mode: No. Of hours / year 0 #
TOTAL over Product Life 3,56 MWh (=000 kWh) 65

420
Heat
218 Avg. Heat Power Output 0 kW
219 No. Of hours / year 0 hrs.
220 Type and efficiency (Click & select)
0 85-not applicable
TOTAL over Product Life
0,00 GJ
Consumables (excl, spare parts) material
221 Water 0 m3/year 83-Water per m3
222 Auxilliary material 1 (Click & select) 0 kg/ year 85-None
223 Auxilliary material 2 (Click & select) 0 kg/ year 85-None
224 Auxilliary material 3 (Click & select) 0 kg/ year 85-None
Maintenance, Repairs, Service
225 No. of km over Product-Life 2,75 km / Product Life 86 226 Spare parts (fixed, 1% of product materials & manuf.) 532 g
Pos DISPOSAL & RECYCLING unit Subtotals
nr Description
Substances released during Product Life and Landfill
227 Refrigerant in the product (Click & select) 65,4 g 4-R134a
228 Percentage of fugitive & dumped refrigerant 0%
229 Mercury (Hg) in the product 0 g Hg
230 Percentage of fugitive & dumped mercury 0%
Disposal: Environmental Costs perkg final product
231 Landfill (fraction products not recovered) in g en % 3726 7% 88-fixed
232 Incineration (plastics & PWB not re-used/recycled) 3199 g 91-fixed
233 Plastics: Re-use & Recycling ("cost"-side) 19652 g 92-fixed
Re-use, Recycling Benefit in g % of plastics
fraction
234 Plastics: Re-use, Closed Loop Recycling (please edit%) 2211 9% 4
235 Plastics: Materials Recycling (please edit% only) 17441 71% 4
236 Plastics: Thermal Recycling (please edit% only) 3193 13% 72
237 Electronics: PWB Easy to Disassemble ? (Click&select) 5 YES 98
238 Metals & TV Glass & Misc. (95% Recycling) 27227 fixed
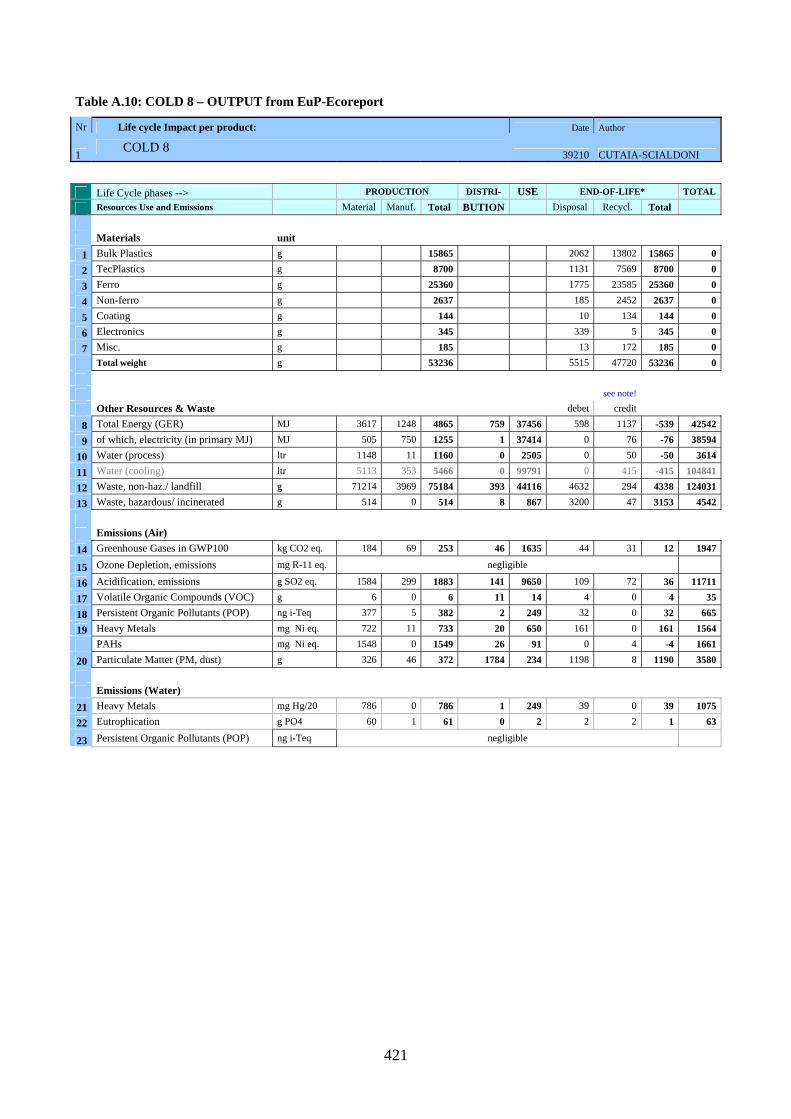
421
Table A.10: COLD 8 – OUTPUT from EuP-Ecoreport
Nr Life cycle Impact per product: Date Author
1 COLD 8 39210 CUTAIA-SCIALDONI
Life Cycle phases --> PRODUCTION DISTRI- USE END-OF-LIFE* TOTAL
Resources Use and Emissions Material Manuf. Total BUTION Disposal Recycl. Total Materials unit
1 Bulk Plastics g 15865 2062 13802 15865 0
2 TecPlastics g 8700 1131 7569 8700 0
3 Ferro g 25360 1775 23585 25360 0
4 Non-ferro g 2637 185 2452 2637 0
5 Coating g 144 10 134 144 0
6 Electronics g 345 339 5 345 0
7 Misc. g 185 13 172 185 0
Total weight g 53236 5515 47720 53236 0
see note!
Other Resources & Waste debet credit
8 Total Energy (GER) MJ 3617 1248 4865 759 37456 598 1137 -539 42542
9 of which, electricity (in primary MJ) MJ 505 750 1255 1 37414 0 76 -76 38594
10 Water (process) ltr 1148 11 1160 0 2505 0 50 -50 3614
11 Water (cooling) ltr 5113 353 5466 0 99791 0 415 -415 104841
12 Waste, non-haz./ landfill g 71214 3969 75184 393 44116 4632 294 4338 124031
13 Waste, hazardous/ incinerated g 514 0 514 8 867 3200 47 3153 4542
Emissions (Air)
14 Greenhouse Gases in GWP100 kg CO2 eq. 184 69 253 46 1635 44 31 12 1947
15 Ozone Depletion, emissions mg R-11 eq. negligible
16 Acidification, emissions g SO2 eq. 1584 299 1883 141 9650 109 72 36 11711
17 Volatile Organic Compounds (VOC) g 6 0 6 11 14 4 0 4 35
18 Persistent Organic Pollutants (POP) ng i-Teq 377 5 382 2 249 32 0 32 665
19 Heavy Metals mg Ni eq. 722 11 733 20 650 161 0 161 1564
PAHs mg Ni eq. 1548 0 1549 26 91 0 4 -4 1661
20 Particulate Matter (PM, dust) g 326 46 372 1784 234 1198 8 1190 3580
Emissions (Water)
21 Heavy Metals mg Hg/20 786 0 786 1 249 39 0 39 1075
22 Eutrophication g PO4 60 1 61 0 2 2 2 1 63
23 Persistent Organic Pollutants (POP) ng i-Teq negligible

422
Table A.11: COLD 9 – Chest freezer – INPUT in EuP-Ecoreport
Version 5 VHK for European Commission 28 Nov. 2005 Document subject to a legal notice (see below)
ECO-DESIGN OF ENERGY-USING PRODUCTS
EuP EcoReport: INPUTS Assessment of Environmental Impact
Nr Product name Date Author
1 COLD 9 08/05/2007 CUTAIA-SCIALDONI
Pos MATERIALS Extraction & Production Weight Category Material or Process nr Description of component in g Click &select select Category first !
1 Iron ( 6537,67 g) 6829,7 3-Ferro 23-Cast iron
2 Mixed steel+plastic ( 162,67 g) 169,9 3-Ferro 25-Stainless 18/8 coil
3 Steel other ( 1779,67 g) 1859,2 3-Ferro 25-Stainless 18/8 coil
4 Steel strip ( 9054,67 g) 9459,1 3-Ferro 21-St sheet galv.
5 Ferrous metals ( 8554 g) 8936,1 3-Ferro 23-Cast iron
6 Al ( 3216,33 g) 3360,0 4-Non-ferro 26-Al sheet/extrusion
7 Cu ( 1189,25 g) 1242,4 4-Non-ferro 29-Cu wire
8 ABS ( 197,33 g) 206,1 1-BlkPlastics 10-ABS
9 PA ( 41 g) 42,8 2-TecPlastics 11-PA 6
10 PE ( 51 g) 53,3 1-BlkPlastics 2-HDPE
11 Plastics, others ( 94 g)
12 PP ( 845,6 g) 883,4 1-BlkPlastics 4-PP
13 PS ( 2211,67 g) 2310,5 1-BlkPlastics 5-PS
14 PU Foam - Insulation ( 5821 g) 6081,0 2-TecPlastics 16-Flex PUR
15 PUR ( 2188 g) 2285,7 2-TecPlastics 15-Rigid PUR
16 PVC ( 2026,67 g) 2117,2 1-BlkPlastics 8-PVC
17 PVC (excl. wire insul.) ( 327 g) 341,6 1-BlkPlastics 8-PVC
18 Plastics ( 106,93 g)
19 Electronic, boards, switches, lamp etc ( 25,47 g) 26,6 6-Electronics 98-controller board
20 Others ( 842,67 g)
21 Paper (booklets etc) ( 114,67 g) 119,8 7-Misc. 57-Office paper
22 Refrigerant (see in Disposal)
23 Rubber ( 9,33 g) 9,8 1-BlkPlastics 1-LDPE
24 Thermopaste (paste) ( 707 g)
25 Thermostat ( 128,67 g) 134,4 6-Electronics 98-controller board
26 Wiring ( 295 g) 308,2 4-Non-ferro 29-Cu wire
27 Lubricating oil ( 249,49 g)
TOTAL 46777 Pos MANUFACTURING Weight Percentage Category index (fixed) nr Description in g Adjust
201 OEM Plastics Manufacturing (fixed) 14331 20
202 Foundries Fe/Cu/Zn (fixed) 15766 34
203 Foundries Al/Mg (fixed) 0 35
204 Sheetmetal Manufacturing (fixed) 14848 36

423
205 PWB Manufacturing (fixed) 0 53
206 Other materials (Manufacturing already included) 1831
207 Sheetmetal Scrap (Please adjust percentage only) 445 3% 37
Pos DISTRIBUTION (incl. Final Assembly) Answer Category index (fixed)
nr Description
208 Is it an ICT or Consumer Electronics product <15 kg ? NO 59 0
209 Is it an installed appliance (e.g. boiler)? 0 NO 60 1
62 1
210 Volume of packaged final product in m3 in m3 0,756333333 63 0
64 1
Pos USE PHASE unit Subtotals
nr Description
211 Product Life in years 15 years
Electricity
212 On-mode: Consumption per hour, cycle, setting, etc. 321,1 kWh 321,1
213 On-mode: No. Of hours, cycles, settings, etc. / year 1 #
214 Standby-mode: Consumption per hour 0 kWh 0
215 Standby-mode: No. Of hours / year 0 #
216 Off-mode: Consumption per hour 0 kWh 0
217 Off-mode: No. Of hours / year 0 #
TOTAL over Product Life 4,82 MWh (=000 kWh) 65
Heat
218 Avg. Heat Power Output 0 kW
219 No. Of hours / year 0 hrs.
220 Type and efficiency (Click & select)
0 85-not applicable
TOTAL over Product Life
0,00 GJ
Consumables (excl, spare parts) material
221 Water 0 m3/year 83-Water per m3
222 Auxilliary material 1 (Click & select) 0 kg/ year 85-None
223 Auxilliary material 2 (Click & select) 0 kg/ year 85-None
224 Auxilliary material 3 (Click & select) 0 kg/ year 85-None
Maintenance, Repairs, Service
225 No. of km over Product-Life km / Product Life 86 226 Spare parts (fixed, 1% of product materials & manuf.) 468 g
Pos DISPOSAL & RECYCLING unit Subtotals
nr Description
Substances released during Product Life and Landfill
227 Refrigerant in the product (Click & select) 82,7 g 4-R134a
228 Percentage of fugitive & dumped refrigerant 0%
229 Mercury (Hg) in the product 0 g Hg
230 Percentage of fugitive & dumped mercury 0%

424
Disposal: Environmental Costs perkg final product
231 Landfill (fraction products not recovered) in g en % 2339 5% 88-fixed
232 Incineration (plastics & PWB not re-used/recycled) 1720 g 91-fixed
233 Plastics: Re-use & Recycling ("cost"-side) 11895 g 92-fixed
Re-use, Recycling Benefit in g % of plastics
fraction
234 Plastics: Re-use, Closed Loop Recycling (please edit%) 0 0% 4
235 Plastics: Materials Recycling (please edit% only) 11895 83% 4
236 Plastics: Thermal Recycling (please edit% only) 1720 12% 72
237 Electronics: PWB Easy to Disassemble ? (Click&select) 0 YES 98
238 Metals & TV Glass & Misc. (95% Recycling) 30823 fixed

425
Table A.12: COLD 9 – Refrigerator – OUTPUT from EuP-Ecoreport
Nr Life cycle Impact per product: Date Author
1 COLD 9 39210 CUTAIA-SCIALDONI
Life Cycle phases --> PRODUCTION DISTRI- USE END-OF-LIFE* TOTAL
Resources Use and Emissions Material Manuf. Total BUTION Disposal Recycl. Total Materials unit
1 Bulk Plastics g 5922 711 5211 5922 0
2 TecPlastics g 8410 1009 7400 8410 0
3 Ferro g 27254 1363 25891 27254 0
4 Non-ferro g 4911 246 4665 4911 0
5 Coating g 0 0 0 0 0
6 Electronics g 161 161 0 161 0
7 Misc. g 120 6 114 120 0
Total weight g 46777 3495 43282 46777 0
see note!
Other Resources & Waste debet credit
8 Total Energy (GER) MJ 2871 850 3721 1078 50610 353 661 -308 55101
9 of which, electricity (in primary MJ) MJ 336 511 847 2 50582 0 43 -43 51388
10 Water (process) ltr 876 8 883 0 3380 0 29 -29 4235
11 Water (cooling) ltr 3234 240 3474 0 134897 0 238 -238 138133
12 Waste, non-haz./ landfill g 72347 2727 75074 546 59388 2906 167 2738 137746
13 Waste, hazardous/ incinerated g 368 0 368 11 1169 1721 26 1694 3242
Emissions (Air)
14 Greenhouse Gases in GWP100 kg CO2 eq. 160 47 207 65 2209 26 17 9 2491
15 Ozone Depletion, emissions mg R-11 eq. negligible
16 Acidification, emissions g SO2 eq. 1339 204 1542 199 13038 64 40 25 14804
17 Volatile Organic Compounds (VOC) g 5 0 5 16 19 2 0 2 42
18 Persistent Organic Pollutants (POP) ng i-Teq 380 5 385 3 335 20 0 20 743
19 Heavy Metals mg Ni eq. 475 11 486 28 873 95 0 95 1482
PAHs mg Ni eq. 792 0 792 36 108 0 2 -2 934
20 Particulate Matter (PM, dust) g 406 31 438 2586 283 714 5 710 4016
Emissions (Water)
21 Heavy Metals mg Hg/20 669 0 669 1 333 23 0 23 1026
22 Eutrophication g PO4 51 0 51 0 2 1 1 0 53
23 Persistent Organic Pollutants (POP) ng i-Teq negligible

426
Appendix C: SimaPro data
A.1 THE SIMAPRO V.7.1 SOFTWARE Even if it is not in the scope of this study to perform a LCA in full accordance with ISO 14040, the methodology was applied as close as possible. To this end a specialized LCA software tool was used, the SimaPro 7.1, the last version of the software edit by Prè, NL (http://www.pre.nl/simapro/default.htm).
This software allows one to perform an ecological balance of a product along all its life, taking into account for each material used, raw material extraction, energy and water consumption (with distinction between renewable and non renewable resources) , and related impacts in air, water, and soil.
Again it is possible to use specific models for energy production, waste treatment, transport and ancillary materials production. It is also possible to use and compare different environmental impact assessment methodologies (Ecoindicator, CML, EPS, Ecopoint…) performing sensitivity analysis. Again in this software many databases are included in a form to be used for a same ecobalance (avoiding double sum of an impact or loss of data).
Using SimaPro it is possible to simulate the LCA of objects or services according to the ISO14040 standards.
A.2 INPUT DATA IN SIMAPRO Table A.13: COLD 7 average model – INPUT data in SimaPro SW - ASSEMBLING
SimaPro 7.1 Phase product
Project EupProject
Nome
COLD7 assembling as average on data from producers
Materials/assembly Note
Crude iron I 16024,94 g ferrous metals
Crude iron I 746,34 g iron
Steel I 7,35 g steel + plastic
X5CrNi18 (304) I 902,58 g Stainless Steel
Steel I 3494 g steel
Steel I 1441,23 g Steel other
Steel I 9657,9 g Steel strip
Aluminium rec. I 1356,27 g
Copper I 1911,57 g
Zinc I 170,49 g
Cardboard duplex/tripl 2699,94 g for packaging
PS (EPS) B250 (1998) 1250,89 g for packaging
PE (LDPE) I 259,52 g for packaging (PE foil) + laminating
PP granulate average B250 35,26 g
Poplar I 10,1 g wood
ABS I 858,26 g
EPDM rubber ETH U 4,1 g

427
SimaPro 7.1 Phase product
PS (EPS) B250 (1998) 39 g
PA 6 I 20,1 g
PC I 5,31 g
PE (HDPE) I 37,29 g as PE
PE (HDPE) I 46,39 g as PE foil + laminating
PET amorph I 2,6 g
HDPE B250 4,73 g as POM
PP I 1582,4 g
PS (EPS) B250 (1998) 9090,09 g
PUR semi rigid foam I 6356,2 g PU foam - insulation
PUR semi rigid foam I 1748,86 g
PVC B250 359,65 g
adhesive - glue 14,38 g as adhesive
Paint ETH S 8,95 g white painting powder (53 g)
Glass (white) B250 6281,51 g
adhesive - glue 127,83 g
Kraft paper, bleached, at plant/RER U 274,28 g
Refrigerant R134a, at plant/RER U 49,2 g
EPDM rubber ETH U 204,06 g
Electronics for control units/RER U 147,15 g AS THERMOSTAT (10 g)
Copper I 275,33 g AS WIRe + wiring
Electronics for control units/RER U 156,65 g electronics
Lubricating oil, at plant/RER U 191,58 g
Water demineralized ETH U 228 kg consumption in assembling phase
Lubricating oil, at plant/RER U 27 g
Nitrogen, liquid, at plant/RER U 84 g
Argon, liquid, at plant/RER U 5 g
Oxygen, liquid, at plant/RER U 27 g cotton+resins noise adsorbers
Processes
Electricity MV use in UCPTE U 25,34 kWh during assembling
Heat gas B250 15,69 MJ
Truck 28t B250 68 tkm transport for assembling
Sea ship B250 29 tkm transport for assembling
Hot rolling, steel/RER U 2923 g
Sheet rolling, steel/RER U 4829 g
Extruding alum I 678 g
Wire drawing, copper/RER U 1092 g
Foaming, expanding/RER U 12940 g
Injection moulding/RER U 2001 g
Extrusion PVC I 251 g

428
Table A.14: COLD 7 average model – INPUT data in SimaPro SW – SPARE PARTS
SimaPro 7.1 Phase product
Project EupProject Assembly: Nome COLD7 use materials (per LC) Materials/assembly COLD7 assembling 0,45 p
Table A.15: COLD 7 average model – INPUT data in SimaPro SW – LIFE CYCLE
SimaPro 7.1 Phase product
Project EupProject Life Cycle: Nome cold 7 Assembly COLD7 assembling 1 p Processes Electricity LV use UCPTE U 4697 kWh Delivery van (<3.5t) B250 0,94 tkm Scenario waste disposal/end of life cold 7 EoL Supplementary Life Cycle cold 7 use materials (per LC) 1
Table A.16: COLD 7 average model – INPUT data in SimaPro SW – END OF LIFE
SimaPro 7.1 Phase product
Project EupProject Scenario di fine vita: Nome cold 7 EoL
429
SimaPro 7.1 Phase product
Referred to assembly COLD7 assembling 1 Processes Scenario of waste treatment Recycling only B250 avoided 81Incineration 2000 B250 (98) avoided 13Landfill B250 (98) 6
A.3 ECO-INDICATOR 95 - REV EUP V2.03 SimaPro 7.1 Method Data:
08/08/2007 Period: 16.11.31
Project EupProject Nome Eco-indicator 95 - rev EuP V2.03 Comment Revised by Laura Cutaia (29.07.07) to convert output in form of the software EuP Ecoreport
The Eco-indicator 95 method was developed under the Dutch NOH programme by PRé consultants in a joint project with Philips Consumer Electronics, NedCar, Océ Copiers, Schuurink, CML Leiden, TU-Delft, IVAM-ER (Amsterdam) and CE Delft.
This V2 version is adapted for SimaPro 6.0. All characterisation factors in this method are entered for the 'unspecified' sub-compartment of each compartment (Raw materials, air, water, soil) and thus applicable on all sub-compartments.
Other adaptations (V2.1): - Solid waste expanded with all mass waste flows in SimaPro 6 database - Energy expanded with energy resources in SimaPro 6 database - Pesticides to water expanded with pesticides to water in SimaPro 6 database
- Carbon dioxide, biogenic and uptake from carbon dioxide from air (Carbon dioxide, in air) are added to the methodology. Similar for 'Carbon monoxide, fossil' and 'Carbon monoxide, biogenic'.
Other adaptations (August 2004): - Energy expanded with energy resources in SimaPro not adapted in V2.1 (values taken from Cumulative energy demand V1.2 method) - Greenhouse, Summer smog: Methane, biogenic and Methane, fossil added - Euthrophication: phosphorus compounds completed. - Acidification, Euthrophication: nitrogen compounds completed. - Acidification: sulphur compounds completed.
- "Particulates, > 2.5 um, and < 10um" added with the assumption that the characterization factor is the same as for "Particulates, < 10 um"
Other adaptations (March 2005): - Eutrophication: Dinitrogen monoxide removed. Nitrogen, to water added (equal to nitrogen, total, to water). - Solid waste: Waste, from drilling, unspecified added. Other adaptations (August 2005, v2.03):
- In impact category Energy resources the characterisation value for "Gas, natural in ground" has been changed from 40,3 to 38.3 MJ LHV/m3 following the ecoinvent 1.2 update.
This method is NOT fully adapted for inventory data from the ecoinvent library and the USA Input Output Database 98, and therefore omits emissions that could have been included in impact assessment.

430
SimaPro 7.1 Method Data:
08/08/2007 Period: 16.11.31
The characterisation conforms to the CML guide used in the SimaPro2 method; however the toxicity scores are specified into heavy metals, carcinogenic substances, pesticides and winter smog.
Normalisation is based on 1990 levels for Europe excl. former USSR. In Europe g missing data was extrapolated using GNP's (Gross national product). In Europe e missing data was extrapolated using energy use. The Europe e normalisation is used in the Eco-indicator method.
Weighting is based on distance to target. Criteria for target levels are: - One excess death per million per year - 5% ecosystem degradation. - Avoidance of smog periods
Due to continual adjustments of the method and/or inventory data sets the Eco-indicator 95 in SimaPro will not give the same result as the original printed version.
See database manual for further information. More information and the "Manual for Designers" can also be downloaded from http://www.pre.nl
Use Damage Assessment No Use Normalization Yes Use Weighting Yes Use Addition Yes Weighting unit Pt Categories of Impact greenhouse kg CO2
Air (unspecified) Carbon dioxide 000124-38-9 1 kg CO2 / kg
Air (unspecified) Carbon dioxide, biogenic 000124-38-9 1 kg CO2 / kg
Air (unspecified) Carbon dioxide, fossil 000124-38-9 1 kg CO2 / kg
Prima (unspecified) Carbon dioxide, in air 000124-38-9 -1 kg CO2 / kg
Air (unspecified) Carbon monoxide 000630-08-0 1,57 kg CO2 / kg
Air (unspecified) Carbon monoxide, biogenic 000630-08-0 1,57 kg CO2 / kg
Air (unspecified) Carbon monoxide, fossil 000630-08-0 1,57 kg CO2 / kg
Air (unspecified) Chlorinated fluorocarbons, hard 7100 kg CO2 / kg Air (unspecified) Chlorinated fluorocarbons, soft 1600 kg CO2 / kg
Air (unspecified) Chloroform 000067-66-3 25 kg CO2 / kg
Air (unspecified) Dinitrogen monoxide 010024-97-2 296 kg CO2 / kg
Air (unspecified) Ethane, 1-chloro-1,1-difluoro-, HCFC-142 000075-68-3 1800 kg CO2 / kg
Air (unspecified) Ethane, 1,1-dichloro-1-fluoro-, HCFC-141b 001717-00-6 580 kg CO2 / kg
Air (unspecified) Ethane, 1,1-difluoro-, HFC-152a 000075-37-6 150 kg CO2 / kg
Air (unspecified) Ethane, 1,1,1-trichloro-, HCFC-140 000071-55-6 100 kg CO2 / kg
Air (unspecified) Ethane, 1,1,1-trifluoro-, HCFC-143a 000420-46-2 3800 kg CO2 / kg
Air (unspecified) Ethane, 1,1,1,2-tetrafluoro-, HFC-134a 000811-97-2 1300 kg CO2 / kg
Air (unspecified) Ethane, 1,1,2-trichloro-1,2,2-trifluoro-, CFC-113 000076-13-1 4500 kg CO2 / kg
Air (unspecified) Ethane, 1,2-dichloro-1,1,2,2-tetrafluoro-, CFC-114 000076-14-2 7000 kg CO2 / kg
Air (unspecified) Ethane, 2-chloro-1,1,1,2-tetrafluoro-, HCFC-124 002837-89-0 440 kg CO2 / kg
431
SimaPro 7.1 Method Data:
08/08/2007 Period: 16.11.31
Air (unspecified) Ethane, 2,2-dichloro-1,1,1-trifluoro-, HCFC-123 000306-83-2 90 kg CO2 / kg
Air (unspecified) Ethane, chloropentafluoro-, CFC-115 000076-15-3 7000 kg CO2 / kg
Air (unspecified) Ethane, hexafluoro-, HFC-116 000076-16-4 9200 kg CO2 / kg
Air (unspecified) Ethane, pentafluoro-, HFC-125 000354-33-6 3400 kg CO2 / kg
Air (unspecified) Methane 000074-82-8 21 kg CO2 / kg
Air (unspecified) Methane, biogenic 000074-82-8 21 kg CO2 / kg
Air (unspecified) Methane, bromochlorodifluoro-, Halon 1211 000353-59-3 4900 kg CO2 / kg
Air (unspecified) Methane, bromotrifluoro-, Halon 1301 000075-63-8 4900 kg CO2 / kg
Air (unspecified) Methane, chlorodifluoro-, HCFC-22 000075-45-6 1600 kg CO2 / kg
Air (unspecified) Methane, chlorotrifluoro-, CFC-13 000075-72-9 13000 kg CO2 / kg
Air (unspecified) Methane, dichloro-, HCC-30 000075-09-2 15 kg CO2 / kg
Air (unspecified) Methane, dichlorodifluoro-, CFC-12 000075-71-8 7100 kg CO2 / kg
Air (unspecified) Methane, fossil 000074-82-8 11 kg CO2 / kg
Air (unspecified) Methane, tetrachloro-, CFC-10 000056-23-5 1300 kg CO2 / kg
Air (unspecified) Methane, tetrafluoro-, FC-14 000075-73-0 6500 kg CO2 / kg
Air (unspecified) Methane, trichlorofluoro-, CFC-11 000075-69-4 3400 kg CO2 / kg
Impact Category ozone layer kg CFC11 Air (unspecified) Chlorinated fluorocarbons, hard 1 kg CFC11 / kg Air (unspecified) Chlorinated fluorocarbons, soft 0,055 kg CFC11 / kg
Air (unspecified) Ethane, 1-chloro-1,1-difluoro-, HCFC-142 000075-68-3 0,065 kg CFC11 / kg
Air (unspecified) Ethane, 1,1-dichloro-1-fluoro-, HCFC-141b 001717-00-6 0,11 kg CFC11 / kg
Air (unspecified) Ethane, 1,1,1-trichloro-, HCFC-140 000071-55-6 0,12 kg CFC11 / kg
Air (unspecified) Ethane, 1,1,1-trifluoro-2,2-chlorobromo-, Halon 2311 000151-67-7 0,14 kg CFC11 / kg
Air (unspecified) Ethane, 1,1,1,2-tetrafluoro-2-bromo-, Halon 2401 000124-72-1 0,25 kg CFC11 / kg
Air (unspecified) Ethane, 1,1,2-trichloro-1,2,2-trifluoro-, CFC-113 000076-13-1 1,07 kg CFC11 / kg
Air (unspecified) Ethane, 1,2-dibromotetrafluoro-, Halon 2402 000124-73-2 7 kg CFC11 / kg
Air (unspecified) Ethane, 1,2-dichloro-1,1,2,2-tetrafluoro-, CFC-114 000076-14-2 0,8 kg CFC11 / kg
Air (unspecified) Ethane, 2-chloro-1,1,1,2-tetrafluoro-, HCFC-124 002837-89-0 0,022 kg CFC11 / kg
Air (unspecified) Ethane, 2,2-dichloro-1,1,1-trifluoro-, HCFC-123 000306-83-2 0,02 kg CFC11 / kg
Air (unspecified) Ethane, chloropentafluoro-, CFC-115 000076-15-3 0,5 kg CFC11 / kg
Air (unspecified) Methane, bromo-, Halon 1001 000074-83-9 0,6 kg CFC11 / kg
Air (unspecified) Methane, bromochlorodifluoro-, Halon 1211 000353-59-3 4 kg CFC11 / kg
Air (unspecified) Methane, bromodifluoro-, Halon 1201 001511-62-2 1,4 kg CFC11 / kg
Air (unspecified) Methane, bromotrifluoro-, Halon 1301 000075-63-8 16 kg CFC11 / kg
Air (unspecified) Methane, chlorodifluoro-, HCFC-22 000075-45-6 0,055 kg CFC11 / kg
Air (unspecified) Methane, chlorotrifluoro-, CFC-13 000075-72-9 1 kg CFC11 / kg
Air (unspecified) Methane, dibromodifluoro-, Halon 1202 000075-61-6 1,25 kg CFC11 / kg
Air (unspecified) Methane, dichlorodifluoro-, CFC-12 000075- 1 kg CFC11 / kg

432
SimaPro 7.1 Method Data:
08/08/2007 Period: 16.11.31 71-8
Air (unspecified) Methane, tetrachloro-, CFC-10 000056-23-5 1,08 kg CFC11 / kg
Air (unspecified) Methane, trichlorofluoro-, CFC-11 000075-69-4 1 kg CFC11 / kg
Air (unspecified) Propane, 1,3-dichloro-1,1,2,2,3-pentafluoro-, HCFC-225cb 000507-55-1 0,033 kg CFC11 / kg
Air (unspecified) Propane, 3,3-dichloro-1,1,1,2,2-pentafluoro-, HCFC-225ca 000422-56-0 0,025 kg CFC11 / kg
Impact Category acidification kg SO2
Air (unspecified) Ammonia 007664-41-7 1,88 kg SO2 / kg
Air (unspecified) Ammonium carbonate 000506-87-6 0,67 kg SO2 / kg
Air (unspecified) Ammonium nitrate 006484-52-2 0,4 kg SO2 / kg
Air (unspecified) Ammonium, ion 014798-03-9 1,78 kg SO2 / kg
Air (unspecified) Dinitrogen monoxide 010024-97-2 1,78 kg SO2 / kg
Air (unspecified) Hydrogen chloride 007647-01-0 0,88 kg SO2 / kg
Air (unspecified) Hydrogen fluoride 007664-39-3 1,6 kg SO2 / kg
Air (unspecified) Hydrogen sulphide 007783-06-4 1,88 kg SO2 / kg
Air (unspecified) Nitric acid 007697-37-2 0,51 kg SO2 / kg
Air (unspecified) Nitric oxide 010102-43-9 1,07 kg SO2 / kg
Air (unspecified) Nitrogen dioxide 010102-44-0 0,7 kg SO2 / kg
Air (unspecified) Nitrogen oxides 011104-93-1 0,7 kg SO2 / kg
Air (unspecified) Sulphur dioxide 007446-09-5 1 kg SO2 / kg
Air (unspecified) Sulphur oxides 1 kg SO2 / kg
Air (unspecified) Sulphur trioxide 007446-11-9 0,8 kg SO2 / kg
Air (unspecified) Sulphuric acid 007664-93-9 0,65 kg SO2 / kg
Impact Category eutrophication kg PO4
Land (unspecified) Ammonia 007664-41-7 0,33 kg PO4 / kg
Water (unspecified) Ammonia 007664-41-7 0,33 kg PO4 / kg
Air (unspecified) Ammonia 007664-41-7 0,33 kg PO4 / kg
Air (unspecified) Ammonium carbonate 000506-87-6 0,12 kg PO4 / kg
Land (unspecified) Ammonium nitrate 006484-52-2 0,074 kg PO4 / kg
Air (unspecified) Ammonium nitrate 006484-52-2 0,074 kg PO4 / kg
Water (unspecified) Ammonium, ion 014798-03-9 0,33 kg PO4 / kg
Land (unspecified) Ammonium, ion 014798-03-9 0,33 kg PO4 / kg
Air (unspecified) Ammonium, ion 014798-03-9 0,33 kg PO4 / kg
Water (unspecified) BOD5, Biological Oxygen Demand 0,11 kg PO4 / kg Water (unspecified) COD, Chemical Oxygen Demand 0,05 kg PO4 / kg Water (unspecified) DOC, Dissolved Organic Carbon 0,066 kg PO4 / kg Water (unspecified) Kjeldahl-N 0,42 kg PO4 / kg
Air (unspecified) Nitrate 014797-55-8 0,1 kg PO4 / kg
Land (unspecified) Nitrate 014797-55-8 0,1 kg PO4 / kg

433
SimaPro 7.1 Method Data:
08/08/2007 Period: 16.11.31
Water (unspecified) Nitrate 014797-55-8 0,1 kg PO4 / kg
Land (unspecified) Nitric acid 007697-37-2 0,093 kg PO4 / kg
Water (unspecified) Nitric acid 007697-37-2 0,093 kg PO4 / kg
Air (unspecified) Nitric acid 007697-37-2 0,093 kg PO4 / kg
Air (unspecified) Nitric oxide 010102-43-9 0,2 kg PO4 / kg
Water (unspecified) Nitrite 014797-65-0 0,13 kg PO4 / kg
Air (unspecified) Nitrite 014797-65-0 0,13 kg PO4 / kg
Water (unspecified) Nitrogen 007727-37-9 0,42 kg PO4 / kg
Air (unspecified) Nitrogen dioxide 010102-44-0 0,13 kg PO4 / kg
Air (unspecified) Nitrogen oxides 011104-93-1 0,13 kg PO4 / kg
Land (unspecified) Nitrogen oxides 011104-93-1 0,13 kg PO4 / kg
Water (unspecified) Nitrogen oxides 011104-93-1 0,13 kg PO4 / kg
Land (unspecified) Nitrogen, total 0,42 kg PO4 / kg Water (unspecified) Nitrogen, total 0,42 kg PO4 / kg Air (unspecified) Nitrogen, total 0,42 kg PO4 / kg
Land (unspecified) Phosphate 014265-44-2 1 kg PO4 / kg
Air (unspecified) Phosphate 014265-44-2 1 kg PO4 / kg
Water (unspecified) Phosphate 014265-44-2 1 kg PO4 / kg
Land (unspecified) Phosphoric acid 007664-38-2 0,97 kg PO4 / kg
Air (unspecified) Phosphoric acid 007664-38-2 0,97 kg PO4 / kg
Water (unspecified) Phosphoric acid 007664-38-2 0,97 kg PO4 / kg
Water (unspecified) Phosphorus 007723-14-0 3,06 kg PO4 / kg
Land (unspecified) Phosphorus 007723-14-0 3,06 kg PO4 / kg
Air (unspecified) Phosphorus 007723-14-0 3,06 kg PO4 / kg
Land (unspecified) Phosphorus pentoxide 001314-56-3 1,34 kg PO4 / kg
Water (unspecified) Phosphorus pentoxide 001314-56-3 1,34 kg PO4 / kg
Air (unspecified) Phosphorus pentoxide 001314-56-3 1,34 kg PO4 / kg
Land (unspecified) Phosphorus, total 3,06 kg PO4 / kg Water (unspecified) Phosphorus, total 3,06 kg PO4 / kg Air (unspecified) Phosphorus, total 3,06 kg PO4 / kg Water (unspecified) Suspended solids, inorganic 0,08 kg PO4 / kg Water (unspecified) Suspended solids, unspecified 0,08 kg PO4 / kg Water (unspecified) TOC, Total Organic Carbon 0,066 kg PO4 / kg Impact Category heavy metals kg Pb
Water (unspecified) Antimony 007440-36-0 2 kg Pb / kg
Water (unspecified) Arsenic, ion 017428-41-0 1 kg Pb / kg
Water (unspecified) Barium 007440-39-3 0,014 kg Pb / kg
Water (unspecified) Boron 007440-42-8 0,03 kg Pb / kg
Air (unspecified) Cadmium 007440-43-9 50 kg Pb / kg
Air (unspecified) Cadmium oxide 001306- 50 kg Pb / kg

434
SimaPro 7.1 Method Data:
08/08/2007 Period: 16.11.31 19-0
Water (unspecified) Cadmium, ion 022537-48-0 3 kg Pb / kg
Water (unspecified) Chromium 007440-47-3 0,2 kg Pb / kg
Water (unspecified) Copper, ion 017493-86-6 0,005 kg Pb / kg
Air (unspecified) Heavy metals, unspecified 1 kg Pb / kg
Water (unspecified) Lead 007439-92-1 1 kg Pb / kg
Air (unspecified) Lead 007439-92-1 1 kg Pb / kg
Water (unspecified) Manganese 007439-96-5 0,02 kg Pb / kg
Air (unspecified) Manganese 007439-96-5 1 kg Pb / kg
Water (unspecified) Mercury 007439-97-6 10 kg Pb / kg
Air (unspecified) Mercury 007439-97-6 1 kg Pb / kg
Water (unspecified) Metallic ions, unspecified 0,00222
3 kg Pb / kg Air (unspecified) Metals, unspecified 0,03867 kg Pb / kg
Water (unspecified) Molybdenum 007439-98-7 0,14 kg Pb / kg
Water (unspecified) Nickel, ion 014701-22-5 0,5 kg Pb / kg
Impact Category carcinogens kg B(a)P
Air (unspecified) Acrylonitrile 000107-13-1 0,00022 kg B(a)P / kg
Air (unspecified) Arsenic 007440-38-2 0,044 kg B(a)P / kg
Air (unspecified) Benzene 000071-43-2
0,000044 kg B(a)P / kg
Air (unspecified) Benzene, ethyl- 000100-41-4
0,000044 kg B(a)P / kg
Air (unspecified) Benzo(a)pyrene 000050-32-8 1 kg B(a)P / kg
Air (unspecified) Chromium VI 018540-29-9 0,44 kg B(a)P / kg
Air (unspecified) Ethene, chloro- 000075-01-4
0,000011 kg B(a)P / kg
Air (unspecified) Fluoranthene 000206-44-0 1 kg B(a)P / kg
Air (unspecified) Hydrocarbons, aromatic 0,00004
4 kg B(a)P / kg
Air (unspecified) Metals, unspecified 0,00017
9 kg B(a)P / kg
Air (unspecified) Nickel 007440-02-0 0,0044 kg B(a)P / kg
Air (unspecified) PAH, polycyclic aromatic hydrocarbons 130498-29-2 0,4792 kg B(a)P / kg
Air (unspecified) Tar 008007-45-2
0,000044 kg B(a)P / kg
Impact Category winter smog - P.M. kg SPM
Air (unspecified) Carbon black 001333-86-4 1 kg SPM / kg
Air (unspecified) Iron dust 1 kg SPM / kg Air (unspecified) Particulates, < 10 um 1 kg SPM / kg Air (unspecified) Particulates, < 10 um (mobile) 1 kg SPM / kg Air (unspecified) Particulates, < 10 um (stationary) 1 kg SPM / kg Air (unspecified) Particulates, < 2.5 um 1 kg SPM / kg Air (unspecified) Particulates, > 2.5 um, and < 10um 1 kg SPM / kg Air (unspecified) Particulates, diesel soot 1 kg SPM / kg Air (unspecified) Particulates, SPM 1 kg SPM / kg Air (unspecified) Soot 1 kg SPM / kg

435
SimaPro 7.1 Method Data:
08/08/2007 Period: 16.11.31
Air (unspecified) Sulfur dioxide 007446-09-5 1 kg SPM / kg
Air (unspecified) Sulfur oxides 1 kg SPM / kg Impact Category
summer smog - VOCs kg C2H4
Air (unspecified) 2-Propanol 000067-63-0 0,196 kg C2H4 / kg
Air (unspecified) Acetaldehyde 000075-07-0 0,527 kg C2H4 / kg
Air (unspecified) Acetone 000067-64-1 0,178 kg C2H4 / kg
Air (unspecified) Acetonitrile 000075-05-8 0,416 kg C2H4 / kg
Air (unspecified) Acrolein 000107-02-8 0,603 kg C2H4 / kg
Air (unspecified) Acrylonitrile 000107-13-1 0,416 kg C2H4 / kg
Air (unspecified) Alcohols, unspecified 0,196 kg C2H4 / kg Air (unspecified) Aldehydes, unspecified 0,443 kg C2H4 / kg
Air (unspecified) Benzaldehyde 000100-52-7 0,334 kg C2H4 / kg
Air (unspecified) Benzene 000071-43-2 0,189 kg C2H4 / kg
Air (unspecified) Benzene, ethyl- 000100-41-4 0,593 kg C2H4 / kg
Air (unspecified) Benzo(a)pyrene 000050-32-8 0,761 kg C2H4 / kg
Air (unspecified) Biphenyl 000092-52-4 0,761 kg C2H4 / kg
Air (unspecified) Biphenyl, hexachloro- 026601-64-9 0,761 kg C2H4 / kg
Air (unspecified) Butane 000106-97-8 0,41 kg C2H4 / kg
Air (unspecified) Butene 025167-67-3 0,992 kg C2H4 / kg
Air (unspecified) Caprolactam 000105-60-2 0,761 kg C2H4 / kg
Air (unspecified) Chloroform 000067-66-3 0,021 kg C2H4 / kg
Air (unspecified) Crude oil 0,398 kg C2H4 / kg
Air (unspecified) Diethyl ether 000060-29-7 0,398 kg C2H4 / kg
Air (unspecified) Ethane 000074-84-0 0,082 kg C2H4 / kg
Air (unspecified) Ethane, 1,1,1-trichloro-, HCFC-140 000071-55-6 0,021 kg C2H4 / kg
Air (unspecified) Ethane, 1,2-dichloro- 000107-06-2 0,021 kg C2H4 / kg
Air (unspecified) Ethanol 000064-17-5 0,268 kg C2H4 / kg
Air (unspecified) Ethene 000074-85-1 1 kg C2H4 / kg
Air (unspecified) Ethene, chloro- 000075-01-4 0,021 kg C2H4 / kg
Air (unspecified) Ethene, tetrachloro- 000127-18-4 0,005 kg C2H4 / kg
Air (unspecified) Ethene, trichloro- 000079-01-6 0,021 kg C2H4 / kg
Air (unspecified) Ethylene glycol 000107-21-1 0,196 kg C2H4 / kg
Air (unspecified) Ethylene oxide 000075-21-8 0,377 kg C2H4 / kg
Air (unspecified) Ethyne 000074-86-2 0,168 kg C2H4 / kg
Air (unspecified) Formaldehyde 000050-00-0 0,421 kg C2H4 / kg
Air (unspecified) Heptane 000142-82-5 0,529 kg C2H4 / kg
Air (unspecified) Hexane 000110-54-3 0,421 kg C2H4 / kg
Air (unspecified) Hydrocarbons, aliphatic, alkanes, cyclic 0,398 kg C2H4 / kg

436
SimaPro 7.1 Method Data:
08/08/2007 Period: 16.11.31
Air (unspecified) Hydrocarbons, aliphatic, alkanes, unspecified 0,398 kg C2H4 / kg Air (unspecified) Hydrocarbons, aliphatic, alkenes, unspecified 0,906 kg C2H4 / kg Air (unspecified) Hydrocarbons, aliphatic, unsaturated 0,398 kg C2H4 / kg Air (unspecified) Hydrocarbons, aromatic 0,761 kg C2H4 / kg Air (unspecified) Hydrocarbons, chlorinated 0,021 kg C2H4 / kg Air (unspecified) Hydrocarbons, halogenated 0,021 kg C2H4 / kg Air (unspecified) Hydrocarbons, unspecified 0,398 kg C2H4 / kg Air (unspecified) Hydroxy compounds, unspecified 0,377 kg C2H4 / kg
Air (unspecified) Kerosene 064742-81-0 0,398 kg C2H4 / kg
Air (unspecified) Ketones, unspecified 0,326 kg C2H4 / kg
Air (unspecified) Methane 000074-82-8 0,007 kg C2H4 / kg
Air (unspecified) Methane, biogenic 000074-82-8 0,007 kg C2H4 / kg
Air (unspecified) Methane, dichloro-, HCC-30 000075-09-2 0,021 kg C2H4 / kg
Air (unspecified) Methane, fossil 000074-82-8 0,007 kg C2H4 / kg
Air (unspecified) Methane, tetrachloro-, CFC-10 000056-23-5 0,021 kg C2H4 / kg
Air (unspecified) Methanol 000067-56-1 0,123 kg C2H4 / kg
Air (unspecified) Methyl ethyl ketone 000078-93-3 0,473 kg C2H4 / kg
Air (unspecified) Methyl mercaptan 000074-93-1 0,377 kg C2H4 / kg
Air (unspecified) Naphthalene 000091-20-3 0,761 kg C2H4 / kg
Air (unspecified) NMVOC, non-methane volatile organic compounds, unspecified origin 0,416 kg C2H4 / kg
Air (unspecified) PAH, polycyclic aromatic hydrocarbons 130498-29-2 0,04932 kg C2H4 / kg
Air (unspecified) Pentane 000109-66-0 0,408 kg C2H4 / kg
Air (unspecified) Petrol 008006-61-9 0,398 kg C2H4 / kg
Air (unspecified) Phenol 000108-95-2 0,761 kg C2H4 / kg
Air (unspecified) Phenol, chloro- 025167-80-0 0,021 kg C2H4 / kg
Air (unspecified) Phenol, pentachloro- 000087-86-5 0,021 kg C2H4 / kg
Air (unspecified) Phthalic anhydride 000085-44-9 0,761 kg C2H4 / kg
Air (unspecified) Propane 000074-98-6 0,42 kg C2H4 / kg
Air (unspecified) Propene 000115-07-1 1,03 kg C2H4 / kg
Air (unspecified) Propionic acid 000079-09-4 0,377 kg C2H4 / kg
Air (unspecified) Styrene 000100-42-5 0,761 kg C2H4 / kg
Air (unspecified) Tar 008007-45-2 0,416 kg C2H4 / kg
Air (unspecified) Terpentine 0,377 kg C2H4 / kg
Air (unspecified) Toluene 000108-88-3 0,563 kg C2H4 / kg
Air (unspecified) Vinyl acetate 000108-05-4 0,223 kg C2H4 / kg
Air (unspecified) VOC, volatile organic compounds 0,398 kg C2H4 / kg Impact Category pesticides kg act.subst
Water (unspecified) 2,4-D 000094-75-7 1 kg act.subst / kg
Water (unspecified) 2,4,5-T 000093-76-5 1 kg act.subst / kg
Water (unspecified) Acephate 030560-19-1 1 kg act.subst / kg
437
SimaPro 7.1 Method Data:
08/08/2007 Period: 16.11.31
Water (unspecified) Aldicarb 000116-06-3 1 kg act.subst / kg
Water (unspecified) Aldrin 000309-00-2 1 kg act.subst / kg
Water (unspecified) Anilazine 000101-05-3 1 kg act.subst / kg
Water (unspecified) Atrazine 001912-24-9 1 kg act.subst / kg
Water (unspecified) Azinphos-ethyl 002642-71-9 1 kg act.subst / kg
Water (unspecified) Azinphos-methyl 000086-50-0 1 kg act.subst / kg
Water (unspecified) Benomyl 017804-35-2 1 kg act.subst / kg
Water (unspecified) Bentazone 025057-89-0 1 kg act.subst / kg
Water (unspecified) Bifenthrin 082657-04-3 1 kg act.subst / kg
Water (unspecified) Bis(2-chloroethyl)ether 000111-44-4 1 kg act.subst / kg
Water (unspecified) Bis(chloromethyl)ether 000542-88-1 1 kg act.subst / kg
Water (unspecified) Captafol 002939-80-2 1 kg act.subst / kg
Water (unspecified) Captan 000133-06-2 1 kg act.subst / kg
Water (unspecified) Carbaryl 000063-25-2 1 kg act.subst / kg
Water (unspecified) Carbendazim 010605-21-7 1 kg act.subst / kg
Water (unspecified) Carbofuran 001563-66-2 1 kg act.subst / kg
Water (unspecified) Chlordane 012789-03-6 1 kg act.subst / kg
Water (unspecified) Chlorfenvinphos 000470-90-6 1 kg act.subst / kg
Water (unspecified) Chloridazon 001698-60-8 1 kg act.subst / kg
Water (unspecified) Chlorothalonil 001897-45-6 1 kg act.subst / kg
Water (unspecified) Chlorpropham 000101-21-3 1 kg act.subst / kg
Water (unspecified) Chlorpyrifos 002921-88-2 1 kg act.subst / kg
Water (unspecified) Coumafos 000056-72-4 1 kg act.subst / kg
Water (unspecified) Cyanazine 021725-46-2 1 kg act.subst / kg
Water (unspecified) Cypermethrin 052315-07-8 1 kg act.subst / kg
Water (unspecified) Cyromazine 066215-27-8 1 kg act.subst / kg
Water (unspecified) DDT 000050-29-3 1 kg act.subst / kg
Water (unspecified) Deltamethrin 052918-63-5 1 kg act.subst / kg
Water (unspecified) Demeton 008065-48-3 1 kg act.subst / kg
Water (unspecified) Desmetryn 001014-69-3 1 kg act.subst / kg
Water (unspecified) Diazinon 000333-41-5 1 kg act.subst / kg
Water (unspecified) Dichlorprop 000120-36-5 1 kg act.subst / kg
Water (unspecified) Dichlorvos 000062-73-7 1 kg act.subst / kg
Water (unspecified) Dieldrin 000060-57-1 1 kg act.subst / kg
Water (unspecified) Dimethoate 000060-51-5 1 kg act.subst / kg
Water (unspecified) Dinoseb 000088-85-7 1 kg act.subst / kg
Water (unspecified) Dinoterb 001420-07-1 1 kg act.subst / kg
Water (unspecified) Diquat dibromide 000085- 1 kg act.subst / kg

438
SimaPro 7.1 Method Data:
08/08/2007 Period: 16.11.31 00-7
Water (unspecified) Disinfectants, unspecified 1 kg act.subst / kg
Water (unspecified) Disulfothon 000298-04-4 1 kg act.subst / kg
Water (unspecified) Diuron 000330-54-1 1 kg act.subst / kg
Water (unspecified) DNOC 000534-52-1 1 kg act.subst / kg
Water (unspecified) Endosulfan 000115-29-7 1 kg act.subst / kg
Water (unspecified) Endrin 000072-20-8 1 kg act.subst / kg
Water (unspecified) Ethoprop 013194-48-4 1 kg act.subst / kg
Water (unspecified) Fenitrothion 000122-14-5 1 kg act.subst / kg
Water (unspecified) Fenthion 000055-38-9 1 kg act.subst / kg
Water (unspecified) Fentin acetate 000900-95-8 1 kg act.subst / kg
Water (unspecified) Fentin chloride 000639-58-7 1 kg act.subst / kg
Water (unspecified) Fentin hydroxide 000076-87-9 1 kg act.subst / kg
Water (unspecified) Folpet 000133-07-3 1 kg act.subst / kg
Water (unspecified) Fungicides, unspecified 1 kg act.subst / kg
Water (unspecified) Glyphosate 001071-83-6 1 kg act.subst / kg
Water (unspecified) Heptachlor 000076-44-8 1 kg act.subst / kg
Water (unspecified) Heptenophos 023560-59-0 1 kg act.subst / kg
Water (unspecified) Herbicides, unspecified 1 kg act.subst / kg Water (unspecified) Insecticides, unspecified 1 kg act.subst / kg
Water (unspecified) Iprodione 036734-19-7 1 kg act.subst / kg
Water (unspecified) Isoproturon 034123-59-6 1 kg act.subst / kg
Water (unspecified) Lindane 000058-89-9 1 kg act.subst / kg
Water (unspecified) Lindane, alpha- 000319-84-6 1 kg act.subst / kg
Water (unspecified) Lindane, beta- 000319-85-7 1 kg act.subst / kg
Water (unspecified) Linuron 000330-55-2 1 kg act.subst / kg
Water (unspecified) Malathion 000121-75-5 1 kg act.subst / kg
Water (unspecified) Maneb 012427-38-2 1 kg act.subst / kg
Water (unspecified) MCPA 000094-74-6 1 kg act.subst / kg
Water (unspecified) Mecoprop 000093-65-2 1 kg act.subst / kg
Water (unspecified) Metamitron 041394-05-2 1 kg act.subst / kg
Water (unspecified) Metazachlor 067129-08-2 1 kg act.subst / kg
Water (unspecified) Methabenzthiazuron 018691-97-9 1 kg act.subst / kg
Water (unspecified) Methomyl 016752-77-5 1 kg act.subst / kg
Water (unspecified) Metobromuron 003060-89-7 1 kg act.subst / kg
Water (unspecified) Metolachlor 051218-45-2 1 kg act.subst / kg
Water (unspecified) Metribuzin 021087-64-9 1 kg act.subst / kg
Water (unspecified) Mevinfos 007786-34-7 1 kg act.subst / kg
Water (unspecified) Monolinuron 001746-81-2 1 kg act.subst / kg
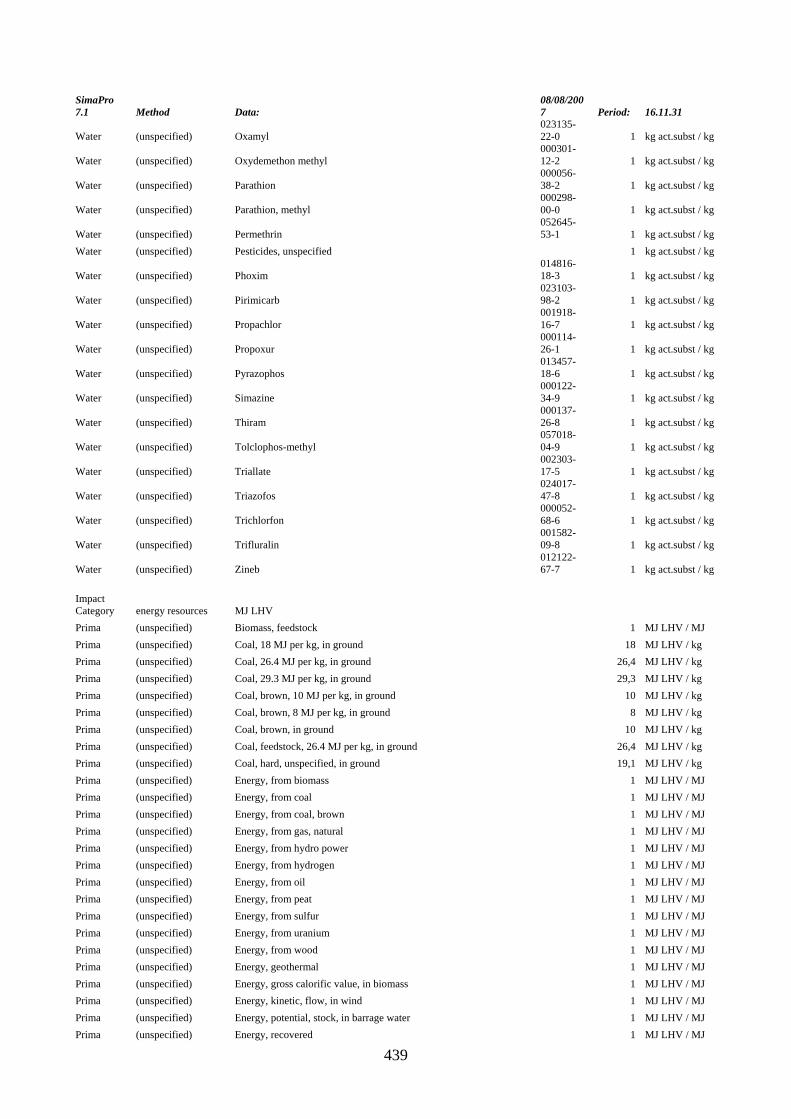
439
SimaPro 7.1 Method Data:
08/08/2007 Period: 16.11.31
Water (unspecified) Oxamyl 023135-22-0 1 kg act.subst / kg
Water (unspecified) Oxydemethon methyl 000301-12-2 1 kg act.subst / kg
Water (unspecified) Parathion 000056-38-2 1 kg act.subst / kg
Water (unspecified) Parathion, methyl 000298-00-0 1 kg act.subst / kg
Water (unspecified) Permethrin 052645-53-1 1 kg act.subst / kg
Water (unspecified) Pesticides, unspecified 1 kg act.subst / kg
Water (unspecified) Phoxim 014816-18-3 1 kg act.subst / kg
Water (unspecified) Pirimicarb 023103-98-2 1 kg act.subst / kg
Water (unspecified) Propachlor 001918-16-7 1 kg act.subst / kg
Water (unspecified) Propoxur 000114-26-1 1 kg act.subst / kg
Water (unspecified) Pyrazophos 013457-18-6 1 kg act.subst / kg
Water (unspecified) Simazine 000122-34-9 1 kg act.subst / kg
Water (unspecified) Thiram 000137-26-8 1 kg act.subst / kg
Water (unspecified) Tolclophos-methyl 057018-04-9 1 kg act.subst / kg
Water (unspecified) Triallate 002303-17-5 1 kg act.subst / kg
Water (unspecified) Triazofos 024017-47-8 1 kg act.subst / kg
Water (unspecified) Trichlorfon 000052-68-6 1 kg act.subst / kg
Water (unspecified) Trifluralin 001582-09-8 1 kg act.subst / kg
Water (unspecified) Zineb 012122-67-7 1 kg act.subst / kg
Impact Category energy resources MJ LHV Prima (unspecified) Biomass, feedstock 1 MJ LHV / MJ Prima (unspecified) Coal, 18 MJ per kg, in ground 18 MJ LHV / kg Prima (unspecified) Coal, 26.4 MJ per kg, in ground 26,4 MJ LHV / kg Prima (unspecified) Coal, 29.3 MJ per kg, in ground 29,3 MJ LHV / kg Prima (unspecified) Coal, brown, 10 MJ per kg, in ground 10 MJ LHV / kg Prima (unspecified) Coal, brown, 8 MJ per kg, in ground 8 MJ LHV / kg Prima (unspecified) Coal, brown, in ground 10 MJ LHV / kg Prima (unspecified) Coal, feedstock, 26.4 MJ per kg, in ground 26,4 MJ LHV / kg Prima (unspecified) Coal, hard, unspecified, in ground 19,1 MJ LHV / kg Prima (unspecified) Energy, from biomass 1 MJ LHV / MJ Prima (unspecified) Energy, from coal 1 MJ LHV / MJ Prima (unspecified) Energy, from coal, brown 1 MJ LHV / MJ Prima (unspecified) Energy, from gas, natural 1 MJ LHV / MJ Prima (unspecified) Energy, from hydro power 1 MJ LHV / MJ Prima (unspecified) Energy, from hydrogen 1 MJ LHV / MJ Prima (unspecified) Energy, from oil 1 MJ LHV / MJ Prima (unspecified) Energy, from peat 1 MJ LHV / MJ Prima (unspecified) Energy, from sulfur 1 MJ LHV / MJ Prima (unspecified) Energy, from uranium 1 MJ LHV / MJ Prima (unspecified) Energy, from wood 1 MJ LHV / MJ Prima (unspecified) Energy, geothermal 1 MJ LHV / MJ Prima (unspecified) Energy, gross calorific value, in biomass 1 MJ LHV / MJ Prima (unspecified) Energy, kinetic, flow, in wind 1 MJ LHV / MJ Prima (unspecified) Energy, potential, stock, in barrage water 1 MJ LHV / MJ Prima (unspecified) Energy, recovered 1 MJ LHV / MJ
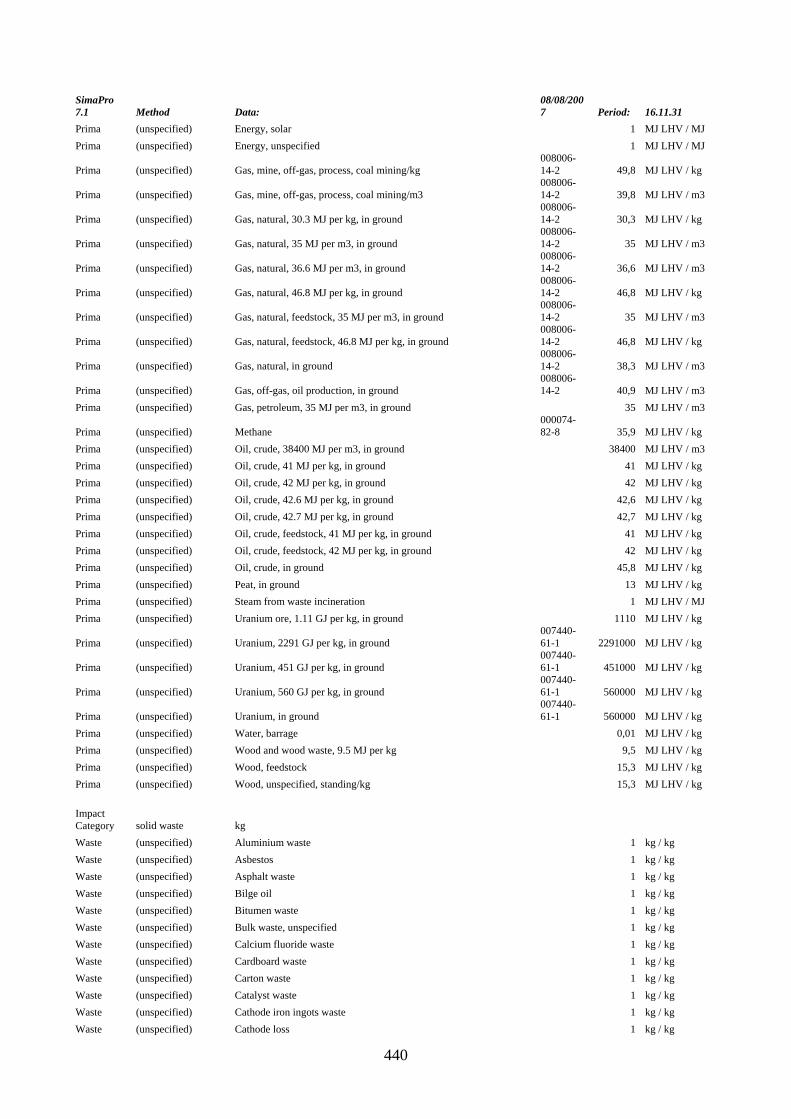
440
SimaPro 7.1 Method Data:
08/08/2007 Period: 16.11.31
Prima (unspecified) Energy, solar 1 MJ LHV / MJ Prima (unspecified) Energy, unspecified 1 MJ LHV / MJ
Prima (unspecified) Gas, mine, off-gas, process, coal mining/kg 008006-14-2 49,8 MJ LHV / kg
Prima (unspecified) Gas, mine, off-gas, process, coal mining/m3 008006-14-2 39,8 MJ LHV / m3
Prima (unspecified) Gas, natural, 30.3 MJ per kg, in ground 008006-14-2 30,3 MJ LHV / kg
Prima (unspecified) Gas, natural, 35 MJ per m3, in ground 008006-14-2 35 MJ LHV / m3
Prima (unspecified) Gas, natural, 36.6 MJ per m3, in ground 008006-14-2 36,6 MJ LHV / m3
Prima (unspecified) Gas, natural, 46.8 MJ per kg, in ground 008006-14-2 46,8 MJ LHV / kg
Prima (unspecified) Gas, natural, feedstock, 35 MJ per m3, in ground 008006-14-2 35 MJ LHV / m3
Prima (unspecified) Gas, natural, feedstock, 46.8 MJ per kg, in ground 008006-14-2 46,8 MJ LHV / kg
Prima (unspecified) Gas, natural, in ground 008006-14-2 38,3 MJ LHV / m3
Prima (unspecified) Gas, off-gas, oil production, in ground 008006-14-2 40,9 MJ LHV / m3
Prima (unspecified) Gas, petroleum, 35 MJ per m3, in ground 35 MJ LHV / m3
Prima (unspecified) Methane 000074-82-8 35,9 MJ LHV / kg
Prima (unspecified) Oil, crude, 38400 MJ per m3, in ground 38400 MJ LHV / m3 Prima (unspecified) Oil, crude, 41 MJ per kg, in ground 41 MJ LHV / kg Prima (unspecified) Oil, crude, 42 MJ per kg, in ground 42 MJ LHV / kg Prima (unspecified) Oil, crude, 42.6 MJ per kg, in ground 42,6 MJ LHV / kg Prima (unspecified) Oil, crude, 42.7 MJ per kg, in ground 42,7 MJ LHV / kg Prima (unspecified) Oil, crude, feedstock, 41 MJ per kg, in ground 41 MJ LHV / kg Prima (unspecified) Oil, crude, feedstock, 42 MJ per kg, in ground 42 MJ LHV / kg Prima (unspecified) Oil, crude, in ground 45,8 MJ LHV / kg Prima (unspecified) Peat, in ground 13 MJ LHV / kg Prima (unspecified) Steam from waste incineration 1 MJ LHV / MJ Prima (unspecified) Uranium ore, 1.11 GJ per kg, in ground 1110 MJ LHV / kg
Prima (unspecified) Uranium, 2291 GJ per kg, in ground 007440-61-1 2291000 MJ LHV / kg
Prima (unspecified) Uranium, 451 GJ per kg, in ground 007440-61-1 451000 MJ LHV / kg
Prima (unspecified) Uranium, 560 GJ per kg, in ground 007440-61-1 560000 MJ LHV / kg
Prima (unspecified) Uranium, in ground 007440-61-1 560000 MJ LHV / kg
Prima (unspecified) Water, barrage 0,01 MJ LHV / kg Prima (unspecified) Wood and wood waste, 9.5 MJ per kg 9,5 MJ LHV / kg Prima (unspecified) Wood, feedstock 15,3 MJ LHV / kg Prima (unspecified) Wood, unspecified, standing/kg 15,3 MJ LHV / kg Impact Category solid waste kg Waste (unspecified) Aluminium waste 1 kg / kg Waste (unspecified) Asbestos 1 kg / kg Waste (unspecified) Asphalt waste 1 kg / kg Waste (unspecified) Bilge oil 1 kg / kg Waste (unspecified) Bitumen waste 1 kg / kg Waste (unspecified) Bulk waste, unspecified 1 kg / kg Waste (unspecified) Calcium fluoride waste 1 kg / kg Waste (unspecified) Cardboard waste 1 kg / kg Waste (unspecified) Carton waste 1 kg / kg Waste (unspecified) Catalyst waste 1 kg / kg Waste (unspecified) Cathode iron ingots waste 1 kg / kg Waste (unspecified) Cathode loss 1 kg / kg

441
SimaPro 7.1 Method Data:
08/08/2007 Period: 16.11.31
Waste (unspecified) Chemical waste, inert 1 kg / kg Waste (unspecified) Chemical waste, regulated 1 kg / kg Waste (unspecified) Chemical waste, unspecified 1 kg / kg Waste (unspecified) Chromium waste 1 kg / kg Waste (unspecified) Coal ash 1 kg / kg Waste (unspecified) Coal tailings 1 kg / kg Waste (unspecified) Construction waste 1 kg / kg Waste (unspecified) Copper absorbent waste 1 kg / kg Waste (unspecified) Copper waste 1 kg / kg Waste (unspecified) Dross 1 kg / kg Waste (unspecified) Dross for recycling 1 kg / kg Waste (unspecified) Dust, break-out 1 kg / kg Waste (unspecified) Dust, unspecified 1 kg / kg Waste (unspecified) E-saving bulb plastic waste 1 kg / kg Waste (unspecified) E-saving bulb waste 1 kg / kg Waste (unspecified) Electronic waste 1 kg / kg Waste (unspecified) Electrostatic filter dust 1 kg / kg Waste (unspecified) Fluoride waste 1 kg / kg Waste (unspecified) Fly ash 1 kg / kg Waste (unspecified) Gas pipe waste 1 kg / kg Waste (unspecified) Glass waste 1 kg / kg Waste (unspecified) Ion exchanger sludge 1 kg / kg Waste (unspecified) Iron waste 1 kg / kg Waste (unspecified) Light bulb waste 1 kg / kg Waste (unspecified) Limestone waste 1 kg / kg Waste (unspecified) Metal waste 1 kg / kg Waste (unspecified) Mineral waste 1 kg / kg Waste (unspecified) Mineral waste, from mining 1 kg / kg Waste (unspecified) Mineral wool waste 1 kg / kg Waste (unspecified) Oil separator sludge 1 kg / kg Waste (unspecified) Oil waste 1 kg / kg Waste (unspecified) Packaging waste, paper and board 1 kg / kg Waste (unspecified) Packaging waste, plastic 1 kg / kg Waste (unspecified) Packaging waste, steel 1 kg / kg Waste (unspecified) Packaging waste, unspecified 1 kg / kg Waste (unspecified) Packaging waste, wood 1 kg / kg Waste (unspecified) Paint waste 1 kg / kg Waste (unspecified) Photovoltaic cell waste 1 kg / kg Waste (unspecified) Photovoltaic panel waste 1 kg / kg Waste (unspecified) Photovoltaic production waste 1 kg / kg Waste (unspecified) Photovoltaic/EVA cell waste 1 kg / kg Waste (unspecified) Plastic waste 1 kg / kg Waste (unspecified) Polyethylene waste 1 kg / kg Waste (unspecified) Polystyrene waste 1 kg / kg Waste (unspecified) Polyvinyl chloride waste 1 kg / kg Waste (unspecified) Printed circuitboards waste 1 kg / kg Waste (unspecified) Process waste 1 kg / kg Waste (unspecified) Production waste 1 kg / kg Waste (unspecified) Production waste, not inert 1 kg / kg Waste (unspecified) Propylene glycol waste 1 kg / kg Waste (unspecified) Refinery sludge 1 kg / kg Waste (unspecified) Rejects 1 kg / kg Waste (unspecified) Rejects, corrugated cardboard 1 kg / kg Waste (unspecified) Residues 1 kg / kg

442
SimaPro 7.1 Method Data:
08/08/2007 Period: 16.11.31
Waste (unspecified) Slags 1 kg / kg Waste (unspecified) Slags and ashes 1 kg / kg Waste (unspecified) Sludge 1 kg / kg Waste (unspecified) Soot 1 kg / kg Waste (unspecified) Steel waste 1 kg / kg Waste (unspecified) Stones and rubble 1 kg / kg Waste (unspecified) Tin waste 1 kg / kg Waste (unspecified) Tinder from rolling drum 1 kg / kg Waste (unspecified) Waste in bioactive landfill 1 kg / kg Waste (unspecified) Waste in incineration 1 kg / kg Waste (unspecified) Waste in inert landfill 1 kg / kg Waste (unspecified) Waste to recycling 1 kg / kg Waste (unspecified) Waste, final, inert 1 kg / kg Waste (unspecified) Waste, from drilling, unspecified 1 kg / kg Waste (unspecified) Waste, from incinerator 1 kg / kg Waste (unspecified) Waste, industrial 1 kg / kg Waste (unspecified) Waste, inorganic 1 kg / kg Waste (unspecified) Waste, nuclear, unspecified/kg 1 kg / kg Waste (unspecified) Waste, solid 1 kg / kg Waste (unspecified) Waste, toxic 1 kg / kg Waste (unspecified) Waste, unspecified 1 kg / kg Waste (unspecified) Welding dust 1 kg / kg Waste (unspecified) Wood ashes 1 kg / kg Waste (unspecified) Wood waste 1 kg / kg Waste (unspecified) Wood, sawdust 1 kg / kg Waste (unspecified) Zeolite waste 1 kg / kg Waste (unspecified) Zinc waste 1 kg / kg Impact Category Heavy metals (air) kg Ni eq
Air (unspecified) Arsenic 007440-38-2 3,33 kg Ni eq / kg
Air (unspecified) Cadmium 007440-43-9 5 kg Ni eq / kg
Air (unspecified) Chromium 007440-47-3 0,5 kg Ni eq / kg
Air (unspecified) Chromium-51 014392-02-0 0,5 kg Ni eq / kBq
Air (unspecified) Chromium VI 018540-29-9 0,5 kg Ni eq / kg
Air (unspecified) Copper 007440-50-8 0,5 kg Ni eq / kg
Air (unspecified) Lead 007439-92-1 0,04 kg Ni eq / kg
Air (unspecified) Mercury 007439-97-6 5 kg Ni eq / kg
Air (unspecified) Nickel 007440-02-0 1 kg Ni eq / kg
Air (unspecified) Zinc 007440-66-6 0,04 kg Ni eq / kg
Impact Category PAHs (air) kg PAH/20 eq
Air (unspecified) Carbon monoxide 000630-08-0
0,000002
kg PAH/20 eq / kg
Air (unspecified) Hydrocarbons, aromatic, naphthalenes, C13, trisubstituted 20 kg PAH/20 eq / kg
Air (unspecified) Hydrocarbons, aromatic, styrenes, C10 20 kg PAH/20 eq / kg
Air (unspecified) Hydrocarbons, aromatic, styrenes, C9 20 kg PAH/20 eq / kg
Air (unspecified) Polycyclic organic matter, as 15-PAH 20 kg PAH/20 eq / kg
Air (unspecified) Polycyclic organic matter, as 7-PAH 20 kg PAH/20 eq /

443
SimaPro 7.1 Method Data:
08/08/2007 Period: 16.11.31
kg
Air (unspecified) Polycyclic organic matter, unspecified 20 kg PAH/20 eq / kg
Impact Category
Heavy metals (water) kg Hg/20 eq
Water (unspecified) Arsenic, ion 017428-41-0 3
kg Hg/20 eq / kg
Water (unspecified) Cadmium, ion 022537-48-0 7
kg Hg/20 eq / kg
Water (unspecified) Chromium 007440-47-3 0,4
kg Hg/20 eq / kg
Water (unspecified) Copper, ion 017493-86-6 2,8
kg Hg/20 eq / kg
Water (unspecified) Lead 007439-92-1 0,5
kg Hg/20 eq / kg
Water (unspecified) Mercury 007439-97-6 20
kg Hg/20 eq / kg
Water (unspecified) Nickel 007440-02-0 7
kg Hg/20 eq / kg
Water (unspecified) Zinc 007440-66-6 0,2
kg Hg/20 eq / kg
Water (unspecified) Zinc, ion 023713-49-7 0,2
kg Hg/20 eq / kg
Impact Category POP (air) kg TE eq
Air (unspecified) Dioxin, 1,2,3,7,8,9-hexachlorodibenzo- 019408-74-3 0,1 kg TE eq / kg
Air (unspecified) Dioxins, measured as 2,3,7,8-tetrachlorodibenzo-p-dioxin 1 kg TE eq / kg
Air (unspecified) Furan 000110-00-9 0,1 kg TE eq / kg
Impact Category POP (water) kg TE eq
Water (unspecified) Dioxin, 1,2,3,7,8,9-hexachlorodibenzo- 019408-74-3 0,1 kg TE eq / kg
Water (unspecified) Dioxins, measured as 2,3,7,8-tetrachlorodibenzo-p-dioxin 1 kg TE eq / kg
Water (unspecified) Furan 000110-00-9 0,1 kg TE eq / kg
Normalization-Weighting set Europe g Normalizzazione greenhouse 7,42E-05 ozone layer 1,24 acidification 0,00888 eutrophication 0,0262 heavy metals 17,8 carcinogens 106 winter smog - P.M. 0,0106 summer smog - VOCs 0,0507 pesticides 1,21 energy resources 6,29E-06 solid waste 0 Heavy metals (air) 0 PAHs (air) 0
444
SimaPro 7.1 Method Data:
08/08/2007 Period: 16.11.31
Heavy metals (water) 0 POP (air) 0 POP (water) 0 Weight greenhouse 2,5 ozone layer 100 acidification 10 eutrophication 5 heavy metals 5 carcinogens 10 winter smog - P.M. 5 summer smog - VOCs 2,5 pesticides 25 energy resources 0 solid waste 0 Heavy metals (air) 0 PAHs (air) 0 Heavy metals (water) 0 POP (air) 0 POP (water) 0 Normalization-Weighting set Europe e Normalizzazione greenhouse 7,65E-05 ozone layer 1,08 acidification 0,00888 eutrophication 0,0262 heavy metals 18,4 carcinogens 92 winter smog - P.M. 0,0106 summer smog - VOCs 0,0558 pesticides 1,04 energy resources 6,29E-06 solid waste 0 Heavy metals (air) 18,4 PAHs (air) 92 Heavy metals 18,4

445
SimaPro 7.1 Method Data:
08/08/2007 Period: 16.11.31
(water)
POP (air) 0 POP (water) 0 Weight greenhouse 2,5 ozone layer 100 acidification 10 eutrophication 5 heavy metals 5 carcinogens 10 winter smog - P.M. 5 summer smog - VOCs 2,5 pesticides 25 energy resources 0 solid waste 0 Heavy metals (air) 5 PAHs (air) 10 Heavy metals (water) 5 POP (air) 0 POP (water) 0
A.4 SIMAPRO VS EUP-ECOREPORT OUTPUT According to “MEUUP Report” by R. Kemna on methodology used in the EuP-Ecoreport method, it was possible to have SimaPro outputs in compliance with EuP ones (MEEuP Methodology Report, Final, table 25 and Eco-indicator 95 - rev EuP V2.03).
In 8.4 Eco-indicator 95 - rev EuP V2.03 methodology was fully reported, while in the following table the main indicators used for Simapro outputs, in compliance with EuP- Ecoreport outputs, were reported.
Table A.17: Output indicators in Ecoindicator95-rev EuP method Eco-indicator 95 - rev EuP V2.03 (Revised by Laura Cutaia)
Environmental impact Unit greenhouse kg CO2 ozone layer kg CFC11 acidification kg SO2 eutrophication kg PO4 heavy metals kg Pb carcinogens kg B(a)P winter smog - P.M. kg SPM summer smog - VOCs kg C2H4 pesticides kg act.subst energy resources MJ LHV

446
Environmental impact Unit solid waste kg Heavy metals (air) kg Ni eq PAHs (air) kg PAH/20 eq Heavy metals (water) kg Hg/20 eq POP (air) kg TE eq POP (water) kg TE eq
Hereinafter outputs from COLD 7 have been reported, using SimaPro SW and revised Ecoindicator 95 methodology explained before.
In summary using SimaPro it was possible:
- To use quite all inventory data from producers (BOM) ;
- To use data input in the software in compliance with that available by producers (SimaPro data base contains many more data than EuP and makes possible the “simulation” of new record with new “components” or “materials” – as for detergents and washing agents according to data from producers) ;
- To have compliance between outputs from characterization phase of Eco-Indicator 95 (one of the most used methodology in impact assessment) and EuP-Ecoreport outputs, according to the “characterization factors” used in this method (MEEuP by R. Kemna) . See following figure.
Figure A.1: MEEuP Report – Summary of MEEUP weighting factors used to adapting Ecoindicator 95 to EuP-Ecoreport evaluating method.
In any case in SimaPro it was not possible to “simulate” the distribution phase for final products, for lack of data from producers or from other sources; on the contrary in EuP-Ecoreport simulation of impacts due to distribution is considered by an “internal system”.
In the following table outputs for COLD 7 base model have been reported. In order to compare it with that from EuP-Ecoreport outputs it has to be underlined:
- “COLD 7 assembling” in Simapro corresponds to “Production total” in EuP; “assembling” for Simapro includes materials production, transport, forming and assembling also if these items have been calculated separately as in the outputs in 8.6;
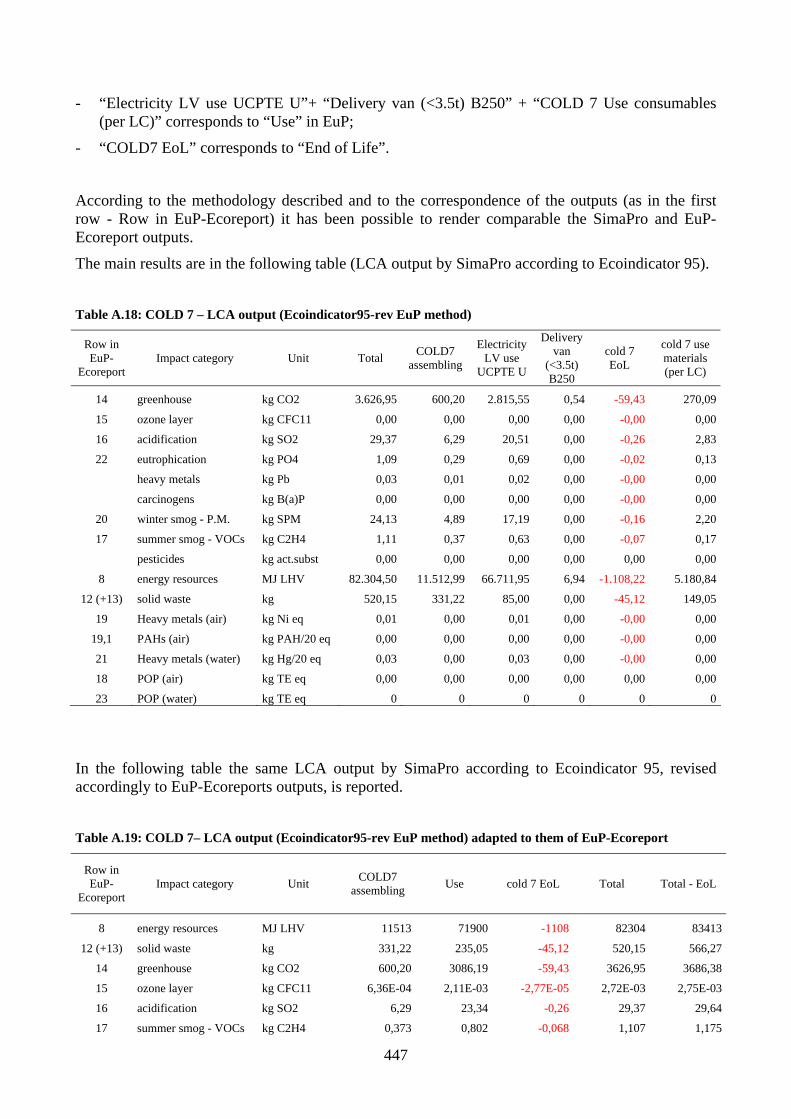
447
- “Electricity LV use UCPTE U”+ “Delivery van (<3.5t) B250” + “COLD 7 Use consumables (per LC)” corresponds to “Use” in EuP;
- “COLD7 EoL” corresponds to “End of Life”.
According to the methodology described and to the correspondence of the outputs (as in the first row - Row in EuP-Ecoreport) it has been possible to render comparable the SimaPro and EuP-Ecoreport outputs.
The main results are in the following table (LCA output by SimaPro according to Ecoindicator 95).
Table A.18: COLD 7 – LCA output (Ecoindicator95-rev EuP method)
Row in EuP-
Ecoreport Impact category Unit Total COLD7
assembling
Electricity LV use
UCPTE U
Delivery van
(<3.5t) B250
cold 7 EoL
cold 7 use materials (per LC)
14 greenhouse kg CO2 3.626,95 600,20 2.815,55 0,54 -59,43 270,09
15 ozone layer kg CFC11 0,00 0,00 0,00 0,00 -0,00 0,00
16 acidification kg SO2 29,37 6,29 20,51 0,00 -0,26 2,83
22 eutrophication kg PO4 1,09 0,29 0,69 0,00 -0,02 0,13
heavy metals kg Pb 0,03 0,01 0,02 0,00 -0,00 0,00
carcinogens kg B(a)P 0,00 0,00 0,00 0,00 -0,00 0,00
20 winter smog - P.M. kg SPM 24,13 4,89 17,19 0,00 -0,16 2,20
17 summer smog - VOCs kg C2H4 1,11 0,37 0,63 0,00 -0,07 0,17
pesticides kg act.subst 0,00 0,00 0,00 0,00 0,00 0,00
8 energy resources MJ LHV 82.304,50 11.512,99 66.711,95 6,94 -1.108,22 5.180,84
12 (+13) solid waste kg 520,15 331,22 85,00 0,00 -45,12 149,05
19 Heavy metals (air) kg Ni eq 0,01 0,00 0,01 0,00 -0,00 0,00
19,1 PAHs (air) kg PAH/20 eq 0,00 0,00 0,00 0,00 -0,00 0,00
21 Heavy metals (water) kg Hg/20 eq 0,03 0,00 0,03 0,00 -0,00 0,00
18 POP (air) kg TE eq 0,00 0,00 0,00 0,00 0,00 0,00
23 POP (water) kg TE eq 0 0 0 0 0 0
In the following table the same LCA output by SimaPro according to Ecoindicator 95, revised accordingly to EuP-Ecoreports outputs, is reported.
Table A.19: COLD 7– LCA output (Ecoindicator95-rev EuP method) adapted to them of EuP-Ecoreport
Row in EuP-
Ecoreport Impact category Unit COLD7
assembling Use cold 7 EoL Total Total - EoL
8 energy resources MJ LHV 11513 71900 -1108 82304 83413
12 (+13) solid waste kg 331,22 235,05 -45,12 520,15 566,27
14 greenhouse kg CO2 600,20 3086,19 -59,43 3626,95 3686,38
15 ozone layer kg CFC11 6,36E-04 2,11E-03 -2,77E-05 2,72E-03 2,75E-03
16 acidification kg SO2 6,29 23,34 -0,26 29,37 29,64
17 summer smog - VOCs kg C2H4 0,373 0,802 -0,068 1,107 1,175

448
18 POP (air) kg TE eq 1,52E-09 1,28E-09 4,60E-11 2,85E-09 2,81E-09
19 Heavy metals (air) kg Ni eq 6,82E-04 5,65E-03 -1,83E-05 6,32E-03 6,34E-03
19,1 PAHs (air) kg PAH/20 eq 2,13E-06 2,77E-06 -7,91E-07 4,11E-06 4,90E-06
20 winter smog - P.M. kg SPM 4,89 19,40 -0,16 24,13 24,29
21 Heavy metals (water) kg Hg/20 eq 4,82E-03 3,07E-02 -8,49E-04 3,46E-02 3,55E-02
22 eutrophication kg PO4 0,29 0,82 -0,02 1,09 1,11
23 POP (water) kg TE eq 0 0 0 0 0
heavy metals kg Pb 0,005028606 0,024384899 -0,000358783 0,029054722 0,029413505
carcinogens kg B(a)P 3,05035E-05 8,14643E-05 -4,2362E-05 6,96059E-05 0,000111968
pesticides kg act.subst 0 0 0 0 0
In the following table, outputs by EuP-Ecoreport method has been reported, in a comparable way. Table A.20: COLD 7 – LCA output from EuP-Ecoreport
Production Distribution Use End of Life Total Total - EoL
- Distribution
8 Total Energy (GER) MJ 4669 1115 49414 -459 54738 54082
12 (+13) waste kg 85,41 0,58 59,18 5,98 151,13 144,58
14 Greenhouse Gases in GWP100 kg CO2 eq. 257,00 67,00 2158,00 10,00 2493,00 2416,00
15 Ozone Depletion, emissions mg R-11 eq. 0
16 Acidification, emissions kg SO2 eq. 2,03 0,21 12,72 0,03 14,99 14,76
17 Volatile Organic Compounds (VOC) kg 0,006 0,016 0,019 0,003 0,045 0,026
18 Persistent Organic Pollutants (POP) kg i-Teq 4,08E-10 3E-12 3,27E-10 2,6E-11 7,65E-10 7,36E-10
19 Heavy Metals kg Ni eq. 1,07E-03 2,90E-05 8,67E-04 1,29E-04 2,09E-03 1,94E-03
19,1 PAHs kg Ni eq. 1,41E-03 3,70E-05 1,21E-04 -3,00E-06 1,57E-03 1,54E-03
20 Particulate Matter (PM, dust) kg 0,46 2,68 0,44 0,98 4,55 0,90
21 Heavy Metals kg Hg/20 9,88E-04 1,00E-06 3,28E-04 3,10E-05 1,35E-03 1,32E-03
22 Eutrophication kg PO4 0,061 0 0,002 0 0,063 0,063
23 Persistent Organic Pollutants (POP) ng i-Teq 0
A.5 SIMAPRO OUTPUTS

449
Table A.21: COLD 7 – Assembling phase – Output of SimaPro with “Ecoindicator 95 rev EuP method”
Impact category greenhouse
ozone layer
acidification
eutrophication
heavy metals
carcinogens
winter smog - P.M.
summer smog - VOCs
pesticides
energy resources
solid waste
Heavy metals (air) PAHs (air)
Heavy metals (water) POP (air)
POP (water)
Unit kg CO2 kg CFC11 kg SO2 kg PO4 kg Pb kg B(a)P kg SPM
kg C2H4
kg act.subst
MJ LHV kg kg Ni eq
kg PAH/20 eq
kg Hg/20 eq kg TE eq
kg TE eq
Total 6,00E+0
2 6,36E-
04 6,29E+00 2,88E-015,03E-
03 3,05E-054,89E+0
03,73E-
01 0,00E+0
01,15E+0
43,31E+0
26,82E-
04 2,13E-064,82E-
03 1,52E-09 0,00E+0
0
Crude iron I 1,77E+0
1 8,19E-
08 1,84E-01 1,64E-021,94E-
04 1,16E-051,13E-
018,48E-
03 0,00E+0
04,01E+0
24,00E+0
03,31E-
05 7,25E-072,56E-
05 2,09E-14 0,00E+0
0
Crude iron I 8,23E-01 3,82E-
09 8,57E-03 7,66E-049,02E-
06 5,41E-075,26E-
033,95E-
04 0,00E+0
01,87E+0
11,86E-
011,54E-
06 3,37E-081,19E-
06 9,72E-16 0,00E+0
0
Steel I 7,88E-03 3,65E-
11 7,51E-05 6,68E-061,64E-
07 5,34E-094,92E-
053,56E-
06 0,00E+0
01,55E-
018,40E-
052,39E-
08 4,96E-101,30E-
08 7,35E-13 0,00E+0
0
X5CrNi18 (304) I 3,32E+0
0 6,34E-
09 1,29E-01 1,16E-031,14E-
05 3,61E-071,27E-
014,23E-
04 0,00E+0
04,81E+0
11,11E-
021,66E-
06 3,42E-081,49E-
06 4,95E-11 0,00E+0
0
Steel I 3,74E+0
0 1,74E-
08 3,57E-02 3,18E-037,80E-
05 2,54E-062,34E-
021,69E-
03 0,00E+0
07,39E+0
13,99E-
021,14E-
05 2,36E-076,16E-
06 3,49E-10 0,00E+0
0
Steel I 1,54E+0
0 7,16E-
09 1,47E-02 1,31E-033,22E-
05 1,05E-069,65E-
036,97E-
04 0,00E+0
03,05E+0
11,65E-
024,69E-
06 9,73E-082,54E-
06 1,44E-10 0,00E+0
0
Steel I 1,03E+0
1 4,80E-
08 9,87E-02 8,78E-032,15E-
04 7,01E-066,46E-
024,67E-
03 0,00E+0
02,04E+0
21,10E-
013,14E-
05 6,52E-071,70E-
05 9,66E-10 0,00E+0
0
Aluminium rec. I 1,81E+0
0 0,00E+0
0 3,03E-02 3,94E-044,14E-
09 1,49E-102,97E-
022,29E-
03 0,00E+0
02,40E+0
12,67E-
011,89E-
07 3,35E-090,00E+0
0 0,00E+00 0,00E+0
0
Copper I 1,44E+0
1 8,92E-
10 1,32E+00 6,10E-032,17E-
07 9,93E-101,29E+0
05,30E-
04 0,00E+0
01,81E+0
22,56E+0
26,49E-
08 1,24E-081,41E-
07 2,27E-16 0,00E+0
0
Zinc I 7,96E-01 5,04E-
08 1,11E-02 3,86E-048,28E-
06 2,22E-089,35E-
031,52E-
04 0,00E+0
01,07E+0
11,71E-
011,76E-
06 7,41E-108,27E-
06 1,28E-14 0,00E+0
0
Cardboard duplex/tripl 1,75E+0
0 4,45E-
07 8,56E-03 8,65E-048,39E-
06 1,10E-076,24E-
036,62E-
04 0,00E+0
03,33E+0
13,30E-
013,32E-
06 1,78E-092,51E-
06 0,00E+00 0,00E+0
0
PS (EPS) B250 (1998) 3,30E+0
0 1,80E-
06 2,43E-02 2,04E-037,15E-
06 9,12E-081,38E-
022,75E-
03 0,00E+0
09,64E+0
15,23E-
021,18E-
06 2,40E-092,66E-
06 0,00E+00 0,00E+0
0
PE (LDPE) I 2,92E-01 0,00E+0
0 4,53E-03 4,32E-041,94E-
07 2,32E-103,11E-
032,17E-
03 0,00E+0
02,16E+0
11,02E-
020,00E+0
0 4,67E-100,00E+0
0 0,00E+00 0,00E+0
0
PP granulate average B250 6,61E-02 5,19E-
08 6,37E-04 4,86E-051,57E-
07 4,90E-103,88E-
041,42E-
04 0,00E+0
02,58E+0
01,10E-
034,18E-
08 4,94E-111,43E-
07 0,00E+00 0,00E+0
0
Poplar I 1,24E-03 2,52E-
11 1,59E-05 2,58E-062,16E-
09 1,44E-113,54E-
061,85E-
06 0,00E+0
02,54E-
011,05E-
034,38E-
09 8,13E-124,00E-
09 6,43E-18 0,00E+0
0
ABS I 2,89E+0
0 8,58E-
07 1,52E-02 1,63E-039,15E-
07 1,76E-088,58E-
031,80E-
03 0,00E+0
07,44E+0
11,04E-
010,00E+0
0 6,52E-090,00E+0
0 0,00E+00 0,00E+0
0
EPDM rubber ETH U 1,31E-02 4,30E-
08 1,10E-04 8,26E-063,55E-
07 1,38E-099,11E-
056,33E-
05 0,00E+0
04,25E-
010,00E+0
06,65E-
08 1,13E-112,64E-
07 5,27E-15 0,00E+0
0
PS (EPS) B250 (1998) 1,03E-01 5,62E-
08 7,58E-04 6,38E-052,23E-
07 2,84E-094,29E-
048,58E-
05 0,00E+0
03,01E+0
01,63E-
033,69E-
08 7,49E-118,29E-
08 0,00E+00 0,00E+0
0
PA 6 I 1,59E-01 0,00E+0
0 3,40E-04 5,03E-052,18E-
07 7,82E-101,01E-
041,27E-
04 0,00E+0
03,18E+0
02,57E-
041,38E-
07 3,67E-110,00E+0
0 0,00E+00 0,00E+0
0
PC I 2,91E-02 1,06E-
08 1,48E-04 1,71E-056,16E-
09 2,36E-116,90E-
051,19E-
05 0,00E+0
05,58E-
011,10E-
030,00E+0
0 3,82E-110,00E+0
0 0,00E+00 0,00E+0
0
450
Impact category greenhouse
ozone layer
acidification
eutrophication
heavy metals
carcinogens
winter smog - P.M.
summer smog - VOCs
pesticides
energy resources
solid waste
Heavy metals (air) PAHs (air)
Heavy metals (water) POP (air)
POP (water)
PE (HDPE) I 3,51E-02 0,00E+0
0 4,86E-04 4,96E-052,63E-
08 6,66E-122,98E-
043,12E-
04 0,00E+0
02,82E+0
01,19E-
030,00E+0
0 4,47E-110,00E+0
0 0,00E+00 0,00E+0
0
PE (HDPE) I 4,37E-02 0,00E+0
0 6,05E-04 6,17E-053,27E-
08 8,29E-123,71E-
043,88E-
04 0,00E+0
03,51E+0
01,49E-
030,00E+0
0 5,57E-110,00E+0
0 0,00E+00 0,00E+0
0
PET amorph I 1,19E-02 0,00E+0
0 1,50E-04 7,06E-062,19E-
08 9,96E-111,14E-
041,47E-
05 0,00E+0
01,90E-
012,93E-
040,00E+0
0 1,20E-100,00E+0
0 0,00E+00 0,00E+0
0
HDPE B250 1,01E-02 5,07E-
09 6,18E-05 6,35E-061,64E-
08 4,75E-112,84E-
053,42E-
05 0,00E+0
03,50E-
011,51E-
044,49E-
09 5,68E-121,52E-
08 0,00E+00 0,00E+0
0
PP I 1,74E+0
0 0,00E+0
0 2,86E-02 2,15E-031,36E-
06 1,41E-092,06E-
028,19E-
03 0,00E+0
01,25E+0
24,91E-
020,00E+0
0 2,22E-090,00E+0
0 0,00E+00 0,00E+0
0
PS (EPS) B250 (1998) 2,39E+0
1 1,31E-
05 1,77E-01 1,49E-025,20E-
05 6,62E-071,00E-
012,00E-
02 0,00E+0
07,00E+0
23,80E-
018,61E-
06 1,75E-081,93E-
05 0,00E+00 0,00E+0
0
PUR semi rigid foam I 2,90E+0
1 1,94E-
07 2,62E-01 3,58E-021,37E-
03 1,02E-072,01E-
013,99E-
02 0,00E+0
05,74E+0
24,94E+0
01,87E-
06 3,13E-083,07E-
05 4,94E-14 0,00E+0
0
PUR semi rigid foam I 7,98E+0
0 5,33E-
08 7,20E-02 9,86E-033,77E-
04 2,81E-085,52E-
021,10E-
02 0,00E+0
01,58E+0
21,36E+0
05,13E-
07 8,62E-098,44E-
06 1,36E-14 0,00E+0
0
PVC B250 7,43E-01 2,13E-
07 8,79E-03 8,23E-043,67E-
06 5,13E-094,68E-
032,16E-
03 0,00E+0
02,22E+0
14,66E-
023,98E-
07 1,94E-096,76E-
06 0,00E+00 0,00E+0
0
adhesive - glue 0,00E+0
0 0,00E+0
0 0,00E+00 0,00E+000,00E+0
0 0,00E+000,00E+0
00,00E+0
0 0,00E+0
00,00E+0
00,00E+0
00,00E+0
0 0,00E+000,00E+0
0 0,00E+00 0,00E+0
0
Paint ETH S 1,60E-02 1,36E-
08 1,13E-04 4,47E-061,85E-
06 1,13E-089,69E-
057,28E-
06 0,00E+0
03,06E-
010,00E+0
06,18E-
07 1,11E-111,19E-
07 8,22E-16 0,00E+0
0
Glass (white) B250 4,81E+0
0 4,37E-
06 2,81E-02 2,10E-032,90E-
04 3,12E-081,69E-
024,34E-
03 0,00E+0
07,59E+0
14,28E-
011,42E-
05 9,89E-094,92E-
06 0,00E+00 0,00E+0
0
adhesive - glue 0,00E+0
0 0,00E+0
0 0,00E+00 0,00E+000,00E+0
0 0,00E+000,00E+0
00,00E+0
0 0,00E+0
00,00E+0
00,00E+0
00,00E+0
0 0,00E+000,00E+0
0 0,00E+00 0,00E+0
0 Kraft paper, bleached, at plant/RER U
-1,29E-01
4,62E-08 2,67E-03 1,34E-03
6,23E-06 4,61E-08
1,58E-03
1,58E-04
0,00E+00
2,22E+01
0,00E+00
8,57E-07 0,00E+00
2,04E-05 1,42E-12
0,00E+00
Refrigerant R134a, at plant/RER U
3,95E+00
5,45E-04 3,58E-03 2,59E-04
6,58E-06 1,92E-08
3,09E-03
1,51E-04
0,00E+00
6,30E+00
0,00E+00
6,63E-07 0,00E+00
9,12E-06 3,11E-14
0,00E+00
EPDM rubber ETH U 6,54E-01 2,14E-
06 5,48E-03 4,11E-041,76E-
05 6,89E-084,53E-
033,15E-
03 0,00E+0
02,12E+0
10,00E+0
03,31E-
06 5,61E-101,31E-
05 2,62E-13 0,00E+0
0 Electronics for control units/RER U
1,38E+00
7,43E-08 1,13E-02 2,02E-03
1,90E-04 9,00E-07
9,91E-03
5,22E-04
0,00E+00
3,22E+01
0,00E+00
5,30E-05 0,00E+00
3,10E-04 1,27E-12
0,00E+00
Copper I 2,07E+0
0 1,28E-
10 1,90E-01 8,79E-043,13E-
08 1,43E-101,85E-
017,64E-
05 0,00E+0
02,61E+0
13,69E+0
19,35E-
09 1,78E-092,03E-
08 3,27E-17 0,00E+0
0 Electronics for control units/RER U
1,47E+00
7,91E-08 1,20E-02 2,15E-03
2,02E-04 9,58E-07
1,06E-02
5,55E-04
0,00E+00
3,42E+01
0,00E+00
5,64E-05 0,00E+00
3,30E-04 1,36E-12
0,00E+00
Lubricating oil, at plant/RER U 1,86E-01 1,61E-
07 1,67E-03 9,04E-042,62E-
06 1,57E-081,35E-
039,69E-
04 0,00E+0
01,53E+0
10,00E+0
06,04E-
07 0,00E+004,99E-
06 4,57E-14 0,00E+0
0
Water demineralized ETH U 1,28E-01 1,69E-
07 9,76E-04 3,83E-051,31E-
06 3,23E-097,78E-
044,08E-
05 0,00E+0
02,92E+0
00,00E+0
06,42E-
07 1,03E-102,79E-
06 8,42E-15 0,00E+0
0
Lubricating oil, at plant/RER U 2,63E-02 2,27E-
08 2,36E-04 1,27E-043,69E-
07 2,21E-091,90E-
041,37E-
04 0,00E+0
02,16E+0
00,00E+0
08,52E-
08 0,00E+007,04E-
07 6,45E-15 0,00E+0
0
Nitrogen, liquid, at plant/RER U 3,25E-02 1,44E-
09 1,71E-04 1,26E-052,12E-
07 2,08E-091,36E-
042,98E-
06 0,00E+0
07,91E-
010,00E+0
04,27E-
08 0,00E+002,39E-
07 2,86E-15 0,00E+0
0
Argon, liquid, at plant/RER U 1,39E-03 6,07E- 7,29E-06 5,42E-07 9,09E- 8,82E-11 5,77E- 1,34E- 0,00E+0 3,46E- 0,00E+0 1,83E- 0,00E+00 1,04E- 1,21E-16 0,00E+0

451
Impact category greenhouse
ozone layer
acidification
eutrophication
heavy metals
carcinogens
winter smog - P.M.
summer smog - VOCs
pesticides
energy resources
solid waste
Heavy metals (air) PAHs (air)
Heavy metals (water) POP (air)
POP (water)
11 09 06 07 0 02 0 09 08 0
Oxygen, liquid, at plant/RER U 9,85E-03 4,37E-
10 5,17E-05 3,81E-066,44E-
08 6,31E-104,12E-
059,05E-
07 0,00E+0
02,40E-
010,00E+0
01,29E-
08 0,00E+007,26E-
08 8,66E-16 0,00E+0
0
Electricity MV use in UCPTE U1,35E+0
1 6,65E-
06 9,62E-02 3,27E-039,13E-
05 3,01E-078,04E-
022,94E-
03 0,00E+0
03,18E+0
20,00E+0
02,30E-
05 6,56E-091,34E-
04 8,35E-13 0,00E+0
0
Heat gas B250 9,50E-01 1,09E-
08 1,17E-03 1,49E-043,55E-
07 7,04E-085,03E-
041,09E-
04 0,00E+0
01,60E+0
10,00E+0
01,84E-
07 7,57E-104,41E-
07 0,00E+00 0,00E+0
0
Truck 28t B250 1,08E+0
1 1,20E-
05 1,46E-01 2,46E-021,64E-
05 8,41E-081,56E-
022,70E-
02 0,00E+0
01,41E+0
20,00E+0
05,68E-
06 1,13E-074,51E-
06 0,00E+00 0,00E+0
0
Sea ship B250 2,48E-01 2,76E-
07 3,77E-03 8,45E-055,24E-
06 1,15E-083,33E-
032,42E-
04 0,00E+0
03,41E+0
00,00E+0
02,27E-
06 1,66E-101,99E-
07 0,00E+00 0,00E+0
0
Hot rolling, steel/RER U 7,13E-01 5,87E-
08 2,42E-03 1,07E-037,54E-
05 8,26E-082,37E-
035,18E-
04 0,00E+0
01,51E+0
10,00E+0
02,10E-
06 0,00E+007,70E-
05 1,05E-12 0,00E+0
0
Sheet rolling, steel/RER U 1,46E+0
0 1,05E-
07 6,80E-03 2,66E-031,98E-
04 1,82E-076,51E-
034,00E-
04 0,00E+0
03,14E+0
10,00E+0
02,09E-
06 0,00E+001,49E-
03 3,24E-12 0,00E+0
0
Extruding alum I 4,19E+0
2 4,52E-
05 3,27E+00 1,32E-011,31E-
03 2,38E-062,41E+0
01,40E-
01 0,00E+0
07,65E+0
32,57E+0
13,14E-
04 1,31E-072,11E-
03 3,75E-12 0,00E+0
0
Wire drawing, copper/RER U 2,13E+0
0 1,15E-
07 1,55E-02 1,18E-031,83E-
04 5,45E-071,33E-
026,36E-
04 0,00E+0
05,01E+0
10,00E+0
06,94E-
05 0,00E+001,02E-
04 9,50E-13 0,00E+0
0
Foaming, expanding/RER U 8,30E+0
0 1,10E-
06 4,49E-02 3,22E-033,97E-
05 4,54E-073,57E-
028,10E-
02 0,00E+0
01,68E+0
20,00E+0
02,72E-
05 0,00E+003,79E-
05 5,10E-13 0,00E+0
0
Injection moulding/RER U 2,34E+0
0 1,46E-
06 1,08E-02 1,57E-031,85E-
05 1,68E-077,90E-
036,08E-
04 0,00E+0
05,86E+0
10,00E+0
03,48E-
06 0,00E+003,35E-
05 3,03E-13 0,00E+0
0
Extrusion PVC I 9,85E-02 0,00E+0
0 1,51E-03 1,11E-049,71E-
09 4,48E-111,22E-
032,89E-
04 0,00E+0
01,39E+0
04,24E-
031,08E-
12 9,54E-110,00E+0
0 0,00E+00 0,00E+0
0

452
Table A.22: COLD 7 – EoL phase – Output of SimaPro with “Ecoindicator 95 rev EuP method”
Impact category Unit Total Recycling only B250 avoided
Incineration 2000 B250 (98)
avoided
Landfill B250 (98)
greenhouse kg CO2 -5,94E+01 -6,65E+01 6,51E+00 5,74E-01
ozone layer kg CFC11 -2,79E-05 -2,75E-05 -3,94E-07 3,20E-08
acidification kg SO2 -2,64E-01 -2,55E-01 -9,04E-03 5,52E-04
eutrophication kg PO4 -2,34E-02 -2,34E-02 -1,48E-04 2,06E-04
heavy metals kg Pb -3,57E-04 -3,68E-04 1,03E-05 6,01E-07
carcinogens kg B(a)P -4,24E-05 -4,23E-05 -4,90E-08 2,46E-10
winter smog - P.M. kg SPM -1,56E-01 -1,47E-01 -8,42E-03 2,59E-04
summer smog - VOCs kg C2H4 -6,86E-02 -6,86E-02 -2,47E-04 2,06E-04
pesticides kg act.subst 0,00E+00 0,00E+00 0,00E+00 0,00E+00
energy resources MJ LHV -1,12E+03 -1,08E+03 -4,32E+01 4,19E-01
solid waste kg -4,51E+01 -4,51E+01 0,00E+00 0,00E+00
Heavy metals (air) kg Ni eq -1,81E-05 -2,12E-05 2,96E-06 1,48E-07
PAHs (air) kg PAH/20 eq -7,91E-07 -7,93E-07 1,38E-09 3,13E-10
Heavy metals (water) kg Hg/20 eq -8,47E-04 -8,46E-04 -9,61E-06 8,81E-06
POP (air) kg TE eq 4,67E-11 0,00E+00 4,66E-11 7,59E-14
POP (water) kg TE eq 0,00E+00 0,00E+00 0,00E+00 0,00E+00
Table A.23: COLD 7 – Life Cycle – Output of SimaPro with “Ecoindicator 95 rev EuP method”
Impact category Unit Total COLD7 assembling
Electricity LV use UCPTE U
Delivery van (<3.5t) B250 cold 7 EoL cold 7 use materials
(per LC)
greenhouse kg CO2 3.626,95 600,20 2.815,55 0,54 -59,43 270,09
ozone layer kg CFC11 0,00 0,00 0,00 0,00 -0,00 0,00
acidification kg SO2 29,37 6,29 20,51 0,00 -0,26 2,83
eutrophication kg PO4 1,09 0,29 0,69 0,00 -0,02 0,13
heavy metals kg Pb 0,03 0,01 0,02 0,00 -0,00 0,00
carcinogens kg B(a)P 0,00 0,00 0,00 0,00 -0,00 0,00
winter smog - P.M. kg SPM 24,13 4,89 17,19 0,00 -0,16 2,20
summer smog - VOCs kg C2H4 1,11 0,37 0,63 0,00 -0,07 0,17
pesticides kg act.subst 0,00 0,00 0,00 0,00 0,00 0,00
energy resources MJ LHV 82.304,50 11.512,99 66.711,95 6,94 -1.108,22 5.180,84
solid waste kg 520,15 331,22 85,00 0,00 -45,12 149,05
Heavy metals (air) kg Ni eq 0,01 0,00 0,01 0,00 -0,00 0,00
PAHs (air) kg PAH/20 eq 0,00 0,00 0,00 0,00 -0,00 0,00
Heavy metals (water) kg Hg/20 eq 0,03 0,00 0,03 0,00 -0,00 0,00
POP (air) kg TE eq 0,00 0,00 0,00 0,00 0,00 0,00
POP (water) kg TE eq 0 0 0 0 0 0