draft instream flow incremental methodology (ifim) studies
TRANSCRIPT
Prepared by
EA Engineering, Science, and Technology, Inc. 15 Loveton Circle Sparks, MD 21152
DDRRAAFFTT IInnssttrreeaamm FFllooww IInnccrreemmeennttaall MMeetthhooddoollooggyy ((IIFFIIMM)) SSttuuddiieess oonn tthhee NNoorrtthh AAnnnnaa aanndd PPaammuunnkkeeyy RRiivveerrss,, VViirrggiinniiaa
22 MMaarrcchh 22000099 DDRRAAFFTT
Prepared for:
Dominion Resources Services, Inc. 5000 Dominion Boulevard Glen Allen, VA 23060
IFIM Studies on the North Anna and Pamunkey Rivers DRAFT REPORT 2 March 2009
ES-1
EXECUTIVE SUMMARY An Instream Flow Incremental Methodology (IFIM) study was conducted as a condition of the Nuclear Regulatory Commission’s Early Site Permit and Virginia’s Coastal Consistency Certification associated with the possible construction of an additional generating unit (Unit 3) at Dominion’s North Anna Power Station. The scope of the IFIM study was developed in consultation with the Virginia Departments of Environmental Quality (VDEQ), Game and Inland Fisheries (VDGIF), and Conservation and Recreation (VDCR). The agency-approved “North Anna IFIM Study Plan” (dated 28 March 2007) included components that evaluated how the addition of a third unit could impact habitat for fish, other organisms, and recreation on the North Anna River and Pamunkey River. Wetlands, boat docks and ramps on Lake Anna were also studied. The completion of this IFIM study satisfies the special condition in the Coastal Zone Consistency determination for North Anna Power Station Unit 3. Water from Lake Anna will be used for the proposed Unit 3 cooling system, a hybrid wet and dry cooling tower system. One benefit of this hybrid system is that the addition of Unit 3 will not add additional heat to Lake Anna. Although the Unit 3 cooling system will use only a small portion of water compared to Units 1 and 2, it will still involve some consumptive use of water from Lake Anna. These modern tower designs allow for operational flexibility during different times of the year to balance water conservation and energy use. More specifically, the wet cooling tower alone requires the most water but conserves energy, and is referred to as the Energy Conservation (EC) mode. Operation of the dry cooling tower in addition to the wet cooling tower (referred to as the Maximum Water Conservation (MWC) mode), would save water but consume additional energy that would otherwise be provided to the electricity grid. Of primary concern to natural resource agencies and other stakeholders reviewing potential environmental effects of operating Unit 3 were the potential for reduced flows to the North Anna River, downstream of Lake Anna Dam, and lake level changes. The IFIM study examined how operation of Unit 3 could be accomplished while minimizing, to the extent practical, impacts to the North Anna River. Specific objectives included avoiding significant increases in the frequency of low flow conditions in the river, and avoiding impacts to downstream habitats for fish and other organisms. Based upon extensive interactions with the natural resource agencies, emphasis was placed on comparing three station operating scenarios:
• Existing Condition - the current operation of Units 1 and 2, and associated lake management practices.
• Lake Anna at 250.0 ft with Unit 3 Scenario – Dominion’s proposed operations with three units and a year around target lake elevation of 250.0 ft. The cooling system would be operated in Maximum Water Conservation mode below a lake elevation of 250.0 ft.
• Lake Anna at 250.25 ft with Unit 3 Scenario – An alternative operating scenario with three units and a year around target lake elevation of 250.25 ft. The cooling system would be operated in Maximum Water Conservation mode below a lake elevation of 250.0 ft.
A brief description of the results and conclusions derived from the analysis of these three scenarios are summarized below.

IFIM Studies on the North Anna and Pamunkey Rivers DRAFT REPORT 2 March 2009
ES-2
NORTH ANNA AND PAMUNKEY RIVERS The study area comprised approximately 70 miles of stream between the North Anna Dam and the head of tide in the Pamunkey River at the U.S. Route 360 bridge. Fifteen individual and groups of fish and invertebrates were identified for evaluation. Each of these has specific habitat requirements for living and reproducing (e.g., water velocity, water depth, bottom material). River Flows The study evaluated the frequency of various flows under: Existing Conditions, a Lake Anna at 250.0 ft with Unit 3 Scenario, and a Lake Anna at 250.25 ft with Unit 3 Scenario. The frequency of 20 cubic feet per second (cfs) flow from the dam, which represents the required minimum flow from the dam under drought conditions (lake elevation <248.0 ft), was an issue of interest because of potential impacts to aquatic habitats and downstream users of the rivers. The results of the analysis are summarized in the table below.
Operational Scenario Percent of Time at 20 cfs Existing Condition 4.6 %
Lake Anna @ 250.0 ft w/ Unit 3 6.3 % Lake Anna @ 250.25 ft w/ Unit 3 5.5 %
The 3-inch increase in lake storage capacity with the Lake Anna at 250.25 ft Scenario would maintain lake water surface elevation above Existing Conditions approximately 75 percent of the time, and better protect river aquatic habitat and recreation, particularly during dry periods. Aquatic Habitat Availability The preferred habitat for any species is largely dependent upon the depth, velocity and river bottom conditions that are available through the year. Habitat features change with flow, and these habitat changes were modeled and quantified for the North Anna River, and non-tidal Pamunkey River. A key recommendation by the resource agencies was to focus on a subset of the species and lifestages which are more sensitive to habitat changes associated with flow reductions. Following initial assessments of predicted changes in habitat quantity, VDGIF and VDEQ staff recommended that further analyses focus on the following species:
• adult and spawning northern hogsucker, • the freshwater mussels, Lampsilis radiata and Elliptio complanata, and • spawning and juvenile American shad in the Coastal Plain.
The predicted flows, water depths and river bottom conditions were identified under each of the operating scenarios and compared to the preferences for the target species at different times of the year. Whenever there is a change in flow, some species gain and some species lose habitat depending upon the species and season, and which operating scenario (Lake Anna at 250.0 or 250.25 ft) is compared to the Existing Condition. The Lake Anna at 250.0 ft scenario had the greatest losses. For the Lake Anna at 250.25 ft scenario, in no case were habitat losses in the
IFIM Studies on the North Anna and Pamunkey Rivers DRAFT REPORT 2 March 2009
ES-3
North Anna River more than 10 percent on an annual basis, and most gains were in the same percentage range (though a few gains exceeded 10 percent). For the Pamunkey River, slight habitat gains were predicted for most species. In general, habitat changes for the select species and life stages relative to Existing Conditions tended to be greater during summer and fall months than winter and spring months. North Anna River Recreational Study This study also examined how changes in flow from the Lake Anna Dam could affect the ability to use the river for recreational paddling. Analyses indicated that flows of 100-200 cfs at the North Anna Dam would benefit recreational use of the Piedmont and Fall Zone by novice to intermediate canoeists, with minimal impact to water levels in Lake Anna. A release of 177 cfs at the dam for 17 hours would provide approximately 12 hrs of flows in excess of 200 cfs through the Fall Zone, and is expected to have less than a 0.2-inch impact on water level in Lake Anna per event. Under the Lake Anna at 250.25 ft with Unit 3 scenario, when water elevations in Lake Anna are greater than 250.0 ft it would be feasible to provide recreational releases for one day each weekend during June and/or July, as requested by VDCR. LAKE ANNA STUDY Effect of Water Level Rise on Lake Anna Wetlands The study evaluated five coves to assess the effect of lake elevation increases on wetlands along Lake Anna. No increases in lake elevation would occur under the Lake Anna at 250.0 ft with Unit 3 Scenario. Under the Lake Anna at 250.25 ft with Unit 3 Scenario, there would be an increase in lake level elevation of up to 3 inches, which would occur 75 percent of the time compared to the Existing Condition. The median increase in lake elevation during the growing season months of July to October, however, would not exceed 0.1 ft. These minor increases in water surface elevation are unlikely to result in changes to the distribution of wetland types or the areal coverage of existing wetlands along the fringes of Lake Anna, due to the fact that the proposed changes vary little from the range of lake elevations that currently occur under Existing Conditions (typically 248.0 ft – 251.5 ft). The wetland plant species observed tolerate the existing inundation depths and frequencies and are generally tolerant of lake level fluctuations. Effect of Increased Lake Level on Use of Boat Docks and Ramps on Lake Anna Fifteen publicly accessible boat docks and eleven boat ramp areas were surveyed on Lake Anna to evaluate the potential effect of increased lake level on these facilities. No change in accessibility would occur under the Lake Anna at 250.0 ft with Unit 3 scenario. Under the Lake Anna at 250.25 ft with Unit 3 scenario, increases in lake level would occur most of the time, as discussed for wetlands. The small elevation differences associated with the Lake Anna at 250.25 ft with Unit 3 scenario are not expected to adversely affect functionality of boat ramps or safe access to boats from docks.
IFIM Studies on the North Anna and Pamunkey Rivers DRAFT REPORT 2 March 2009
i
TABLE OF CONTENTS Page EXECUTIVE SUMMARY .......................................................................................................ES-1 LIST OF FIGURES ....................................................................................................................... iv LIST OF TABLES ...........................................................................................................................v 1. INTRODUCTION ..............................................................................................................1 1.1 Project Background ..................................................................................................1 2. DESCRIPTION OF STUDY AREA ...................................................................................3
2.1 Lake Anna ................................................................................................................3 2.2 North Anna and Pamunkey Rivers ..........................................................................3
3. STUDY METHODS ............................................................................................................6 3.1 North Anna and Pamunkey River Study Methods ...................................................6 3.1.1 Field Studies...................................................................................................6 3.1.2 Species of Interest ..........................................................................................7 3.1.2.1 Target Species ..................................................................................7 3.1.2.2 Habitat Suitability Criteria (HSC) ....................................................9 3.1.3 PHABSIM Model ..........................................................................................9 3.1.3.1 Surface Water Model ......................................................................10 3.1.3.2 Velocity Model ...............................................................................10 3.1.3.3 Habitat Model and Transect Weighting .........................................10 3.1.4 Processing WUA Values for Operating Scenarios ......................................11 3.1.5 Simulation Scenarios ...................................................................................12 3.1.6 Flows for Recreational Paddling ..................................................................13 3.2 Lake Anna Wetland, and Boat Dock and Ramp Study Methods ................................14 3.2.1 Purpose of the Lake Studies .........................................................................14 3.2.2 Surface Elevations - LIDAR ........................................................................14 3.2.3 Field Surveys ...............................................................................................14 3.2.4 Water Depths ...............................................................................................15 3.2.5 Wetland Communities .................................................................................15 3.2.6 GIS Processes ...............................................................................................16
IFIM Studies on the North Anna and Pamunkey Rivers DRAFT REPORT 2 March 2009
ii
3.2.7 Boat Dock and Ramp Survey .......................................................................16 4. RESULTS ..........................................................................................................................18
4.1 North Anna and Pamunkey River Studies ................................................................18 4.1.1 Flows at Lake Anna Dam and Reservoir Elevations ......................................18 4.1.1.1 Flows at Lake Anna Dam ..................................................................18 4.1.1.2 Lake Anna Elevations .......................................................................18 4.1.2 Relative Availability of Aquatic Habitat for Target Species ..........................19 4.1.2.1 Pre-Impoundment Scenario ...............................................................19 4.1.2.2 Existing Conditions Scenario (NAPS Units 1 and 2) ........................20 4.1.2.3 Initial Dominion Proposal Scenario (EC/MWC at 250.0 ft) .............21 4.1.2.4 Interim Proposal Scenario (MWC at 250.25 ft Seasonally) ..............24 4.1.2.5 Alternative Operating Scenario (EC/MWC at 250.25 ft year round) .24 4.1.3 Analysis of Flows for Recreational Paddling .................................................25 4.2 Lake Anna Studies ....................................................................................................28 4.2.1 Wetland Community Survey ..........................................................................28 4.2.1.1 Christopher Creek ..............................................................................29 4.2.1.2 Contrary Creek ..................................................................................29 4.2.1.3 Crafton Creek ....................................................................................29 4.2.1.4 Freshwater Creek ...............................................................................29 4.2.1.5 Goldmine Creek ................................................................................30 4.2.2 Existing Lake Level Conditions .....................................................................30 4.2.3 Proposed Lake Level Conditions ....................................................................31 4.2.3.1 EC/MWC with Existing Target Elevation of 250.0 ft .......................31 4.2.3.2 EC/MWC with Target Elevation of 250.25 ft ...................................31 4.2.4 Wetland Community Assessment ...................................................................31 4.2.5 Boat Dock and Ramp Survey .........................................................................33 4.2.6 Lake Anna Fisheries and Aquatic Resources .................................................34
5. CONCLUSIONS................................................................................................................36
5.1 North Anna and Pamunkey River Conclusions ........................................................36

IFIM Studies on the North Anna and Pamunkey Rivers DRAFT REPORT 2 March 2009
iii
5.1.1 River Flows.....................................................................................................36 5.1.2 Aquatic Habitat Availability ...........................................................................36 5.1.3 Recreational Suitability ...................................................................................37 5.2 Lake Anna Study Conclusions .................................................................................37 5.2.1 Effect of Water Level Rise on Lake Anna Wetlands .....................................37 5.2.2 Effect of Increased Lake Level on Use of Boat Docks and Ramps
on Lake Anna .................................................................................................37 6. LITERATURE CITED ......................................................................................................38

IFIM Studies on the North Anna and Pamunkey Rivers DRAFT REPORT 2 March 2009
iv
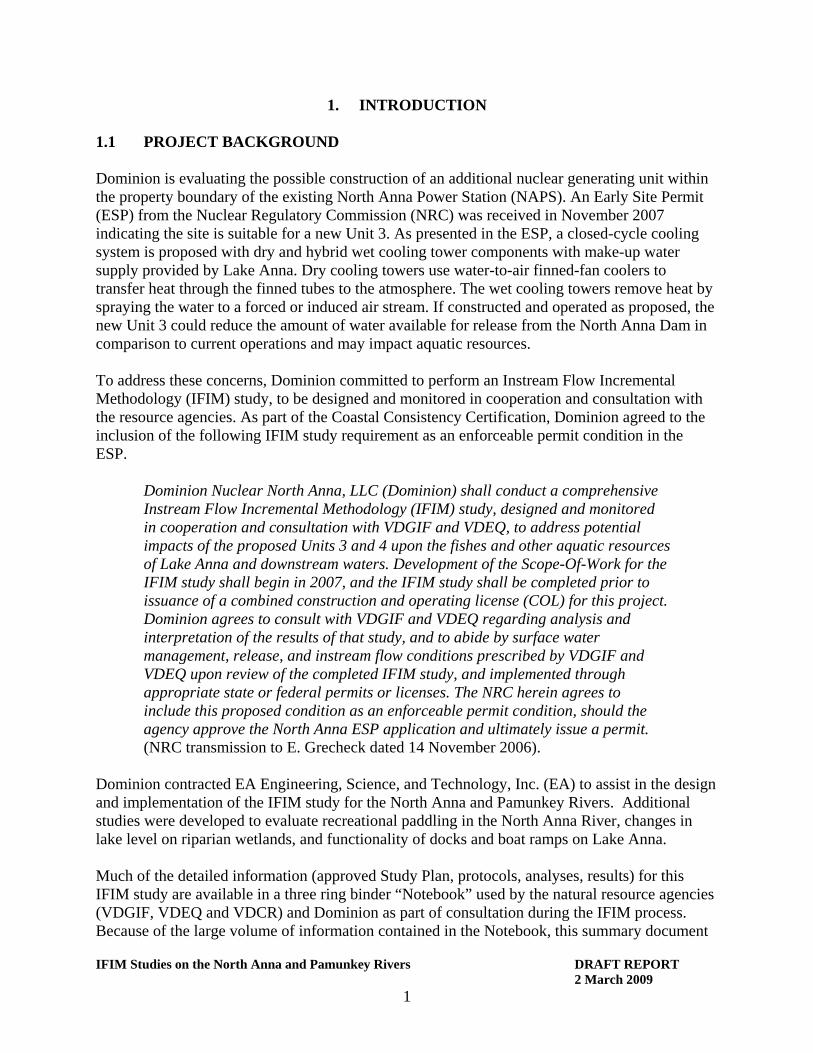
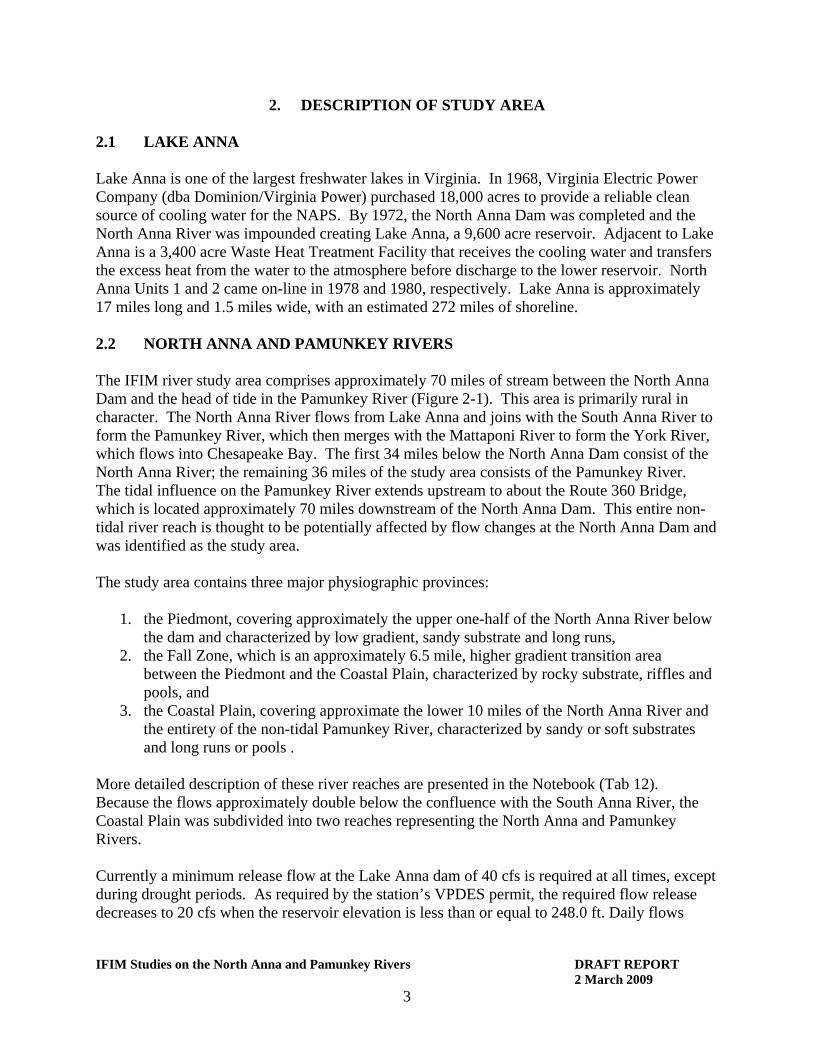
LIST OF FIGURES No. Title 2-1 Generalized Map Showing Key North Anna IFIM Landmarks 3-1 Five Coves Surveyed in September 2007 3-2 Location of Boat Docks and Boat Ramps Surveyed within Lake Anna Reservoir 4-1 Comparison of WUA Between Existing Conditions and EC/MWC at 250.0 ft and
250.25 ft Scenarios, Northern Hogsucker-Adult 4-2 Comparison of WUA Between Existing Conditions and EC/MWC at 250.0 ft and
250.25 ft Scenarios, Northern Hogsucker-Spawning 4-3 Comparison of WUA Between Existing Conditions and EC/MWC at 250.0 ft and
250.25 ft Scenarios, L. radiata 4-4 Comparison of WUA Between Existing Conditions and EC/MWC at 250.0 ft and
250.25 ft Scenarios, E. complanata 4-5 Comparison of WUA Between Existing Conditions and EC/MWC at 250.0 ft and
250.25 ft Scenarios, American Shad-Spawning 4-6 Comparison of WUA Between Existing Conditions and EC/MWC at 250.0 ft and
250.25 ft Scenarios, American Shad-Juvenile 4-7 Freshwater Creek Inundation of Estimated Wetlands at 249-251 ft. MSL, Water
Surface Elevation 4-8 Goldmine Creek Inundation of Estimated Wetlands at 249-251 ft. MSL, Water
Surface Elevation
IFIM Studies on the North Anna and Pamunkey Rivers DRAFT REPORT 2 March 2009
v
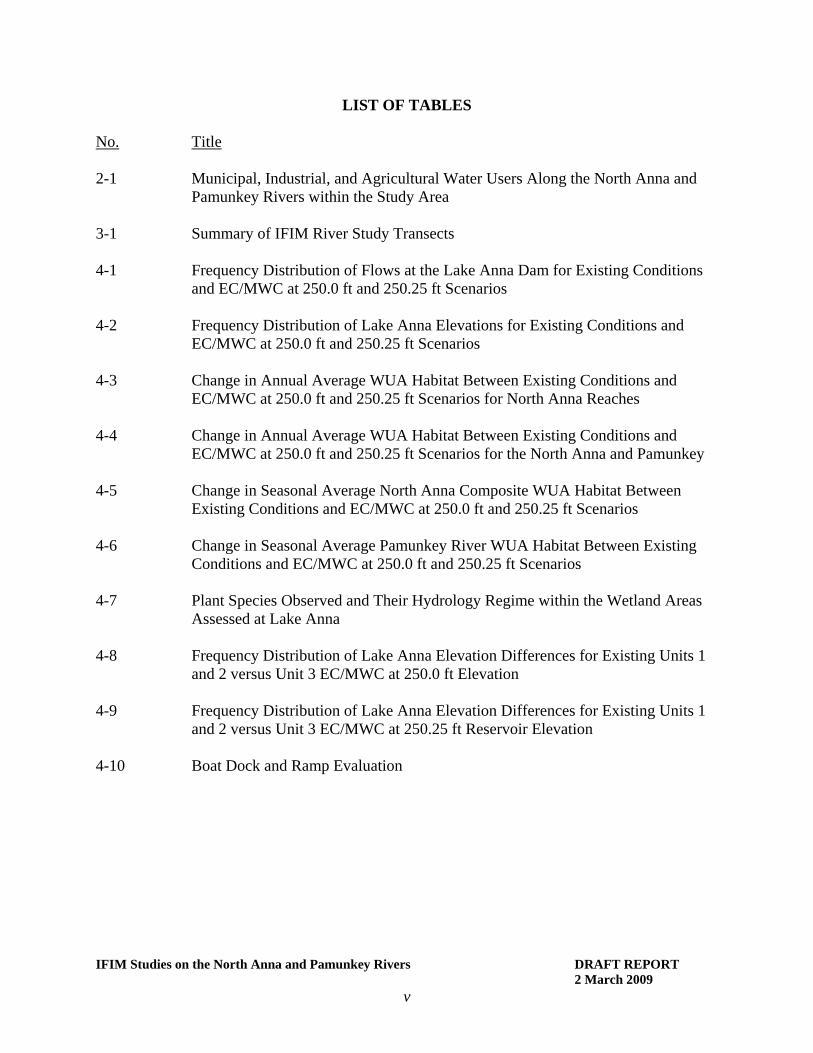
LIST OF TABLES No. Title 2-1 Municipal, Industrial, and Agricultural Water Users Along the North Anna and
Pamunkey Rivers within the Study Area 3-1 Summary of IFIM River Study Transects 4-1 Frequency Distribution of Flows at the Lake Anna Dam for Existing Conditions
and EC/MWC at 250.0 ft and 250.25 ft Scenarios 4-2 Frequency Distribution of Lake Anna Elevations for Existing Conditions and
EC/MWC at 250.0 ft and 250.25 ft Scenarios 4-3 Change in Annual Average WUA Habitat Between Existing Conditions and
EC/MWC at 250.0 ft and 250.25 ft Scenarios for North Anna Reaches 4-4 Change in Annual Average WUA Habitat Between Existing Conditions and
EC/MWC at 250.0 ft and 250.25 ft Scenarios for the North Anna and Pamunkey 4-5 Change in Seasonal Average North Anna Composite WUA Habitat Between
Existing Conditions and EC/MWC at 250.0 ft and 250.25 ft Scenarios 4-6 Change in Seasonal Average Pamunkey River WUA Habitat Between Existing
Conditions and EC/MWC at 250.0 ft and 250.25 ft Scenarios 4-7 Plant Species Observed and Their Hydrology Regime within the Wetland Areas
Assessed at Lake Anna 4-8 Frequency Distribution of Lake Anna Elevation Differences for Existing Units 1
and 2 versus Unit 3 EC/MWC at 250.0 ft Elevation 4-9 Frequency Distribution of Lake Anna Elevation Differences for Existing Units 1
and 2 versus Unit 3 EC/MWC at 250.25 ft Reservoir Elevation 4-10 Boat Dock and Ramp Evaluation
IFIM Studies on the North Anna and Pamunkey Rivers DRAFT REPORT 2 March 2009
1
1. INTRODUCTION
1.1 PROJECT BACKGROUND Dominion is evaluating the possible construction of an additional nuclear generating unit within the property boundary of the existing North Anna Power Station (NAPS). An Early Site Permit (ESP) from the Nuclear Regulatory Commission (NRC) was received in November 2007 indicating the site is suitable for a new Unit 3. As presented in the ESP, a closed-cycle cooling system is proposed with dry and hybrid wet cooling tower components with make-up water supply provided by Lake Anna. Dry cooling towers use water-to-air finned-fan coolers to transfer heat through the finned tubes to the atmosphere. The wet cooling towers remove heat by spraying the water to a forced or induced air stream. If constructed and operated as proposed, the new Unit 3 could reduce the amount of water available for release from the North Anna Dam in comparison to current operations and may impact aquatic resources. To address these concerns, Dominion committed to perform an Instream Flow Incremental Methodology (IFIM) study, to be designed and monitored in cooperation and consultation with the resource agencies. As part of the Coastal Consistency Certification, Dominion agreed to the inclusion of the following IFIM study requirement as an enforceable permit condition in the ESP.
Dominion Nuclear North Anna, LLC (Dominion) shall conduct a comprehensive Instream Flow Incremental Methodology (IFIM) study, designed and monitored in cooperation and consultation with VDGIF and VDEQ, to address potential impacts of the proposed Units 3 and 4 upon the fishes and other aquatic resources of Lake Anna and downstream waters. Development of the Scope-Of-Work for the IFIM study shall begin in 2007, and the IFIM study shall be completed prior to issuance of a combined construction and operating license (COL) for this project. Dominion agrees to consult with VDGIF and VDEQ regarding analysis and interpretation of the results of that study, and to abide by surface water management, release, and instream flow conditions prescribed by VDGIF and VDEQ upon review of the completed IFIM study, and implemented through appropriate state or federal permits or licenses. The NRC herein agrees to include this proposed condition as an enforceable permit condition, should the agency approve the North Anna ESP application and ultimately issue a permit. (NRC transmission to E. Grecheck dated 14 November 2006).
Dominion contracted EA Engineering, Science, and Technology, Inc. (EA) to assist in the design and implementation of the IFIM study for the North Anna and Pamunkey Rivers. Additional studies were developed to evaluate recreational paddling in the North Anna River, changes in lake level on riparian wetlands, and functionality of docks and boat ramps on Lake Anna. Much of the detailed information (approved Study Plan, protocols, analyses, results) for this IFIM study are available in a three ring binder “Notebook” used by the natural resource agencies (VDGIF, VDEQ and VDCR) and Dominion as part of consultation during the IFIM process. Because of the large volume of information contained in the Notebook, this summary document

IFIM Studies on the North Anna and Pamunkey Rivers DRAFT REPORT 2 March 2009
2
was developed to cover the key points of the IFIM study that would be more readily available for public review (Notebook is available upon request). Specific sections of the Notebook are referenced in this IFIM summary report as Notebook Tab X, etc.
IFIM Studies on the North Anna and Pamunkey Rivers DRAFT REPORT 2 March 2009
3
2. DESCRIPTION OF STUDY AREA 2.1 LAKE ANNA Lake Anna is one of the largest freshwater lakes in Virginia. In 1968, Virginia Electric Power Company (dba Dominion/Virginia Power) purchased 18,000 acres to provide a reliable clean source of cooling water for the NAPS. By 1972, the North Anna Dam was completed and the North Anna River was impounded creating Lake Anna, a 9,600 acre reservoir. Adjacent to Lake Anna is a 3,400 acre Waste Heat Treatment Facility that receives the cooling water and transfers the excess heat from the water to the atmosphere before discharge to the lower reservoir. North Anna Units 1 and 2 came on-line in 1978 and 1980, respectively. Lake Anna is approximately 17 miles long and 1.5 miles wide, with an estimated 272 miles of shoreline. 2.2 NORTH ANNA AND PAMUNKEY RIVERS
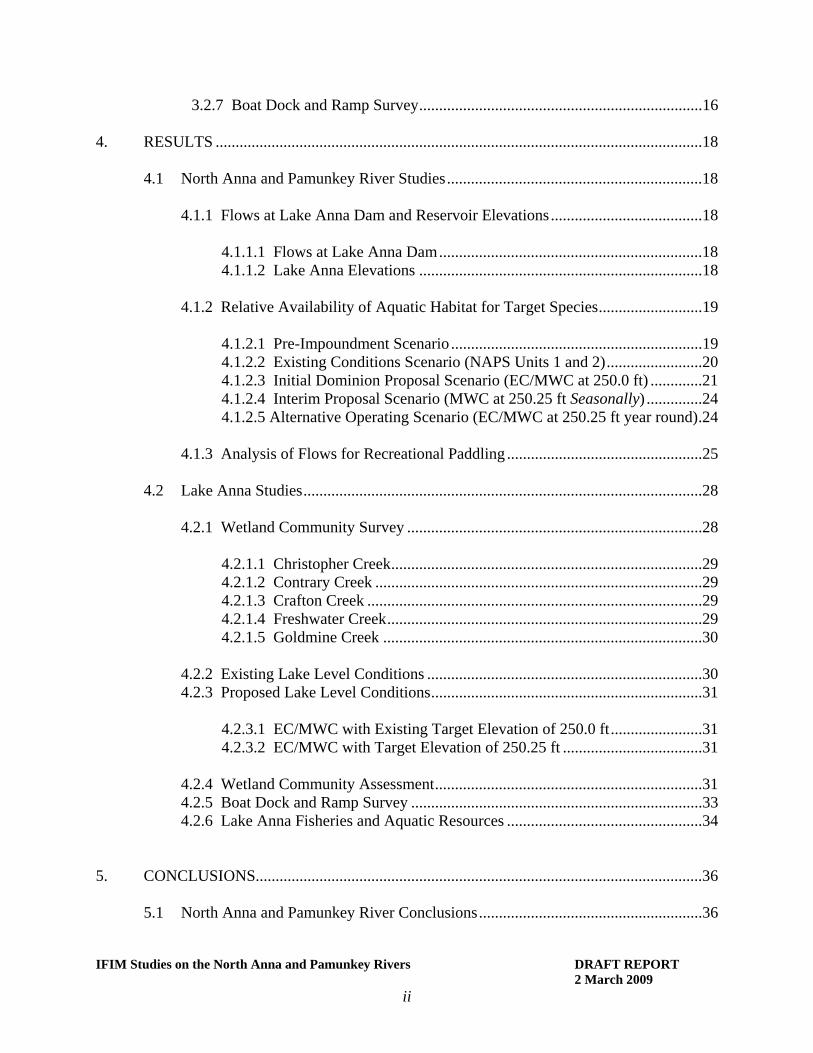
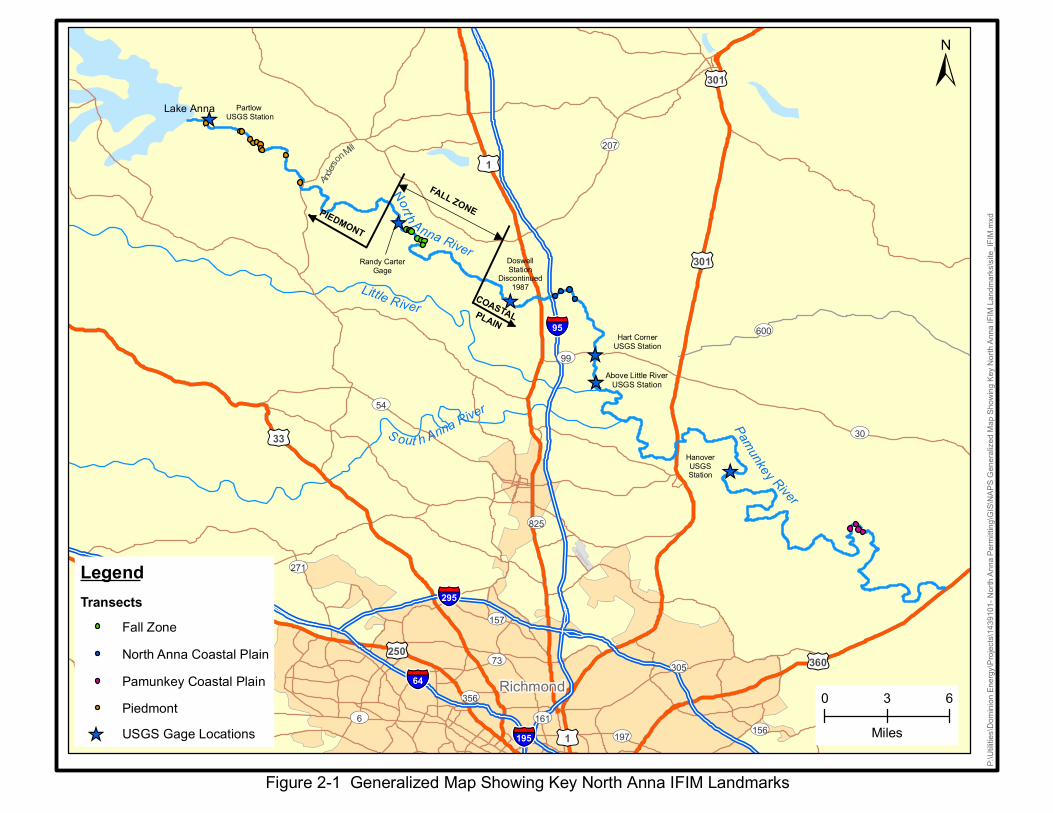
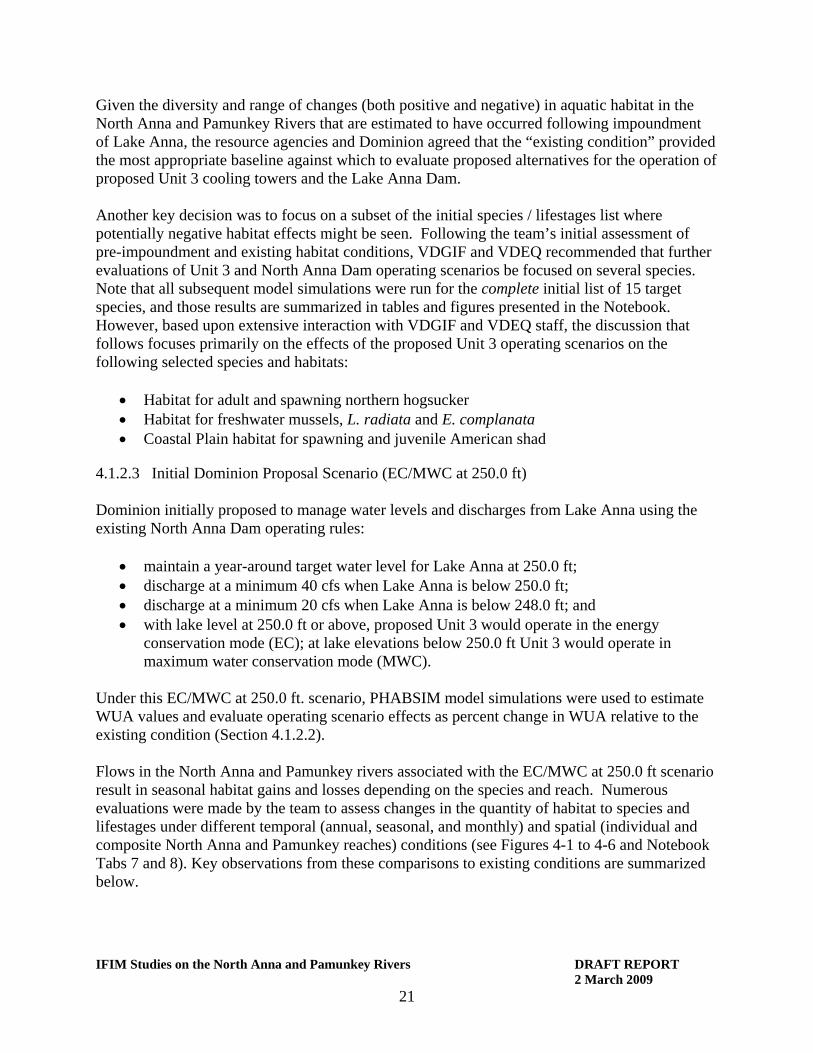
The IFIM river study area comprises approximately 70 miles of stream between the North Anna Dam and the head of tide in the Pamunkey River (Figure 2-1). This area is primarily rural in character. The North Anna River flows from Lake Anna and joins with the South Anna River to form the Pamunkey River, which then merges with the Mattaponi River to form the York River, which flows into Chesapeake Bay. The first 34 miles below the North Anna Dam consist of the North Anna River; the remaining 36 miles of the study area consists of the Pamunkey River. The tidal influence on the Pamunkey River extends upstream to about the Route 360 Bridge, which is located approximately 70 miles downstream of the North Anna Dam. This entire non-tidal river reach is thought to be potentially affected by flow changes at the North Anna Dam and was identified as the study area. The study area contains three major physiographic provinces:
1. the Piedmont, covering approximately the upper one-half of the North Anna River below the dam and characterized by low gradient, sandy substrate and long runs,
2. the Fall Zone, which is an approximately 6.5 mile, higher gradient transition area between the Piedmont and the Coastal Plain, characterized by rocky substrate, riffles and pools, and
3. the Coastal Plain, covering approximate the lower 10 miles of the North Anna River and the entirety of the non-tidal Pamunkey River, characterized by sandy or soft substrates and long runs or pools .
More detailed description of these river reaches are presented in the Notebook (Tab 12). Because the flows approximately double below the confluence with the South Anna River, the Coastal Plain was subdivided into two reaches representing the North Anna and Pamunkey Rivers. Currently a minimum release flow at the Lake Anna dam of 40 cfs is required at all times, except during drought periods. As required by the station’s VPDES permit, the required flow release decreases to 20 cfs when the reservoir elevation is less than or equal to 248.0 ft. Daily flows
IFIM Studies on the North Anna and Pamunkey Rivers DRAFT REPORT 2 March 2009
4
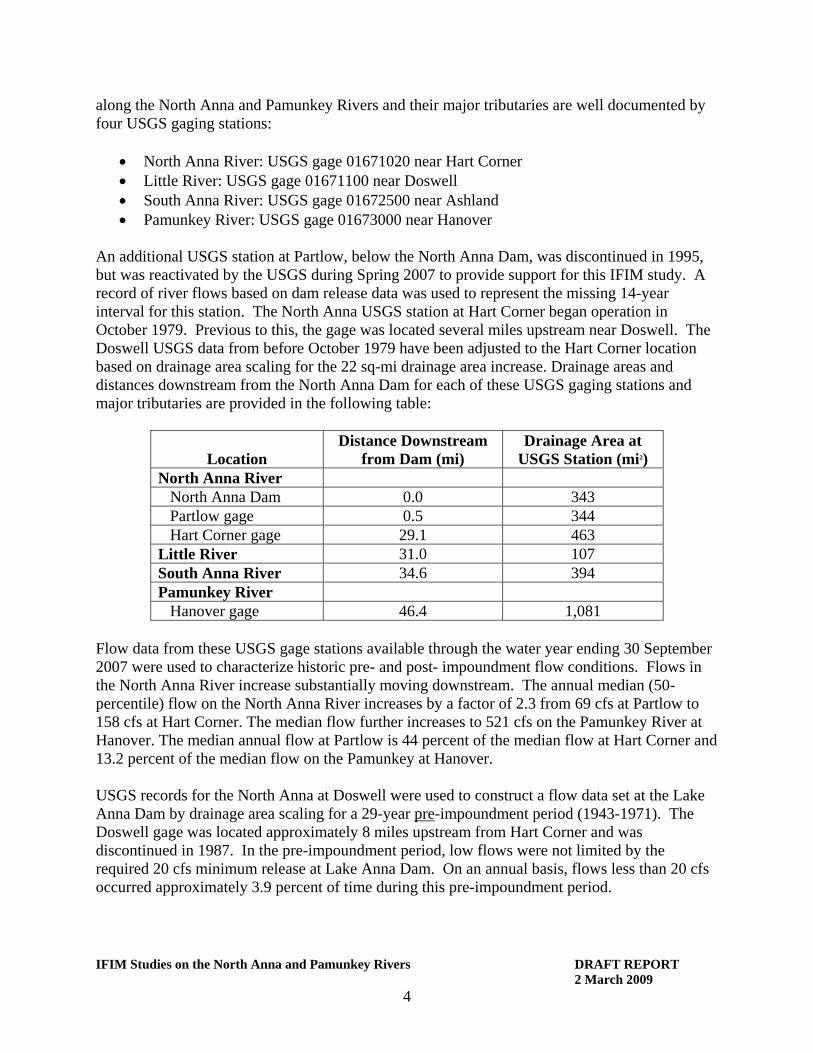
along the North Anna and Pamunkey Rivers and their major tributaries are well documented by four USGS gaging stations:
• North Anna River: USGS gage 01671020 near Hart Corner • Little River: USGS gage 01671100 near Doswell • South Anna River: USGS gage 01672500 near Ashland • Pamunkey River: USGS gage 01673000 near Hanover
An additional USGS station at Partlow, below the North Anna Dam, was discontinued in 1995, but was reactivated by the USGS during Spring 2007 to provide support for this IFIM study. A record of river flows based on dam release data was used to represent the missing 14-year interval for this station. The North Anna USGS station at Hart Corner began operation in October 1979. Previous to this, the gage was located several miles upstream near Doswell. The Doswell USGS data from before October 1979 have been adjusted to the Hart Corner location based on drainage area scaling for the 22 sq-mi drainage area increase. Drainage areas and distances downstream from the North Anna Dam for each of these USGS gaging stations and major tributaries are provided in the following table:
Location
Distance Downstream from Dam (mi)
Drainage Area at USGS Station (mi2)
North Anna River North Anna Dam 0.0 343 Partlow gage 0.5 344 Hart Corner gage 29.1 463 Little River 31.0 107 South Anna River 34.6 394 Pamunkey River Hanover gage 46.4 1,081
Flow data from these USGS gage stations available through the water year ending 30 September 2007 were used to characterize historic pre- and post- impoundment flow conditions. Flows in the North Anna River increase substantially moving downstream. The annual median (50-percentile) flow on the North Anna River increases by a factor of 2.3 from 69 cfs at Partlow to 158 cfs at Hart Corner. The median flow further increases to 521 cfs on the Pamunkey River at Hanover. The median annual flow at Partlow is 44 percent of the median flow at Hart Corner and 13.2 percent of the median flow on the Pamunkey at Hanover. USGS records for the North Anna at Doswell were used to construct a flow data set at the Lake Anna Dam by drainage area scaling for a 29-year pre-impoundment period (1943-1971). The Doswell gage was located approximately 8 miles upstream from Hart Corner and was discontinued in 1987. In the pre-impoundment period, low flows were not limited by the required 20 cfs minimum release at Lake Anna Dam. On an annual basis, flows less than 20 cfs occurred approximately 3.9 percent of time during this pre-impoundment period.

IFIM Studies on the North Anna and Pamunkey Rivers DRAFT REPORT 2 March 2009
5
A summary of water users along the North Anna and Pamunkey Rivers within the IFIM study area was compiled based upon water usage data obtained from VDEQ. These data are summarized in Table 2-1 for municipal, industrial, and agricultural users. The largest discharger is the Doswell WWTP, which has a design flow of 8.97 cfs. The other major discharger is Bear Island Paper Co., which has an average discharge flow of 1.89 cfs. Both of these outfalls are located on the North Anna River in the 1.9 mile reach between the Hart Corner USGS gage and the confluence of Little River. There are three other small WWTP’s upstream and downstream of this location with flows of less than 0.2 cfs. The largest water user is the Hanover County public water supply intake of 5.25 cfs, located one mile upstream of the Hart Corner USGS gage. Bear Island Paper has a mean intake flow of 3.74 cfs, approximately 1 mile downstream of the Hart Corner USGS gage. There are a number of seasonal agricultural intakes for irrigation throughout the study area. The reported mean flows are averaged over the growing season. On the North Anna River, there are two withdrawals of 0.29-0.40 cfs upstream of the confluence of Little River. On the Pamunkey River there are two 0.38-0.48 cfs withdrawals between the South Anna River and Hanover, and five 0.08-0.14 cfs withdrawals downstream of Hanover.
_̂
_̂
_̂
_̂
_̂
_̂
Lake Anna
Nort h Anna River
S out h Anna River
Little River
PIEDMONT
COASTALPamunkey River
Anderso
n Mill
FALL ZONE
Above Little RiverUSGS Station
PLAIN
HanoverUSGSStation
DoswellStation
Discontinued1987
Partlow USGS Station
Hart CornerUSGS Station
Randy CarterGage
Richmond
§̈¦95
§̈¦295
§̈¦64
§̈¦195
£¤301
£¤360
£¤1
£¤250
£¤33
£¤301
£¤1UV6
UV54
UV207
UV30
UV600
UV156
UV271
UV157
UV73
UV197
UV356
UV161
UV305
UV825
UV99
Figure 2-1 Generalized Map Showing Key North Anna IFIM Landmarks
±
LegendTransects
Fall ZoneNorth Anna Coastal PlainPamunkey Coastal PlainPiedmont
_̂ USGS Gage Locations
0 3 6
Miles
P:\Ut
ilities
\Dom
inion
Energ
y\Proj
ects\
1439
101-
North
Anna
Perm
itting
\GIS\
NAPS
Gen
eralize
d Map
Show
ing Ke
y Nort
h Ann
a IFIM
Land
marks
\site_
IFIM.
mxd
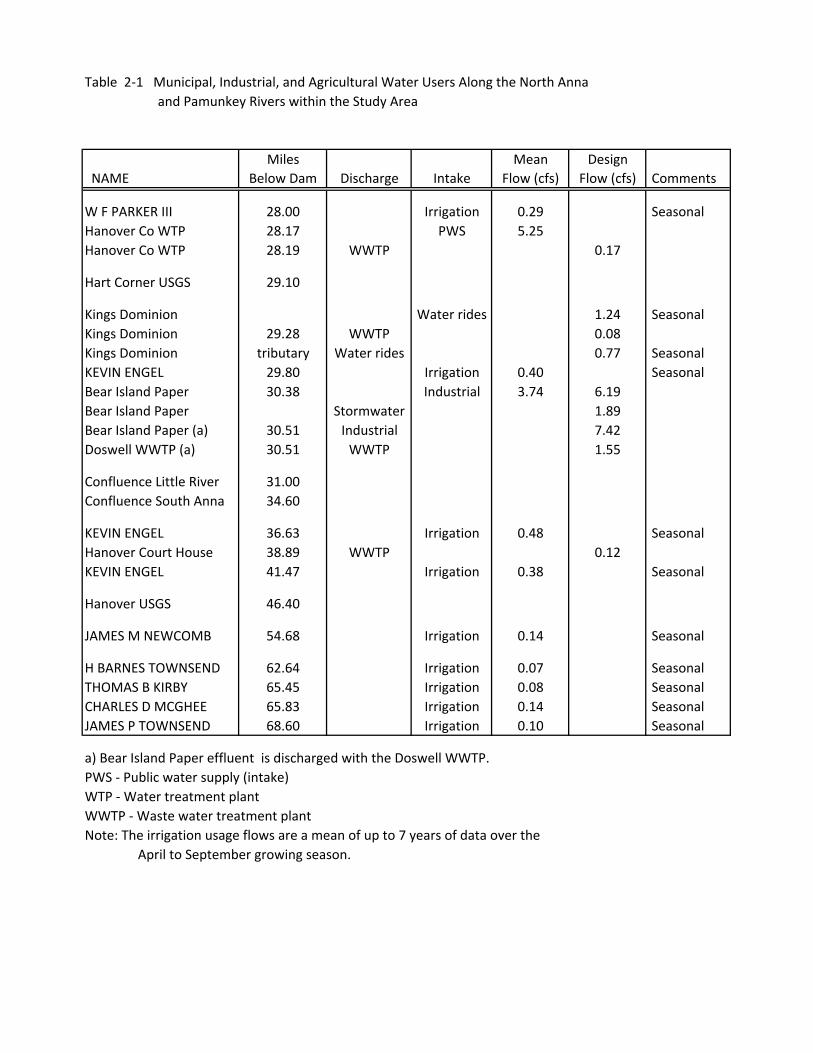
Table 2‐1 Municipal, Industrial, and Agricultural Water Users Along the North Anna and Pamunkey Rivers within the Study Area
Miles Mean Design NAME Below Dam Discharge Intake Flow (cfs) Flow (cfs) Comments
W F PARKER III 28.00 Irrigation 0.29 SeasonalHanover Co WTP 28.17 PWS 5.25Hanover Co WTP 28.19 WWTP 0.17
Hart Corner USGS 29.10
Kings Dominion Water rides 1.24 SeasonalKings Dominion 29.28 WWTP 0.08Kings Dominion tributary Water rides 0.77 SeasonalKEVIN ENGEL 29.80 Irrigation 0.40 SeasonalBear Island Paper 30.38 Industrial 3.74 6.19Bear Island Paper Stormwater 1.89Bear Island Paper (a) 30.51 Industrial 7.42Doswell WWTP (a) 30.51 WWTP 1.55
Confluence Little River 31.00Confluence South Anna 34.60
KEVIN ENGEL 36.63 Irrigation 0.48 SeasonalHanover Court House 38.89 WWTP 0.12KEVIN ENGEL 41.47 Irrigation 0.38 Seasonal
Hanover USGS 46.40
JAMES M NEWCOMB 54.68 Irrigation 0.14 Seasonal
H BARNES TOWNSEND 62.64 Irrigation 0.07 SeasonalTHOMAS B KIRBY 65.45 Irrigation 0.08 SeasonalCHARLES D MCGHEE 65.83 Irrigation 0.14 SeasonalJAMES P TOWNSEND 68.60 Irrigation 0.10 Seasonal
a) Bear Island Paper effluent is discharged with the Doswell WWTP.PWS ‐ Public water supply (intake)WTP ‐ Water treatment plantWWTP ‐ Waste water treatment plantNote: The irrigation usage flows are a mean of up to 7 years of data over the April to September growing season.
IFIM Studies on the North Anna and Pamunkey Rivers DRAFT REPORT 2 March 2009
6
3. STUDY METHODS This section describes the methods used for the North Anna IFIM study. Section 3.1 presents the methods used in the studies which addressed the IFIM program for the North Anna and Pamunkey Rivers, and Section 3.2 discusses the methods used in the lake portion of the study (wetlands evaluation and boat docks and ramps). Both of these study components are presented in the North Anna IFIM Study Plan, which was reviewed and approved by the resource agencies, and is included as Tab 12 in the Notebook.
3.1 NORTH ANNA AND PAMUNKEY RIVER STUDY METHODS The North Anna and Pamunkey River studies applied the IFIM approach developed by the US Fish and Wildlife Service (USFWS) to assess the relationships between water flow rates and habitat available to support a variety of aquatic organisms and lifestages. The process used the USFWS’ PHABSIM (Physical Habitat Simulation Model) to integrate data from field characterization of habitat parameters (velocity, water depth, substrate and cover) over a range of river flows to quantify the amount of preferred habitat available for selected species/lifestages. The calibrated model was then used to simulate habitat conditions for selected flow regimes and target species. IFIM provides a formalized iterative framework to assess and compare the effects of alternative flows and project operating scenarios on aquatic habitats. A formal study plan was developed by EA and submitted to VDGIF and VDEQ for their review and comments. The final North Anna IFIM Study Plan (Notebook Tab 12) was dated 28 March 2007, and reflected the input of the agencies. Following study plan approval, data collection was initiated in the spring of 2007. Analysis followed in stages as data from river and lake studies were obtained. The results of the North Anna IFIM field study and PHABSIM modeling have been the subject of iterative review and analysis by VDEQ, VDGIF, VDCR, and Dominion with the objectives of: (1) examining the incremental change in Weighted Usable Area (WUA) values resulting from the operation of proposed Unit 3, and (2) evaluation and consensus formation related to alternative Lake Anna water surface elevations and discharge scenarios at the North Anna Dam. 3.1.1 Field Studies For this program, specific physical habitat data were collected at 27 selected representative transects under three flow conditions. Bottom profiles and water surface elevations relative to fixed benchmarks, substrate and cover characteristics, and cross-section velocity profiles were collected at the low flow conditions at each transect. Water surface elevation and velocity profiles were also collected during the mid- and high flow surveys as safe field operations permitted. Study reaches for the North Anna and Pamunkey Rivers were separated by physiographic regions and the transition between them (i.e., Piedmont, Fall Zone, North Anna Coastal Plain, and Pamunkey Coastal Plain). Representative transects were then selected in a collaborative

IFIM Studies on the North Anna and Pamunkey Rivers DRAFT REPORT 2 March 2009
7
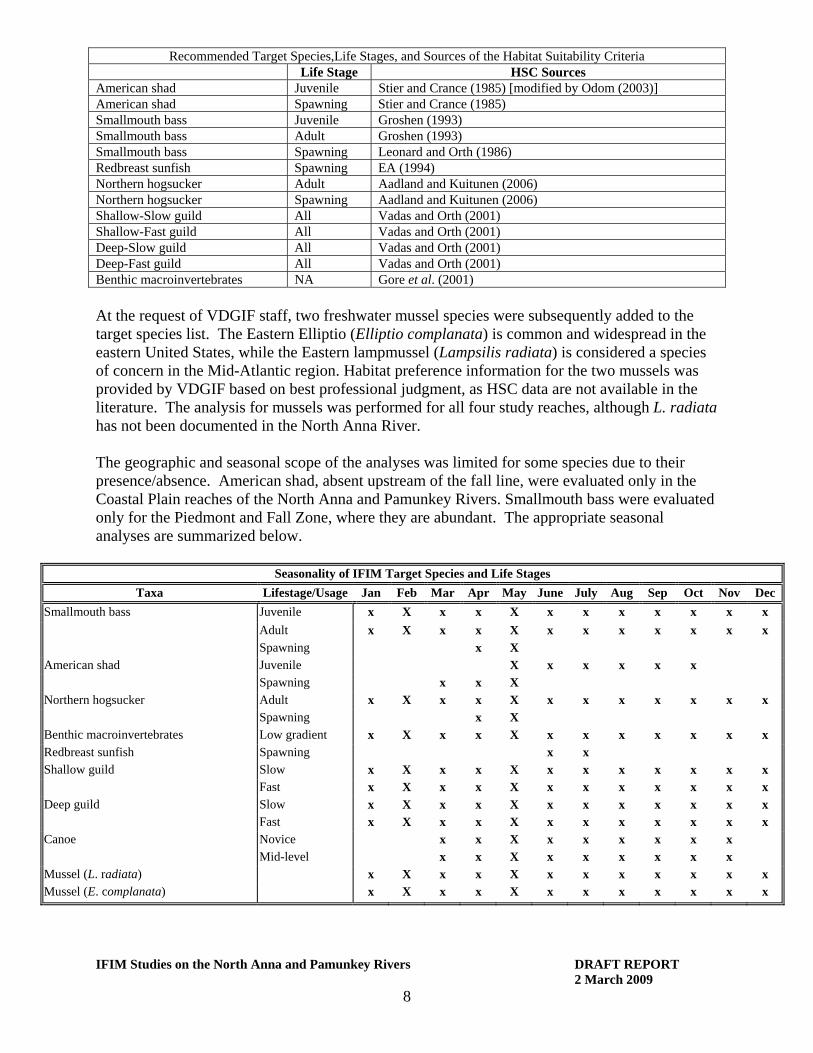
effort between representatives of Dominion, VDGIF, VDEQ, and EA. Selection of final study transects was accomplished during a series of reconnaissance trips by this selection team floating extensive reaches of the North Anna River from below the North Anna Dam at the Partlow USGS stream gage to above the confluence with the South Anna River and the Pamunkey Coastal Plain during May and June 2007. The locations of final selected study transects, which were approved by VDEQ and VDGIF staff on 26 June 2007, are shown on Figure 2-1 and listed in Table 3-1. Flows for the three field studies were selected to allow model simulations over the range of flows present in the North Anna. It is generally reported that PHABSIM can provide representative extrapolation of habitat/discharge relationships between 0.4 times the lowest flow measured and up to 2.5 times the highest flow measured. The “target flows” selected for the IFIM field surveys were approximately 40 cfs, 140 cfs, and 250 cfs measured at North Anna Dam. A 250 cfs measured flow would allow model simulations up to 625 cfs at the North Anna Dam, which is in the upper 90-95 percentile of the flow range. The actual study flows were affected by short and long-term weather conditions, precipitation, and prevailing water storage in Lake Anna. The low-flow field data collection program was conducted on 22-27 July 2007; but the prevailing regional drought precluded conducting the middle and high flow studies until significant storm events during the spring of 2008. The mid-flow collection dates were 8-11 April and 3-4 May 2008, and the high-flow field dates were 1-2 May 2008. Discussions were held with VDGIF and DEQ staff confirming the flows for the surveys. Observed flows in the North Anna River below Partlow during these three studies were approximately 60 cfs, 190 cfs, and 430 cfs. The 430 cfs measured flow allowed model simulations up to 1,100 cfs (x2.5) on the North Anna River. Higher flows on the Pamunkey River allowed model simulations up to 3,200 cfs at the Pamunkey transects. In summary, the study flows allowed model simulations over the flow range at the North Anna and Pamunkey USGS gages. 3.1.2 Species of Interest 3.1.2.1 Target Species A mix of species and life stages representative of the range of habitat requirements of the resident aquatic community likely to be affected in the study area was selected for study. This was done through consultation between VDGIF and Dominion personnel, and final agreement on the target species was confirmed during a review meeting on 13 February 2007. Habitat Suitability Criteria (HSC) for each selected species were identified from the literature, and were approved by VDGIF staff as being applicable to the North Anna study area. HSC allow for the quantification of habitat quality for each species/life stage based upon flow velocity, depth of the water column and substrate/cover, and are discussed in Section 3.1.2.2 below. The recommended target species, life stages, and sources of the HSC for the North Anna River IFIM study were as follows.
IFIM Studies on the North Anna and Pamunkey Rivers DRAFT REPORT 2 March 2009
8
Recommended Target Species,Life Stages, and Sources of the Habitat Suitability Criteria Life Stage HSC Sources American shad Juvenile Stier and Crance (1985) [modified by Odom (2003)] American shad Spawning Stier and Crance (1985) Smallmouth bass Juvenile Groshen (1993) Smallmouth bass Adult Groshen (1993) Smallmouth bass Spawning Leonard and Orth (1986) Redbreast sunfish Spawning EA (1994) Northern hogsucker Adult Aadland and Kuitunen (2006) Northern hogsucker Spawning Aadland and Kuitunen (2006) Shallow-Slow guild All Vadas and Orth (2001) Shallow-Fast guild All Vadas and Orth (2001) Deep-Slow guild All Vadas and Orth (2001) Deep-Fast guild All Vadas and Orth (2001) Benthic macroinvertebrates NA Gore et al. (2001) At the request of VDGIF staff, two freshwater mussel species were subsequently added to the target species list. The Eastern Elliptio (Elliptio complanata) is common and widespread in the eastern United States, while the Eastern lampmussel (Lampsilis radiata) is considered a species of concern in the Mid-Atlantic region. Habitat preference information for the two mussels was provided by VDGIF based on best professional judgment, as HSC data are not available in the literature. The analysis for mussels was performed for all four study reaches, although L. radiata has not been documented in the North Anna River. The geographic and seasonal scope of the analyses was limited for some species due to their presence/absence. American shad, absent upstream of the fall line, were evaluated only in the Coastal Plain reaches of the North Anna and Pamunkey Rivers. Smallmouth bass were evaluated only for the Piedmont and Fall Zone, where they are abundant. The appropriate seasonal analyses are summarized below.
Seasonality of IFIM Target Species and Life Stages Taxa Lifestage/Usage Jan Feb Mar Apr May June July Aug Sep Oct Nov Dec
Smallmouth bass Juvenile x X x x X x x x x x x x Adult x X x x X x x x x x x x Spawning x X
American shad Juvenile X x x x x x Spawning x x X
Northern hogsucker Adult x X x x X x x x x x x x Spawning x X
Benthic macroinvertebrates Low gradient x X x x X x x x x x x x Redbreast sunfish Spawning x x Shallow guild Slow x X x x X x x x x x x x
Fast x X x x X x x x x x x x Deep guild Slow x X x x X x x x x x x x
Fast x X x x X x x x x x x x Canoe Novice x x X x x x x x x
Mid-level x x X x x x x x x Mussel (L. radiata) x X x x X x x x x x x x Mussel (E. complanata) x X x x X x x x x x x x

IFIM Studies on the North Anna and Pamunkey Rivers DRAFT REPORT 2 March 2009
9
In addition to the fish and macroinvertebrate assessment, the potential effect of river flow changes on recreation (i.e., canoeing) was evaluated with the PHABSIM model using HSC criteria for both novice and mid-level canoeists (EA 1991). During initial analysis it became apparent that because study transects were selected with a primary focus on habitat for aquatic organisms, these transects were not representative of the water depth and velocity requirements of recreational canoeists. For completeness, the PHABSIM results for canoeists are presented in Notebook Tabs 5, 6, 7, 8 and 10, but a more representative evaluation, developed in consultation with VDCR, was undertaken and is described in Section 3.2.6. 3.1.2.2 Habitat Suitability Criteria (HSC)
For each selected species/lifestage, HSC specific to water depth, water velocity, and substrate/cover were used in PHABSIM . HSC were constructed using a preference index ranging from 0 (least preferred) to 1 (most preferred). HSCs for each of the targeted species and life stages were presented in Attachment A of the 28 March 2007 North Anna IFIM Study Plan (Notebook Tab 12). The HSCs were used to estimate available habitat quantified as Weighted Usable Area (WUA) in units of ft2/1,000 ft of stream. Although there is considerable overlap among the preferred ranges for the selected species/lifestages, the HSC curves for the selected target species are representative of the range and diversity in the aquatic community. The substrate and cover preference of a given species cannot readily be represented by a curve/continuum as is done for velocity and depth. Eighteen unique combinations of substrate and cover were coded (Notebook Tab 12: Table 3) in the North Anna database using the system developed by North Carolina Division of Water Resources (NCDWR). A unique index value (between 0 and 1) was assigned for each combination substrate/cover code (Notebook Tab 12: Table 4) for each species/lifestage, and these values were reviewed and confirmed by VDGIF staff. 3.1.3 PHABSIM Model PHABSIM was used for the hydraulic and habitat modeling. The development of PHABSIM for application to the North Anna study area consisted of three steps:
1. A water surface model was developed based on the measured cross-section profiles and measured water surface elevations at each study transect,
2. A velocity model was developed to provide the lateral velocity distributions within each cross-section, and
3. The calibrated model was run over the project flow range for targeted species and life stages to calculate WUAs.
IFIM Studies on the North Anna and Pamunkey Rivers DRAFT REPORT 2 March 2009
10
3.1.3.1 Surface Water Model
A water surface model was developed for each of the 27 transects based on the stream flows and corresponding water surface elevations measured during the three field surveys. This water surface model provided a water surface elevation for every flow within the simulation range. Initially the MANSQ water surface model option available through PHABSIM was applied to the three stream flow/surface elevation data values measured by the field team at each of the 27 transects. The Pamunkey Coastal Plain was the only reach where the MANSQ model provided a good fit to the data from all three surveys. For the remaining North Anna transects, the MANSQ model usually provided a good fit to the mid- and high-flow observations, but underestimated the observed water surface elevations at low-flows. For these transects, a two region approach was adopted where the alternative STGO model was fitted to the low- and mid-flow data, and the MANSQ model was fitted to the mid- and high-flow data. The PHABSIM model was executed over a 10 cfs to 1,100 cfs flow range for the North Anna River transects, and a 20 cfs to 3,200 cfs flow range for the Pamunkey River transects. A more complete discussion of the flow ranges selected for simulation with the PHABSIM model is presented in Notebook Tab 11. 3.1.3.2 Velocity Model The velocity model in PHABSIM used the measured velocity data sets for each transect as a template. In the field, velocities were measured at typically 30 stations along each transect. The velocities in the template are scaled up or down to achieve a mass balance at each transect for the simulated flow. The velocity templates based on the low-flow surveys were used for all simulations below the low-flow surveys. Similarly, the high-flow velocity template was used for all simulations above the high-flow survey. For simulated flows between the low- and mid-flow surveys, and between the mid- and high-flow surveys, velocities were interpolated between the neighboring velocity templates. Simulated velocities were also limited by an upper value based on Manning’s equation, and a maximum allowed Manning’s coefficient assigned to the transect. 3.1.3.3 Habitat Model and Transect Weighting The PHABSIM model calculated weighted usable areas for each species and lifestage based on HSCs as a function of stream depth, velocity, and substrate type (Section 3.1.2.2). For each transect and flow, the PHABSIM model calculated a habitat score at multiple stations along the transect. The multiple habitat values were combined into a WUA (sq-ft/1,000 ft stream). By executing PHABSIM over a flow range, WUAs were calculated as a function of flow for each transect and each species/life stage. The North Anna IFIM analysis was focused on river reaches and not individual transects. Therefore, the WUA results at each transect are averaged together using weighting factors to represent the three North Anna reaches (Piedmont, Fall Zone, and Coastal Plain) and the Pamunkey Coastal Plain. The transect weighting factors within each reach, developed in cooperation with VDGIF staff, are provided in Notebook Tab 11, Table 1. The resulting
IFIM Studies on the North Anna and Pamunkey Rivers DRAFT REPORT 2 March 2009
11
reach-averaged WUA relationships as a function of flow are provided in Notebook Tab 1 for each species and lifestage. As an aid for IFIM summary discussions, North Anna “composite” WUA relationships were constructed based on the combined WUA relationships for the Piedmont, Fall Zone, and Coastal Plain. The Pamunkey Coastal Plain remained separate because of the significant difference in flows between the North Anna and the Pamunkey Coastal Plains (resulting from the flow additions from the Little River and South Anna). The three North Anna reaches were weighted by their respective lengths (Piedmont 15 miles, Fall Zone 7 miles, Coastal Plain 13 miles). WUA curves for the North Anna reaches and the resulting composite curves are presented in Notebook Tab 2. 3.1.4 Processing WUA Values for Operating Scenarios Operating scenarios for existing conditions (Units 1 and 2) and the proposed Unit 3 were modeled using data from the Lake Anna Reservoir model to simulate the release of water at the Lake Anna Dam. This model was developed for Dominion by Bechtel and includes Lake Anna inflows, reservoir evaporation (both natural and due to the operation of Units 1 and 2), and the consumptive cooling tower make-up water for Unit 3. The reservoir model was executed for the 29-year period from October 1978 to September 2007 using daily flow and meteorological data. This 29-year period corresponds to the operation of existing Units 1 and 2. The reservoir model has the ability to estimate the consumptive water usage of the Unit 3 cooling towers as a function of meteorological conditions. The reservoir model outputs the average release flow at the Lake Anna Dam. The 29-year operating scenario flow time-series from the Lake Anna Reservoir model were used as the basis of the IFIM analysis. To accomplish this, the flow at Lake Anna Dam was propagated downstream to the 27 IFIM transects with the aid of the daily USGS data. The USGS data was used to provide the natural incremental runoff flow between transects. During this modeling process, the 5.2 cfs average withdrawal of the Hanover County Public Water Supply was taken into account. The 29-year daily flow time-series data at the 27 IFIM transects was processed into WUA values using the WUA/flow relationships calculated by PHABSIM. When processing the time-series data, the transect flow for each day was looked up in the corresponding transect WUA/flow relationship, and a WUA was interpolated between tabulated flow values. The individual transect WUAs were then averaged into daily reach WUAs using the appropriate transect weighting factors. The resulting output files contained a weighted average WUA for the North Anna Piedmont, Fall Zone, and Coastal Plain, and the Pamunkey Coastal Plain for each day in the 29-year simulation period. This file was then used as the basis for additional processing to calculate monthly, seasonal, and/or annual WUA averages. When averaging over time periods, WUA data were presented only for months of concern for the individual species/life stage. Based upon discussions with VDGIF staff, WUA values for the entire year (12 months) were used except for life stages with limited months of interest (e.g., smallmouth bass spawning; see Section 3.1.2.1).
IFIM Studies on the North Anna and Pamunkey Rivers DRAFT REPORT 2 March 2009
12
3.1.5 Simulation Scenarios PHABSIM was applied to assess the impacts of consumptive water use associated with the operation of proposed North Anna Unit 3, compared to the existing conditions with Units 1 and 2. The PHABSIM model was executed for the 29-year period October 1978 to September 2007. This interval corresponds to the completion of the dam and the operation of Units 1 and 2 and represents the “existing condition”. In addition to the existing conditions, the model was executed for alternative cooling tower and lake level management scenarios associated with the operation of proposed Unit 3. The Unit 3 design includes both wet and dry cooling towers. The dry cooling towers are designed to dissipate a minimum of one-third of the heat during summer design conditions. The dry cooling towers require additional electrical consumption to run the cooling fans. Operating Unit 3 with only the wet cooling towers provides maximum energy conservation (EC). Operating the wet system with the addition of the dry cooling towers provides maximum water conservation (MWC). By design, proposed Unit 3 would employ both cooling tower modes, using the reservoir elevation as an indicator of available water to determine when to switch between the EC and MWC operating modes. For the initial EC/MWC scenario, when the lake elevation is at or above 250.0 ft, Unit 3 would operate in EC mode, and when the lake elevation is below 250.0 ft, Unit 3 would operate in MWC mode. A variety of operating scenarios were analyzed as part of this IFIM study. After review of each analysis, the agencies and Dominion agreed the primary scenarios for evaluation of potential impacts from Unit 3 would be:
1. Unit 1 and 2 existing baseline conditions. 2. Proposed Unit 3 operating in EC/MWC mode at the current 250.0 ft target
lake elevation 3. Proposed Unit 3 operating in EC/MWC mode at a raised 250.25 ft target lake
elevation. Under the third scenario, the normal (targeted) lake elevation is raised to 250.25 ft year around. Analysis was conducted to see if the raised lake elevation could provide additional water for flow augmentation to enhance aquatic habitat, to provide for recreational releases, and to minimize the occurrence of lake elevations at or below 248.0 ft (with the required 20 cfs minimum dam release). For the third scenario, switching between EC and MWC remained the same as the second scenario at 250.0 ft. Other scenarios executed included operating in MWC mode year around, increasing the use of the MWC mode on a seasonal basis, and a 29-year pre-operations (before NAPS Units 1 and 2) scenario for the 1943 to 1971 period (Notebook Tabs 5, 6, 7 and 8). All modeling scenarios were executed for the 29-year post-operations period and included all selected target species and life stages (Section 3.1.2.1). During the iterative analytical process, the VDGIF, VDEQ and VDCR narrowed the focus to several “key” species including northern hogsucker and the two freshwater mussel species. However, simulation results for all species and life stage are provided in Notebook Tabs 5-8. Each scenario was first executed in the Lake Anna Reservoir model to generate weekly average flows at Lake Anna Dam. These flows were
IFIM Studies on the North Anna and Pamunkey Rivers DRAFT REPORT 2 March 2009
13
then propagated downstream to the 27 IFIM transects (as described in the previous sections) and WUA values were computed based on the PBABSIM model results. 3.1.6 Flows for Recreational Paddling Following a preliminary review of WUA results for novice and intermediate canoeists with VDCR, it became apparent that PHABSIM did not adequately simulate the relationship between flow and conditions for recreational canoeing in the North Anna River. This disconnect was primarily because the study transects were selected by the team for their biological significance and did not provide a representative picture of conditions that limit the recreational experience. A process for the detailed evaluation of instream flow requirements for recreational users was subsequently developed in consultation with VDCR. The detail of that process is presented in the Notebook Tab 10. The process relied on the cross-section transect data collected as part of the North Anna IFIM field surveys, but applied best professional judgment to evaluate the influence of width, depth, velocity and length on the canoeing experience, rather than a direct reliance on the WUA values produced by PHABSIM modeling. While an intermediate canoeist may have the skill and ability to identify and negotiate deeper pockets and chutes and maneuver through a given riffle complex, a novice would be more likely to misread the water or lack the skill necessary to maneuver and would consequently get hung up on rocks more frequently. It is difficult to capture this path analysis with a single, biologically-based, two-dimensional study transect. For each Piedmont and Fall Zone transect, the PHABSIM model WUA values for recreation increased with flow over the range of the simulation. As expected, the riffles and shallow runs typically have lower canoeing WUA values at a given flow than deeper runs and pools. This is consistent with the typical experience of the canoeist where the riffles and shallow runs provide the greatest constraints for recreational canoeing, particularly at low river flows. Therefore, the final analysis focused on flow requirements to support recreational canoeing through riffles and shallow runs in the Piedmont and Fall Zone reaches. With fewer riffles, higher flows, and generally deeper water conditions in the Coastal Plain it was assumed that flows adequate for a good canoeing experience in the Piedmont and Fall Zone of the North Anna River would also support recreation in the Coastal Plain. The depth and velocity of water, particularly in shallow runs and riffles, are the key factors affecting the experience of a recreational canoeist in these reaches. Therefore, the analysis developed for this evaluation used a frequency analysis of depth and velocity across the individual transect cells measured during the IFIM surveys and extrapolated to other flows of interest. The frequency distributions for selected flows were then compared to the Habitat Suitability Curves of novice and intermediate canoeists (Notebook Tab 10) to assess the flows necessary to provide adequate water depths and velocities through the Piedmont and Fall Zone for canoeing.
IFIM Studies on the North Anna and Pamunkey Rivers DRAFT REPORT 2 March 2009
14
3.2 LAKE ANNA WETLAND AND BOAT DOCK AND RAMP STUDY METHODS Field studies were conducted during the week of 17 September 2007, and 25 September through 27 September 2007 to determine the existing conditions present within the study areas. Five coves within Lake Anna were surveyed for the study (Figure 3-1). The selected coves were associated with the confluence of tributaries entering Lake Anna and were located at the interface between tributary streams and the existing 250.0 ft normal full-pool elevation of Lake Anna. A functionality assessment of boat docks and boat ramps was also conducted as part of the lake study. Since changes in lake elevation have the potential to affect the functionality of existing docks and boat ramps, 11 publicly accessible boat ramps and 15 publicly accessible boat docks on Lake Anna were evaluated. 3.2.1 Purpose of the Lake Studies
The primary purposes of the lake studies were to evaluate the relationship between the lake level and wetland areas in Lake Anna, and assess the functionality of existing boat ramps and docks. This information was then be used to characterize the likelihood of changes from the existing conditions associated with raising the normal full-pool elevation of Lake Anna. 3.2.2 Surface Elevations – LIDAR
Water surface elevation and land area elevations were determined using Light Detection and Ranging (LIDAR). LIDAR is a remote sensing system used to collect topographic data. The processed LIDAR data allowed proposed alterations in water level elevations to be depicted geographically. The areal extent of changes in inundation within the study areas caused by normal full-pool elevation changes were quantified using GIS techniques. Field observations of the vegetation community were combined with the DEM to assign elevation ranges to the wetland communities. Details on LIDAR application and data processing are provided in Tab 14 of the Notebook. 3.2.3 Field Surveys Per the study plan, five coves within Lake Anna were surveyed for the study. The coves were located at the interface between tributary streams and the normal full-pool elevation of Lake Anna and represent a range of topographic characteristics found throughout Lake Anna. Some of the coves studied had steep slopes while others had flatter slopes. The selected coves were located away from the dam in an effort to evaluate areas likely to be most impacted by alterations in the current full pool elevation. Field surveys of 30 transects in five coves were conducted as part of the Lake Anna Reservoir study. A total of 19 transects out of the total 30 transects were assessed for wetland communities, which were characterized as emergent wetlands and forested wetlands. As shown in Figure 3-1 the five coves studied were:

IFIM Studies on the North Anna and Pamunkey Rivers DRAFT REPORT 2 March 2009
15
• Christopher Creek, • Contrary Creek, • Crafton Creek, • Freshwater Creek, and • Goldmine Creek.
Descriptions of the five coves studied are presented in Section 4.2.1 below. 3.2.4 Water Depths Bathymetric surveys of the selected coves were performed to determine the depths of inundation for the wetlands that are currently present within each of the study coves. Transects for the bathymetric surveys were established perpendicular to the shoreline and spaced at 500-ft intervals. Water depths were recorded within the stream channel at five foot intervals along transects. Coordinates for the start and end points of the transects were created in the office prior to conducting the field activities. The survey was conducted on foot or by canoe using a stadia rod to measure water depths. Water depths were recorded within the stream channel at five foot intervals along the transects. In soft bottom streams, the foot of the stadia rod was held touching the substrate to get an accurate depth reading. 3.2.5 Wetland Communities A subset of transects established for the bathymetric surveys were designated to assess the wetland communities. More specifically, these wetland community transects were spaced approximately 1,000 ft apart and sampling occurred at 50 ft intervals along the vegetated portions of the transects. Sampling stations consisted of an area with a 6-ft radius centered on the transect. The transects extended landward to an approximate elevation of 252.0 ft. At each sampling point, observations of plant species present, their distribution, dominance, and condition were recorded. Formal wetland delineations were not conducted; however, the procedures outlined in the 1987 Corps of Engineers Delineation Manual (USACE 1987) were used to identify wetland area within the study areas. Hydrophytic vegetation and wetland hydrology indicators were used to roughly define the boundaries of the observed wetland areas along each wetland transect. A qualitative assessment of plant density was also recorded as part of the study. Measurements of density were recorded as 1 through 5, based upon the Braun-Blanquet method for assessing cover class. A description of the cover class codes is presented in the table below.
IFIM Studies on the North Anna and Pamunkey Rivers DRAFT REPORT 2 March 2009
16
Braun-Blanquet Vegetative Cover Classes
Code Description Cover class
5 Any number of plants covering more than ¾ of the sample site > 75%
4 Any number of plants covering between ½ and ¾ of the sample site 50% - 75%
3 Any number of plants covering ¼ to ½ of the sample site 25% - 50%
2 Any number of plants covering between 1/20 and ¼ of the sample site 5% - 25%
1 Numerous individuals, but cover < 1/20 of the sample site, or scattered with cover up to 1/20 of the sample site
< 5%
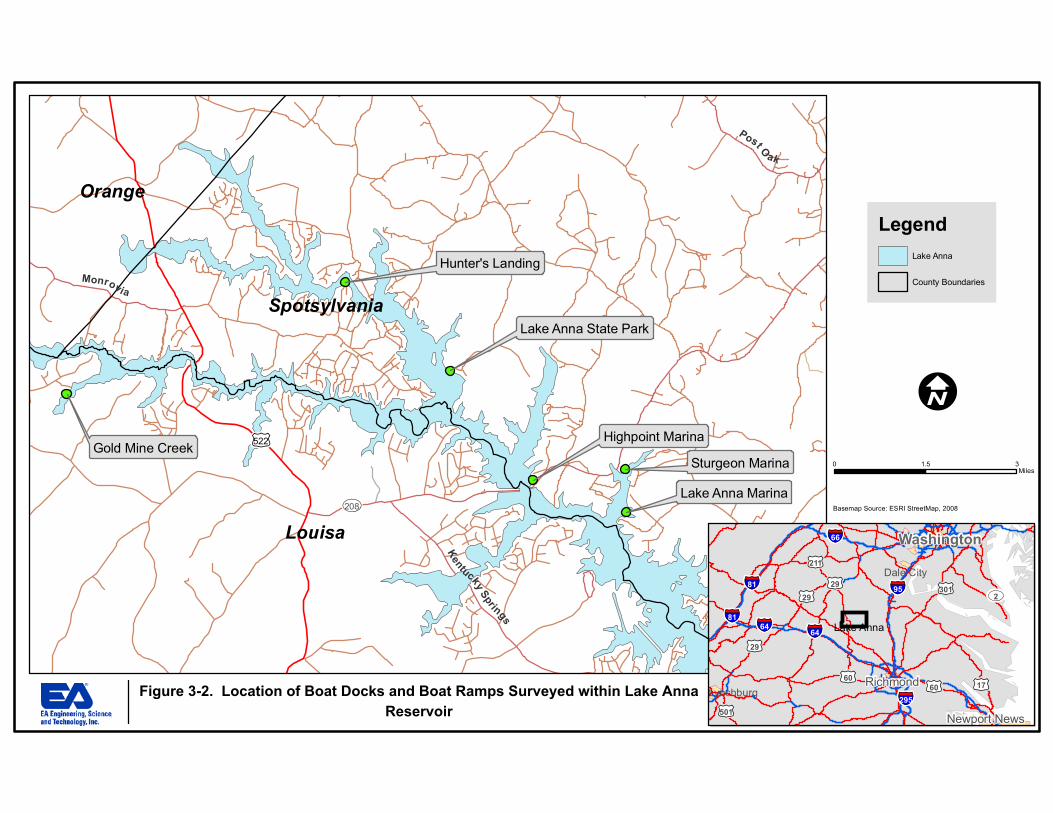
3.2.6 GIS Processes Refined LIDAR elevation survey point files were provided by Dominion for each of the five coves considered in this study. An elevation surface was created by interpolating these ground surface elevation points. The resultant digital elevation model (DEM) was contoured at 0.25 ft intervals to depict areas of each cove that would be inundated at lake levels ranging from 248.0 to 250.25 ft. Wetland communities were identified at each cove at transects spaced approximately 1,000 ft apart. Four to seven transects were studied along the length of each cove. Along each transect, data points were located approximately 50 feet apart. To estimate the area of wetlands within each cove, the DEM was used to determine the range of elevations where known wetland transect points were identified. It was assumed that wetlands are found along the cove at this range of elevation. This approach allowed the estimation of wetland areas within the entire study area based on discrete transect locations. Using the estimated wetland areas and contoured areas of potential inundation, the percentages of surveyed wetlands inundated at lake levels from 248.0 – 250.25 ft were calculated. 3.2.7 Boat Docks and Ramps Survey Eleven publicly accessible boat ramps and 15 publicly accessible boat docks were evaluated as part of the reservoir study (Figure 3-2). Distance measurements were collected using a stadia rod between the lake water surface and the top of the docks. The distance between the lake water surface and the bottom of the skirt boards or existing bumper guards, if present, were also collected. The study was performed to evaluate whether changes in lake elevation would adversely affect boat access from fixed docks.

IFIM Studies on the North Anna and Pamunkey Rivers DRAFT REPORT 2 March 2009
17
Water depth measurements were taken with a stadia rod at the “paved” end of the 11 public boat ramps. The assessment was performed to determine whether trailer tires would extend beyond the limits of the paved ramp surface at lower water elevations,. The water depth at the ends of the boat ramps as a function of reservoir elevation was evaluated to determine the potential for successfully launching boats of the types and sizes typically used in Lake Anna.
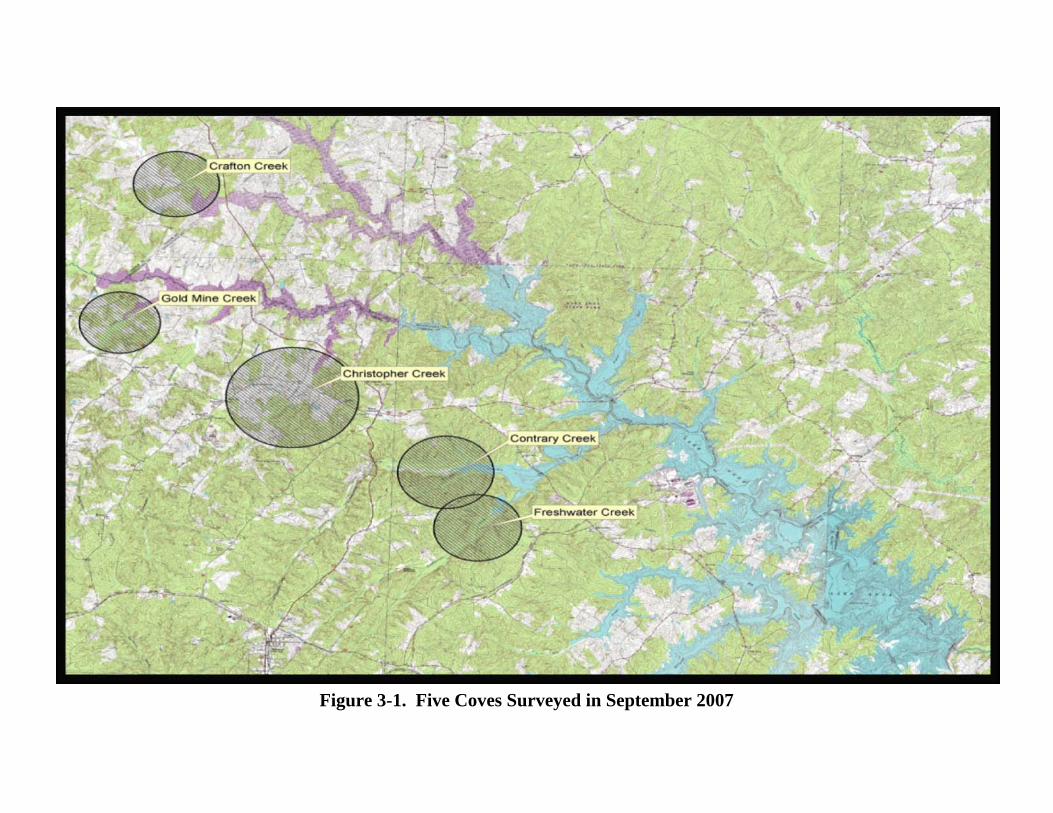
Figure 3-1. Five Coves Surveyed in September 2007
Hunter's Landing
Highpoint MarinaGold Mine Creek
Lake Anna State Park
Lake Anna Marina
Sturgeon Marina
Louisa
Spotsylvania
Orange
£¤522
UV208
Monrovia
PostO
ak
Kentuck
ySpring
s
Legend
Lake Anna
County Boundaries
0 31.5Miles
I
Basemap Source: ESRI StreetMap, 2008
Lake Anna
Washington
Richmond
Newport News
Lynchburg
Dale City
§̈¦64
§̈¦95§̈¦81
§̈¦295
§̈¦66
§̈¦81
§̈¦64
£¤17
£¤301
£¤60
£¤211
£¤29
£¤501
£¤29
£¤60
£¤29
UV2
Figure 3-2. Location of Boat Docks and Boat Ramps Surveyed within Lake Anna
Reservoir
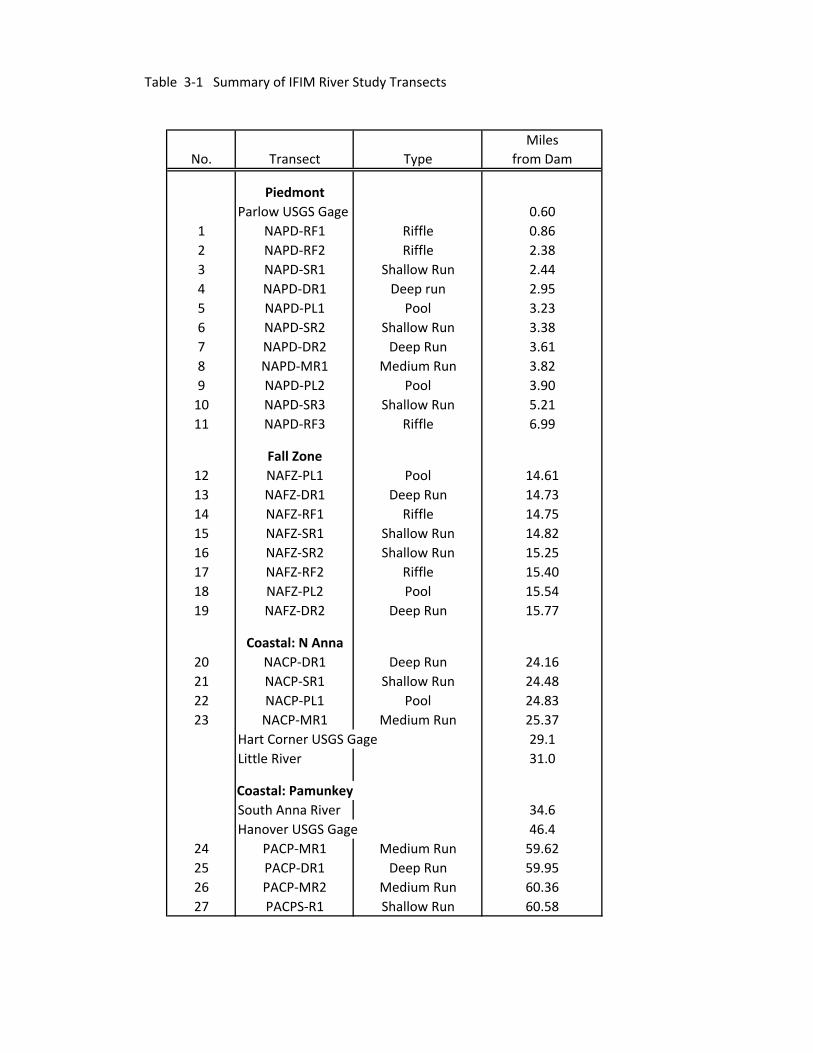
Table 3‐1 Summary of IFIM River Study Transects
MilesNo. Transect Type from Dam
PiedmontParlow USGS Gage 0.60
1 NAPD‐RF1 Riffle 0.862 NAPD‐RF2 Riffle 2.383 NAPD‐SR1 Shallow Run 2.444 NAPD‐DR1 Deep run 2.955 NAPD‐PL1 Pool 3.236 NAPD‐SR2 Shallow Run 3.387 NAPD‐DR2 Deep Run 3.618 NAPD‐MR1 Medium Run 3.829 NAPD‐PL2 Pool 3.9010 NAPD‐SR3 Shallow Run 5.2111 NAPD‐RF3 Riffle 6.99
Fall Zone12 NAFZ‐PL1 Pool 14.6113 NAFZ‐DR1 Deep Run 14.7314 NAFZ‐RF1 Riffle 14.7515 NAFZ‐SR1 Shallow Run 14.8216 NAFZ‐SR2 Shallow Run 15.2517 NAFZ‐RF2 Riffle 15.4018 NAFZ‐PL2 Pool 15.5419 NAFZ‐DR2 Deep Run 15.77
Coastal: N Anna20 NACP‐DR1 Deep Run 24.1621 NACP‐SR1 Shallow Run 24.4822 NACP‐PL1 Pool 24.8323 NACP‐MR1 Medium Run 25.37
Hart Corner USGS Gage 29.1Little River 31.0
Coastal: PamunkeySouth Anna River 34.6Hanover USGS Gage 46.4
24 PACP‐MR1 Medium Run 59.6225 PACP‐DR1 Deep Run 59.9526 PACP‐MR2 Medium Run 60.3627 PACPS‐R1 Shallow Run 60.58

IFIM Studies on the North Anna and Pamunkey Rivers DRAFT REPORT 2 March 2009
18
4. RESULTS
4.1 NORTH ANNA AND PAMUNKEY RIVER STUDIES The section discusses the results of the North Anna and Pamunkey River IFIM program studies. For the three primary scenarios evaluated (existing conditions, EC/MWC at 250.0 ft and EC/MWC at 250.25 ft), the effect on lake elevation and flows at the Lake Anna Dam are presented in Section 4.1.1. PHABSIM simulated effects on the quantity of habitat for key resident species is presented in Section 4.1.2. 4.1.1 Flows at Lake Anna Dam and Reservoir Elevations 4.1.1.1 Flows at Lake Anna Dam North Anna River flows used for the IFIM analysis were based on flows at Lake Anna Dam that were propagated downstream to the 27 IFIM transects by the addition of natural incremental runoff flow. The flows at the Lake Anna Dam were provided by Bechtel’s Lake Anna Reservoir Model (Section 3.1.4). Flows at Lake Anna Dam for existing conditions and the two EC/MWC scenarios are provided in Table 4-1. This table presents the percent-of-time that flows are within specific flow ranges. Attention has been placed on the percent-of-time that flows are at 20 cfs, the flow that is associated with the reservoir elevation falling to or below 248 ft during drought conditions. The resource agencies would like to minimize any increase in the occurrence of 20 cfs flows. Between the existing condition and the EC/MWC at 250.0 ft scenario, the occurrence of 20 cfs flow increases from 4.6 percent to 6.3 percent of time. Raising the reservoir elevation to 250.25 ft with EC/MWC decreases the occurrence of 20 cfs to 5.5 percent of time (Table 4-1). Frequency distributions of dam releases by month for the October 1979 to September 2007 operating period are provided in Workbook Tab 3 (Tables 2, 3, and 5) for each of the three scenarios. These tables illustrate the seasonal occurrence of the minimum 40 cfs release flows when the reservoir elevation is below 250.0 ft. For existing conditions, the occurrence of 40 cfs flow increases from approximately 25 percent of time in May to 75 percent of time in August and September. A similar seasonal pattern is present for the two EC/MWC scenarios. The effect of adding Unit 3 with the hybrid cooling towers is indicated by the decrease in the annual mean flow at the dam. The annual mean flow decreases from 278.3 cfs for the existing condition, to 257-258 cfs for the two EC/MWC scenarios. 4.1.1.2 Lake Anna Elevations Frequency distributions of Lake Anna elevations for existing conditions and the two Unit 3 EC/MWC scenarios are provided in Table 4-2. In Bechtel’s Lake Anna Reservoir model, when elevations are above 250.0 ft a constant 250.1 elevation is used, and when above 250.25 ft a constant elevation of 250.35 ft is used. The reservoir elevation is below 250.0 ft approximately 35 percent of time for existing conditions, and 40 percent of time for EC/MWC at 250.0 ft. However, for the EC/MWC at 250.25 ft scenario, the percent of time the reservoir is below a 250.0 ft elevation decreases to approximately 30 percent (Table 4-2).
IFIM Studies on the North Anna and Pamunkey Rivers DRAFT REPORT 2 March 2009
19
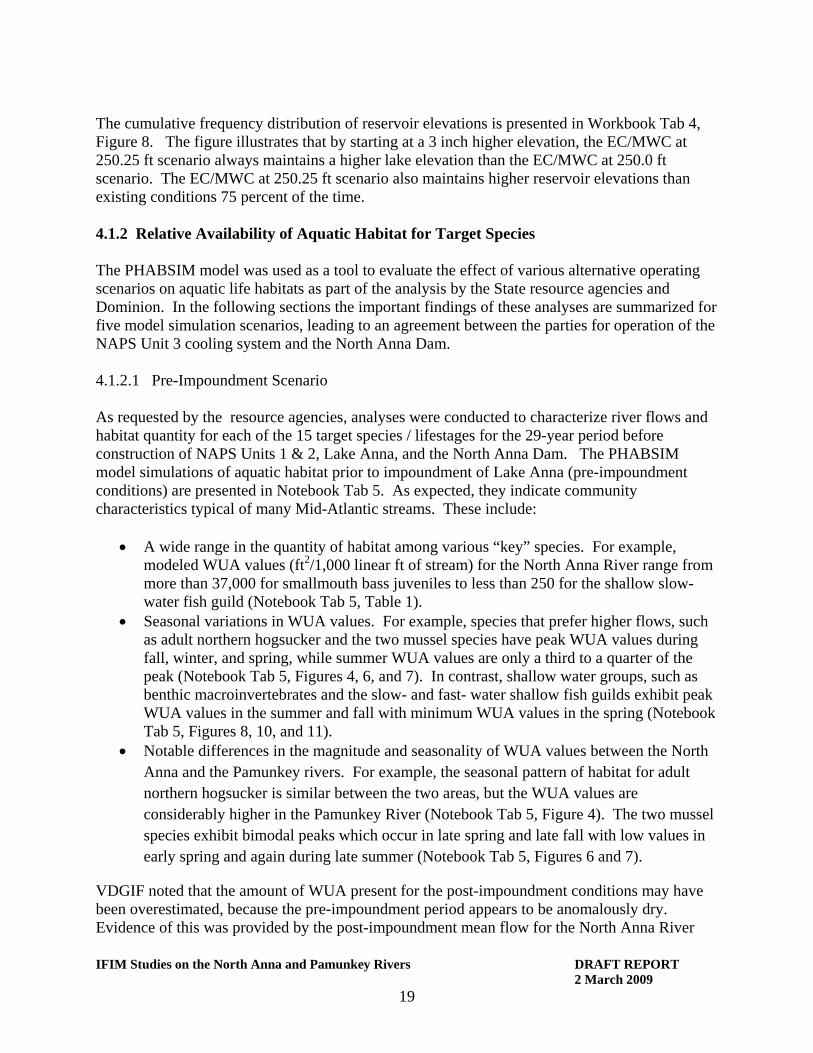
The cumulative frequency distribution of reservoir elevations is presented in Workbook Tab 4, Figure 8. The figure illustrates that by starting at a 3 inch higher elevation, the EC/MWC at 250.25 ft scenario always maintains a higher lake elevation than the EC/MWC at 250.0 ft scenario. The EC/MWC at 250.25 ft scenario also maintains higher reservoir elevations than existing conditions 75 percent of the time. 4.1.2 Relative Availability of Aquatic Habitat for Target Species The PHABSIM model was used as a tool to evaluate the effect of various alternative operating scenarios on aquatic life habitats as part of the analysis by the State resource agencies and Dominion. In the following sections the important findings of these analyses are summarized for five model simulation scenarios, leading to an agreement between the parties for operation of the NAPS Unit 3 cooling system and the North Anna Dam. 4.1.2.1 Pre-Impoundment Scenario As requested by the resource agencies, analyses were conducted to characterize river flows and habitat quantity for each of the 15 target species / lifestages for the 29-year period before construction of NAPS Units 1 & 2, Lake Anna, and the North Anna Dam. The PHABSIM model simulations of aquatic habitat prior to impoundment of Lake Anna (pre-impoundment conditions) are presented in Notebook Tab 5. As expected, they indicate community characteristics typical of many Mid-Atlantic streams. These include:
• A wide range in the quantity of habitat among various “key” species. For example, modeled WUA values (ft2/1,000 linear ft of stream) for the North Anna River range from more than 37,000 for smallmouth bass juveniles to less than 250 for the shallow slow-water fish guild (Notebook Tab 5, Table 1).
• Seasonal variations in WUA values. For example, species that prefer higher flows, such as adult northern hogsucker and the two mussel species have peak WUA values during fall, winter, and spring, while summer WUA values are only a third to a quarter of the peak (Notebook Tab 5, Figures 4, 6, and 7). In contrast, shallow water groups, such as benthic macroinvertebrates and the slow- and fast- water shallow fish guilds exhibit peak WUA values in the summer and fall with minimum WUA values in the spring (Notebook Tab 5, Figures 8, 10, and 11).
• Notable differences in the magnitude and seasonality of WUA values between the North Anna and the Pamunkey rivers. For example, the seasonal pattern of habitat for adult northern hogsucker is similar between the two areas, but the WUA values are considerably higher in the Pamunkey River (Notebook Tab 5, Figure 4). The two mussel species exhibit bimodal peaks which occur in late spring and late fall with low values in early spring and again during late summer (Notebook Tab 5, Figures 6 and 7).
VDGIF noted that the amount of WUA present for the post-impoundment conditions may have been overestimated, because the pre-impoundment period appears to be anomalously dry. Evidence of this was provided by the post-impoundment mean flow for the North Anna River
IFIM Studies on the North Anna and Pamunkey Rivers DRAFT REPORT 2 March 2009
20
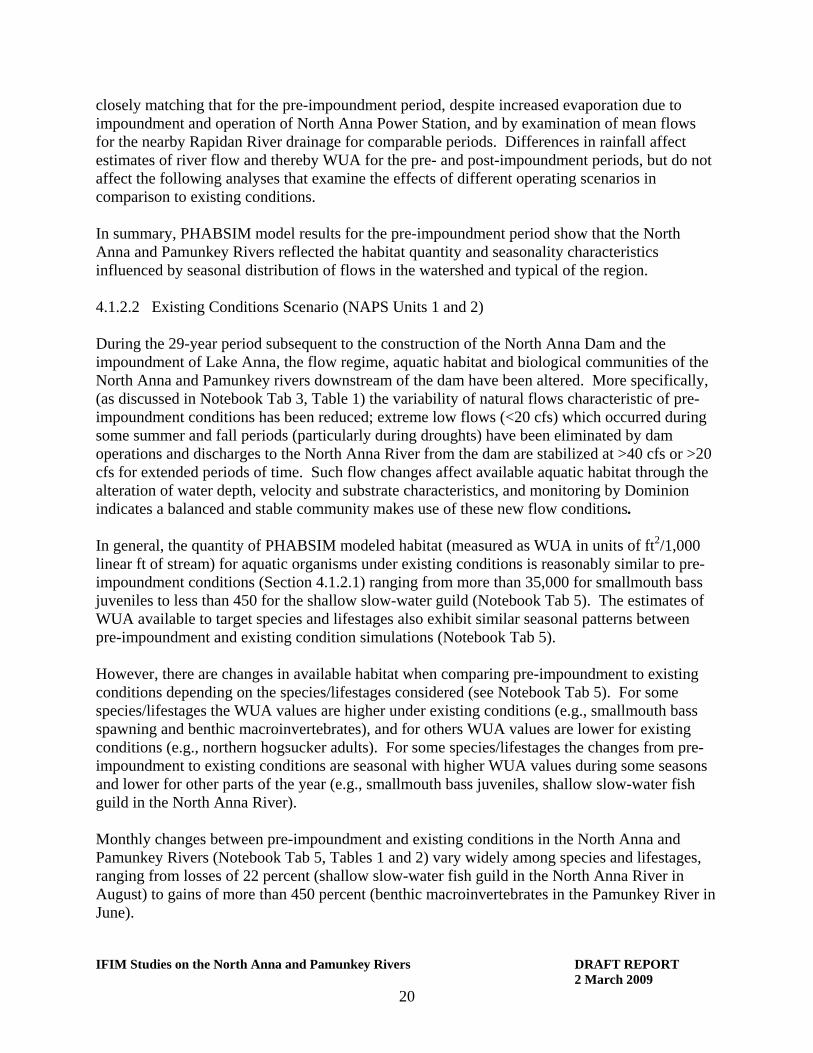
closely matching that for the pre-impoundment period, despite increased evaporation due to impoundment and operation of North Anna Power Station, and by examination of mean flows for the nearby Rapidan River drainage for comparable periods. Differences in rainfall affect estimates of river flow and thereby WUA for the pre- and post-impoundment periods, but do not affect the following analyses that examine the effects of different operating scenarios in comparison to existing conditions. In summary, PHABSIM model results for the pre-impoundment period show that the North Anna and Pamunkey Rivers reflected the habitat quantity and seasonality characteristics influenced by seasonal distribution of flows in the watershed and typical of the region. 4.1.2.2 Existing Conditions Scenario (NAPS Units 1 and 2) During the 29-year period subsequent to the construction of the North Anna Dam and the impoundment of Lake Anna, the flow regime, aquatic habitat and biological communities of the North Anna and Pamunkey rivers downstream of the dam have been altered. More specifically, (as discussed in Notebook Tab 3, Table 1) the variability of natural flows characteristic of pre-impoundment conditions has been reduced; extreme low flows (<20 cfs) which occurred during some summer and fall periods (particularly during droughts) have been eliminated by dam operations and discharges to the North Anna River from the dam are stabilized at >40 cfs or >20 cfs for extended periods of time. Such flow changes affect available aquatic habitat through the alteration of water depth, velocity and substrate characteristics, and monitoring by Dominion indicates a balanced and stable community makes use of these new flow conditions. In general, the quantity of PHABSIM modeled habitat (measured as WUA in units of ft2/1,000 linear ft of stream) for aquatic organisms under existing conditions is reasonably similar to pre-impoundment conditions (Section 4.1.2.1) ranging from more than 35,000 for smallmouth bass juveniles to less than 450 for the shallow slow-water guild (Notebook Tab 5). The estimates of WUA available to target species and lifestages also exhibit similar seasonal patterns between pre-impoundment and existing condition simulations (Notebook Tab 5). However, there are changes in available habitat when comparing pre-impoundment to existing conditions depending on the species/lifestages considered (see Notebook Tab 5). For some species/lifestages the WUA values are higher under existing conditions (e.g., smallmouth bass spawning and benthic macroinvertebrates), and for others WUA values are lower for existing conditions (e.g., northern hogsucker adults). For some species/lifestages the changes from pre-impoundment to existing conditions are seasonal with higher WUA values during some seasons and lower for other parts of the year (e.g., smallmouth bass juveniles, shallow slow-water fish guild in the North Anna River). Monthly changes between pre-impoundment and existing conditions in the North Anna and Pamunkey Rivers (Notebook Tab 5, Tables 1 and 2) vary widely among species and lifestages, ranging from losses of 22 percent (shallow slow-water fish guild in the North Anna River in August) to gains of more than 450 percent (benthic macroinvertebrates in the Pamunkey River in June).
IFIM Studies on the North Anna and Pamunkey Rivers DRAFT REPORT 2 March 2009
21
Given the diversity and range of changes (both positive and negative) in aquatic habitat in the North Anna and Pamunkey Rivers that are estimated to have occurred following impoundment of Lake Anna, the resource agencies and Dominion agreed that the “existing condition” provided the most appropriate baseline against which to evaluate proposed alternatives for the operation of proposed Unit 3 cooling towers and the Lake Anna Dam. Another key decision was to focus on a subset of the initial species / lifestages list where potentially negative habitat effects might be seen. Following the team’s initial assessment of pre-impoundment and existing habitat conditions, VDGIF and VDEQ recommended that further evaluations of Unit 3 and North Anna Dam operating scenarios be focused on several species. Note that all subsequent model simulations were run for the complete initial list of 15 target species, and those results are summarized in tables and figures presented in the Notebook. However, based upon extensive interaction with VDGIF and VDEQ staff, the discussion that follows focuses primarily on the effects of the proposed Unit 3 operating scenarios on the following selected species and habitats:
• Habitat for adult and spawning northern hogsucker • Habitat for freshwater mussels, L. radiata and E. complanata • Coastal Plain habitat for spawning and juvenile American shad
4.1.2.3 Initial Dominion Proposal Scenario (EC/MWC at 250.0 ft) Dominion initially proposed to manage water levels and discharges from Lake Anna using the existing North Anna Dam operating rules:
• maintain a year-around target water level for Lake Anna at 250.0 ft; • discharge at a minimum 40 cfs when Lake Anna is below 250.0 ft; • discharge at a minimum 20 cfs when Lake Anna is below 248.0 ft; and • with lake level at 250.0 ft or above, proposed Unit 3 would operate in the energy
conservation mode (EC); at lake elevations below 250.0 ft Unit 3 would operate in maximum water conservation mode (MWC).
Under this EC/MWC at 250.0 ft. scenario, PHABSIM model simulations were used to estimate WUA values and evaluate operating scenario effects as percent change in WUA relative to the existing condition (Section 4.1.2.2). Flows in the North Anna and Pamunkey rivers associated with the EC/MWC at 250.0 ft scenario result in seasonal habitat gains and losses depending on the species and reach. Numerous evaluations were made by the team to assess changes in the quantity of habitat to species and lifestages under different temporal (annual, seasonal, and monthly) and spatial (individual and composite North Anna and Pamunkey reaches) conditions (see Figures 4-1 to 4-6 and Notebook Tabs 7 and 8). Key observations from these comparisons to existing conditions are summarized below.
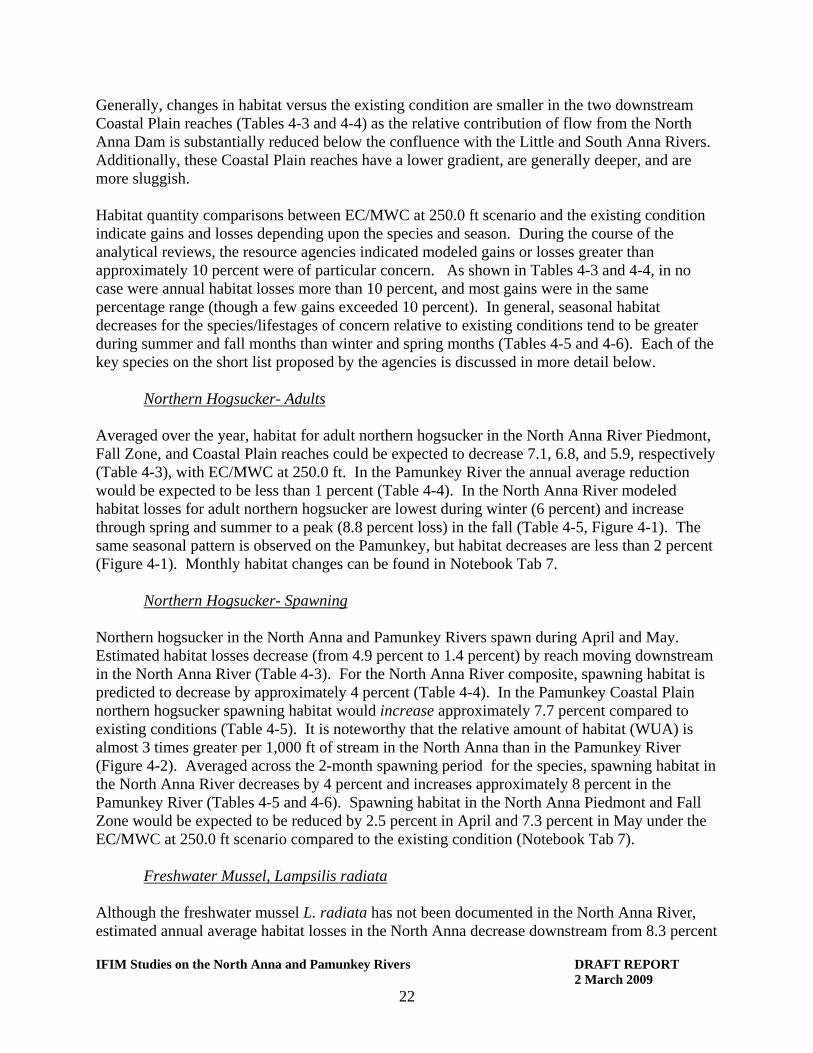
IFIM Studies on the North Anna and Pamunkey Rivers DRAFT REPORT 2 March 2009
22
Generally, changes in habitat versus the existing condition are smaller in the two downstream Coastal Plain reaches (Tables 4-3 and 4-4) as the relative contribution of flow from the North Anna Dam is substantially reduced below the confluence with the Little and South Anna Rivers. Additionally, these Coastal Plain reaches have a lower gradient, are generally deeper, and are more sluggish. Habitat quantity comparisons between EC/MWC at 250.0 ft scenario and the existing condition indicate gains and losses depending upon the species and season. During the course of the analytical reviews, the resource agencies indicated modeled gains or losses greater than approximately 10 percent were of particular concern. As shown in Tables 4-3 and 4-4, in no case were annual habitat losses more than 10 percent, and most gains were in the same percentage range (though a few gains exceeded 10 percent). In general, seasonal habitat decreases for the species/lifestages of concern relative to existing conditions tend to be greater during summer and fall months than winter and spring months (Tables 4-5 and 4-6). Each of the key species on the short list proposed by the agencies is discussed in more detail below.
Northern Hogsucker- Adults Averaged over the year, habitat for adult northern hogsucker in the North Anna River Piedmont, Fall Zone, and Coastal Plain reaches could be expected to decrease 7.1, 6.8, and 5.9, respectively (Table 4-3), with EC/MWC at 250.0 ft. In the Pamunkey River the annual average reduction would be expected to be less than 1 percent (Table 4-4). In the North Anna River modeled habitat losses for adult northern hogsucker are lowest during winter (6 percent) and increase through spring and summer to a peak (8.8 percent loss) in the fall (Table 4-5, Figure 4-1). The same seasonal pattern is observed on the Pamunkey, but habitat decreases are less than 2 percent (Figure 4-1). Monthly habitat changes can be found in Notebook Tab 7.
Northern Hogsucker- Spawning
Northern hogsucker in the North Anna and Pamunkey Rivers spawn during April and May. Estimated habitat losses decrease (from 4.9 percent to 1.4 percent) by reach moving downstream in the North Anna River (Table 4-3). For the North Anna River composite, spawning habitat is predicted to decrease by approximately 4 percent (Table 4-4). In the Pamunkey Coastal Plain northern hogsucker spawning habitat would increase approximately 7.7 percent compared to existing conditions (Table 4-5). It is noteworthy that the relative amount of habitat (WUA) is almost 3 times greater per 1,000 ft of stream in the North Anna than in the Pamunkey River (Figure 4-2). Averaged across the 2-month spawning period for the species, spawning habitat in the North Anna River decreases by 4 percent and increases approximately 8 percent in the Pamunkey River (Tables 4-5 and 4-6). Spawning habitat in the North Anna Piedmont and Fall Zone would be expected to be reduced by 2.5 percent in April and 7.3 percent in May under the EC/MWC at 250.0 ft scenario compared to the existing condition (Notebook Tab 7).
Freshwater Mussel, Lampsilis radiata
Although the freshwater mussel L. radiata has not been documented in the North Anna River, estimated annual average habitat losses in the North Anna decrease downstream from 8.3 percent
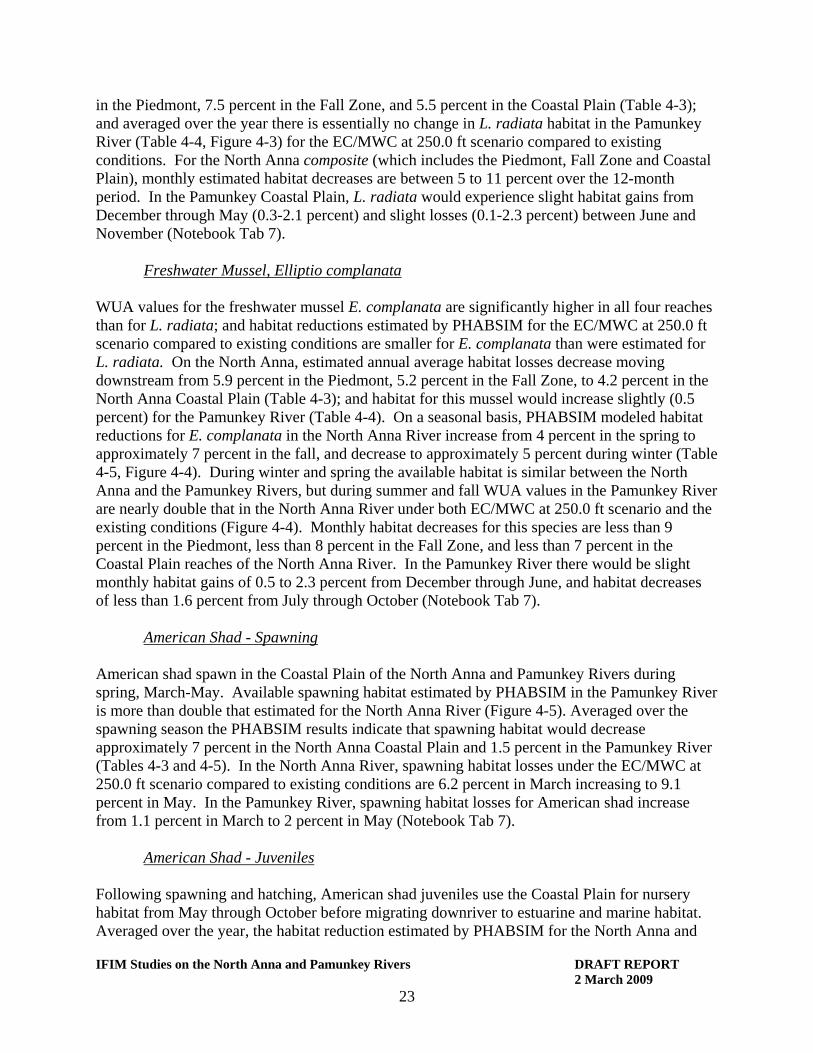
IFIM Studies on the North Anna and Pamunkey Rivers DRAFT REPORT 2 March 2009
23
in the Piedmont, 7.5 percent in the Fall Zone, and 5.5 percent in the Coastal Plain (Table 4-3); and averaged over the year there is essentially no change in L. radiata habitat in the Pamunkey River (Table 4-4, Figure 4-3) for the EC/MWC at 250.0 ft scenario compared to existing conditions. For the North Anna composite (which includes the Piedmont, Fall Zone and Coastal Plain), monthly estimated habitat decreases are between 5 to 11 percent over the 12-month period. In the Pamunkey Coastal Plain, L. radiata would experience slight habitat gains from December through May (0.3-2.1 percent) and slight losses (0.1-2.3 percent) between June and November (Notebook Tab 7).
Freshwater Mussel, Elliptio complanata
WUA values for the freshwater mussel E. complanata are significantly higher in all four reaches than for L. radiata; and habitat reductions estimated by PHABSIM for the EC/MWC at 250.0 ft scenario compared to existing conditions are smaller for E. complanata than were estimated for L. radiata. On the North Anna, estimated annual average habitat losses decrease moving downstream from 5.9 percent in the Piedmont, 5.2 percent in the Fall Zone, to 4.2 percent in the North Anna Coastal Plain (Table 4-3); and habitat for this mussel would increase slightly (0.5 percent) for the Pamunkey River (Table 4-4). On a seasonal basis, PHABSIM modeled habitat reductions for E. complanata in the North Anna River increase from 4 percent in the spring to approximately 7 percent in the fall, and decrease to approximately 5 percent during winter (Table 4-5, Figure 4-4). During winter and spring the available habitat is similar between the North Anna and the Pamunkey Rivers, but during summer and fall WUA values in the Pamunkey River are nearly double that in the North Anna River under both EC/MWC at 250.0 ft scenario and the existing conditions (Figure 4-4). Monthly habitat decreases for this species are less than 9 percent in the Piedmont, less than 8 percent in the Fall Zone, and less than 7 percent in the Coastal Plain reaches of the North Anna River. In the Pamunkey River there would be slight monthly habitat gains of 0.5 to 2.3 percent from December through June, and habitat decreases of less than 1.6 percent from July through October (Notebook Tab 7).
American Shad - Spawning American shad spawn in the Coastal Plain of the North Anna and Pamunkey Rivers during spring, March-May. Available spawning habitat estimated by PHABSIM in the Pamunkey River is more than double that estimated for the North Anna River (Figure 4-5). Averaged over the spawning season the PHABSIM results indicate that spawning habitat would decrease approximately 7 percent in the North Anna Coastal Plain and 1.5 percent in the Pamunkey River (Tables 4-3 and 4-5). In the North Anna River, spawning habitat losses under the EC/MWC at 250.0 ft scenario compared to existing conditions are 6.2 percent in March increasing to 9.1 percent in May. In the Pamunkey River, spawning habitat losses for American shad increase from 1.1 percent in March to 2 percent in May (Notebook Tab 7).
American Shad - Juveniles
Following spawning and hatching, American shad juveniles use the Coastal Plain for nursery habitat from May through October before migrating downriver to estuarine and marine habitat. Averaged over the year, the habitat reduction estimated by PHABSIM for the North Anna and

IFIM Studies on the North Anna and Pamunkey Rivers DRAFT REPORT 2 March 2009
24
Pamunkey Coastal Plains would be 2 percent and 0.2 percent, respectively (Table 4-3 and 4-4). On a seasonal basis, the reduction in juvenile American shad habitat in the North Anna Coastal Plain increases from 0.6 percent in the spring to 2.6 percent in the fall (Table 4-5, Figure 4-6). In the Pamunkey River the seasonal change in habitat is minimal, beginning as an increase of 0.2 percent in spring, no difference in summer, and a 0.6 percent reduction in the fall (Table 4-6). 4.1.2.4 Interim Proposal Scenario (MWC at 250.25 ft Seasonally) After detailed review of the PHABSIM simulation data for Dominion’s proposed EC/MWC at 250.0 ft scenario, VDEQ and VDGIF proposed an alternative operating scenario which would raise the North Anna Lake level seasonally by 3 inches to 250.25 ft, recharging the lake in March and discharging in July with a target lake level of 250.0 ft from July through the following February. Between February and July, Unit 3 would operate in MWC mode whenever the discharge from the Lake Anna Dam is below 177 cfs (the operating capacity of the two hydro units at the dam). The increased frequency of MWC operation in this proposal during the late winter to early summer period was intended to reduce evaporative cooling tower losses, enhance the ability to store water for lake level management, and increase downstream aquatic habitat. When the discharge from Lake Anna exceeds 177 cfs the Unit 3 cooling system would operate in EC mode. It was anticipated that the MWC at 250.25 ft seasonal scenario would reduce the loss of habitat for several key species predicted by the PHABSIM simulations for the EC/MWC at 250.0 ft scenario compared to existing conditions. However, the simulations for this scenario (Notebook Tab 13) produced unanticipated results relative to habitat gains and losses compared to the existing conditions. More specifically, a number of the target species (including the selected focus species) showed habitat increases during the period when Lake Anna was discharged in mid- summer, but also experienced large offsetting losses during the spring when water was being retained to raise the lake elevation to 250.25 ft. In addition, significant increases in the frequency of MWC operation during the spring was estimated to result in additional energy and reduced efficiency costs of several million dollars annually to operate Unit 3. This seasonal lake increase scenario was therefore dropped from further consideration. 4.1.2.5 Alternative Operating Scenario (EC/MWC at 250.25 ft year round) Given the PHABSIM results for the EC/MWC at 250.0 ft scenario, and the MWC at 250.25 ft seasonal scenario (Section 4.1.2.4), an alternative scenario proposed by Dominion employing the EC/MWC operating mode, and an increase in the normal lake elevation to 250.25 ft was investigated. Through discussion among the team, the alternative scenario detailed below emerged as the basis of an agreement between Dominion, VDEQ, VDGIF, and VDCR on operating the Unit 3 cooling water system and reservoir operating rules, if construction of Unit 3 goes forward. This alternative scenario has the following reservoir and cooling system conditions:
• new target elevation for Lake Anna of 250.25 ft year around as long as inflow to the Lake Anna watershed is adequate to support this level;

IFIM Studies on the North Anna and Pamunkey Rivers DRAFT REPORT 2 March 2009
25
• when Lake Anna is above 250.25 ft, discharge from the dam will be adjusted as needed to return to 250.25 ft;
• when Lake Anna is below 250.25 ft and at or above 248.0 ft, discharge at the dam will be a minimum of 40 cfs;
• below 248.0 ft the minimum discharge will be 20 cfs; • the Unit 3 cooling system will operate in the EC mode when Lake Anna is at 250.0 ft or
above, and will operate in the MWC mode when the lake is below 250.0 ft; and • releases to provide recreational paddling opportunities downstream of the dam will be
provided during June and/or July when Lake Anna is above 250.0 ft. This scenario reduces the frequency that flows at the North Anna Dam that are below 40 cfs , and reduces the frequency Lake Anna elevations that fall below 250.0 ft in comparison to the EC/MWC at 250.0 ft scenario. It further protects downstream habitats, and enhances opportunities for recreational canoeing downstream. Similar to other scenarios, the alternative 250.25 ft year-around scenario would result in both habitat gains and losses in the North Anna River depending on the species, lifestage, and season. On an annual basis, habitat losses versus existing conditions are less than 10 percent in the North Anna, and some gains exceed 15 percent (Table 4-3). In the Pamunkey, slight gains are predicted for most species. On a seasonal basis, predicted habitat losses or gains are less than 11 percent compared to existing conditions and generally less than 8 percent (Table 4-5). In the Pamunkey River habitat gains greatly exceed habitat losses, which are less than 2 percent (Table 4-6). In general, the differences between the alternative scenario and existing conditions are virtually the same as the differences between the EC/MWC at 250.0 ft scenario and existing conditions (Tables 4-3 to 4-6; Figures 4-1 to 4-6; Notebook Tabs 6 and 7). The percent increase or decrease for both of the EC/MWC scenarios relative to each other is typically less than one percent for any of the key species of concern. While the overall habitat provided by the alternative scenario for the key species is not significantly different compared to the initial Dominion proposal (EC/MWC at 250.0 ft scenario), the additional 3 inches of water storage in Lake Anna proposed in the alternative scenario would provide several recognized benefits:
• preserves higher lake levels for a greater proportion of the year, • better protects downstream aquatic habitat, particularly during dry periods, and • more opportunities to enhance recreational paddling downstream in the North Anna River
(Section 4.1.3). 4.1.3 Analysis of Flows for Recreational Paddling The following discussion assesses flows in the North Anna River necessary to support novice and intermediate recreational canoeing. The detailed evaluation developed in consultation with VDCR is presented in Notebook Tab 10, and is summarized here.
IFIM Studies on the North Anna and Pamunkey Rivers DRAFT REPORT 2 March 2009
26
A frequency analysis for water velocity was performed for each transect in the Piedmont and Fall Zone of the North Anna for comparison to the canoeing HSCs. The highest preference level for novice canoeists occurs between 0.5 ft/sec and 3 ft/sec (fps); for intermediate canoeist the velocity range most preferred is from 4-8 fps (Notebook Tab 10, Figure 5).
• The average velocities at most riffle and shallow run transects in the Piedmont are generally within the range preferred by novice canoeists. With the exception of one riffle, simulated velocities in excess of 3 fps occur in fewer than 20 percent of the transect cells and are not predicted to occur until flows exceeded 650 cfs. Preferred velocities for intermediate canoeists (4-8 fps) were estimated to occur even less frequently.
• In the Fall Zone, modeled velocities in excess of 3 fps occurred 10-20 percent of the time and were not observed unless flows exceeded 450 cfs; which is equivalent to 1.0 ft on the Randy Carter (RC) gage (Notebook Tab 9, Table 1). The average velocity is generally within the range preferred by novice canoeists. Preferred velocities for intermediate canoeists (4-8 fps) were estimated to be in the upper 10-20 percentile of flows only when flows exceeded 800 cfs. Preferred velocities for intermediate canoeists occur more frequently in the Fall Zone than in the Piedmont, but velocities in excess of 4 fps are still infrequent.
Although water velocity is the key factor affecting a canoeists’ preference in the analysis of WUA values, the satisfaction level for recreational canoeists of any skill level is perhaps more strongly affected by having adequate water depth to negotiate riffles and shallow reaches of the river with a minimum frequency of scraping, “bottoming out”, or the necessity to frequently exit the canoe and drag over rocks, ledges, and sand bars. Consequently, further analyses focused on the available water depths through riffles and shallow runs as a function of river flow in the Piedmont and Fall Zone. A frequency analysis of water depth in all riffle and shallow run transect cells was compared to the canoeing depth HSC. It was assumed, based on the HSCs (Notebook Tab 10, Figure 5), that water depths adequate for most novice and intermediate canoeists needed to be 1.5 ft or greater. When stream flows were 50 cfs through the Piedmont, approximately 55 percent of the riffle and shallow transect cells had water depths exceeding 1.5 ft (Notebook Tab 10, Figure 17); and 25 percent of the transect cells exceeded 2-ft water depth. At 100 cfs stream flow, approximately 65 percent of the riffle and shallow run transect cells exceeded 1.5-ft water depth; and 39 percent of the transect cells exceeded 2-ft water depth. At 200 cfs stream flows through the Piedmont, approximately 77 percent of the transect cells had water depths greater than 1.5 ft; and 59 percent of the transect cells exceeded 2 ft depth of water. When stream flows were 50 cfs through the Fall Zone, only 8.2 percent of the riffle and shallow run cells exceeded 1.5-ft water depth (Notebook Tab 10); at 200 cfs stream flows, approximately 43 percent of the transect cells had water depths greater than 1.5 ft, but only 14 percent of transect cells exceeded 2-ft water depth, the depth at which the HSC reaches a maximum preference index of 1.0.
IFIM Studies on the North Anna and Pamunkey Rivers DRAFT REPORT 2 March 2009
27
The water depths in the Fall Zone were more limiting for canoeing than in the Piedmont, particularly for novice paddlers. In the Piedmont, the depth distribution would indicate that even at 50 cfs a significant portion (55 percent) of the cross-section of riffles and shallow runs would provide water at least 1.5 ft deep. In contrast, most paddlers using the Fall Zone would require approximately 200 cfs to find more than 42 percent of the riffle and shallow run cross-sections generally passable with 1.5 ft of water. These findings are consistent with the experience of the IFIM study reconnaissance team, and EA’s survey crews that planned and performed the IFIM transect surveys using canoes under low-, mid-, and high-flow river conditions (approximately 60 cfs, 190 cfs, and 430 cfs, respectively). During the low flow survey the crews experienced frequent scraping and found it necessary to drag canoes through extensive portions of shallow runs and most riffles. At the mid-flow, scraping was infrequent and most shallows were readily paddled. The Rock Garden, a unique reach on the North Anna River, consists of approximately 1.1 miles of riffle and run habitat accentuated by complex channel morphology and hydraulics and was of particular interest to VDCR. The gradient (slope) through this reach is considerably greater than anywhere else on the North Anna River with an elevation drop of approximately 50 ft. High flows through this drop generate higher velocities than elsewhere in the North Anna and associated hydraulic features that are attractive to more experienced paddlers using “squirt boats”. At low flows, shallow water, ledges, large cobble, and boulders make this reach virtually impassable and canoes must be carried through to the Fall Pool at the bottom of the reach. No study transects were established in the Rock Garden due to access and safety issues; therefore, no velocity, depth, and WUA data specific to this 1.1-mile segment are available. The closest “public” access above the Rock Garden is at the Route 601 bridge (Hewlett Road, Butler’s Ford Bridge) in Hanover County via access granted and maintained by a private landowner. A Randy Carter (RC) type staff gage for boating (Notebook Tab 9) has been painted on a bridge pier at this access point. Several anecdotal reports describe paddling conditions relative to water level referenced to the RC gage. A trip report (December 2005) on the Coastal Canoeists website (http://www.coastals.org/forum) reported that at the 1-ft mark on the RC gage, “Most of the rocks were hidden…though a bit scrapy.” The property owner of the access at Butler’s Ford Bridge indicated that the number of kayakers using this access increases when water levels on the RC gage are above the 1-ft mark which equates to approximately 456 cfs (Notebook Tab 9: Table 1). Ed Grove (Classic Virginia Rivers: A Paddlers Guide to Premier Whitewater and Scenic Float Trips in the Old Dominion. 1992) reports that 0.25 ft (approximately 90-95 cfs) on the RC gage is the minimum runnable water level. H. Robert Corbett (Virginia Whitewater. A Paddler’s Guide to the Rivers of Virginia. 1988) also indicates that the RC gage at the Route 601 bridge appears to be a little low; that is, “canoe zero” (the lowest level at which the river can be run without getting out of the boat) is above the “0” level mark on the RC gage. Typically, the “0” mark of a RC gage is painted at the canoe zero water level; “0” on the Butler’s Ford RC gage equates to approximately 41 cfs. EA’s analysis of transect depth frequencies indicates that canoe zero for the Fall Zone is more likely in the range of 0.2-0.3 ft on the RC gage (approximately 80-109 cfs), consistent with observations of Grove (1992) and Corbett (1988).

IFIM Studies on the North Anna and Pamunkey Rivers DRAFT REPORT 2 March 2009
28
Based on these analyses, VDCR requested that, with construction and operation of Unit 3, Dominion provide recreational releases of 177 cfs from the North Anna Dam for one day each weekend during June and July when Lake Anna water elevations are above 250.0 ft. An analysis of the lag time for a change in flow to travel from the dam to the Fall Zone canoe access was performed to evaluate how the requested recreational releases could be implemented (Notebook Tab 10). For near peak flows associated with a recreational release at the dam to reach the Route 601 access for a float trip beginning at 8:00 AM, it is estimated that discharge from the North Anna Dam would need to be increased from 40 cfs and maintained at 200 cfs for approximately 17 hours. For example, to support a 12-hr recreational flow event on a Saturday (8:00 AM - 8:00 PM) in June when the normal discharge at the dam is 40 cfs, flows from North Anna Dam would be increased and maintained at 200 cfs from 2:00 PM Friday afternoon to 7:00 AM Saturday morning. 4.2 LAKE ANNA STUDIES Studies were conducted to evaluate the relationship between the lake level and wetland areas in Lake Anna, and assess the functionality of existing boat ramps and docks. This information was then used to characterize the likelihood of changes in wetland inundation frequencies from the existing conditions associated with raising the normal full-pool elevation of Lake Anna. 4.2.1 Wetland Community Survey Wetland communities were assessed within five coves . The number of transects surveyed within each of the coves and the wetland areas observed are presented in Notebook Tab 14. Wetland areas identified at the coves were characterized as emergent wetlands and forested wetlands. The majority of the wetlands observed were concentrated at the lower ends of the coves, with the exception of Goldmine Creek. At Goldmine Creek, wetlands were observed within each of the transects evaluated. The slope of banks within the study areas varied from steep to relatively shallow, typical of the coves and tributaries throughout the lake. The coves with steep banks did not support wetlands within the defined study area, while the coves with flatter slopes were more likely to support wetland communities. The emergent wetland communities present were dominated by native species adapted to wetland conditions. Soft rush (Juncus effusus), rice cutgrass (Leersia oryzoides), clearweed (Pilea pumila), spotted touch-me-not (Impatiens capensis), nutsedge (Cyperus esculentus), Pennsylvania smartweed (Polygonum pensylvanicum), broadleaf cattail (Typha latifolia), and lesser sparganium (Sparganium americanum) were the dominant plant species observed within the emergent wetland community. The emergent wetlands were typically adjacent to the tributary or cove and constituted fringe wetlands that experience periodic changes in depth and frequency of inundation. Scrub/shrub wetlands were observed typically adjacent to emergent wetlands. The dominant plant species within the scrub/shrub wetlands included speckled alder (Alnus rugosa) and common greenbrier (Smilax rotundifolia). These areas included high and low marsh and appeared to be healthy, even though the field survey was conducted during a period of relatively low lake levels.

IFIM Studies on the North Anna and Pamunkey Rivers DRAFT REPORT 2 March 2009
29
Forested wetlands were not as abundant, within the study area, as emergent wetlands. The forested wetlands were located at higher elevations, further from the shoreline of the tributaries and coves, and likely experience fewer changes in hydrologic regime than the fringe wetlands. The forested wetland areas were dominated by red maple (Acer rubrum), river birch (Betula nigra), and black willow (Salix nigra). Observed plant species and their hydrophytic status are shown in Table 4-7. Detailed GIS maps of each cove showing transect locations and surface elevations are included in Notebook Tab 14. The majority of species observed within the wetland areas have an inundation frequency tolerance that ranges from seasonally saturated to irregularly or seasonally inundated. These wetlands, especially the fringe wetlands, currently experience fluctuations in the water surface elevations and have adapted to seasonal changes in inundation. The wetland communities observed will likely tolerate the predicted changes in surface water elevation and inundation frequencies because the proposed lake elevation changes under the alternative operating scenario are relatively minor. A description and summary of the coves studied is presented below: 4.2.1.1 Christopher Creek
• Three of the five transects (CH-1, CH-3 and CH-5) were surveyed for wetlands within Christopher Creek.
• The slope of the banks within the cove varied from moderately steep to steep. • No wetland areas were observed within the transects assessed.
4.2.1.2 Contrary Creek
• Four of the six transects (CO-1, CO-3, CO-5 and CO-6) were surveyed for wetlands within Contrary Creek.
• No wetlands were observed within the four transects surveyed. 4.2.1.3 Crafton Creek
• Two of the four transects (CR-2 and CR-4) were surveyed for wetlands within Crafton Creek.
• The banks along Crafton Creek were approximately three to six feet above the water surface.
• No wetlands were observed within the two transects surveyed. 4.2.1.4 Freshwater Creek
• Four of the seven transects (FR-1, FR-3, FR-5 and FR-7) were surveyed for wetlands within Freshwater Creek.
• Wetlands were observed along Transect FR-1.
IFIM Studies on the North Anna and Pamunkey Rivers DRAFT REPORT 2 March 2009
30
The dominant species within FR-1 included red maple, rice cutgrass, soft rush, river birch, speckled alder, common greenbrier, and hay scented fern (Dennstaedtia punctilobula).
4.2.1.5 Goldmine Creek
• Six transects (GM- 1, GM-3, GM-5, GM-7, GM-9, and GM-11) were surveyed for wetlands within Goldmine Creek.
• Wetland areas were observed within all transects assessed.
Goldmine Creek transect GM-1 was located at the interface of Goldmine Creek and Lake Anna. The left bank of Goldmine Creek, at Transect GM-1, included upland forest. Wetlands were observed along the transect on the left bank of Goldmine Creek. The dominant species included clearweed, spotted touch-me-not, crowned beggarticks (Bidens coronata), nutsedge, and soft rush. Transect GM-1 was dominated by emergent wetlands, but a forested wetland was observed further from the shoreline, close to the endpoint of the transect. Emergent wetland areas were observed along GM-3. The dominant species included Pennsylvania smartweed and Nepalese browntop (Microstegium vimineum). Transect GM-5 was dominated by emergent wetlands with shrubs and trees located throughout the emergent areas. The dominant plant species included black willow, spotted touch-me-not, clearweed, river birch, and crowned beggarticks.
GM-7 was dominated by emergent wetlands, but a forested wetland was observed further from the shoreline, close to the endpoint of the transect. The dominant plant species along GM-7 included musclewood, rice cutgrass, broadleaf cattail, and lesser sparganium. GM-9 was dominated by emergent wetlands. Dominant species within GM-9 included rice cutgrass, Pennsylvania smartweed, and broadleaf cattail.
GM-11 was dominated by emergent wetlands. The dominant species within GM-11 included rice cut grass and Allegheny blackberry. 4.2.2 Existing Lake Level Conditions Currently, the normal pool elevation in Lake Anna is 250.0 ft. The elevation of the lake surface, however, fluctuates between 248.0 ft and 251.0 ft based upon rain and drought conditions. Statistical analysis of the existing lake level conditions for a 29-year period of record is presented within the Notebook Tab 14. For the 29 year period of record (the operation of Units 1 & 2), the lake level has historically been maintained at or above the normal pool elevation of 250.0 ft over 60 percent of the time. During the growing season months of April through October, the lake level has been below 248.0 ft less than five percent of the time, except for September which has been below 248.0 ft less than six percent of the time (Notebook Tab 14). Median (50th percentile) lake elevations less than 250.0 ft have only occurred during the four months of July to October, and the lowest median monthly elevation was 249.63 ft in September (Notebook Tab 14).
IFIM Studies on the North Anna and Pamunkey Rivers DRAFT REPORT 2 March 2009
31
4.2.3 Proposed Lake Level Conditions Two scenarios for proposed Unit 3 were modeled. The first scenario included the proposed Unit 3 using EC/MWC mode at 250.0 ft (EC/MWC at 250.0 ft); and the second scenario included the proposed Unit 3 using EC/MWC with a 250.25 ft full-pool reservoir target elevation, an increase in target elevation of 3-inches (EC/MWC at 250.25 ft). 4.2.3.1 EC/MWC with Existing Target Elevation of 250.0 ft Under this scenario the lake level elevation is predicted to be maintained at 250.0 ft over 55 percent of the time. Similar to existing conditions (discussed above), median lake levels are predicted to be less than 250.0 ft only during the months of July to October (Notebook Tab 14). The differences in water surface elevation between the existing condition (Units 1 and 2) and the proposed Unit 3 in EC/MWC mode at 250.0 ft is summarized in Table 4-8. For this option, the median (50 percentile) value would show no change in water surface elevation from January through May, and in December. During the months of June through November, the median change in water surface elevation would be 0.07 ft to 0.19 ft (<1 inch to 2.28 inches) lower than the existing normal pool elevation. During drought conditions (lower 5th percentile) for the growing season months of April to October, lake elevations would be 0.27 to 0.52 ft (3.2-6.2 inches) lower than existing conditions (Table 4-8). 4.2.3.2 EC/MWC with Target Elevation of 250.25 ft For this scenario, the water surface elevation is predicted to be maintained at or above 250.25 ft over 65 percent of the time (Notebook Tab 14). Median lake levels are predicted to be less than 250.0 ft for only the three months of August to October (Notebook Tab 14). Under this three inch increase scenario, the water surface elevation is predicted to remain above 250.0 ft for one additional month, the month of July. Table 4-9 shows the differences in lake elevations between existing Unit 1 and 2 operations and the addition of Unit 3 operated under EC/MWC at an increased 250.25 ft elevation. For this option, the median (50 percentile) lake level elevation would be 0.25 ft higher than the existing normal pool elevation from January through May and December. During the months of June through November, the change in median water surface elevation would range from 0.01 ft to 0.18 ft (<1 inch to 2.16 inches) higher than the existing normal pool elevation in Lake Anna. During drought conditions (lower 5th percentile) for the growing season months of April to October, lake elevations would be 0.07 to 0.32 ft (0.8-3.8 inches) lower than existing conditions (Table 4-9). These elevations are generally 0.2 ft higher than under the EC/MWC at 250.0 ft scenario. 4.2.4 Wetland Community Assessment Within the study areas of the 5 coves, wetland areas were observed within Freshwater Creek and Goldmine Creek. As indicated above, for the EC/MWC at 250.25 ft scenario, the elevation

IFIM Studies on the North Anna and Pamunkey Rivers DRAFT REPORT 2 March 2009
32
would be 0.25 ft (3 inches) higher than the existing normal pool elevation 50 percent of the time. Based on the median (50 percentile) frequency distribution value for lake level elevations, during the growing season, the wetland areas will experience an increase in inundation depth of 0.18 ft-0.25 ft (2-3 inches) during April to June, and up to 0.1 ft (1.2 inches) during July to October (Table 4-9). At water surface elevation 250.25 ft, 50.5 percent of the wetlands observed within the study area of Freshwater Creek are predicted to experience increased inundation depth and duration (Figure 4-7). These areas experience periodic inundation under the current conditions. Upland deciduous forests were observed at elevation 250.0 ft and higher and may experience a slight increase in the frequency of inundation. The table below depicts the inundation depths of the observed community types at elevation 250.25 ft.
Inundation Tolerance for Plant Communities Observed within Wetland Areas at Freshwater Creek.
Elevation Range (ft)
Inundation Depth at 250.25 ft
Community Dominant Species
Inundation Tolerance
>250.00 <0.25 ft (<3 inches)
Upland Deciduous Forest
Musclewood None
Red Maple Irregular to seasonally inundated or saturated
249.50-249.75 0.50-0.75 ft (6-9 inches)
Scrub/Shrub Wetland
Speckled Alder 0-0.25 ft (3 inches)
Red Maple Irregular to seasonally inundated or saturated
<249.50 >0.75 ft (>9 inches)
Emergent Wetland
Rice Cutgrass 0-0.5 ft (6 inches) Soft Rush 0-1.0 ft (12 inches)
At water surface elevation 250.25 ft, 10.6 percent of the wetlands observed within the study area of Goldmine Creek are predicted to experience increased inundation depth and duration (Figure 4-8). These areas experience periodic inundation under the current conditions. Upland deciduous forests were observed at elevation 250.75 ft and higher. Scrub/Shrub wetland areas were observed at elevation 249.75 to elevation 250.75 ft and emergent wetlands were observed at elevation 249.75 ft and lower. There will be no change to wetlands above elevation 251.0 ft. The table below depicts the inundation depths at elevation 250.25 ft.
Inundation Tolerance for Plant Communities Observed within
Wetland Areas at Goldmine Creek. Elevation Range (ft)
Inundation Depth at 250.25 ft Community Dominant Species Inundation
Tolerance
>250.75 0.0 Upland Deciduous Forest
Silky Dogwood None
Multiflora Rose None
249.75-250.75 0-0.50 ft (6 inches)
Scrub/Shrub Wetland
Speckled Alder 0-0.25 ft (3 inches) Black Willow 0-1.0 ft (12 inches)
IFIM Studies on the North Anna and Pamunkey Rivers DRAFT REPORT 2 March 2009
33
Elevation Range (ft)
Inundation Depth at 250.25 ft Community Dominant Species Inundation
Tolerance
<249.75 >0.50 ft (>6 inches)
Emergent Wetland
Rice Cutgrass 0-0.5 ft (6 inches)
Nepalese Browntop Irregular to seasonal saturated
LIDAR data were also used to depict the ground surface elevations for the remaining three coves: Christopher Creek, Contrary Creek, and Crafton Creek (Notebook Tab 14). However, no wetlands were observed within the study areas of these coves and no further analysis was conducted. 4.2.5 Boat Dock and Ramp Survey Lake Anna provides a variety of recreational facilities for lake owners and visitors. There are numerous commercial and public access recreational sites, as well as privately owned facilities located around the reservoir. As discussed in Section 3.2.7, measurements were taken from the water surface to the top of the boat docks, as well as to the bottom edge of the skirt boards and existing bumper guards, when present. Water depth measurements were also collected at the end of the boat ramps to assure that trailers will not extend beyond the paved ramp surface at lower water elevations. A list of the facilities where the assessment took place is provided below:
• Hunters Landing within Pamunkey Creek, assessed 18 Sept 07 and 21 Oct 08 • Highpoint Marina within Pamunkey Creek, assessed 19 Sept 07 and 21 Oct 08 • Unknown Name, Goldmine Creek, assessed 26 Sept 07 and 21 Oct 08 • Lake Anna State Park within Lake Anna, assessed 27 Sept 07 and 21 Oct 08 • Lake Anna Marina within Joey’s Creek, assessed 27Sept 07 and 21 Oct 08 • Sturgeon Marina within Sturgeon Creek, assessed 27Sept 07 and 21 Oct 08
The results of this study are summarized in Table 4-10a for the public boat ramps, and Table 4-10b for the public boat docks evaluated. These tables present the measurements made on 21 October 2008 when the lake was at 249.4 ft, and extrapolated values to a target lake elevation of 250.0 feet. Also shown in these tables are the depth and height measurements at different statistical probabilities for existing conditions based upon a targeted lake elevation of 250.0 ft.
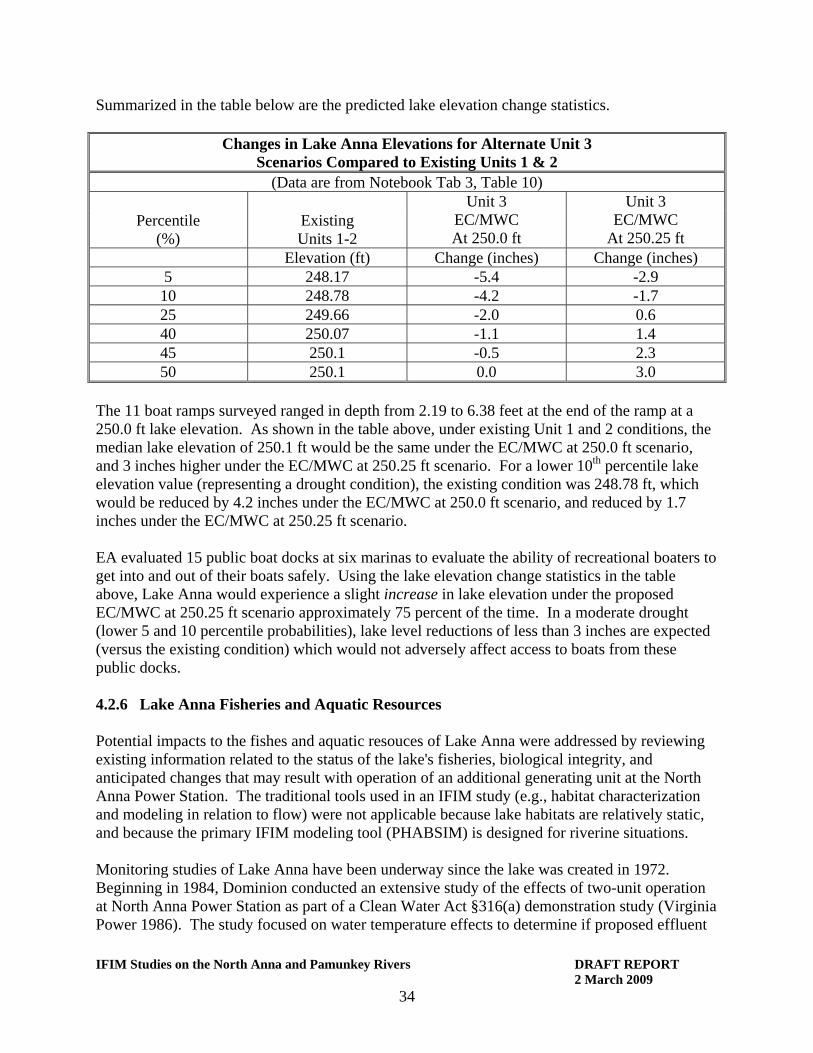
IFIM Studies on the North Anna and Pamunkey Rivers DRAFT REPORT 2 March 2009
34
Summarized in the table below are the predicted lake elevation change statistics.
Changes in Lake Anna Elevations for Alternate Unit 3 Scenarios Compared to Existing Units 1 & 2
(Data are from Notebook Tab 3, Table 10) Unit 3
EC/MWC At 250.0 ft
Unit 3 EC/MWC
At 250.25 ft Percentile
(%) Existing Units 1-2
Elevation (ft) Change (inches) Change (inches) 5 248.17 -5.4 -2.9 10 248.78 -4.2 -1.7 25 249.66 -2.0 0.6 40 250.07 -1.1 1.4 45 250.1 -0.5 2.3 50 250.1 0.0 3.0
The 11 boat ramps surveyed ranged in depth from 2.19 to 6.38 feet at the end of the ramp at a 250.0 ft lake elevation. As shown in the table above, under existing Unit 1 and 2 conditions, the median lake elevation of 250.1 ft would be the same under the EC/MWC at 250.0 ft scenario, and 3 inches higher under the EC/MWC at 250.25 ft scenario. For a lower 10th percentile lake elevation value (representing a drought condition), the existing condition was 248.78 ft, which would be reduced by 4.2 inches under the EC/MWC at 250.0 ft scenario, and reduced by 1.7 inches under the EC/MWC at 250.25 ft scenario. EA evaluated 15 public boat docks at six marinas to evaluate the ability of recreational boaters to get into and out of their boats safely. Using the lake elevation change statistics in the table above, Lake Anna would experience a slight increase in lake elevation under the proposed EC/MWC at 250.25 ft scenario approximately 75 percent of the time. In a moderate drought (lower 5 and 10 percentile probabilities), lake level reductions of less than 3 inches are expected (versus the existing condition) which would not adversely affect access to boats from these public docks.
4.2.6 Lake Anna Fisheries and Aquatic Resources Potential impacts to the fishes and aquatic resouces of Lake Anna were addressed by reviewing existing information related to the status of the lake's fisheries, biological integrity, and anticipated changes that may result with operation of an additional generating unit at the North Anna Power Station. The traditional tools used in an IFIM study (e.g., habitat characterization and modeling in relation to flow) were not applicable because lake habitats are relatively static, and because the primary IFIM modeling tool (PHABSIM) is designed for riverine situations. Monitoring studies of Lake Anna have been underway since the lake was created in 1972. Beginning in 1984, Dominion conducted an extensive study of the effects of two-unit operation at North Anna Power Station as part of a Clean Water Act §316(a) demonstration study (Virginia Power 1986). The study focused on water temperature effects to determine if proposed effluent

IFIM Studies on the North Anna and Pamunkey Rivers DRAFT REPORT 2 March 2009
35
limitations on thermal discharges from the power station were more stringent than necessary to assure the protection and propagation of a balanced, indigenous community of shellfish, fish and wildlife in Lake Anna and the lower North Anna River. In September 1986 the Virginia State Water Control Board accepted Company’s §316(a) study as a successful demonstration based on the study's findings of balanced and indigenous fish and invertebrate communities in Lake Anna and the North Anna River, and that operation of the North Anna Power Station had not resulted in appreciable harm to these aquatic communities. Continuing monitoring of Lake Anna since 1986 has indicated the lake continues to support a healthy aquatic community. Results have been documented in annual reports Dominion submitted to VDEQ and VDGIF. Physical and biological data from recent years are consistent with historical trends, indicating the aquatic ecosystem of Lake Anna is stable. The latest annual report (Dominion Electric Environmental Services 2008) concludes, "In summary, the 2007 data indicate that both the lake and river downstream of the lake support diverse and healthy fisheries." Dominion's monitoring conclusions are supported by results of game fish monitoring by the VDGIF. The latest VDGIF Biologist Report for Lake Anna indicates the numbers and sizes of largemouth bass, the primary sport fish in Lake Anna, have been increasing over the last decade (VDGIF 2008). VDGIF notes the trend for fingerling, stock (at least 8 inches), quality (at least 12 inches) and preferred (at least 15 inches) sized bass between 1993 and 2006 has been indicative of increasing numbers, and that the consistent trends in fingerling and stock-size bass catch rates suggest the adult population is stable. The addition of a third unit at North Anna Power Station is not expected to result in measurable effects on the lake's aquatic communities. Potential water temperature effects on lake biota associated with Unit 3 have been eliminated by Dominion's proposal to construct and use a hybrid cooling system. The relatively small consumptive use of water from Lake Anna associated with Unit 3 is expected to have little effect on the amount of habitat available to the lake's aquatic communities. Many productive lakes throughout the southeast experience much greater fluctuations in water surface elevation than that which occurs in Lake Anna, or will occur if Unit 3 is constructed. Examples in Virginia include Kerr Reservoir and Lake Moomaw, which typically see changes in annual water levels greater than 5 feet. Based on results of long-term monitoring that have indicated the biological community of Lake Anna is healthy and stable, no adverse impacts to the fishes or aquatic resources of Lake Anna are anticipated with operation of proposed Unit 3.
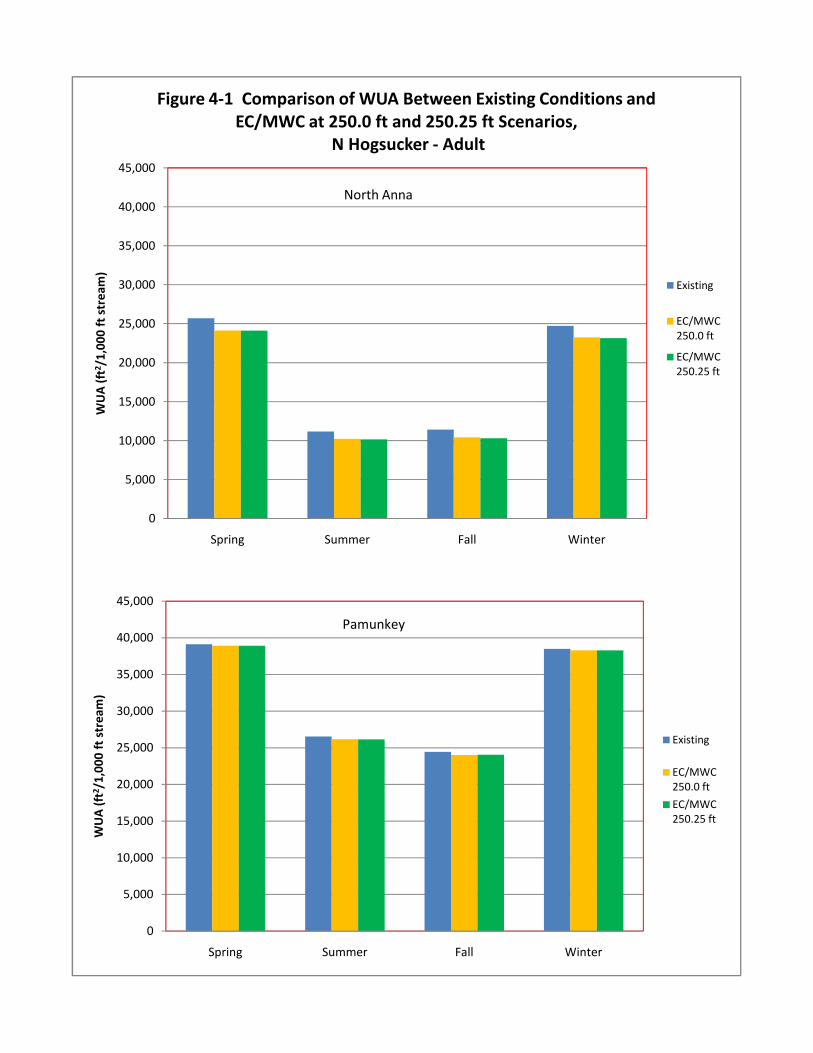
5,000
10,000
15,000
20,000
25,000
30,000
35,000
40,000
45,000
WUA (ft2/1,000
ft stream)
Figure 4‐1 Comparison of WUA Between Existing Conditions and EC/MWC at 250.0 ft and 250.25 ft Scenarios,
N Hogsucker ‐ Adult
Existing
EC/MWC 250.0 ft
EC/MWC 250.25 ft
North Anna
0
Spring Summer Fall Winter
0
5,000
10,000
15,000
20,000
25,000
30,000
35,000
40,000
45,000
Spring Summer Fall Winter
WUA (ft2/1,000
ft stream)
Existing
EC/MWC 250.0 ft
EC/MWC 250.25 ft
Pamunkey
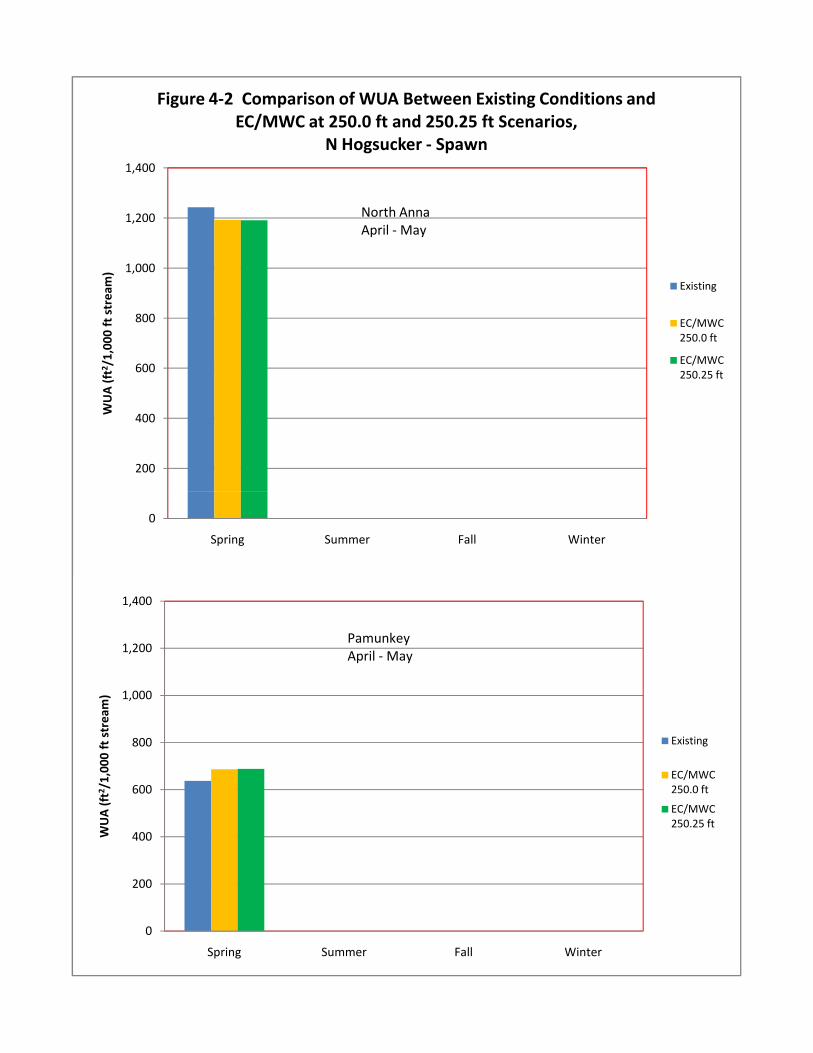
200
400
600
800
1,000
1,200
1,400
WUA (ft2/1,000
ft stream)
Figure 4‐2 Comparison of WUA Between Existing Conditions and EC/MWC at 250.0 ft and 250.25 ft Scenarios,
N Hogsucker ‐ Spawn
Existing
EC/MWC 250.0 ft
EC/MWC 250.25 ft
North AnnaApril ‐May
0
Spring Summer Fall Winter
0
200
400
600
800
1,000
1,200
1,400
Spring Summer Fall Winter
WUA (ft2/1,000
ft stream)
Existing
EC/MWC 250.0 ft
EC/MWC 250.25 ft
PamunkeyApril ‐May
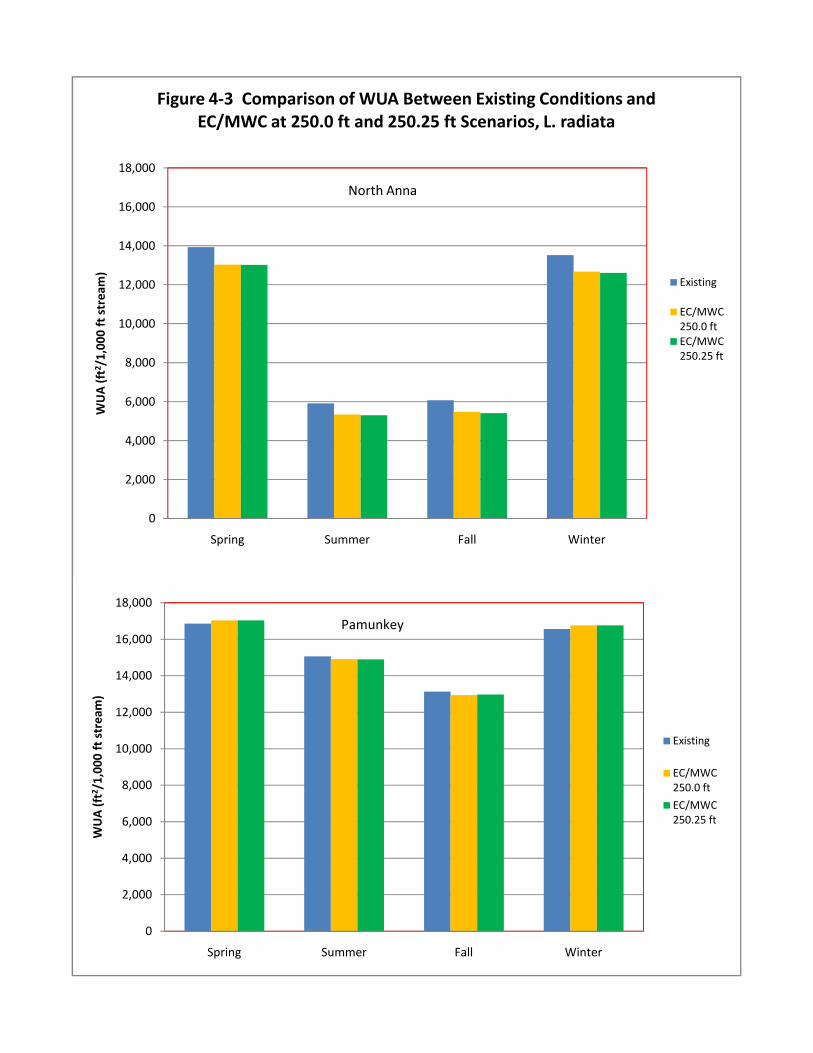
2,000
4,000
6,000
8,000
10,000
12,000
14,000
16,000
18,000
WUA (ft2/1,000
ft stream)
Figure 4‐3 Comparison of WUA Between Existing Conditions and EC/MWC at 250.0 ft and 250.25 ft Scenarios, L. radiata
Existing
EC/MWC 250.0 ftEC/MWC 250.25 ft
North Anna
0
Spring Summer Fall Winter
0
2,000
4,000
6,000
8,000
10,000
12,000
14,000
16,000
18,000
Spring Summer Fall Winter
WUA (ft2/1,000
ft stream)
Existing
EC/MWC 250.0 ft
EC/MWC 250.25 ft
Pamunkey
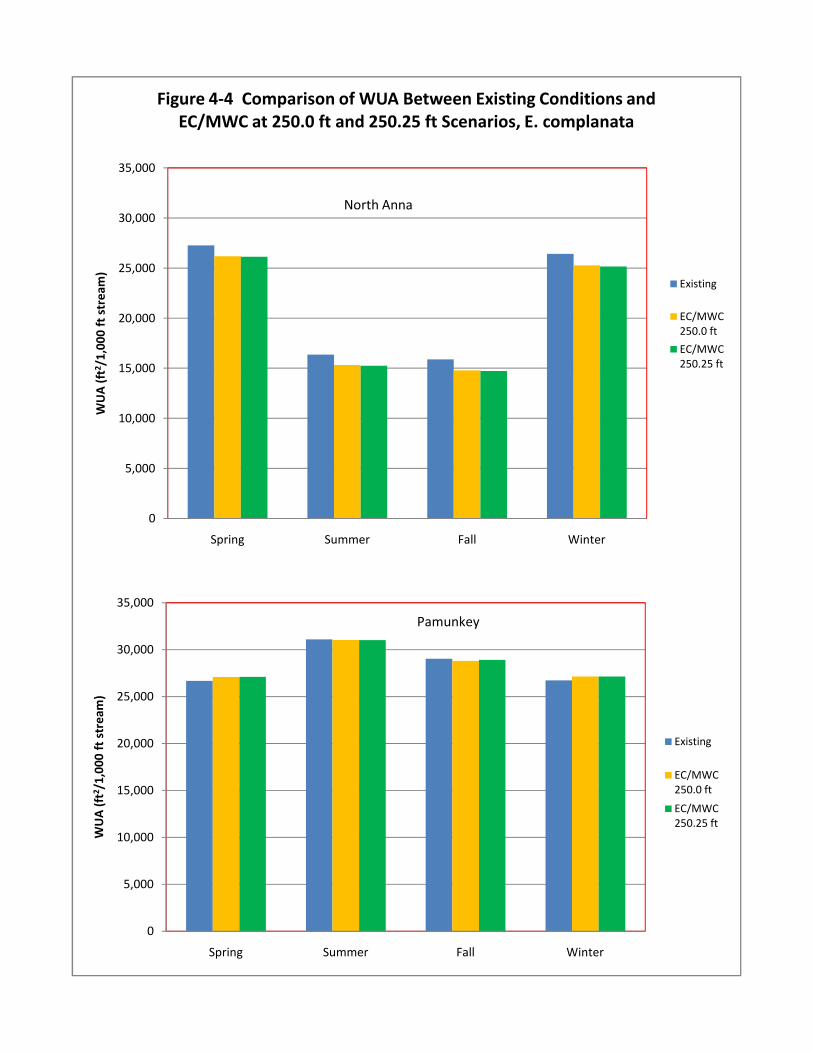
5,000
10,000
15,000
20,000
25,000
30,000
35,000
WUA (ft2/1,000
ft stream)
Figure 4‐4 Comparison of WUA Between Existing Conditions and EC/MWC at 250.0 ft and 250.25 ft Scenarios, E. complanata
Existing
EC/MWC 250.0 ft
EC/MWC 250.25 ft
North Anna
0
Spring Summer Fall Winter
0
5,000
10,000
15,000
20,000
25,000
30,000
35,000
Spring Summer Fall Winter
WUA (ft2/1,000
ft stream)
Existing
EC/MWC 250.0 ft
EC/MWC 250.25 ft
Pamunkey

5,000
10,000
15,000
20,000
25,000
30,000
35,000
40,000
45,000
50,000
WUA (ft2/1,000
ft stream)
Figure 4‐5 Comparison of WUA Between Existing Conditions and EC/MWC at 250.0 ft and 250.25 ft Scenarios,
American Shad ‐ Spawn
Existing
EC/MWC 250.0 ftEC/MWC 250.25 ft
North Anna Coastal PlainMay ‐ October
0
Spring Summer Fall Winter
0
5,000
10,000
15,000
20,000
25,000
30,000
35,000
40,000
45,000
50,000
Spring Summer Fall Winter
WUA (ft2/1,000
ft stream)
Existing
EC/MWC 250.0 ft
EC/MWC 250.25 ft
PamunkeyMarch ‐May
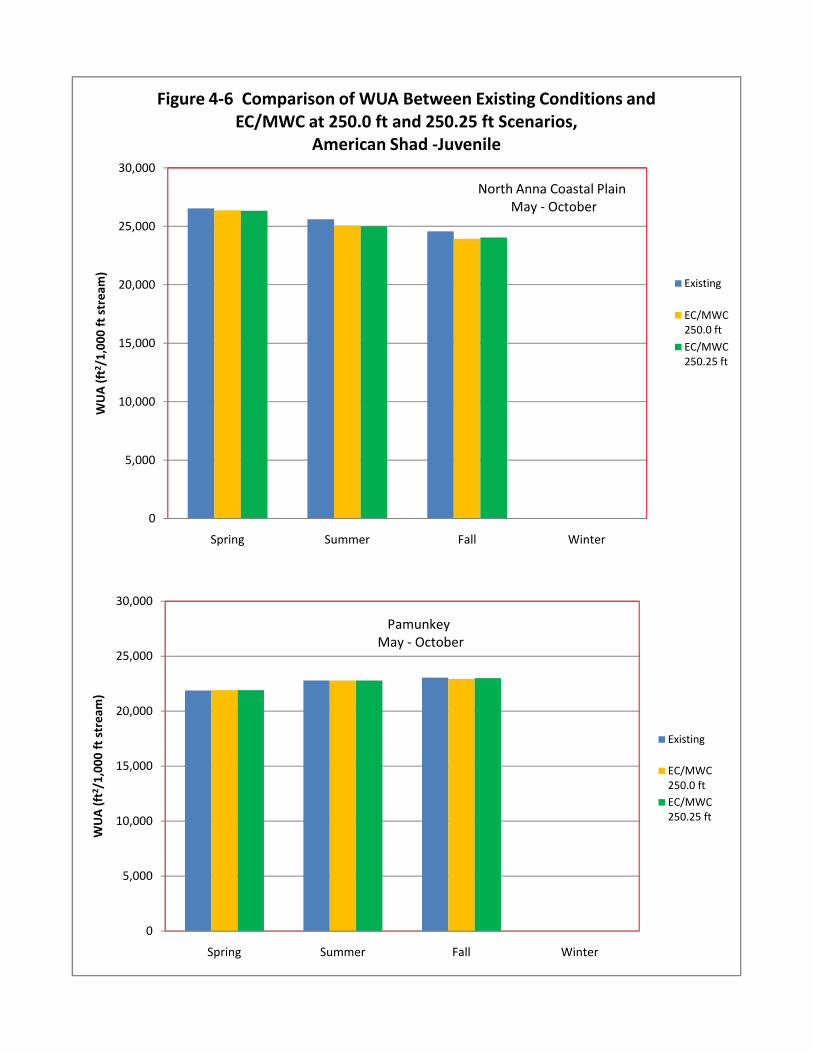
5,000
10,000
15,000
20,000
25,000
30,000
WUA (ft2/1,000
ft stream)
Figure 4‐6 Comparison of WUA Between Existing Conditions and EC/MWC at 250.0 ft and 250.25 ft Scenarios,
American Shad ‐Juvenile
Existing
EC/MWC 250.0 ftEC/MWC 250.25 ft
North Anna Coastal PlainMay ‐ October
0
Spring Summer Fall Winter
0
5,000
10,000
15,000
20,000
25,000
30,000
Spring Summer Fall Winter
WUA (ft2/1,000
ft stream)
Existing
EC/MWC 250.0 ftEC/MWC 250.25 ft
PamunkeyMay ‐ October
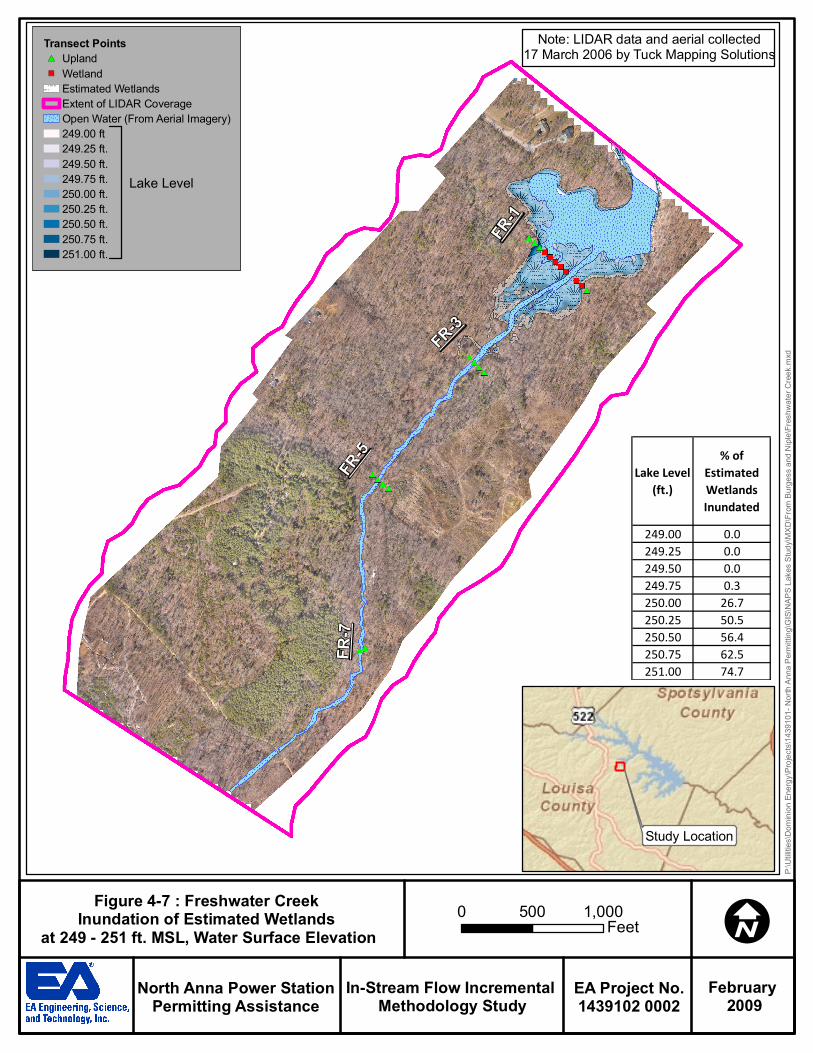
FR-1
FR-3
FR-5
FR-7
Transect Points#* Upland") Wetland
Estimated WetlandsExtent of LIDAR CoverageOpen Water (From Aerial Imagery)249.00 ft249.25 ft.249.50 ft.249.75 ft.250.00 ft.250.25 ft.250.50 ft.250.75 ft.251.00 ft.
Figure 4-7 : Freshwater CreekInundation of Estimated Wetlands
at 249 - 251 ft. MSL, Water Surface Elevation0 1,000500 Feet I
February 2009
EA Project No.1439102 0002
In-Stream Flow Incremental Methodology Study
North Anna Power StationPermitting Assistance
Lake Level
Note: LIDAR data and aerial collected17 March 2006 by Tuck Mapping Solutions
Study Location
P:\Ut
ilities
\Dom
inion
Energ
y\Proj
ects\
1439
101-
North
Anna
Perm
itting
\GIS\
NAPS
Lake
s Stud
y\MXD
\From
Burge
ss an
d Nipl
e\Fres
hwate
r Cree
k.mxd
Lake Level (ft.)
% of Estimated Wetlands Inundated
249.00 0.0249.25 0.0249.50 0.0249.75 0.3250.00 26.7250.25 50.5250.50 56.4250.75 62.5251.00 74.7
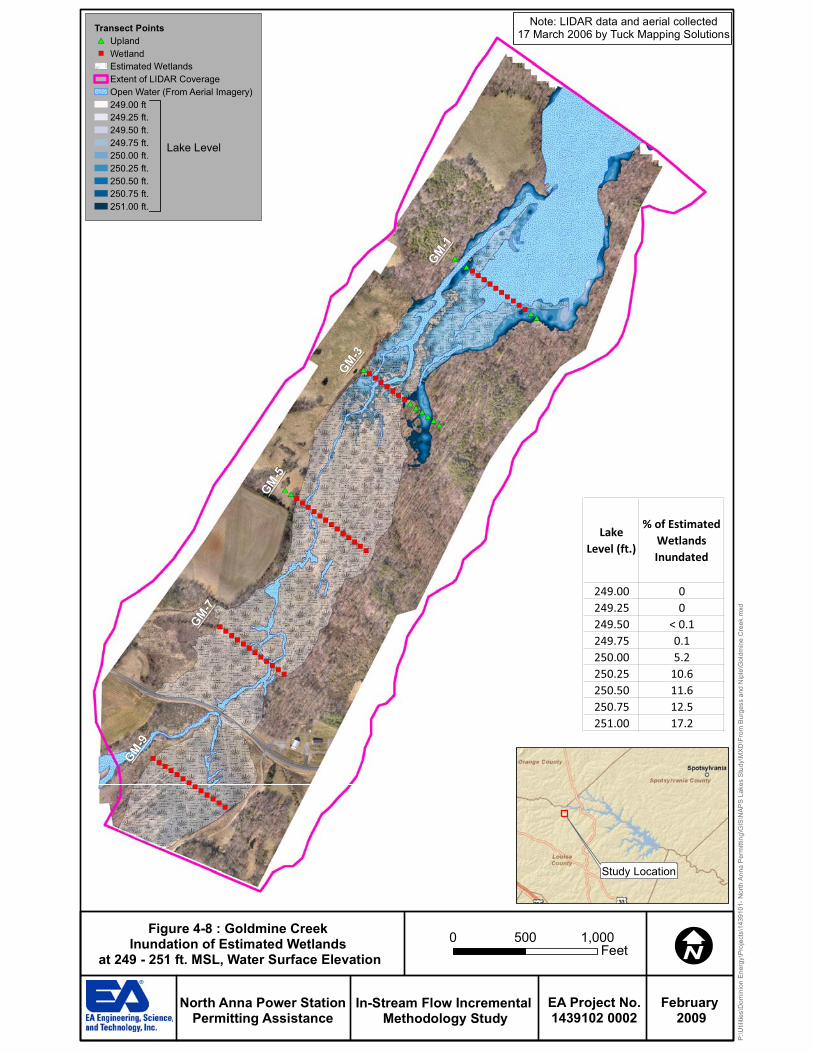
#*
#*")")")")")")")")")")#*#*
#*")")")")")")")#*#*#*#*#*#*
#*#*")")")")")")")")")")")")")
")")
")")
")")
")")
")")
")")
")")
")")
")")
")")
")")
")")
")
GM
-1
GM
-3
GM
-5
GM
-7
GM
-9
Transect Points
#* Upland
") Wetland
Estimated Wetlands
Extent of LIDAR Coverage
Open Water (From Aerial Imagery)
249.00 ft
249.25 ft.
249.50 ft.
249.75 ft.
250.00 ft.
250.25 ft.
250.50 ft.
250.75 ft.
251.00 ft.
Figure 4-8 : Goldmine CreekInundation of Estimated Wetlands
at 249 - 251 ft. MSL, Water Surface Elevation
0 1,000500Feet I
February2009
EA Project No.1439102 0002
In-Stream Flow IncrementalMethodology Study
North Anna Power StationPermitting Assistance
Lake Level
Note: LIDAR data and aerial collected17 March 2006 by Tuck Mapping Solutions
Study Location
Lake
Level (ft.)
% of Estimated
Wetlands
Inundated
249.00 0
249.25 0
249.50 < 0.1
249.75 0.1
250.00 5.2
250.25 10.6
250.50 11.6
250.75 12.5
251.00 17.2
P:\Utilities\DominionEnergy\Projects\1439101-NorthAnnaPermitting\GIS\NAPSLakesStudy\MXD\FromBurgessandNiple\GoldmineCreek.mxd
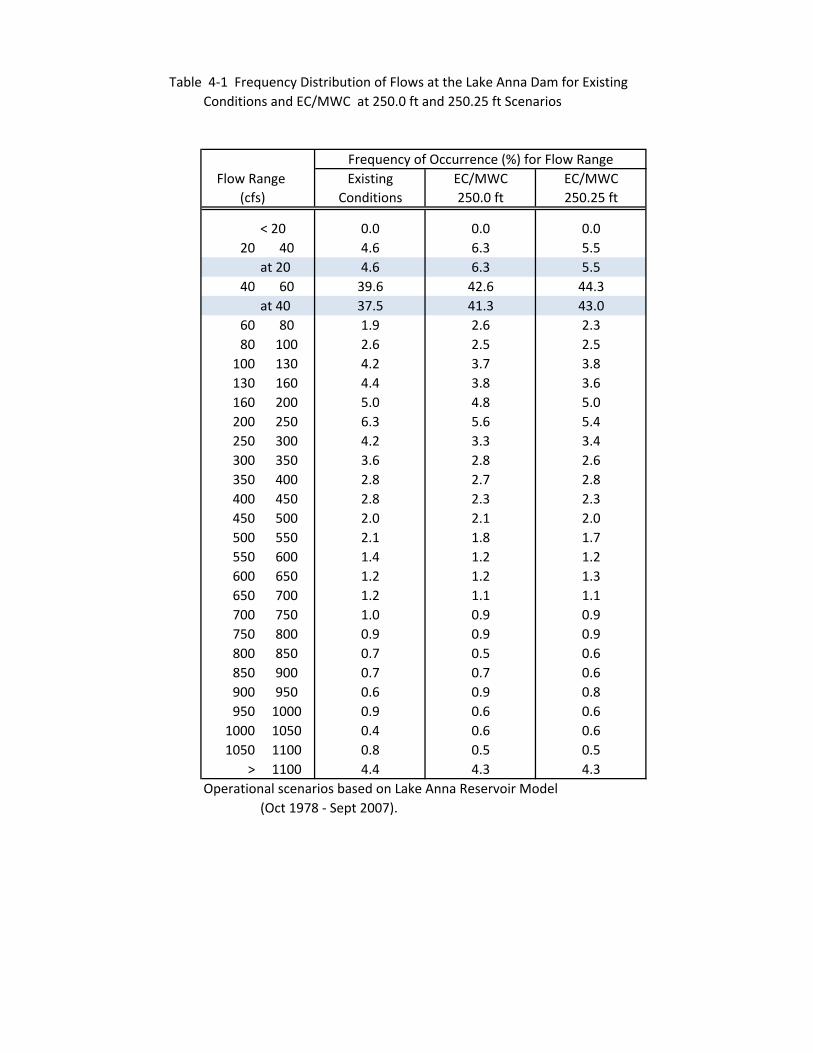
Table 4‐1 Frequency Distribution of Flows at the Lake Anna Dam for ExistingConditions and EC/MWC at 250.0 ft and 250.25 ft Scenarios
Frequency of Occurrence (%) for Flow Range Flow Range Existing EC/MWC EC/MWC (cfs) Conditions 250.0 ft 250.25 ft
< 20 0.0 0.0 0.020 40 4.6 6.3 5.5
at 20 4.6 6.3 5.540 60 39.6 42.6 44.3
at 40 37.5 41.3 43.060 80 1.9 2.6 2.380 100 2.6 2.5 2.5
100 130 4.2 3.7 3.8130 160 4.4 3.8 3.6160 200 5.0 4.8 5.0200 250 6.3 5.6 5.4250 300 4.2 3.3 3.4300 350 3.6 2.8 2.6350 400 2.8 2.7 2.8400 450 2.8 2.3 2.3450 500 2.0 2.1 2.0500 550 2.1 1.8 1.7550 600 1.4 1.2 1.2600 650 1.2 1.2 1.3650 700 1.2 1.1 1.1700 750 1.0 0.9 0.9750 800 0.9 0.9 0.9800 850 0.7 0.5 0.6850 900 0.7 0.7 0.6900 950 0.6 0.9 0.8950 1000 0.9 0.6 0.6
1000 1050 0.4 0.6 0.61050 1100 0.8 0.5 0.5
> 1100 4.4 4.3 4.3Operational scenarios based on Lake Anna Reservoir Model
(Oct 1978 ‐ Sept 2007).

Table 4‐2 Frequency Distribution of Lake Anna Elevations for Existing Conditions and EC/MWC at 250.0 ft and 250.25 ft Scenarios
Elevation (ft)Percentile Existing EC/MWC EC/MWC
(%) Conditions 250.0 ft 250.25 ft
0 245.06 244.17 244.391 246.12 245.45 245.665 248.17 247.72 247.9310 248.78 248.43 248.6415 249.23 248.89 249.0920 249.50 249.22 249.4125 249.66 249.49 249.7130 249.86 249.72 249.9235 249.99 249.88 250.0840 250.07 249.98 250.1945 250.10 250.06 250.2950 250.10 250.10 250.3555 250.10 250.10 250.3560 250.10 250.10 250.3565 250.10 250.10 250.3570 250.10 250.10 250.3575 250.10 250.10 250.3580 250.10 250.10 250.3585 250.10 250.10 250.3590 250.10 250.10 250.3595 250.10 250.10 250.3599 250.10 250.10 250.35
Mean 249.72 249.61 249.84Max 250.10 250.10 250.35Obs 1514 1514 1514
Operational scenarios based on Lake Anna Reservoir Model (Oct 1978 ‐ Sept 2007).
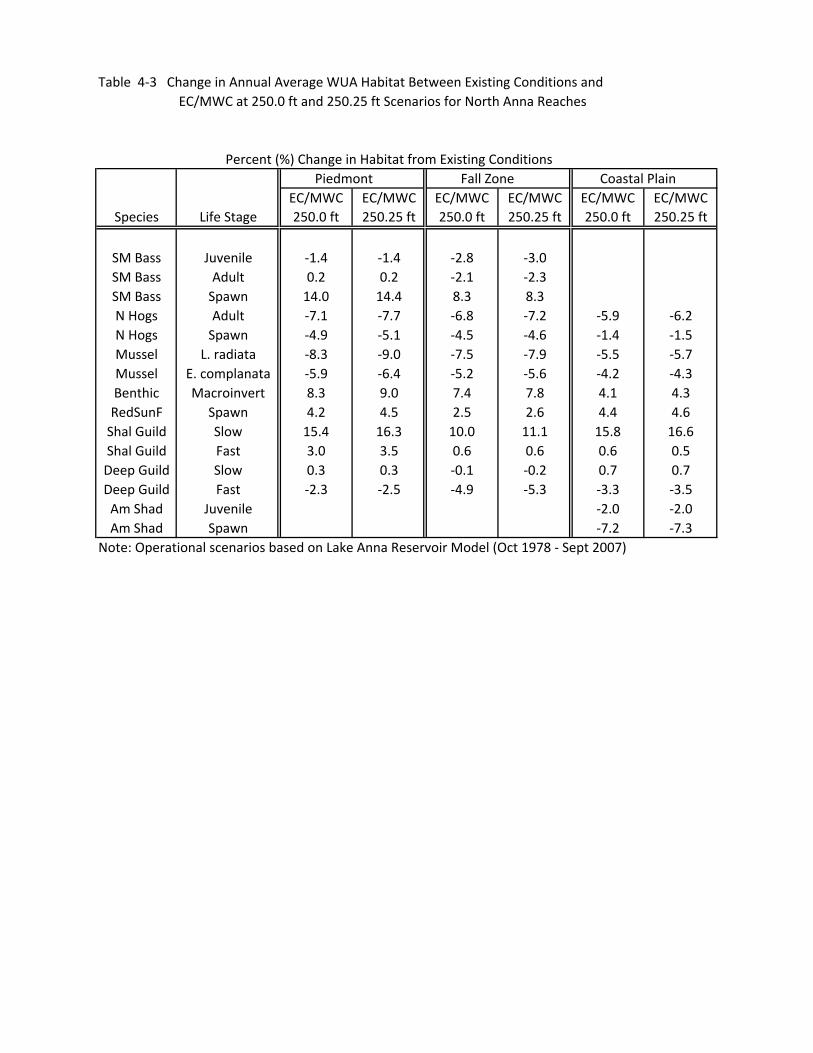
Table 4‐3 Change in Annual Average WUA Habitat Between Existing Conditions and EC/MWC at 250.0 ft and 250.25 ft Scenarios for North Anna Reaches
Percent (%) Change in Habitat from Existing Conditions Piedmont Fall Zone Coastal PlainEC/MWC EC/MWC EC/MWC EC/MWC EC/MWC EC/MWC
Species Life Stage 250.0 ft 250.25 ft 250.0 ft 250.25 ft 250.0 ft 250.25 ft
SM Bass Juvenile ‐1.4 ‐1.4 ‐2.8 ‐3.0SM Bass Adult 0.2 0.2 ‐2.1 ‐2.3SM Bass Spawn 14.0 14.4 8.3 8.3N Hogs Adult ‐7.1 ‐7.7 ‐6.8 ‐7.2 ‐5.9 ‐6.2N Hogs Spawn ‐4.9 ‐5.1 ‐4.5 ‐4.6 ‐1.4 ‐1.5Mussel L. radiata ‐8.3 ‐9.0 ‐7.5 ‐7.9 ‐5.5 ‐5.7Mussel E. complanata ‐5.9 ‐6.4 ‐5.2 ‐5.6 ‐4.2 ‐4.3Benthic Macroinvert 8.3 9.0 7.4 7.8 4.1 4.3RedSunF Spawn 4.2 4.5 2.5 2.6 4.4 4.6Shal Guild Slow 15.4 16.3 10.0 11.1 15.8 16.6Shal Guild Fast 3.0 3.5 0.6 0.6 0.6 0.5Deep Guild Slow 0.3 0.3 ‐0.1 ‐0.2 0.7 0.7Deep Guild Fast ‐2.3 ‐2.5 ‐4.9 ‐5.3 ‐3.3 ‐3.5Am Shad Juvenile ‐2.0 ‐2.0Am Shad Spawn ‐7.2 ‐7.3
Note: Operational scenarios based on Lake Anna Reservoir Model (Oct 1978 ‐ Sept 2007)

Table 4‐4 Change in Annual Average WUA Habitat Between Existing Conditions and EC/MWC at 250.0 ft and 250.25 ft Scenarios for the North Anna Composite and Pamunkey
Percent (%) Change in Habitat from Existing Conditions NA Composite Pamunkey
EC/MWC EC/MWC EC/MWC EC/MWCSpecies Life Stage 250.0 ft 250.25 ft 250.0 ft 250.25 ft
SM Bass Juvenile ‐1.9 ‐2.1SM Bass Adult ‐0.7 ‐0.8SM Bass Spawn 11.4 11.7N Hogs Adult ‐6.8 ‐7.2 ‐0.9 ‐0.9N Hogs Spawn ‐4.0 ‐4.2 7.7 8.0Mussel L. radiata ‐7.4 ‐7.8 0.1 0.1Mussel E. complanata ‐5.1 ‐5.5 0.5 0.6Benthic Macro 6.2 6.5 6.4 5.7
RedB SunF Spawn 3.9 4.2 2.1 2.2Shal Guild Slow 14.5 15.4 5.0 4.5Shal Guild Fast 2.0 2.3 1.9 2.1Deep Guild Slow 0.3 0.3 0.7 0.8Deep Guild Fast ‐3.4 ‐3.7 1.1 1.4Am Shad Juvenile ‐2.0 ‐2.0 ‐0.2 ‐0.1Am Shad Spawn ‐7.2 ‐7.3 ‐1.5 ‐1.5
Note: Operational scenarios based on Lake Anna Reservoir Model (Oct 1978 ‐ Sept 2007) North Anna composite for Smallmouth Bass includes Piedmont and Fall Zone North Anna composite for American Shad includes only North Anna Coastal Plain
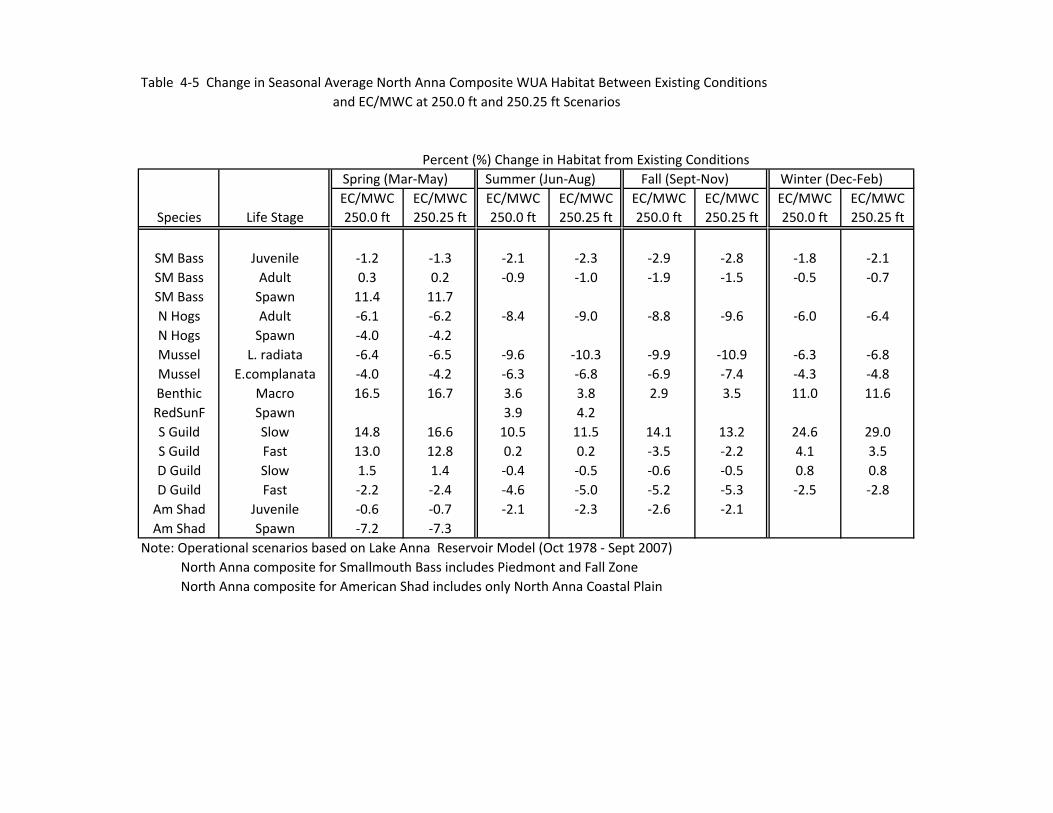
Table 4‐5 Change in Seasonal Average North Anna Composite WUA Habitat Between Existing Conditionsand EC/MWC at 250.0 ft and 250.25 ft Scenarios
Percent (%) Change in Habitat from Existing Conditions Spring (Mar‐May) Summer (Jun‐Aug) Fall (Sept‐Nov) Winter (Dec‐Feb)EC/MWC EC/MWC EC/MWC EC/MWC EC/MWC EC/MWC EC/MWC EC/MWC
Species Life Stage 250.0 ft 250.25 ft 250.0 ft 250.25 ft 250.0 ft 250.25 ft 250.0 ft 250.25 ft
SM Bass Juvenile ‐1.2 ‐1.3 ‐2.1 ‐2.3 ‐2.9 ‐2.8 ‐1.8 ‐2.1SM Bass Adult 0.3 0.2 ‐0.9 ‐1.0 ‐1.9 ‐1.5 ‐0.5 ‐0.7SM Bass Spawn 11.4 11.7N Hogs Adult ‐6.1 ‐6.2 ‐8.4 ‐9.0 ‐8.8 ‐9.6 ‐6.0 ‐6.4N Hogs Spawn ‐4.0 ‐4.2Mussel L. radiata ‐6.4 ‐6.5 ‐9.6 ‐10.3 ‐9.9 ‐10.9 ‐6.3 ‐6.8Mussel E.complanata ‐4.0 ‐4.2 ‐6.3 ‐6.8 ‐6.9 ‐7.4 ‐4.3 ‐4.8Benthic Macro 16.5 16.7 3.6 3.8 2.9 3.5 11.0 11.6RedSunF Spawn 3.9 4.2S Guild Slow 14.8 16.6 10.5 11.5 14.1 13.2 24.6 29.0S Guild Fast 13.0 12.8 0.2 0.2 ‐3.5 ‐2.2 4.1 3.5D Guild Slow 1.5 1.4 ‐0.4 ‐0.5 ‐0.6 ‐0.5 0.8 0.8D Guild Fast ‐2.2 ‐2.4 ‐4.6 ‐5.0 ‐5.2 ‐5.3 ‐2.5 ‐2.8Am Shad Juvenile ‐0.6 ‐0.7 ‐2.1 ‐2.3 ‐2.6 ‐2.1Am Shad Spawn ‐7.2 ‐7.3
Note: Operational scenarios based on Lake Anna Reservoir Model (Oct 1978 ‐ Sept 2007) North Anna composite for Smallmouth Bass includes Piedmont and Fall Zone North Anna composite for American Shad includes only North Anna Coastal Plain

Table 4‐6 Change in Seasonal Average Pamunkey River WUA Habitat Between Existing Conditions and EC/MWC at 250.0 ft and 250.25 ft Scenarios
Percent (%) Change in Habitat from Existing Conditions Spring (Mar‐May) Summer (Jun‐Aug) Fall (Sept‐Nov) Winter (Dec‐Feb)EC/MWC EC/MWC EC/MWC EC/MWC EC/MWC EC/MWC EC/MWC EC/MWC
Species Life Stage 250.0 ft 250.25 ft 250.0 ft 250.25 ft 250.0 ft 250.25 ft 250.0 ft 250.25 ft
N Hogs Adult ‐0.5 ‐0.5 ‐1.4 ‐1.5 ‐1.8 ‐1.7 ‐0.5 ‐0.5N Hogs Spawn 7.7 8.0Mussel L. radiata 1.1 1.1 ‐1.0 ‐1.1 ‐1.5 ‐1.2 1.2 1.2Mussel E.complanata 1.6 1.6 ‐0.2 ‐0.3 ‐0.8 ‐0.4 1.5 1.6Benthic Macro 2.6 2.6 5.9 6.6 7.0 5.3 2.4 2.4RedSunF Spawn 2.1 2.2S Guild Slow 1.8 1.8 5.1 5.5 5.8 4.3 2.2 2.2S Guild Fast 2.5 2.5 2.1 2.3 1.6 1.8 3.0 3.0D Guild Slow 1.5 1.5 0.3 0.3 0.0 0.3 1.5 1.6D Guild Fast 3.3 3.4 0.4 0.3 ‐0.5 0.2 3.0 3.2Canoe Novice ‐0.4 ‐0.4 ‐0.7 ‐0.8 ‐1.1 ‐0.9Canoe Mid ‐0.8 ‐0.8 ‐1.1 ‐1.2 ‐1.4 ‐1.3
Am Shad Juvenile 0.2 0.2 0.0 0.0 ‐0.6 ‐0.2Am Shad Spawn ‐1.5 ‐1.5
Note: Operational scenarios based on Lake Anna Reservoir Model (Oct 1978 ‐ Sept 2007)
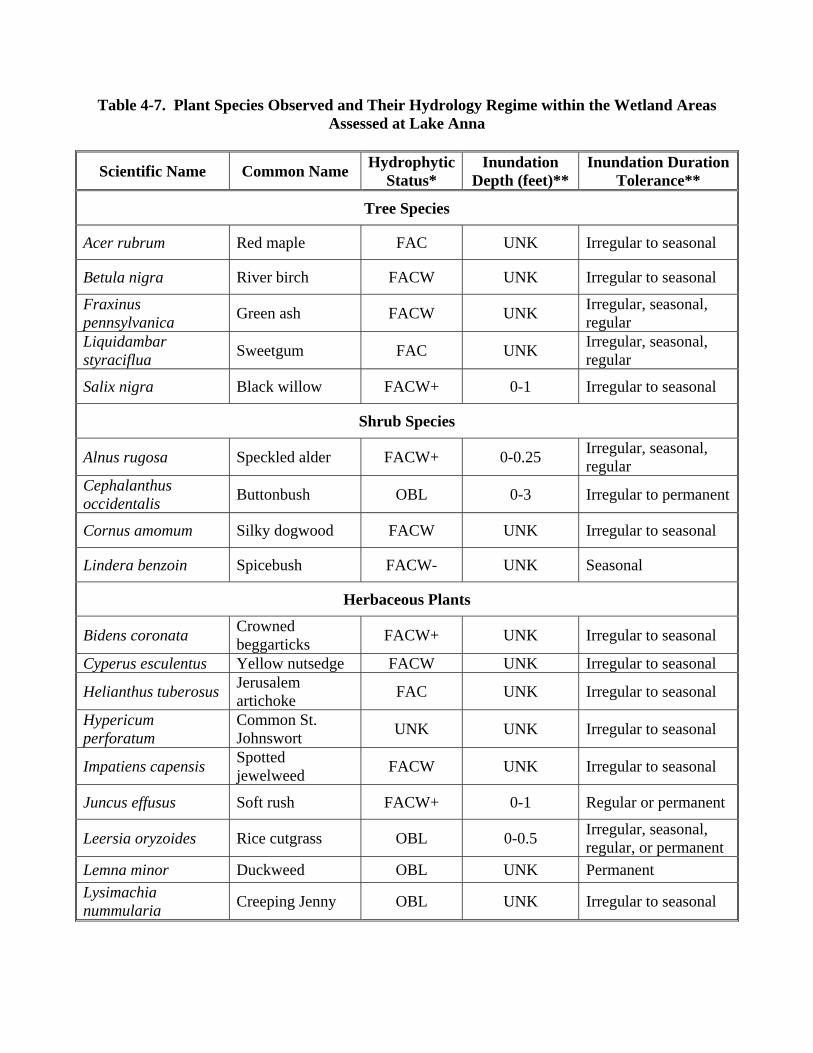
Table 4-7. Plant Species Observed and Their Hydrology Regime within the Wetland Areas Assessed at Lake Anna
Scientific Name Common Name Hydrophytic Status*
Inundation Depth (feet)**
Inundation Duration Tolerance**
Tree Species
Acer rubrum Red maple FAC UNK Irregular to seasonal
Betula nigra River birch FACW UNK Irregular to seasonal
Fraxinus pennsylvanica Green ash FACW UNK Irregular, seasonal,
regular Liquidambar styraciflua Sweetgum FAC UNK Irregular, seasonal,
regular
Salix nigra Black willow FACW+ 0-1 Irregular to seasonal
Shrub Species
Alnus rugosa Speckled alder FACW+ 0-0.25 Irregular, seasonal, regular
Cephalanthus occidentalis Buttonbush OBL 0-3 Irregular to permanent
Cornus amomum Silky dogwood FACW UNK Irregular to seasonal
Lindera benzoin Spicebush FACW- UNK Seasonal
Herbaceous Plants
Bidens coronata Crowned beggarticks FACW+ UNK Irregular to seasonal
Cyperus esculentus Yellow nutsedge FACW UNK Irregular to seasonal
Helianthus tuberosus Jerusalem artichoke FAC UNK Irregular to seasonal
Hypericum perforatum
Common St. Johnswort UNK UNK Irregular to seasonal
Impatiens capensis Spotted jewelweed FACW UNK Irregular to seasonal
Juncus effusus Soft rush FACW+ 0-1 Regular or permanent
Leersia oryzoides Rice cutgrass OBL 0-0.5 Irregular, seasonal, regular, or permanent
Lemna minor Duckweed OBL UNK Permanent Lysimachia nummularia Creeping Jenny OBL UNK Irregular to seasonal
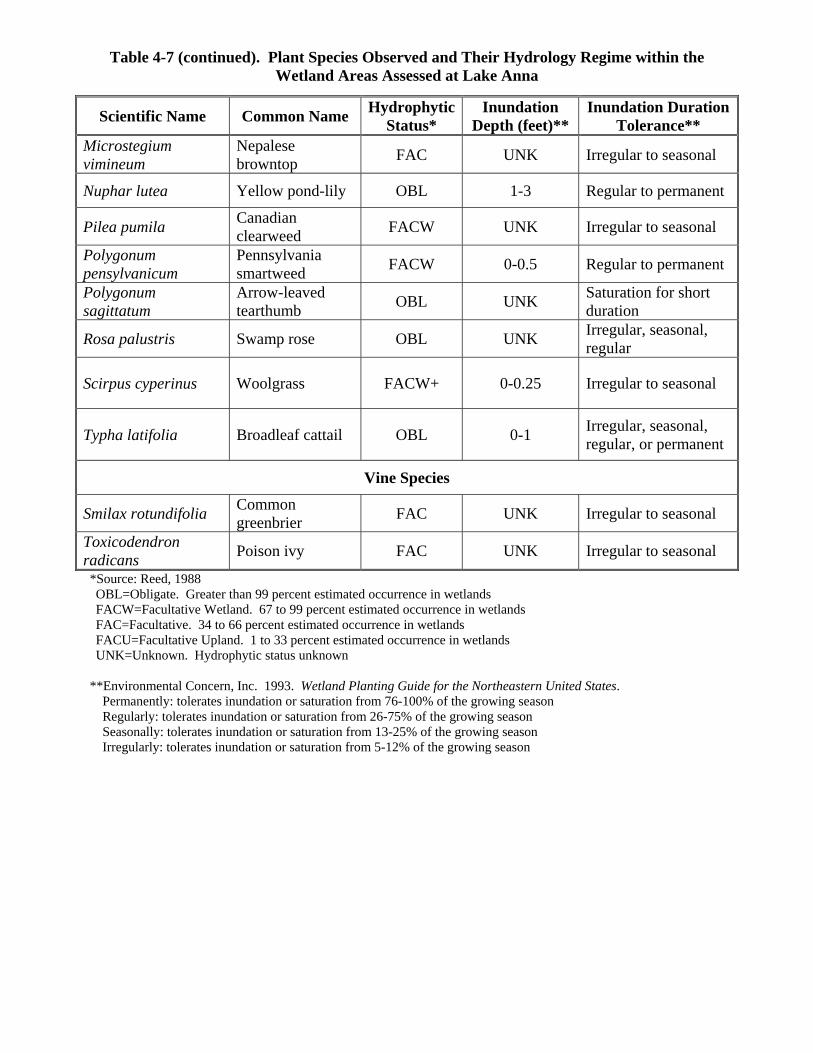
Table 4-7 (continued). Plant Species Observed and Their Hydrology Regime within the Wetland Areas Assessed at Lake Anna
Scientific Name Common Name Hydrophytic Status*
Inundation Depth (feet)**
Inundation Duration Tolerance**
Microstegium vimineum
Nepalese browntop FAC UNK Irregular to seasonal
Nuphar lutea Yellow pond-lily OBL 1-3 Regular to permanent
Pilea pumila Canadian clearweed FACW UNK Irregular to seasonal
Polygonum pensylvanicum
Pennsylvania smartweed FACW 0-0.5 Regular to permanent
Polygonum sagittatum
Arrow-leaved tearthumb OBL UNK Saturation for short
duration
Rosa palustris Swamp rose OBL UNK Irregular, seasonal, regular
Scirpus cyperinus Woolgrass FACW+ 0-0.25 Irregular to seasonal
Typha latifolia Broadleaf cattail OBL 0-1 Irregular, seasonal, regular, or permanent
Vine Species
Smilax rotundifolia Common greenbrier FAC UNK Irregular to seasonal
Toxicodendron radicans Poison ivy FAC UNK Irregular to seasonal
*Source: Reed, 1988 OBL=Obligate. Greater than 99 percent estimated occurrence in wetlands FACW=Facultative Wetland. 67 to 99 percent estimated occurrence in wetlands FAC=Facultative. 34 to 66 percent estimated occurrence in wetlands FACU=Facultative Upland. 1 to 33 percent estimated occurrence in wetlands UNK=Unknown. Hydrophytic status unknown
**Environmental Concern, Inc. 1993. Wetland Planting Guide for the Northeastern United States. Permanently: tolerates inundation or saturation from 76-100% of the growing season Regularly: tolerates inundation or saturation from 26-75% of the growing season Seasonally: tolerates inundation or saturation from 13-25% of the growing season Irregularly: tolerates inundation or saturation from 5-12% of the growing season
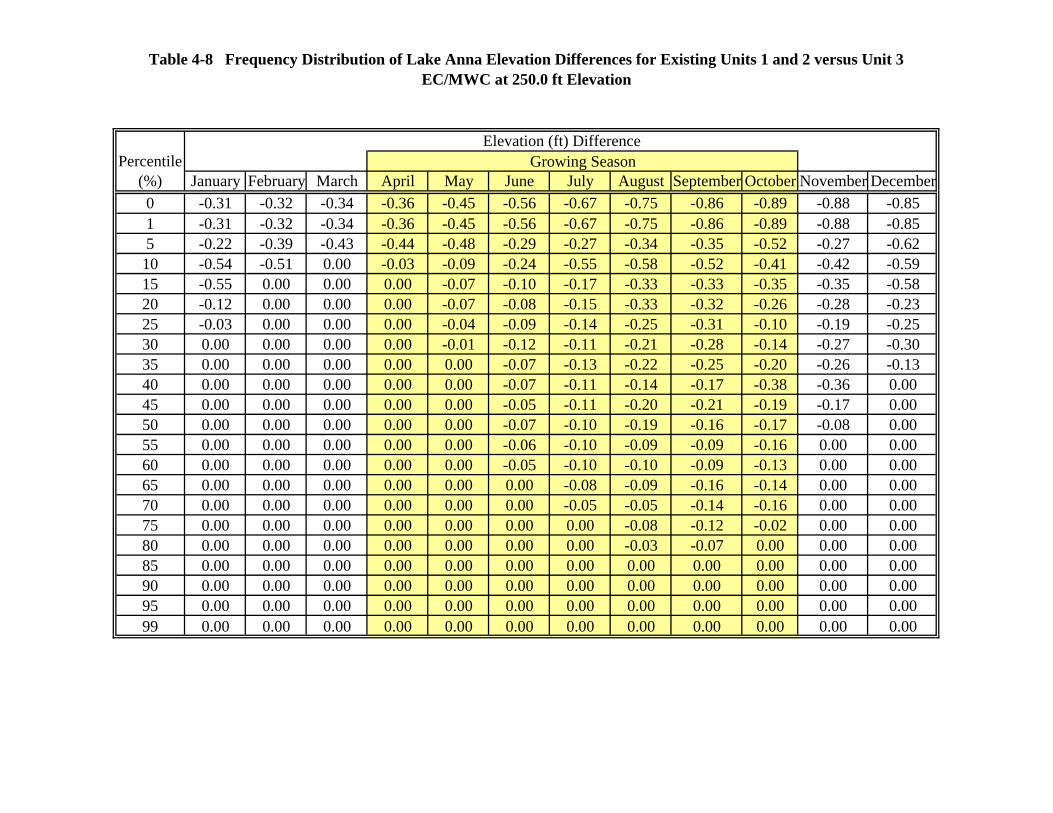
Table 4-8 Frequency Distribution of Lake Anna Elevation Differences for Existing Units 1 and 2 versus Unit 3 EC/MWC at 250.0 ft Elevation
Elevation (ft) DifferencePercentile Growing Season
(%) January February March April May June July August September October November December0 -0.31 -0.32 -0.34 -0.36 -0.45 -0.56 -0.67 -0.75 -0.86 -0.89 -0.88 -0.851 -0.31 -0.32 -0.34 -0.36 -0.45 -0.56 -0.67 -0.75 -0.86 -0.89 -0.88 -0.855 -0.22 -0.39 -0.43 -0.44 -0.48 -0.29 -0.27 -0.34 -0.35 -0.52 -0.27 -0.6210 -0.54 -0.51 0.00 -0.03 -0.09 -0.24 -0.55 -0.58 -0.52 -0.41 -0.42 -0.5915 -0.55 0.00 0.00 0.00 -0.07 -0.10 -0.17 -0.33 -0.33 -0.35 -0.35 -0.5820 -0.12 0.00 0.00 0.00 -0.07 -0.08 -0.15 -0.33 -0.32 -0.26 -0.28 -0.2325 -0.03 0.00 0.00 0.00 -0.04 -0.09 -0.14 -0.25 -0.31 -0.10 -0.19 -0.2530 0.00 0.00 0.00 0.00 -0.01 -0.12 -0.11 -0.21 -0.28 -0.14 -0.27 -0.3035 0.00 0.00 0.00 0.00 0.00 -0.07 -0.13 -0.22 -0.25 -0.20 -0.26 -0.1340 0.00 0.00 0.00 0.00 0.00 -0.07 -0.11 -0.14 -0.17 -0.38 -0.36 0.0045 0.00 0.00 0.00 0.00 0.00 -0.05 -0.11 -0.20 -0.21 -0.19 -0.17 0.0050 0.00 0.00 0.00 0.00 0.00 -0.07 -0.10 -0.19 -0.16 -0.17 -0.08 0.0055 0.00 0.00 0.00 0.00 0.00 -0.06 -0.10 -0.09 -0.09 -0.16 0.00 0.0060 0.00 0.00 0.00 0.00 0.00 -0.05 -0.10 -0.10 -0.09 -0.13 0.00 0.0065 0.00 0.00 0.00 0.00 0.00 0.00 -0.08 -0.09 -0.16 -0.14 0.00 0.0070 0.00 0.00 0.00 0.00 0.00 0.00 -0.05 -0.05 -0.14 -0.16 0.00 0.0075 0.00 0.00 0.00 0.00 0.00 0.00 0.00 -0.08 -0.12 -0.02 0.00 0.0080 0.00 0.00 0.00 0.00 0.00 0.00 0.00 -0.03 -0.07 0.00 0.00 0.0085 0.00 0.00 0.00 0.00 0.00 0.00 0.00 0.00 0.00 0.00 0.00 0.0090 0.00 0.00 0.00 0.00 0.00 0.00 0.00 0.00 0.00 0.00 0.00 0.0095 0.00 0.00 0.00 0.00 0.00 0.00 0.00 0.00 0.00 0.00 0.00 0.0099 0.00 0.00 0.00 0.00 0.00 0.00 0.00 0.00 0.00 0.00 0.00 0.00
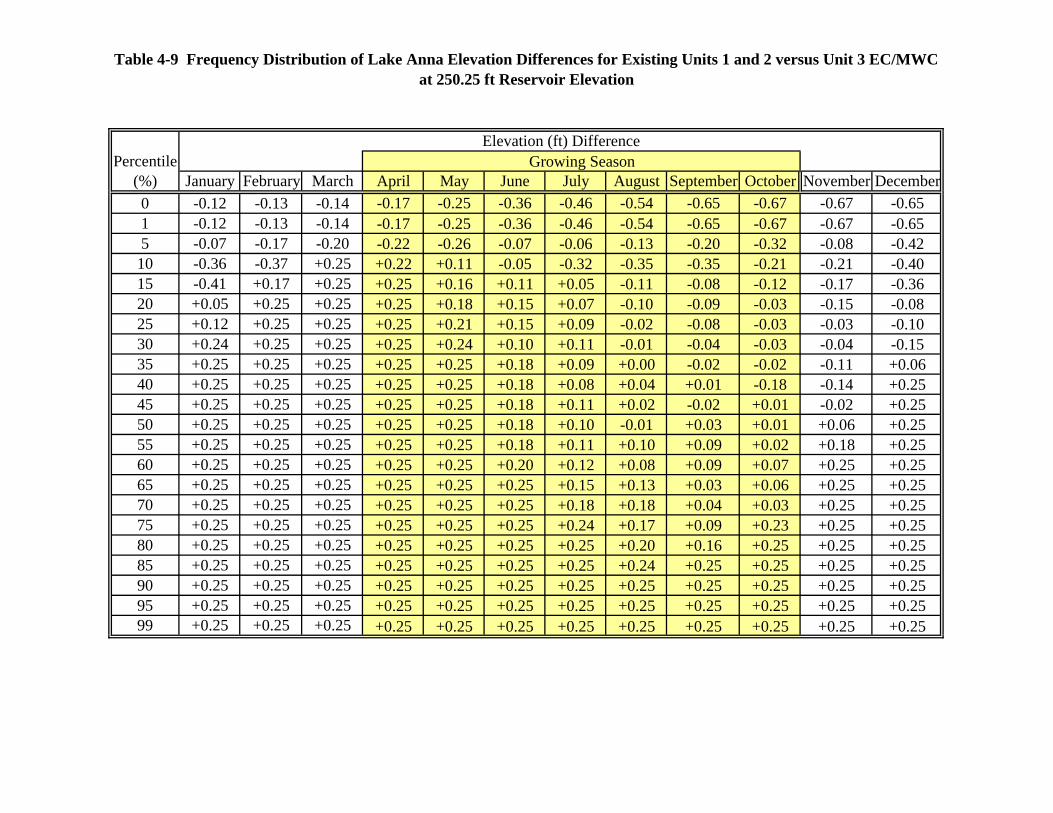
Table 4-9 Frequency Distribution of Lake Anna Elevation Differences for Existing Units 1 and 2 versus Unit 3 EC/MWC at 250.25 ft Reservoir Elevation
Elevation (ft) DifferencePercentile Growing Season
(%) January February March April May June July August September October November December0 -0.12 -0.13 -0.14 -0.17 -0.25 -0.36 -0.46 -0.54 -0.65 -0.67 -0.67 -0.651 -0.12 -0.13 -0.14 -0.17 -0.25 -0.36 -0.46 -0.54 -0.65 -0.67 -0.67 -0.655 -0.07 -0.17 -0.20 -0.22 -0.26 -0.07 -0.06 -0.13 -0.20 -0.32 -0.08 -0.4210 -0.36 -0.37 +0.25 +0.22 +0.11 -0.05 -0.32 -0.35 -0.35 -0.21 -0.21 -0.4015 -0.41 +0.17 +0.25 +0.25 +0.16 +0.11 +0.05 -0.11 -0.08 -0.12 -0.17 -0.3620 +0.05 +0.25 +0.25 +0.25 +0.18 +0.15 +0.07 -0.10 -0.09 -0.03 -0.15 -0.0825 +0.12 +0.25 +0.25 +0.25 +0.21 +0.15 +0.09 -0.02 -0.08 -0.03 -0.03 -0.1030 +0.24 +0.25 +0.25 +0.25 +0.24 +0.10 +0.11 -0.01 -0.04 -0.03 -0.04 -0.1535 +0.25 +0.25 +0.25 +0.25 +0.25 +0.18 +0.09 +0.00 -0.02 -0.02 -0.11 +0.0640 +0.25 +0.25 +0.25 +0.25 +0.25 +0.18 +0.08 +0.04 +0.01 -0.18 -0.14 +0.2545 +0.25 +0.25 +0.25 +0.25 +0.25 +0.18 +0.11 +0.02 -0.02 +0.01 -0.02 +0.2550 +0.25 +0.25 +0.25 +0.25 +0.25 +0.18 +0.10 -0.01 +0.03 +0.01 +0.06 +0.2555 +0.25 +0.25 +0.25 +0.25 +0.25 +0.18 +0.11 +0.10 +0.09 +0.02 +0.18 +0.2560 +0.25 +0.25 +0.25 +0.25 +0.25 +0.20 +0.12 +0.08 +0.09 +0.07 +0.25 +0.2565 +0.25 +0.25 +0.25 +0.25 +0.25 +0.25 +0.15 +0.13 +0.03 +0.06 +0.25 +0.2570 +0.25 +0.25 +0.25 +0.25 +0.25 +0.25 +0.18 +0.18 +0.04 +0.03 +0.25 +0.2575 +0.25 +0.25 +0.25 +0.25 +0.25 +0.25 +0.24 +0.17 +0.09 +0.23 +0.25 +0.2580 +0.25 +0.25 +0.25 +0.25 +0.25 +0.25 +0.25 +0.20 +0.16 +0.25 +0.25 +0.2585 +0.25 +0.25 +0.25 +0.25 +0.25 +0.25 +0.25 +0.24 +0.25 +0.25 +0.25 +0.2590 +0.25 +0.25 +0.25 +0.25 +0.25 +0.25 +0.25 +0.25 +0.25 +0.25 +0.25 +0.2595 +0.25 +0.25 +0.25 +0.25 +0.25 +0.25 +0.25 +0.25 +0.25 +0.25 +0.25 +0.2599 +0.25 +0.25 +0.25 +0.25 +0.25 +0.25 +0.25 +0.25 +0.25 +0.25 +0.25 +0.25

Table 4-10 BOAT DOCK AND RAMP EVALUATION
Table 4-10a- Boat Ramps Lake Elevation: 249.4 ft. msl on 21 Oct 2008Measured Measured
Ramp Water Depth at
Length (ft) end of ramp (ft) at Lake Elevation
Ramp Name Creek Name Ramp at 249.4 ft. at 249.4 ft. msl 250.0 ft. msl 50 Percentile 25 Percentile 10 PercentileHunters Landing Pamunkey A 15.3 1.59 2.19 2.19 1.85 0.97
A 37.9 4.11 4.71 4.71 4.37 3.49
B 35.6 4.11 4.71 4.71 4.37 3.49
Unknown Goldmine Creek A 15.5 3.65 4.25 4.25 3.91 3.03
Lake Anna State Park Lake Anna A 36.1 4.72 5.32 5.32 4.98 4.08
A 14.5 2.90 3.50 3.50 3.16 2.28
B 27.8 5.78 6.38 6.38 6.04 5.16
A 11.0 1.63 2.23 2.23 1.89 1.01
B 28.3 4.21 4.81 4.81 4.47 3.59
C 27.5 3.95 4.55 4.55 4.21 3.28
D 27.7 3.57 4.17 4.17 3.83 2.95
Table 4-10b- Boat Docks Lake Elevation: 249.4 ft. msl on 21 Oct 2008Measured
Dock Heightin feet at Lake Elevation
Ramp Name Creek Name Dock at 249.4 ft. msl 250.0 ft. msl 50 Percentile 25 Percentile 10 Percentile
1 2.19 1.59 1.59 1.93 2.81
2 2.15 1.55 1.55 1.89 2.77
1 2.03 1.43 1.43 1.77 2.65
2 2.16 1.56 1.56 1.90 2.78
1 2.89 2.29 2.29 2.63 3.51
3 2.59 1.99 1.99 2.33 3.21
1 2.61 2.01 2.01 2.35 3.23
2 2.55 1.95 1.95 2.29 3.17
3 2.51 1.91 1.91 2.25 3.13
1 2.40 1.80 1.80 2.14 3.02
2 2.03 1.43 1.43 1.77 2.65
1 2.35 1.75 1.75 2.09 2.97
2 1.89 1.29 1.29 1.63 2.51
3 1.60 1.00 1.00 1.34 2.22
4 1.61 1.01 1.01 1.35 2.23
Sturgeon Marina Sturgeon Creek
Unknown
Hunters Landing Pamunkey
Goldmine Creek
Lake Anna State Park Lake Anna
Highpoint Marina Pamunkey Cr.
Calculated Water Depth at End of Ramp (in feet) Under Existing Conditions
Calculated Dock Height Above Water Surface (in feet) Under Existing Conditions
Lake Anna Marina Joey's Creek
Sturgeon CreekSturgeon Marina
Pamunkey Cr.Highpoint Marina
Joey's CreekLake Anna Marina
IFIM Studies on the North Anna and Pamunkey Rivers DRAFT REPORT 2 March 2009
36
5. CONCLUSIONS
This program was conducted based upon the approved “North Anna IFIM Study Plan” and included components that addressed the influence of proposed Unit 3 on the non-tidal North Anna and Pamunkey River habitats, as well as wetlands and boat docks/ramps on Lake Anna to assess potentially raising the normal lake level. The completion of this IFIM study satisfies the special condition in the Coastal Zone Consistency determination for NAPS Unit 3. 5.1 NORTH ANNA AND PAMUNKEY RIVER CONCLUSIONS The habitat requirements for the target species selected for evaluation in the IFIM studies are representative of a range of habitat preferences (water velocity, depth and substrate) of the overall aquatic community of the North Anna-Pamunkey system. Analysis and evaluation of the study results was a cooperative and iterative process between representatives of Dominion and VDEQ, VDGIF, and VDCR. 5.1.1 River Flows The alternative scenario (EC/MWC at 250.25 ft year around) would result in a seasonal pattern of 40 cfs releases that is similar to the existing condition with operation of Units 1 and 2. Flows at 20 cfs would occur 5.5 percent of the time compared to 6.3 percent predicted for Dominion’s initial EC/MWC at 250.0 ft proposal. The frequency of 20-cfs flows under existing conditions is 4.6 percent. The 3-inch increase in lake storage capacity with the alternative scenario would maintain lake water surface elevation above existing conditions approximately 75 percent of the time, and better protect river aquatic habitat and recreation, particularly during dry periods. 5.1.2 Aquatic Habitat Availability A key recommendation by the resource agencies was to focus on a subset of the initial list of 15 species/lifestages where potential habitat effects might be better seen. Following initial assessments of the WUA data, VDGIF and VDEQ staff recommended the following selected species and habitats:
• Habitat for adult and spawning northern hogsucker • Habitat for freshwater mussels, L. radiata and E. complanata • Coastal Plain habitat for spawning and juvenile American shad
Habitat quantity comparisons between the alternative scenario (EC/MWC at 250.25 ft) and the existing condition indicate gains and losses depending upon the species and season. In no case were habitat losses in the North Anna River more than 10 percent on an annual basis, and most gains were in the same percentage range (though a few gains exceeded 10 percent). For the Pamunkey River, slight habitat gains are predicted for most species. In general, habitat decreases for the species and lifestages of concern relative to existing conditions tend to be greater during summer and fall months than winter and spring months.
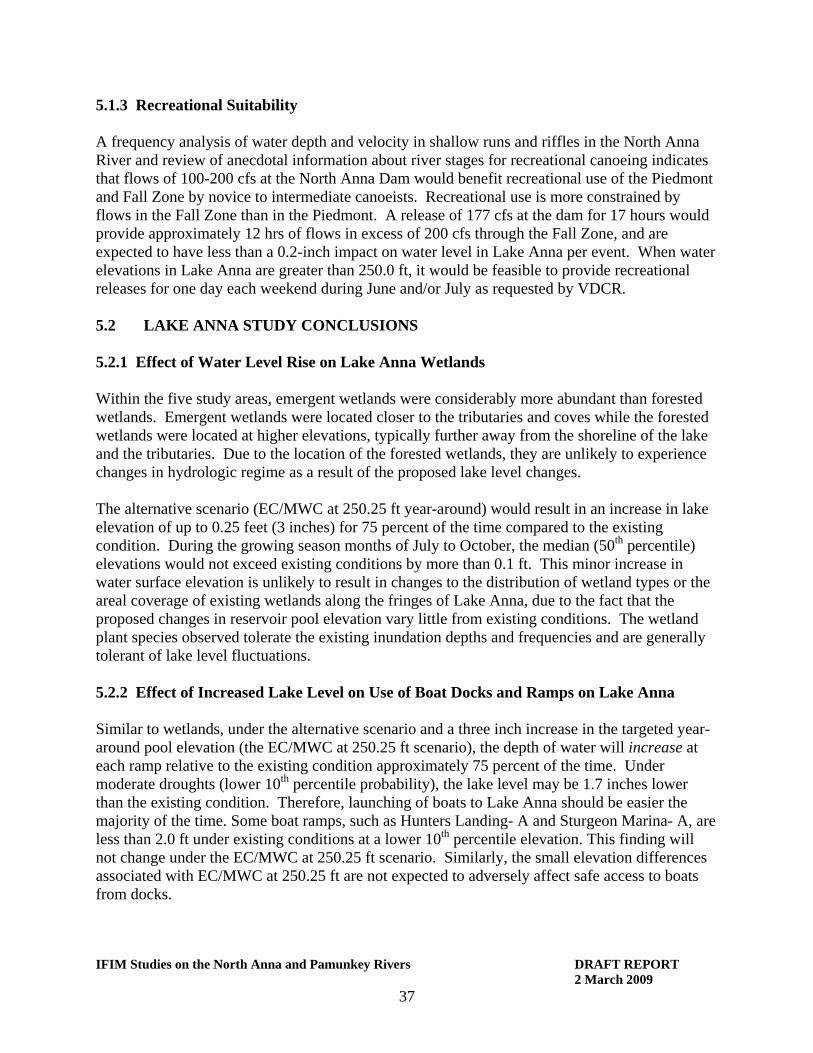
IFIM Studies on the North Anna and Pamunkey Rivers DRAFT REPORT 2 March 2009
37
5.1.3 Recreational Suitability A frequency analysis of water depth and velocity in shallow runs and riffles in the North Anna River and review of anecdotal information about river stages for recreational canoeing indicates that flows of 100-200 cfs at the North Anna Dam would benefit recreational use of the Piedmont and Fall Zone by novice to intermediate canoeists. Recreational use is more constrained by flows in the Fall Zone than in the Piedmont. A release of 177 cfs at the dam for 17 hours would provide approximately 12 hrs of flows in excess of 200 cfs through the Fall Zone, and are expected to have less than a 0.2-inch impact on water level in Lake Anna per event. When water elevations in Lake Anna are greater than 250.0 ft, it would be feasible to provide recreational releases for one day each weekend during June and/or July as requested by VDCR. 5.2 LAKE ANNA STUDY CONCLUSIONS 5.2.1 Effect of Water Level Rise on Lake Anna Wetlands Within the five study areas, emergent wetlands were considerably more abundant than forested wetlands. Emergent wetlands were located closer to the tributaries and coves while the forested wetlands were located at higher elevations, typically further away from the shoreline of the lake and the tributaries. Due to the location of the forested wetlands, they are unlikely to experience changes in hydrologic regime as a result of the proposed lake level changes. The alternative scenario (EC/MWC at 250.25 ft year-around) would result in an increase in lake elevation of up to 0.25 feet (3 inches) for 75 percent of the time compared to the existing condition. During the growing season months of July to October, the median (50th percentile) elevations would not exceed existing conditions by more than 0.1 ft. This minor increase in water surface elevation is unlikely to result in changes to the distribution of wetland types or the areal coverage of existing wetlands along the fringes of Lake Anna, due to the fact that the proposed changes in reservoir pool elevation vary little from existing conditions. The wetland plant species observed tolerate the existing inundation depths and frequencies and are generally tolerant of lake level fluctuations. 5.2.2 Effect of Increased Lake Level on Use of Boat Docks and Ramps on Lake Anna Similar to wetlands, under the alternative scenario and a three inch increase in the targeted year-around pool elevation (the EC/MWC at 250.25 ft scenario), the depth of water will increase at each ramp relative to the existing condition approximately 75 percent of the time. Under moderate droughts (lower 10th percentile probability), the lake level may be 1.7 inches lower than the existing condition. Therefore, launching of boats to Lake Anna should be easier the majority of the time. Some boat ramps, such as Hunters Landing- A and Sturgeon Marina- A, are less than 2.0 ft under existing conditions at a lower 10th percentile elevation. This finding will not change under the EC/MWC at 250.25 ft scenario. Similarly, the small elevation differences associated with EC/MWC at 250.25 ft are not expected to adversely affect safe access to boats from docks.
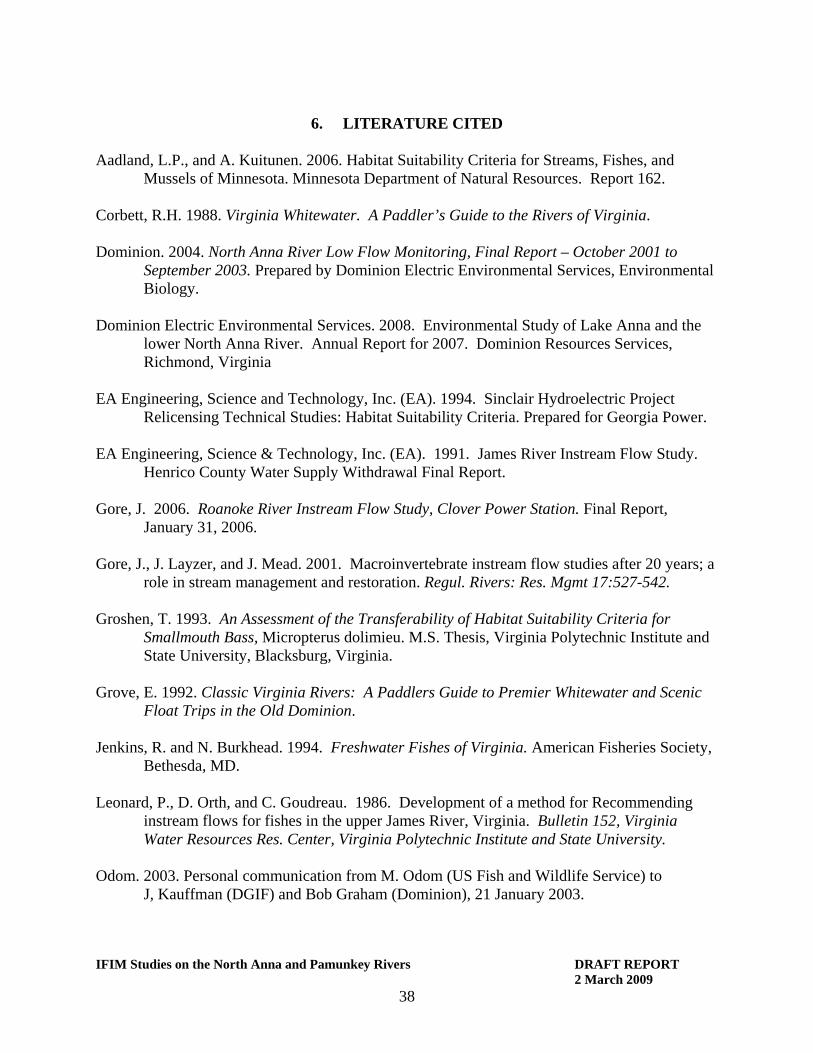
IFIM Studies on the North Anna and Pamunkey Rivers DRAFT REPORT 2 March 2009
38
6. LITERATURE CITED
Aadland, L.P., and A. Kuitunen. 2006. Habitat Suitability Criteria for Streams, Fishes, and
Mussels of Minnesota. Minnesota Department of Natural Resources. Report 162. Corbett, R.H. 1988. Virginia Whitewater. A Paddler’s Guide to the Rivers of Virginia. Dominion. 2004. North Anna River Low Flow Monitoring, Final Report – October 2001 to
September 2003. Prepared by Dominion Electric Environmental Services, Environmental Biology.
Dominion Electric Environmental Services. 2008. Environmental Study of Lake Anna and the
lower North Anna River. Annual Report for 2007. Dominion Resources Services, Richmond, Virginia
EA Engineering, Science and Technology, Inc. (EA). 1994. Sinclair Hydroelectric Project
Relicensing Technical Studies: Habitat Suitability Criteria. Prepared for Georgia Power. EA Engineering, Science & Technology, Inc. (EA). 1991. James River Instream Flow Study.
Henrico County Water Supply Withdrawal Final Report. Gore, J. 2006. Roanoke River Instream Flow Study, Clover Power Station. Final Report,
January 31, 2006. Gore, J., J. Layzer, and J. Mead. 2001. Macroinvertebrate instream flow studies after 20 years; a
role in stream management and restoration. Regul. Rivers: Res. Mgmt 17:527-542. Groshen, T. 1993. An Assessment of the Transferability of Habitat Suitability Criteria for
Smallmouth Bass, Micropterus dolimieu. M.S. Thesis, Virginia Polytechnic Institute and State University, Blacksburg, Virginia.
Grove, E. 1992. Classic Virginia Rivers: A Paddlers Guide to Premier Whitewater and Scenic
Float Trips in the Old Dominion. Jenkins, R. and N. Burkhead. 1994. Freshwater Fishes of Virginia. American Fisheries Society,
Bethesda, MD. Leonard, P., D. Orth, and C. Goudreau. 1986. Development of a method for Recommending
instream flows for fishes in the upper James River, Virginia. Bulletin 152, Virginia Water Resources Res. Center, Virginia Polytechnic Institute and State University.
Odom. 2003. Personal communication from M. Odom (US Fish and Wildlife Service) to
J, Kauffman (DGIF) and Bob Graham (Dominion), 21 January 2003.
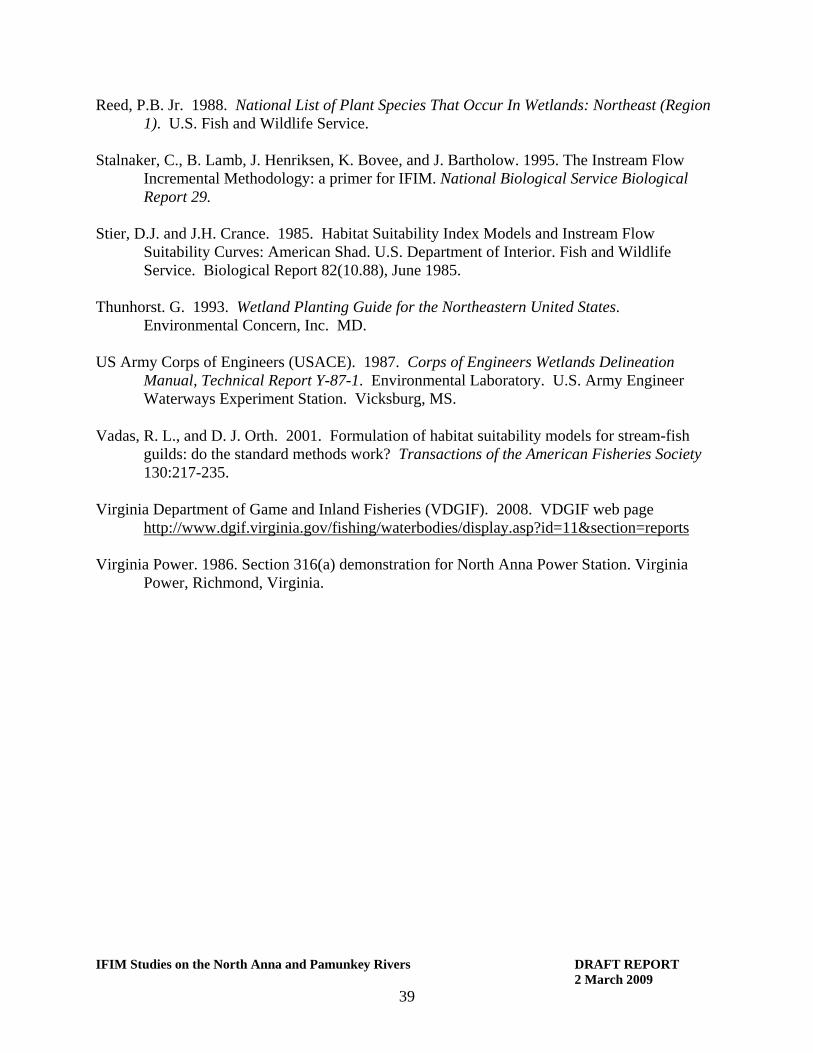
IFIM Studies on the North Anna and Pamunkey Rivers DRAFT REPORT 2 March 2009
39
Reed, P.B. Jr. 1988. National List of Plant Species That Occur In Wetlands: Northeast (Region 1). U.S. Fish and Wildlife Service.
Stalnaker, C., B. Lamb, J. Henriksen, K. Bovee, and J. Bartholow. 1995. The Instream Flow
Incremental Methodology: a primer for IFIM. National Biological Service Biological Report 29.
Stier, D.J. and J.H. Crance. 1985. Habitat Suitability Index Models and Instream Flow
Suitability Curves: American Shad. U.S. Department of Interior. Fish and Wildlife Service. Biological Report 82(10.88), June 1985.
Thunhorst. G. 1993. Wetland Planting Guide for the Northeastern United States.
Environmental Concern, Inc. MD. US Army Corps of Engineers (USACE). 1987. Corps of Engineers Wetlands Delineation
Manual, Technical Report Y-87-1. Environmental Laboratory. U.S. Army Engineer Waterways Experiment Station. Vicksburg, MS.
Vadas, R. L., and D. J. Orth. 2001. Formulation of habitat suitability models for stream-fish guilds: do the standard methods work? Transactions of the American Fisheries Society 130:217-235.
Virginia Department of Game and Inland Fisheries (VDGIF). 2008. VDGIF web page http://www.dgif.virginia.gov/fishing/waterbodies/display.asp?id=11§ion=reports
Virginia Power. 1986. Section 316(a) demonstration for North Anna Power Station. Virginia
Power, Richmond, Virginia.