draft programmatic ea august 2018
TRANSCRIPT


1
2
3
4
5
6
7
8

Draft Programmatic EA August 2018
iii
CONTENTS 1 2 3 NOTATION ........................................................................................................................... viii 4 5 EXECUTIVE SUMMARY ................................................................................................... ES-1 6
7 ES.1 Introduction ............................................................................................................. ES-1 8 ES.2 Purpose and Need for the Proposed Action ............................................................ ES-1 9 ES.3 Proposed Action and Alternatives .......................................................................... ES-1 10 ES.4 Affected Environment............................................................................................. ES-3 11 ES.5 Environmental Consequences ................................................................................. ES-4 12
13 1 INTRODUCTION ........................................................................................................... 1-1 14
15 1.1 Background ............................................................................................................. 1-1 16 1.2 Purpose and Need for the Proposed Action ............................................................ 1-3 17
1.2.1 Management of OCS Oil and Gas Resources ............................................. 1-3 18 1.2.2 Permit Review and Approval ...................................................................... 1-4 19
1.3 How This Document Will Be Used ........................................................................ 1-5 20 1.4 Compliance with Other Environmental Laws ........................................................ 1-6 21
22 2 ALTERNATIVES, INCLUDING THE PROPOSED ACTION ..................................... 2-1 23
24 2.1 Introduction ............................................................................................................. 2-1 25 2.2 Proposed Action and Alternatives .......................................................................... 2-1 26
2.2.1 Alternatives Development .......................................................................... 2-1 27 2.2.2 Alternative 1—Proposed Action: Acceptance, Review, and 28
Authorization of Permit Applications for Conductor Installation, 29 Drilling, Temporary Well Abandonment, and Downhole Operations ........ 2-3 30
2.2.3 Alternative 2—Acceptance, Review, and Authorization of Permit 31 Applications for Conductor Installation, Drilling, Temporary Well 32 Abandonment, and Downhole Operations, with Temporary Time 33 Restrictions for Conductor Installation ....................................................... 2-6 34
2.2.4 Alternative 3—Acceptance, Review, and Authorization of Permit 35 Applications for Drilling, Temporary Well Abandonment, and 36 Downhole Operations ................................................................................. 2-6 37
2.2.5 Alternative 4—Acceptance, Review, and Authorization of Permit 38 Applications Only for Downhole Operations Necessary for Safe 39 Operations or Pollution Prevention............................................................. 2-6 40
2.2.6 Alternative 5—No Action: No Approval of Applications for Permits to 41 Drill or Permits to Modify .......................................................................... 2-6 42
2.2.7 Routine Operations Common to All Alternatives ....................................... 2-8 43 2.3 Alternatives Considered but Eliminated from Further Evaluation ......................... 2-9 44

Draft Programmatic EA August 2018
iv
CONTENTS (Cont.) 1 2 3
2.3.1 Acceptance, Review, and Authorization of Permit Applications for 4 Conductor Installation and for Drilling, but No Use of Well 5 Stimulation Treatments ............................................................................... 2-9 6
2.3.2 Acceptance, Review, and Authorization of APDs for Conductor 7 Installation and Drilling, but No Open Water Discharge of Produced 8 Water or Drilling Wastes ............................................................................ 2-9 9
2.3.3 Acceptance, Review, and Authorization of Permit Applications for 10 New Pipeline Construction or Replacement ............................................... 2-9 11
2.3.4 Acceptance, Review, and Authorization of Permit Applications for 12 Major Platform Modifications .................................................................... 2-9 13
2.4 Environmental Resources Considered in this Assessment ..................................... 2-10 14 2.4.1 Environmental Resources and Socioeconomic Conditions Potentially 15
Affected by Activities Permitted Under the Proposed Action .................... 2-10 16 17 3 AFFECTED ENVIRONMENT ....................................................................................... 3-1 18 19
3.1 Introduction ............................................................................................................. 3-1 20 3.2 Air Quality .............................................................................................................. 3-1 21
3.2.1 Ambient Air Quality Standards .................................................................. 3-1 22 3.2.2 Area Designations ....................................................................................... 3-1 23 3.2.3 Air Emissions .............................................................................................. 3-1 24 3.2.4 Regulatory Controls on OCS Activities Affecting Air Quality .................. 3-3 25
3.3 Acoustic Environment ............................................................................................ 3-3 26 3.4 Water Quality .......................................................................................................... 3-4 27
3.4.1 Regulatory Framework ............................................................................... 3-4 28 3.4.2 Regional Water Quality .............................................................................. 3-4 29 3.4.3 Discharges from Offshore Oil and Gas Activities ...................................... 3-5 30
3.5 Marine and Coastal Invertebrates ........................................................................... 3-6 31 3.6 Marine and Coastal Fish and Essential Fish Habitat .............................................. 3-7 32
3.6.1 Marine and Coastal Fish ............................................................................. 3-7 33 3.6.2 Essential Fish Habitat and Managed Species .............................................. 3-8 34 3.6.3 Special-Status Fish Species ......................................................................... 3-9 35
3.7 Sea Turtles .............................................................................................................. 3-9 36 3.8 Marine and Coastal Birds ....................................................................................... 3-10 37
3.8.1 Seabirds ....................................................................................................... 3-11 38 3.8.2 Shorebirds ................................................................................................... 3-11 39 3.8.3 Waterfowl and Wading Birds ..................................................................... 3-11 40 3.8.4 Special-Status Bird Species ........................................................................ 3-12 41
3.9 Marine Mammals .................................................................................................... 3-12 42 3.9.1 Whales, Dolphins, and Porpoises................................................................ 3-13 43 3.9.2 Seals, Sea Lions, and Sea Otters ................................................................. 3-15 44
3.10 Recreational and Commercial Fisheries ................................................................. 3-15 45 3.10.1 Commercial Fisheries ................................................................................. 3-15 46

Draft Programmatic EA August 2018
v
CONTENTS (Cont.) 1 2 3
3.10.2 Recreational Fisheries ................................................................................. 3-16 4 3.11 Socioeconomics ...................................................................................................... 3-16 5
6 4 ENVIRONMENTAL CONSEQUENCES ...................................................................... 4-1 7
8 4.1 Proposed Action and Alternatives .......................................................................... 4-1 9 4.2 Assessment Approach ............................................................................................. 4-1 10
4.2.1 Impacting Factors........................................................................................ 4-1 11 4.2.2 Assessment of Oil Spill Impacts ................................................................. 4-2 12 4.2.3 Impact Levels .............................................................................................. 4-4 13 4.2.4 Cumulative Impacts .................................................................................... 4-4 14 4.2.5 Incomplete or Unavailable Information ...................................................... 4-5 15
4.3 Environmental Consequences ................................................................................. 4-5 16 4.3.1 Air Quality .................................................................................................. 4-5 17 4.3.2 Noise ........................................................................................................... 4-9 18 4.3.3 Water Quality .............................................................................................. 4-12 19 4.3.4 Marine and Coastal Invertebrates ............................................................... 4-14 20 4.3.5 Marine and Coastal Fish and Essential Fish Habitat .................................. 4-16 21 4.3.6 Sea Turtles .................................................................................................. 4-18 22 4.3.7 Marine and Coastal Birds ............................................................................ 4-19 23 4.3.8 Marine Mammals ........................................................................................ 4-21 24 4.3.9 Commercial and Recreational Fisheries ..................................................... 4-27 25 4.3.10 Socioeconomics .......................................................................................... 4-27 26
4.4 Summary of the Environmental Impacts of the Proposed Action and 27 Alternatives ............................................................................................................. 4-28 28
29 5 LIST OF PREPARERS.................................................................................................... 5-1 30 31 APPENDIX A: REFERENCES ........................................................................................... A-1 32 33 APPENDIX B: ACTIVITIES UNDER THE PROPOSED ACTION THAT REQUIRE 34
AN APPLICATION FOR PERMIT TO DRILL OR AN 35 APPLICATION FOR PERMIT TO MODIFY ........................................... B-1 36
37

Draft Programmatic EA August 2018
vi
FIGURES 1 2 3 1-1 Locations of Current Leases and Platforms Operating on the POCS ........................ 1-2 4 5 2-1 Block 16 of BSEE OCS Operations Form 0124, Application for Permit to 6
Modify, which Identifies the Operation Work Types for which an APM is 7 Required ..................................................................................................................... 2-3 8
9 4-1 Impacting Factors Associated with Alternative 1, the Proposed Action ................... 4-2 10 11 B-1 Schematic of General Platform Configuration Showing Platform Area at Sea 12
Level and Water Depth, and Photograph Showing Exposed Conductor Pipes and 13 Harmony Platform Infrastructure at Sea Level .......................................................... B-1 14
15 B-2 Existing and Sidetrack Wells ..................................................................................... B-4 16 17 18
TABLES 19 20 21 2-1 Alternatives and Associated Permitted Platform Activities ....................................... 2-2 22 23 2-2 Projected Activities at POCS Platforms That Could Be Permitted under the 24
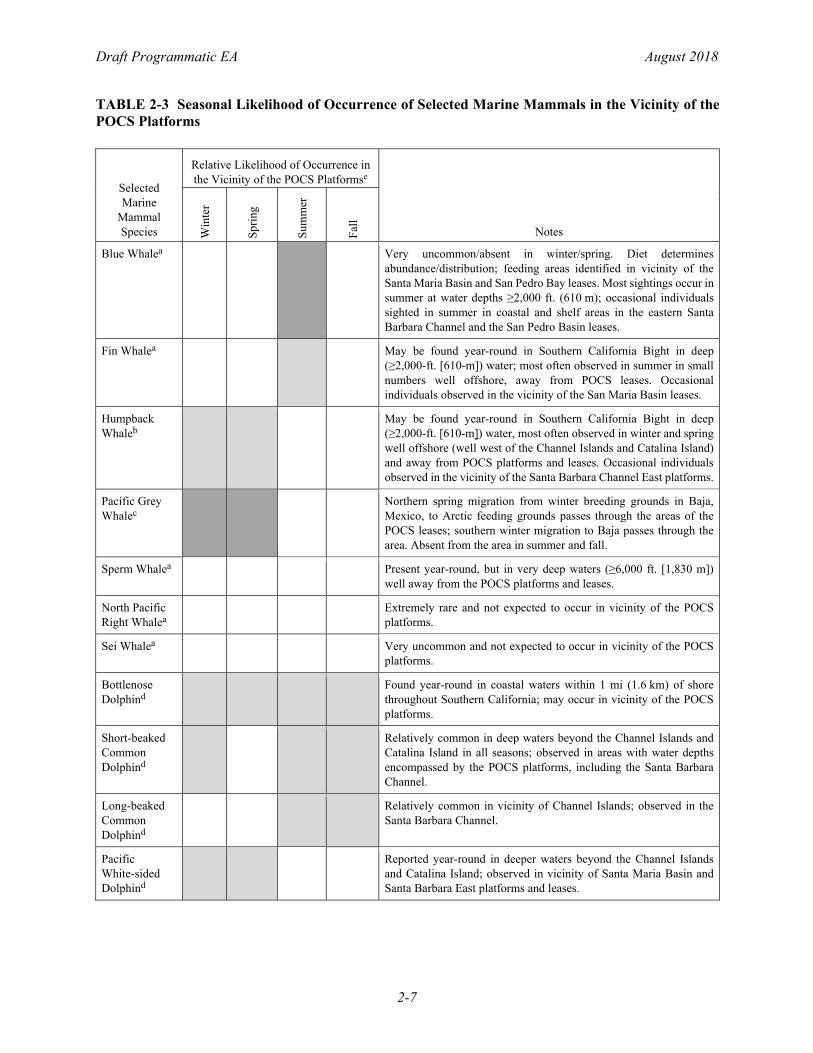
Proposed Action over a 5-Year Period ...................................................................... 2-5 25 26 2-3 Seasonal Likelihood of Occurrence of Selected Marine Mammals 27
in the Vicinity of the POCS Platforms ....................................................................... 2-7 28 29 3-1 Summary of State and Federal Attainment Designation Status for Criteria 30
Pollutants in Santa Barbara, Ventura, Los Angeles, and Orange Counties ............... 3-2 31 32 3-2 2012 Estimated Average Annual Emissions of Criteria Pollutants and Reactive 33
Organic Gases by County and by Source Category ................................................... 3-2 34 35 4-1 Natural Resources Potentially Affected under Alternative 1, the 36
Proposed Action ......................................................................................................... 4-3 37 38 4-2 Impact Levels ............................................................................................................. 4-4 39 40 4-3 Projected Air Emissions from Diesel-Powered Conductor Installation .................... 4-7 41 42 4-4 Projected Air Emissions from Diesel-Powered Well Installation .............................. 4-7 43 44 4-5 Estimated Maximum Downstream Greenhouse Gas Emissions Associated with 45
New Wells and Sidetracking under the Alternative 1—Proposed Action ................. 4-8 46

Draft Programmatic EA August 2018
vii
TABLES (Cont.) 1 2 3 4-6 NMFS Interim Sound Threshold Guidance ............................................................... 4-22 4 5 4-7 Maximum Distances from the Conductor Pipe at Platform Harmony for Interim 6
Level A and Level B Exposure Thresholds to Marine Mammals Based on 7 Maximum Hammer Energy ....................................................................................... 4-23 8
9 4-8 Summary of PTS and TTS Acoustic Thresholds for Marine Mammals .................... 4-23 10 11 4-9 Summary Comparison of Potential Effects Among Alternatives .............................. 4-30 12 13 5-1 List of Preparers ......................................................................................................... 5-1 14 15 B-1 Open Slots, by Platform, Available for New Conductor Installation and Well 16
Drilling ....................................................................................................................... B-3 17 18

Draft Programmatic EA August 2018
viii
NOTATION 1
2
3
The following is a list of acronyms, abbreviations, and units of measure used in this document. 4
Some acronyms used only in tables may be defined only in those tables. 5
6
7
GENERAL ACRONYMS AND ABBREVIATIONS 8
9
APD Application for Permit to Drill 10
APM Application for Permit to Modify 11
ARB Air Resources Board 12
13
BCC bird of conservation concern 14
BOEM Bureau of Ocean Energy Management 15
BOP Blowout Preventer 16
BSEE Bureau of Safety and Environmental Enforcement 17
18
C candidate 19
CAA Clean Air Act 20
CAAQS California Ambient Air Quality Standards 21
CDFW California Department of Fish and Wildlife 22
CDO California District Office 23
CEQ Council on Environmental Quality 24
CFR Code of Federal Regulations 25
COA corresponding onshore area 26
CWA Clean Water Act 27
28
DOI U.S. Department of the Interior 29
DMR Discharge Monitoring Report 30
DPP Development and Production Plan 31
DPS distinct population segment 32
33
E endangered 34
EA environmental assessment 35
EFH essential fish habitat 36
EIS environmental impact statement 37
EP Exploration Plan 38
EPA U.S. Environmental Protection Agency 39
ESA Endangered Species Act of 1972 40
ESU evolutionarily significant unit 41
eWell eWell Permitting and Reporting System 42
43
FMP Fishery Management Plan 44
FONSI Finding of No Significant Impact 45
FR Federal Register 46

Draft Programmatic EA August 2018
ix
GHG greenhouse gas 1
GIS geographic information system 2
GWP global warming potential 3
4
HAPC habitat area of particular concern 5
6
IHA Incidental Harassment Authorization 7
8
MMPA Marine Mammal Protection Act 9
MODU Mobile offshore drilling unit 10
11
NAAQS National Ambient Air Quality Standards 12
NEPA National Environmental Policy Act 13
NMFS National Marine Fisheries Service 14
NOAA National Oceanic and Atmospheric Administration 15
NPDES National Pollutant Discharge Elimination System 16
17
O&G oil and gas 18
OCS Outer Continental Shelf 19
OCSLA Outer Continental Shelf Lands Act 20
OPD Office of Production and Development 21
22
PEA Programmatic Environmental Assessment 23
PFMC Pacific Fishery Management Council 24
PM particulate matter 25
PM10 particulate matter less than 10 microns in diameter 26
PM2.5 fine particulates less than 2.5 microns in diameter 27
POCS Pacific Outer Continental Shelf 28
POTW publicly owned treatment works 29
PTS permanent threshold shift 30
31
ROG reactive organic gas 32
33
SBCAPCD Santa Barbara County Air Pollution Control District 34
SCAQMD South Coast Air Quality Management District 35
SCB Southern California Bight 36
SCC species of special concern 37
SCS southern California steelhead 38
spp. species 39
40
T threatened 41
Tcf Trillion cubic feet 42
TTS temporary threshold shift 43
TW Taxa to watch 44
45

Draft Programmatic EA August 2018
x
U.S.C. United States Code 1
USCG U.S. Coast Guard 2
USFWS U.S. Fish and Wildlife Service 3
4
VCAPCD Ventura County Air Pollution Control District 5
VOC volatile organic compound 6
7
WST well stimulation treatment 8
9
10
CHEMICALS 11
12
CH4 methane 13
CO carbon monoxide 14
CO2 carbon dioxide 15
CO2e carbon dioxide equivalent 16
17
H2S hydrogen sulfide 18
HFCs hydrofluorocarbons 19
20
N2O nitrous oxide 21
NO2 nitrogen dioxide 22
NOx nitrogen oxides 23
24
O3 ozone 25
PAH polyaromatic hydrocarbon 26
27
SO2 sulfur dioxide 28
SOx sulfur oxides 29
30
31

Draft Programmatic EA August 2018
xi
UNITS OF MEASURE 1
2
bbl barrel(s) 3
4
cm centimeter(s) 5
6
dB decibel 7
dBa a-weighted decibel 8
9
ft. foot (feet) 10
11
g gram(s) 12
gal gallon(s) 13
14
Hz hertz 15
16
in. inch(es) 17
18
km kilometer(s) 19
km2 square kilometer(s) 20
kHz kilohertz 21
m meter(s)
mi mile(s)
ppm parts per million
rms root-mean-square
s second
Tcf trillion cubic feet
μPa micropascal

Draft Programmatic EA August 2018
ES-1
EXECUTIVE SUMMARY 1
2
3
ES.1 INTRODUCTION 4
5
The Bureau of Safety and Environmental Enforcement (BSEE) proposes to continue to 6
individually review and, if appropriate, approve new permit applications for well drilling, 7
conductor installation, temporary well abandonment, and other permitted downhole activities at 8
oil and gas platforms on the Pacific Outer Continental Shelf (POCS). Accepting, reviewing, and 9
approving these permits would allow for the continued orderly and environmentally sound 10
production of oil and gas from the reservoirs in the POCS leases. 11
12
In accordance with the National Environmental Policy Act of 1969 (NEPA), BSEE and the Bureau 13
of Ocean Energy Management (BOEM) (collectively, “the Bureaus”) prepared this draft 14
programmatic environmental assessment (PEA) to evaluate the potential environmental impacts 15
of continued BSEE review and approval of permitted oil and gas activities on the POCS. This draft 16
PEA analyzes the potential environmental effects of the activities that could continue to be 17
permitted under the Proposed Action and alternatives. 18
19
20
ES.2 PURPOSE AND NEED FOR THE PROPOSED ACTION 21
22
The Bureaus’ proposed action is for BSEE to continue to individually review and approve new 23
applications for well drilling, conductor installation, temporary well abandonment, and other 24
permit-requiring downhole activities at platforms on existing leases on the POCS. Reviewing and 25
approving new permit applications would allow for the continued orderly and environmentally 26
sound production of oil and gas from lease areas on the POCS using conventional methods. 27
Although all existing leases on the POCS have completed exploration and are in production, 28
lessees and operators continue to request BSEE permit approvals for drilling new well bores 29
(including sidetracks from existing wells), for the installation of conductors to guide future well 30
drilling, and for a variety of downhole activities associated with enhancing production, well 31
maintenance, and water injection wells. Such activities serve to maintain ongoing production, and 32
potentially provide additional access to new reservoirs or better access to, and production from, 33
residual reserves in the existing fields. Lessees and operators also continue to request permit 34
approvals for the temporary abandonment of wells (e.g., when oil production from the well 35
decreases or becomes financially prohibitive due to temporary declines in oil prices). 36
37
38
ES.3 PROPOSED ACTION AND ALTERNATIVES 39
40
This PEA analyzes the following alternatives: 41
42

Draft Programmatic EA August 2018
ES-2
Alternative 1—Proposed Action: Acceptance, Review, and Authorization of Permit 1
Applications for Conductor Installation, Drilling, Temporary Well Abandonment, 2
and Downhole Operations 3
4
Under the Proposed Action, BSEE would continue to accept and review Applications for Permits 5
to Drill (APDs) for conductor installation and well drilling, and Applications for Permits to Modify 6
(APMs) for temporary well abandonment and the following downhole work: 7
8
• Completion, which includes initial completion of a new or sidetrack well, reperforation 9
without increasing or decreasing an existing perforated zone, modifying perforations 10
with the intent to increase or decrease the perforated zone, and moving the production 11
zone from one location to another within a wellbore; 12
13
• Utility Work, which includes converting from an existing well type to a different type 14
(e.g., production to injection), and injecting fluids not previously injected in an existing 15
injection well; 16
17
• Workover Operations, which includes change out (replacement) of existing tubing in a 18
well, and repair of well casing for annular pressure remediation or unwanted 19
communication; and 20
21
• Enhanced Production Operations, which includes providing artificial lift using gas 22
injection or downhole pumps, and performing well washing and desanding. 23
24
Alternative 2—Acceptance, Review, and Authorization of Permit Applications for 25
Conductor Installation, Drilling, Temporary Well Abandonment, and Downhole 26
Operations, with Temporary Time Restrictions for Conductor Installation 27
28
Under Alternative 2, BSEE would continue to accept and review APDs and APMs as under the 29
Proposed Action. However, to minimize the potential to affect marine mammals during conductor 30
installation, BSEE would not authorize conductor installation activities during certain times of the 31
year (i.e., when there is the greatest likelihood of marine mammals being in the project area). 32
33
Alternative 3—Acceptance, Review, and Authorization of Permit Applications for Drilling, 34
Temporary Well Abandonment, and Downhole Operations 35
36
Under this alternative, BSEE would continue to accept and review APDs and APMs as under the 37
Proposed Action, but would no longer accept APDs for new conductor installation, thus avoiding 38
potential impacts from conductor installation. Under this alternative, the numbers of new and 39
sidetrack wells would be similar to those under the Proposed Action. However, new well drilling 40
requiring a conductor would be limited to only platforms with available conductors. 41
42

Draft Programmatic EA August 2018
ES-3
Alternative 4—Acceptance, Review, and Authorization of Permit Applications for 1
Downhole Operations Necessary for Safe Operations or Pollution Prevention 2
3
Under Alternative 4, BSEE would no longer accept or approve APDs for conductor installation or 4
drilling, nor most APMs. BSEE would accept and review APMs for downhole operations deemed 5
necessary to ensure safe operations or pollution prevention of currently permitted and ongoing 6
activities. These downhole operations would be limited primarily to temporary well abandonment 7
and casing pressure repair. 8
9
Alternative 5—No Action: No Approval of Applications for Permits to Drill or Permits to 10
Modify 11
12
Under the No Action Alternative, BSEE would no longer accept or approve APDs or APMs for 13
any activities that currently require permitting, including any APMs for activities related to safety 14
or pollution prevention. This No Action Alternative complies with the NEPA regulations and 15
provides a baseline against which to compare the potential effects of the action alternatives. 16
Ongoing regulatory and statutory requirements would continue to apply, especially those for 17
maintaining safe operations and protecting the environment on the POCS. 18
19
Currently, BSEE-permitted activities (mainly downhole operations) and other ongoing activities—20
such as routine inspection and maintenance, NPDES-permitted operational discharges, and routine 21
support vessel and helicopter traffic—would continue to occur under each of the five alternatives. 22
23
24
ES.4 AFFECTED ENVIRONMENT 25
26
The POCS platforms and their associated 38 leases where activities could be permitted represent 27
the project area for the Proposed Action. The geographic scope of the affected environment 28
includes this project area and the surrounding area, to the extent that potential effects from the 29
Proposed Action could extend beyond the project area. The following resources are evaluated in 30
this PEA for potential impacts from implementation of activities that could be permitted under the 31
Proposed Action: 32
33
• Air Quality: Potential impacts due to emissions from platform- and support-vessel-34
based internal combustion engines associated with well drilling, conductor installation, 35
downhole operations, and helicopter and ship support traffic. 36
37
• Water Quality: Potential impacts from turbidity generated during conductor installation 38
and open-water discharge of drilling wastes. 39
40
• Marine Invertebrates (including special status species1): Potential impacts from 41
turbidity generated during conductor installation and open-water discharge of drilling 42
wastes. 43
1 Special status species are those species listed and protected under the Endangered Species Act (ESA) and/or the
Marine Mammal Protection Act (MMPA).

Draft Programmatic EA August 2018
ES-4
• Marine Fish (including special status species) and Essential Fish Habitat: Potential 1 impacts due to noise from conductor installation, and from turbidity generated during 2 conductor installation and open-water discharge of drilling wastes. 3
4 • Sea Turtles: Potential impacts from noise during conductor installation, and collisions 5
with support vessels. 6 7
• Marine Birds (including special status species): Potential impacts from noise during 8 conductor installation. 9
10 • Marine Mammals (including special status species): Potential impacts from noise 11
during conductor installation, and from collisions with support vessels. 12 13
• Commercial and Recreational Fisheries: Potential impacts from noise and from 14 turbidity generated during conductor installation and open-water discharge of drilling 15 wastes. 16
17 • Socioeconomics: None of the activities that could be permitted under the Proposed 18
Action are expected to significantly affect employment, income, State and local tax 19 revenues, population growth, housing, or community and social services. However, 20 under Alternatives 4 and 5 (the No Action Alternative), oil and gas production may 21 decline more rapidly than under the other alternatives, and thus could result in a more 22 rapid decline in employment, income, and State and local tax revenues. 23
24 The following resources and socioeconomic conditions are not expected to be affected by the 25 activities that could be permitted under the Proposed Action, and thus were not evaluated in this 26 PEA: 27 28
• Geologic resources/seismicity; 29 • Archeological resources; 30 • Recreation and tourism; 31 • Marine protected areas, parks, and preserves; 32 • Military training areas; and 33 • Environmental justice. 34
35 36 ES.5 ENVIRONMENTAL CONSEQUENCES 37 38 If approved and permitted, conductor installation, drilling, and downhole operations conducted at 39 the POCS platforms have the potential to affect a variety of resources. Potential impacts of these 40 activities would be similar in nature and magnitude between Alternatives 1 and 2, except under 41 Alternative 2 there would be no conductor installation-related impacts during times with restricted 42 conductor installation (Table ES-1). Under Alternative 3 (which completely excludes conductor 43 installation), there would be no conductor-related impacts, and impacts would be limited to 44 those identified for drilling and support vessel traffic. None of the potential impacts identified 45 for activities that could be permitted under Alternatives 1, 2, and 3 would occur under 46

Draft Programmatic EA August 2018
ES-5
Alternatives 4 or 5. Given the small number, limited locations, and temporary duration of the 1 activities that are reasonably foreseeable under Alternative 1, none of the alternatives would result 2 in more than short-term, temporary, and localized minor impacts on the environment, with the 3 possible exception of possible moderate impacts on marine mammals from noise during impulsive 4 (hydraulic hammering) conductor installation. Given the temporary, short-term, and highly 5 localized activities that could be permitted under the Proposed Action, the incremental contribution 6 of impacts from the Proposed Action on area resources are not expected to result in significant 7 cumulative impacts when added to past, current, and foreseeable future impacts on these resources. 8 9 Oil and gas production on the POCS has been steadily declining over the last 20 years as the 10 reservoirs decline, and production is expected to continue to decline under each of the alternatives. 11 However, in the absence of new drilling and the use of enhanced production measures, production 12 may decline more rapidly under Alternatives 4 and 5 than under the other alternatives. As a result, 13 overall employment, revenue, and State and local taxes could decline more rapidly under 14 Alternatives 4 and 5 than under the other alternatives, although offshore oil and gas extraction is 15 not a large component of the regional economy. 16

Draft Programmatic EA August 2018
1-1
1 INTRODUCTION 1
2
3
1.1 BACKGROUND 4
5
The Submerged Lands Act of 1953, as amended (43 United States Code [U.S.C.] §§1301 et seq. 6
[67 Stat. 29]) established Federal jurisdiction over submerged lands seaward of State boundaries. 7
The Outer Continental Shelf Lands Act (OCSLA) of 1953, as amended (43 U.S.C. §§1331 et seq.), 8
directs the Secretary of the Interior to establish policies and procedures that expedite exploration 9
and development of the Outer Continental Shelf (OCS) for the production of resources (e.g., oil 10
and natural gas) in a safe and environmentally sound manner. The Secretary oversees the OCS oil 11
and gas program, and under OCSLA is required to balance orderly resource development with 12
protection of the human, marine, and coastal environments while simultaneously ensuring that the 13
public receives an equitable return for these resources. Section 5 of OCSLA grants the Secretary 14
the right to provide for the “prevention of waste and conservation of natural resources” of the OCS. 15
16
There are currently 38 active leases in Federal waters on the Pacific OCS (POCS), with associated 17
oil and gas platforms, pipelines, and supporting infrastructure (Figure 1-1). Within these 38 leases, 18
19 platforms2 currently produce from 14 oil and gas fields.3 The first of these platforms was 19
installed in 1967, and the last two platforms were installed in 1989. By comparison, there are eight4 20
active nearshore drilling and production facilities in State waters off southern California; these 21
include three platforms and five artificial islands (Figure 1-1). 22
23
The Secretary’s responsibilities under OCSLA have been delegated to the Bureau of Ocean Energy 24
Management (BOEM) and the Bureau of Safety and Environmental Enforcement (BSEE; together 25
with BOEM, the Bureaus), and together they are responsible for ensuring that resource exploration, 26
development, and production activities carried out on the POCS comply with the requirements of 27
OCSLA. BOEM is responsible for the environmentally sound economic development of the 28
nation’s offshore resources. BSEE is responsible for safety and environmental oversight of 29
offshore oil and gas operations, including permitting and inspection of offshore oil and gas 30
operations.31
2 There are 23 total platforms on the POCS: 22 platforms produce oil and gas, and one (Platform Elly) processes but
does not produce oil and gas. Among the production platforms, Platform Habitat is currently non-producing.
Platforms Grace and Gail have recently ceased production and are entering the decommissioning process, leaving
19 currently operating production platforms on the POCS.
3 An oil or gas field is a region where multiple oil or gas wells are extracting hydrocarbons from subsurface
formations. An oil and gas reservoir is a subsurface pool of hydrocarbons (i.e., crude oil and natural gas) contained
in porous or fractured rock formations and trapped by overlying rock formations with lower permeability.
4 A ninth nearshore production location in State waters, Platform Holly, ceased production. Its operator, Venoco
LLC, filed for bankruptcy in 2016 and is returning the lease and platform to the State of California for
decommissioning.

Dra
ft Pro
gra
mm
atic E
A
Au
gu
st 201
8
1-2
1
FIGURE 1-1 Locations of Current Leases and Platforms Operating on the POCS (Also shown are platforms and production facilities 2 in nearshore State waters adjacent to the Federal OCS. Platforms in Federal waters are shown and listed in red; those in State waters 3 are indicated in blue. Platform Habitat is currently non-producing. Platforms Gail, Grace, and Holly have initiated decommissioning 4 procedures and are no longer in production.)5

Draft Programmatic EA August 2018
1-3
1.2 PURPOSE AND NEED FOR THE PROPOSED ACTION 1
2
The Bureaus’ Proposed Action is to continue to review and individually approve new applications 3
for well drilling, conductor installation, temporary well abandonment, and other permitted 4
downhole activities at platforms on existing leases on the POCS, thereby allowing for continued 5
orderly and environmentally sound production of oil and gas using conventional methods. For 6
leases with active oil and gas production, lessees and platform operators continue to request BOEM 7
and BSEE approvals of activities for drilling new well bores (including sidetracks from existing 8
wells), the installation of conductors to guide future well drilling, and a variety of downhole 9
activities associated with enhancing production, well maintenance, and water injection wells. Such 10
activities serve to maintain ongoing production, and potentially provide additional access to new 11
reservoirs or better access to, and production from, residual reserves in the existing fields. Lessees 12
and operators also continue to request approvals for the temporary abandonment of wells (e.g., 13
when oil production from the well decreases or becomes financially prohibitive due to temporary 14
declines in oil prices). 15
16
Oil serves as the feedstock for a variety of liquid hydrocarbon products, among them 17
32 transportation fuels and various petrochemicals. Natural gas is generally considered an 18
environmentally preferable alternative to other fossil fuels to generate electricity or for residential 19
and industrial heating, and is an important feedstock for manufacturing fertilizers, 20
pharmaceuticals, plastics, and packaging. In 2016, the United States consumed approximately 21
19.6 million barrels (bbl) of oil per day, of which about 75% was produced domestically and 25% 22
originated from foreign sources (EIA 2017a). In 2016, the United States also consumed about 23
27.5 trillion cubic feet (Tcf) of natural gas, about 90% of which was produced domestically 24
(EIA 2017b). 25
26
1.2.1 Management of OCS Oil and Gas Resources 27
28
The Secretary oversees the OCS oil and gas program under OCSLA, and the Bureaus are charged 29
with this oversight. Together, the Bureaus are responsible for safe and effective management of 30
resources on the OCS in accordance with the Secretary’s obligations and responsibilities under 31
OCSLA. These responsibilities include conserving OCS resources; balancing orderly resource 32
development with protection of the human, marine, and coastal environments; and ensuring that 33
royalties at fair market value are received by the U.S. Treasury from oil and gas production on 34
active OCS leases (43 U.S.C. 1332(3)). 35
36
BOEM functions include offshore oil and gas leasing, resource evaluation, approval of oil and gas 37
exploration plans (EPs) and development and production plans (DPPs), regulating renewable 38
energy development on the OCS, and performing environmental analyses and studies. BOEM 39
develops the National OCS Oil and Natural Gas Leasing Program; oversees assessments of oil, 40
natural gas, and other mineral resource potentials of the OCS; inventories hydrocarbon reserves; 41
develops production projections; and conducts economic evaluations. 42
43
BSEE is responsible for enforcing safety and environmental regulations covering the exploration, 44
development, and production of oil and natural gas and other energy and minerals resources on the 45
OCS. BSEE functions include the development and enforcement of offshore safety and 46

Draft Programmatic EA August 2018
1-4
environmental regulations; permitting certain offshore exploration, development, and production 1
activities, such as those related to drilling and pipelines; inspections of offshore oil and gas 2
facilities and operations; and oil spill preparedness. BSEE’s permitting authority for these 3
proposed activities is pursuant to the OCSLA implementing regulations at 40 CFR Part 250, 4
subpart D. 5
6
1.2.2 Permit Review and Approval 7
8
A platform operator interested in new development and production must submit a DPP to BOEM 9
for review and approval. An operator with an approved DPP must submit an Application for Permit 10
to Drill (APD) to BSEE for approval before commencing any of the activities in the approved DPP 11
(for this programmatic environmental assessment [PEA], conductor installation and drilling are 12
the only development and production activities evaluated). BSEE applies criteria in its regulations 13
to reach a permitting decision and to provide any applicable mitigation measures or conditions of 14
approval (see 30 CFR Part 250), and may approve, approve with modifications or mitigation, or 15
deny the APD. 16
17
BSEE also reviews proposed modifications to approved APDs. An operator proposing 18
modifications to significant aspects of an approved APD must submit an Application for Permit to 19
Modify (APM)5 to BSEE for review and approval. An operator must submit an APM for approval 20
for any well abandonment, production enhancement (e.g., initiating artificial lift or replacing 21
electrical submersible pumps), well workover (e.g., changing tubing or conducting casing pressure 22
repairs), well completion (e.g., modifying perforations), or utility (e.g., changing a well to an 23
injection well) activities. 24
25
The California District Office (CDO) Field Operations Section of BSEE’s POCS Regional Office 26
reviews all APDs and APMs. APD/APM District Production Engineering and Blowout Preventer 27
(BOP) Control System Drawings are reviewed and documented in the eWell Permitting and 28
Reporting System (eWell).6 Concurrently, the Regional Office of Production and Development 29
(OPD) reviews the APDs/APMs for conservation of oil and gas resources and for potential 30
geohazards. The OPD performs a geologic review of proposed well drilling to confirm that drilling 31
would not communicate with active faults or other wellbores. The APM undergoes environmental 32
review (see Section 1.3), and BSEE only approves an APD/APM after determining that the permit 33
5 Per 30 CFR 250.465, an APM (Form BSEE-0124) must be submitted when an operator intends to (1) revise the
drilling plan, change major drilling equipment, or plugback; (2) determine a well’s final surface location, water
depth, and rotary kelly bushing elevation; or (3) move a drilling unit from a wellbore before completing a well.
Plugback refers to the placement of cement or other material in a well to seal off a completion interval, to exclude
bottom water, or to perform another operation such as sidetracking or producing from another depth. The term
plugback also refers to the setting of a mechanical plug in the casing.
6 BSEE’s eWell is a comprehensive Internet permitting and reporting system for collecting information concerning
well operations for each wellbore and well completion. It includes permits required for drilling and other well
operations, as well as data collected for resource evaluation, waste prevention, conservation of natural resources,
and protection of correlative rights, safety, and the environment. The eWell system has a built-in review function
that allows BSEE to accept information submitted by operators in support of permit applications, or request
additional or clarifying information. The eWell database is publically available at http://www.data.bsee.gov/
homepg/data_center/plans/apdform/master.asp.

Draft Programmatic EA August 2018
1-5
application complies with all applicable standards and regulations. The CDO then documents the 1
decision to approve or deny the application in eWell. 2
3
4
1.3 HOW THIS DOCUMENT WILL BE USED 5
6
This draft PEA assists the Bureaus in complying with NEPA. This NEPA analysis will support 7
BSEE as it individually processes oil and gas APDs and APMs for activities on the current active 8
leases and operating platforms on the POCS, and decides whether to approve them. BOEM may 9
also use this NEPA analysis in the event that the Bureaus need to make decisions on any 10
supplemental or revised DPP required as a result of or related to the BSEE review of an APD or 11
APM. In accordance with NEPA, BSEE and BOEM prepared this draft PEA to evaluate the 12
potential environmental impacts of the Proposed Action and alternatives and to inform decisions 13
on future requests to conduct well drilling, conductor installation, and a number of APM-requiring 14
downhole activities on the POCS. BSEE and BOEM are joint lead agencies in the preparation of 15
this draft PEA. In addition, this draft PEA will support the Department of the Interior (DOI) in 16
meeting other environmental requirements (such as those of the Endangered Species Act, Marine 17
Mammal Protection Act, and Coastal Zone Management Act) related to future POCS 18
authorizations. 19
20
If the Bureaus determine that there are no significant impacts from the Proposed Action, a final 21
PEA and associated Finding of No Significant Impact (FONSI) will be issued and no 22
environmental impact statement (EIS) will be prepared. If a FONSI is issued, it will not constitute 23
an immediate approval of potential future activities regulated by the Bureaus. Rather, the final 24
PEA will provide the environmental analysis that will inform individual decisions on future permit 25
applications and assist the Bureaus in complying with NEPA on those individual decisions. 26
27
BSEE will evaluate future APDs or APMs on a case-by-case basis to determine whether new 28
information is available and whether there is a need for additional mitigations of potential 29
environmental effects beyond the programmatic level analyzed in the final PEA. BSEE will 30
conduct an environmental review each time a new APD or APM is received. BSEE will determine 31
whether the proposed activity falls within the scope of this PEA (or some other completed relevant 32
NEPA analyses), whether the environmental impacts have already been fully considered, and 33
whether there are no significant new circumstances or new information relevant to environmental 34
concerns and impacts not analyzed in this PEA. If any of these conditions are not met, BSEE will 35
determine the type of additional NEPA analysis needed, which may require the preparation of a 36
project-specific EA or EIS. 37
38
This draft PEA was prepared in accordance with the Council of Environmental Quality (CEQ) 39
regulations (40 CFR Parts 1500–1508) and DOI implementing regulations (43 CFR Part 46) for 40
NEPA. The draft PEA presents the purpose and need for the Proposed Action, describes the 41
Proposed Action and reasonable alternatives to the Proposed Action, and identifies and evaluates 42
the reasonably foreseeable environmental impacts of the Proposed Action and alternatives. 43

Draft Programmatic EA August 2018
1-6
1.4 COMPLIANCE WITH OTHER ENVIRONMENTAL LAWS 1
2
As described above, the conclusion of this PEA will not represent an immediate and 3
comprehensive approval of potential future regulated activities associated with well drilling and 4
conductor installation. This document analyzes the potential effects of the Proposed Action to 5
determine whether the effects may be significant, and whether or not an EIS may be warranted, 6
consistent with DOI and CEQ regulations implementing NEPA. Endangered Species Act, National 7
Historic Preservation Act, and other environmental consultation or compliance obligations are not 8
triggered merely by the preparation of this programmatic analysis. Regardless of the outcome of 9
this assessment, the Bureaus will continue to review every new application, take into consideration 10
the unique characteristics of each proposal, determine whether existing consultations or 11
compliance processes cover the proposal, engage in additional analyses and consultations deemed 12
appropriate, and prepare a record of compliance with NEPA and all other applicable environmental 13
laws prior to making a decision. 14

Draft Programmatic EA August 2018
2-1
2 ALTERNATIVES, INCLUDING THE PROPOSED ACTION 1
2
3
2.1 INTRODUCTION 4
5
The Proposed Action and alternatives evaluated in this PEA address activities performed by oil 6
and gas operators that require review, approval, and issuance of a permit by BSEE prior to 7
initiation on the POCS. The project area for the Proposed Action and alternatives consists of the 8
38 currently active leases and surrounding areas (Figure 1-1). Under each of the alternatives, 9
currently permitted oil and gas operations on the active leases would continue in accordance with 10
existing plans, permits, and agency regulations. For the purposes of this PEA, the reasonably 11
foreseeable future period during which any of the alternatives evaluated in this PEA may occur 12
over a 5-year period (e.g., 2018–2023).7 BOEM has developed a reasonably foreseeable estimate 13
of the level of activity that could occur over such a time period, taking into account uncertainties 14
in future oil and gas prices and other factors that drive oil and gas production on the POCS. 15
16
17
2.2 PROPOSED ACTION AND ALTERNATIVES 18
19
2.2.1 Alternatives Development 20
21
NEPA and the CEQ regulations mandate the consideration of “reasonable alternatives” for the 22
proposed action. Reasonable action alternatives are those that could be implemented to meet the 23
purpose and need of the proposed action. The alternatives (excluding No Action) evaluated in this 24
PEA encompass various combinations of conductor installation and well drilling, which require 25
an approved APD, and a variety of downhole operations requiring an APM (Table 2-1). Several 26
additional alternatives were initially considered but dropped from further consideration (see 27
Section 2.3). 28
29
The downhole operations that require an APM are associated with the types of work listed in BSEE 30
OCS Operations Form 0124, Application for Permit to Modify (APM) (Figure 2-1). However, not 31
all of these operations are included in the Proposed Action. Under the category “Abandonment of 32
Well Bore,” neither permanent abandonment nor site clearance (i.e., verification that a 33
permanently abandoned well site is clear of obstructions) are addressed in this PEA, because these 34
operations 35
7 In response to the President’s America-First Offshore Energy Strategy, Secretary of the Interior Zinke issued
Secretarial Order 3350 in May 2017 to initiate the development of a new National Outer Continental Shelf Oil and
Gas Leasing Program, with full consideration given to leasing offshore Alaska, Pacific, Mid-Atlantic, South
Atlantic, and the Gulf of Mexico. BOEM released a Draft Proposed National Program at the end of 2017 that
identified potential future lease sales on the POCS. Although no decision has yet been made on a 2019–2024
National Program, a new lease sale or sales could be proposed for the POCS during the new program period.
Should there be a lease sale in the POCS, a new slate of subsequent development and production could change,
perhaps substantially, the number of oil and gas production activities anticipated in this PEA. However, because
the proposed program has not yet been finalized, and because any new activities under a new program would not
take place until after several additional years of planning and analysis (including new NEPA analysis), any
production activities arising from future lease sales in the POCS are not considered foreseeable at this time and
will be appropriately addressed at a later date.

Draft Programmatic EA August 2018
2-2
1
TABLE 2-1 Alternatives and Associated Permitted Platform Activities
Alternatives
Activities
Alternative 1—Proposed Action:
Acceptance, Review and
Authorization of Permit Applications
for Conductor Installation, Drilling,
Temporary Well Abandonment, and
Downhole Operations
• APD-requiring conductor installation
• APD-requiring new well drilling using current or new conductors
• APD-requiring sidetrackinga from existing wellbore
• APM-requiring temporary well abandonment
• APM-requiring enhanced production activitiesb
• APM-requiring workover activitiesc
• APM-requiring completion activitiesd
• APM-requiring utility change in wellse
Alternative 2—Acceptance, Review
and Authorization of Permit
Applications for Conductor
Installation, Drilling, Temporary
Well Abandonment, and Downhole
Operations, with Temporary Time
Restrictions for Conductor
Installation
• APD-requiring conductor installation, with seasonal closures
during marine mammal migration
• APD-requiring new well drilling using current or new conductors
• APD-requiring sidetrackinga from existing wellbore
• APM-requiring temporary well abandonment
• APM-requiring enhanced production activitiesb
• APM-requiring workover activitiesc
• APM-requiring completion activitiesd
• APM-requiring utility change in wellse
Alternative 3—Acceptance, Review
and Authorization of Permit
Applications for Drilling, Temporary
Well Abandonment, and Downhole
Operations
• APD-requiring new wells drilling using only currently installed
conductors
• APD-requiring sidetrackinga from existing wellbore
• APM-requiring temporary well abandonment
• APM-requiring enhanced production activitiesb
• APM-requiring workover activitiesc
• APM-requiring completion activitiesd
• APM-requiring utility change in wellse
Alternative 4—Acceptance, Review
and Authorization of Permit
Applications Only for Downhole
Operations Necessary for Safe
Operations and Pollution Prevention
• APM-requiring temporary well abandonment
• APM-requiring workover activities involving casing pressure
repairc
Alternative 5—No Action: No
Authorization of Permit Applications
• No approval of APDs or APMs
a Includes plugback to sidetrack or bypass.
b Includes artificial lift, jet well, and well washing and desanding.
c Includes change tubing and casing pressure repair.
d Includes initial completion of new wells, reperforation, perforation modification, and perforation zone
changes.
e Includes changing well type to injection, and adding new fluids for injection in existing injection well.

Draft Programmatic EA August 2018
2-3
FIGURE 2-1 Block 16 of BSEE OCS Operations Form 0124, Application for Permit to Modify 1 (APM), which Identifies the Operation Work Types for which an APM is Required 2 3
4
are out of scope for this PEA. However, any APMs received for either of these operations will be 5
reviewed by BSEE, and an appropriate level of NEPA assessment will be conducted on a case-by-6
case basis. 7
8
The “Enhance Production” operations (Figure 2-1) associated with acidizing and hydraulic 9
fracturing were recently evaluated in the PEA for the use of well stimulation treatments (WSTs) 10
on the POCS (BSEE and BOEM 2016), and thus are not addressed in this PEA. The “Information” 11
category includes activities that are administrative, and thus not expected to result in any 12
environmental disturbance. 13
14
The “Other Operations” category is for unique operations or those that do not readily fall into any 15
of the other operation categories. Because activities in this category are undefined, it is not possible 16
to speculate on the nature or number of APMs for Other Operations that BSEE may receive during 17
the 5-year action period considered in this PEA. BSEE will review any such APMs and will 18
conduct an appropriate level of NEPA assessment on a case-by-case basis. 19
20
2.2.2 Alternative 1—Proposed Action: Acceptance, Review, and Authorization of Permit 21
Applications for Conductor Installation, Drilling, Temporary Well Abandonment, 22
and Downhole Operations 23
24
Under the Proposed Action, BSEE would continue to accept and review APDs for conductor 25
installation and well drilling, and APMs for temporary well abandonment and the following 26
downhole work: 27
28
Proposed or Completed Work
16. PROPOSED OR COMPLETED WORK (Describe in Section 17)
PLEASE SELECT ONLY ONE PRIMARY TYPE IN BOLD AND AS MANY SECONDARY
TYPES AS NECESSARY
Completion Workover Enhance Production
Initial Completion Change Tubing Acidize
Reperforation Casing Pressure Repair Artificial Lift
Change Zone Wash/Desand Well
Modify Perforations Abandonment of Well Bore Jet Well
Utility Permanent Abandonment Hydraulic Fracturing
Initial Injection Well Temporary Abandonment Information
Additional Fluids for
Injection
Plugback to
Sidetrack/Bypass
Surface Location Plat
Other Operations Site Clearance Change Well Name
Describe Operation(s)

Draft Programmatic EA August 2018
2-4
• Completion: 1
Initial completion of a new or sidetrack well, 2
Reperforation without increasing or decreasing an existing perforated zone, 3
Modifying perforations with the intent to increase or decrease the perforated zone, 4
Moving production zone from one location to another within a wellbore. 5
6
• Utility Work: 7
Converting from one existing well type to different type (e.g., production to 8
injection), 9
Injecting fluids not previously injected in an existing injection well. 10
11
• Workover Operations: 12
Change out (replacement) of existing tubing in a well, 13
Repair of well casing for annular pressure remediation or unwanted 14
communication. 15
16
• Enhance Production Operations: 17
Providing artificial lift using gas injection or downhole pumps, 18
Using jet or other pumps to start production during a well completion, 19
Performing well washing and desanding requiring wellhead removal. 20
21
Appendix B summarizes the activities that could be permitted under the Proposed Action. 22
23
Activities associated with the inspection, maintenance, and repair of pipelines, risers, and platform 24
infrastructure that do not require a BSEE permit authorization but are required under BSEE 25
regulations would continue to occur under each of the action alternatives, pursuant to compliance 26
with the appropriate regulations. In the event that the work to be permitted under the Proposed 27
Action by an APD or APM would require a revised or supplemental Development and Production 28
Plan (DPP), BOEM’s processing of the DPP may either be covered by this Programmatic EA or 29
require site-specific NEPA analysis. 30
31
Projected Activity Levels under the Proposed Action. The Bureaus have identified a likely level 32
of each activity that could be permitted under the Proposed Action in the reasonably foreseeable 33
future. It is not possible to identify the specific number, timing, or locations where these activities 34
could occur on the POCS in the foreseeable future; these would be determined by the platform 35
operators and identified in their APD and APM submittals. 36
37
BSEE’s eWell system was examined to identify how many APDs and APMs were approved for 38
the POCS between 2012 and 2017 for the activities that could be permitted under the Proposed 39
Action. This information was used to develop annual average numbers of permit approvals for the 40
most recent and complete time period on record in the eWell system. The Bureaus also took into 41
account the most recent forecasts for oil and gas production from the U.S. Energy Information 42
Administration. Finally, the POCS platform operators provided information to BSEE regarding 43
potential future conductor installation at the platforms for 2018–2023 (Salmons 2017). 44
Considering this information, projected permit-requiring activity levels under the Proposed Action 45
were developed for a 5-year period (e.g., 2018–2023) (Table 2-2). 46

Draft Programmatic EA August 2018
2-5
TABLE 2-2 Projected Activities at POCS Platforms That Could Be Permitted under the Proposed Action over a 5-Year Period (e.g., 2018–2023)
Activity Total Initiated Assumptions
Conductor Installation Up to 80; 2–16 at any one platform
No operator planned conductor installation at the Santa Maria Basin platforms, and no installation at the Santa Barbara Channel West platforms due to lack of available slots. New installation only at Platforms Hogan, Houchin, A, B, C, Gilda, Hillhouse, Ellen, and Edith. New conductors at other platforms most likely at platforms with at least five available slots and no available conductors.
Drilling Up to 10 new wells; up to 33 sidetrack
New wells only in slots with conductors. Sidetracking at any production well. No new wells at Platforms Heritage, Hondo, or Henry due to lack of slot/conductor availability.
Vessel Operations Up to 123 Vessels operations for delivery of conductors, drill pipe, drill muds, and other associated supplies. Assumes one vessel trip for each conductor and for each drilling activity.
Additional Helicopter Operations
Up to 123 Helicopter operations to deliver BSEE inspectors during conductor installation or drilling. Assume one operation equals one day of offshore flying.
Temporary Well Abandonment
Up to 32a Assumes 5/yr based on 2012–2017 approved APMs. Years 1–2 include one well at Platform Grace and 22 wells at Platform Gail.
Production Enhancement, Artificial Lift
Up to 55b Assumes 11/yr based on 2012–2017 approved APMs.
Production Enhancement, Jet Well
0–1b Assumes <1/yr based on 2012–2017 approved APMs. A single APM was approved in 2017.
Production Enhancement, Wash/Desand Well
Up to 5b Assumes 1/yr based on 2012–2017 approved APMs. A single APM was approved in 2017.
Utility Work, Initial Injection Well
Up to 10b Assumes 2/yr based on 2012–2017 approved APMs.
Utility Work, Additional Injection Fluids
0–1b Assumes <1/yr based on 2012–2017 APMs.
Workover Operations, Change Tubing
Up to 75b Assumes 15/yr based on 2012–2017 approved APMs.
Workover Operations, Casing Pressure Repair
Up to 15b Assumes 3/yr based on 2012–2017 approved APMs.
Completion, Initial Completion
Up to 20b Assumes 4/yr based on 2012–2017 approved APMs. Also considers projected new well drilling and sidetracking.
Completion, Reperforation Up to 20b Assumes 4/yr based on 2012–2017 approved APMs.
Completion, Modify Perforations
Up to 20b Assumes 4/yr based on 2012–2017 approved APMs.
Completion, Change Zone Up to 5b Assumes 1/yr based on 2012–2017 approved APMs.
a Projected activity levels based on a combination of the 23 wells to be shut down as Platforms Grace and Gail begin pre-decommissioning activities, a rate of 5 APM/year for temporary well abandonment based on eWell reported approved APMs from 2012–2017, and an additional 15% contingency (on the 2012–2017 rate) to capture possible increased permit applications in the event that oil prices decline, making production from some wells uneconomical.
b Projected activity levels based on number of APMs approved 2012–2017 as listed in eWell unless otherwise noted.

Draft Programmatic EA August 2018
2-6
2.2.3 Alternative 2—Acceptance, Review, and Authorization of Permit Applications for 1
Conductor Installation, Drilling, Temporary Well Abandonment, and Downhole 2
Operations, with Temporary Time Restrictions for Conductor Installation 3
4
Under Alternative 2, BSEE would continue to accept and review APDs and APMs as under the 5
Proposed Action. However, to minimize the potential for affecting marine mammals during 6
conductor installation (i.e., by conductor installation noise and ship strikes by support vessel 7
traffic), BSEE would not authorize conductor installation activities during certain times of the year 8
(i.e., when there is the greatest likelihood of marine mammals being in the project area). 9
10
The occurrence patterns of marine mammals in the project area (Table 2-3) suggest two possible 11
seasonal closure periods, each of which may reduce exposure of some species that may occur in 12
the vicinity of the POCS platforms and leases. A summer closure period may reduce potential 13
exposure to two whale (blue and fin) and three dolphin (bottlenose, short-beaked, and long-beaked) 14
species. A winter closure may reduce potential exposure to two different whale species (humpback 15
and Pacific grey) and three dolphin species (bottlenose, short-beaked, and Pacific white-sided). 16
17
2.2.4 Alternative 3—Acceptance, Review, and Authorization of Permit Applications for 18
Drilling, Temporary Well Abandonment, and Downhole Operations 19
20
Under this alternative, BSEE would continue to accept and review APDs and APMs as under the 21
Proposed Action, but would no longer accept APDs for new conductor installation, thus avoiding 22
potential impacts from conductor installation. Under this alternative, the numbers of new and 23
sidetrack wells and associated support vessel traffic and BSEE helicopter inspector flights would 24
be similar to those under the Proposed Action. However, new well drilling requiring a conductor 25
would be limited to only platforms with available conductors already in place (Appendix B). 26
27
2.2.5 Alternative 4—Acceptance, Review, and Authorization of Permit Applications Only 28
for Downhole Operations Necessary for Safe Operations or Pollution Prevention 29
30
Under Alternative 4, BSEE would no longer accept or approve APDs for conductor installation or 31
drilling, nor APMs for most downhole operations. BSEE would accept and review APMs for 32
downhole operations deemed necessary to ensure safe operations or pollution prevention of 33
currently permitted as well as routine activities (see Section 2.2.7). The operations that could be 34
permitted under this alternative would be limited primarily to temporary well abandonment and 35
casing pressure repair. Based on the number of APMs approved from 2012 to 2017, as many as 36
32 APMs for temporary well abandonment and 15 APMs for casing pressure repair may be 37
expected over a 5-year period (Table 2-2). 38
39
2.2.6 Alternative 5—No Action: No Approval of Applications for Permits to Drill or Permits 40
to Modify 41
42
Under the No Action Alternative, BSEE would no longer accept or approve APDs or APMs for 43
any activities currently requiring permit authorization, including any APMs for activities related 44
to safety or pollution prevention. The Bureaus employ this No Action alternative to comply with 45
the NEPA regulations and provide a baseline against which to compare the potential effects of the 46
Draft Programmatic EA August 2018
2-7
TABLE 2-3 Seasonal Likelihood of Occurrence of Selected Marine Mammals in the Vicinity of thePOCS Platforms
Selected Marine
Mammal Species
Relative Likelihood of Occurrence in the Vicinity of the POCS Platformse
Win
ter
Spr
ing
Sum
mer
Fal
l
Notes
Blue Whalea Very uncommon/absent in winter/spring. Diet determines abundance/distribution; feeding areas identified in vicinity of the Santa Maria Basin and San Pedro Bay leases. Most sightings occur in summer at water depths ≥2,000 ft. (610 m); occasional individuals sighted in summer in coastal and shelf areas in the eastern Santa Barbara Channel and the San Pedro Basin leases.
Fin Whalea May be found year-round in Southern California Bight in deep (≥2,000-ft. [610-m]) water; most often observed in summer in small numbers well offshore, away from POCS leases. Occasional individuals observed in the vicinity of the San Maria Basin leases.
Humpback Whaleb
May be found year-round in Southern California Bight in deep (≥2,000-ft. [610-m]) water, most often observed in winter and spring well offshore (well west of the Channel Islands and Catalina Island) and away from POCS platforms and leases. Occasional individuals observed in the vicinity of the Santa Barbara Channel East platforms.
Pacific Grey Whalec
Northern spring migration from winter breeding grounds in Baja, Mexico, to Arctic feeding grounds passes through the areas of the POCS leases; southern winter migration to Baja passes through the area. Absent from the area in summer and fall.
Sperm Whalea Present year-round, but in very deep waters (≥6,000 ft. [1,830 m]) well away from the POCS platforms and leases.
North Pacific Right Whalea
Extremely rare and not expected to occur in vicinity of the POCS platforms.
Sei Whalea Very uncommon and not expected to occur in vicinity of the POCS platforms.
Bottlenose Dolphind
Found year-round in coastal waters within 1 mi (1.6 km) of shore throughout Southern California; may occur in vicinity of the POCS platforms.
Short-beaked Common Dolphind
Relatively common in deep waters beyond the Channel Islands and Catalina Island in all seasons; observed in areas with water depths encompassed by the POCS platforms, including the Santa Barbara Channel.
Long-beaked Common Dolphind
Relatively common in vicinity of Channel Islands; observed in the Santa Barbara Channel.
Pacific White-sided Dolphind
Reported year-round in deeper waters beyond the Channel Islands and Catalina Island; observed in vicinity of Santa Maria Basin and Santa Barbara East platforms and leases.

Draft Programmatic EA August 2018
2-8
TABLE 2-3 (Cont.)
Selected
Marine
Mammal
Species
Relative Likelihood of Occurrence in
the Vicinity of the POCS Platformse
Win
ter
Spri
ng
Sum
mer
Fal
l
Notes
Risso’s
Dolphind
Reported from deeper waters south and west of Catalina Island, well
away from the San Pedro Bay platforms and leases.
Dall’s
Porpoised
Occurs largely in deep waters (>5,000 ft. [1,520 m]) well away from
the POCS platforms and leases.
a Listed as endangered under the Endangered Species Act (ESA), and as depleted under the Marine Mammals Protection Act
(MMPA).
b Individuals from both ESA endangered and threatened Distinct Population Segments.
c Eastern North Pacific population delisted from ESA; protected under MMPA.
d Protected under MMPA.
e Dark grey = season most likely to occur in vicinity of platforms and leases; light grey = may occur in vicinity of platforms
and leases; white = not observed, absent, or not likely to occur in vicinity of platforms and leases.
Sources: BOEM and BSEE (2017b); Douglas et al. (2014); Campbell et al. (2015); Calambokidis et al. (2015); Bearzi and Saylan
(2011); NOAA Fisheries 2016 Marine Mammal Stock Assessment Reports.
1
2
action alternatives. However, BSEE notes that ongoing regulatory and statutory requirements 3
would continue to apply, especially those for maintaining safe operations and protecting the 4
environment on the OCS. Importantly, BSEE would enforce a shut-in of wells posing a serious or 5
threatening violation of safety regulations by issuing an Incident of Noncompliance. 6
7
2.2.7 Routine Operations Common to All Alternatives 8
9
Under each of the alternatives, including No Action, routine activities associated with the 10
inspection, maintenance, and repair of pipelines, risers, and platform infrastructure (e.g., decking 11
painting or replacement, electric upgrades) would continue. These activities that do not require a 12
BSEE permit authorization but are required under BSEE regulations at 30 CFR Part 250 would 13
continue to occur, pursuant to compliance with the appropriate regulations (e.g., pipeline 14
inspections compliant with 30 CFR 250.1005; riser inspections compliant with 30 CFR 250.739). 15
16
Supply vessel traffic and helicopter flights conveying platform workers and BSEE inspectors 17
would continue to occur under each of the alternatives. Crew and supply ships average about 18
16 trips per week per platform on the POCS (BOEM and BSEE 2017a,b). Helicopter flights 19
supporting operations on the POCS platforms average between 45,000 and 50,000 miles per year 20
(BOEM and BSEE 2017a,b), while flights supporting BSEE inspectors averaged 317 per year 21
between 2013 and 2016, with an average total annual fight duration of 371 flight hours per year. 22

Draft Programmatic EA August 2018
2-9
2.3 ALTERNATIVES CONSIDERED BUT ELIMINATED FROM FURTHER 1 EVALUATION 2
3 The Bureaus considered but eliminated from further evaluation in this PEA four other potential 4 alternatives. BSEE and BOEM determined these alternatives either encompassed activities that 5 had previously undergone NEPA analysis and were approved for use on the POCS platforms, were 6 not reasonably foreseeable, or are so uncertain that it is not possible to develop an activity 7 description sufficient to allow for an adequate NEPA evaluation. Thus, BSEE and BOEM did not 8 carry these alternatives forward for analysis in this PEA. 9 10 2.3.1 Acceptance, Review, and Authorization of Permit Applications for Conductor 11
Installation and for Drilling, but No Use of Well Stimulation Treatments 12 13 The use of WSTs on the POCS recently underwent a NEPA evaluation (BSEE and BOEM 2016), 14 and a finding of no significant impact (FONSI) was issued regarding WST use at the POCS 15 production platforms. 16 17 2.3.2 Acceptance, Review, and Authorization of APDs for Conductor Installation and 18
Drilling, but No Open Water Discharge of Produced Water or Drilling Wastes 19 20 The 2016 PEA on the use of WSTs on the POCS (BSEE and BOEM 2016) included an alternative 21 that prohibited the open-water discharge of produced water or drilling wastes generated during the 22 use of WSTs. That analysis determined that the open-water discharge of produced water and 23 drilling wastes subject to a U.S. Environmental Protection Agency National Pollutant Discharge 24 Elimination Permit (with or without WST-related constituents) posed no significant environmental 25 effects. 26 27 2.3.3 Acceptance, Review, and Authorization of Permit Applications for New Pipeline 28
Construction or Replacement 29 30 A review of inspection reports for pipelines on the POCS indicates that all current pipelines on the 31 POCS have a 20-year predicted life expectancy or more, and thus the need for major replacement 32 of any POCS pipelines is not expected in the foreseeable future (BSEE and BOEM 2017). The 33 existing pipelines also meet current production and processing needs of oil and gas operations on 34 the POCS. Because overall production on the POCS is expected to continue to decline, a need for 35 new pipelines is not considered likely for the foreseeable future. 36 37 2.3.4 Acceptance, Review, and Authorization of Permit Applications for Major Platform 38
Modifications 39 40 The type of modification that may occur will vary considerably among platforms, depending on 41 platform-specific needs. Therefore, it is not possible to identify the nature, number, or magnitude 42 of any major modifications that may occur on the POCS platforms in the foreseeable future. To 43 date, there have been no permit applications for major platform modifications on any of the POCS 44 platforms, and none are expected in the foreseeable future. 45 46

Draft Programmatic EA August 2018
2-10
2.4 ENVIRONMENTAL RESOURCES CONSIDERED IN THIS ASSESSMENT 1
2
To determine which aspects of the environment could be affected with implementation of the 3
activities that could be permitted under the Proposed Action, a review was conducted to identify 4
the environmental resources and the socioeconomic and sociocultural (including environmental 5
justice) conditions that are present in the vicinity of the platforms on the POCS. Sources of 6
information for this review included previously prepared EAs for oil and gas-related activities at 7
one or more of the active POCS platforms (BSEE and BOEM 2016; BOEM 2014a; BOEMRE 8
2011; MMS 2009), the open scientific literature, and agency reports. Based on this review, a 9
number of resources and conditions were identified that may be affected by activities that could 10
be permitted under the Proposed Action, and these are evaluated in this PEA. 11
12
2.4.1 Environmental Resources and Socioeconomic Conditions Potentially Affected by 13
Activities Permitted Under the Proposed Action 14
15
The following resources and socioeconomic conditions are evaluated in this PEA for potential 16
impacts from implementation of activities that could be permitted under the Proposed Action: 17
18
• Air Quality: Potential impacts from emissions from platform- and support-vessel-based 19
internal combustion engines associated with well drilling, conductor installation, 20
downhole operations, and helicopter and ship support traffic. 21
22
• Water Quality: Potential impacts from sediment resuspension during conductor 23
installation, and open-water discharge of drilling wastes. 24
25
• Marine Invertebrate Resources (including special status species8): Potential impacts 26
from sediment resuspension during conductor installation and from open-water 27
discharge of drilling wastes. 28
29
• Marine Fish (including special status species) and Essential Fish Habitat: Potential 30
impacts due to noise from conductor installation, and disturbance from sediment 31
resuspension during conductor installation and from open-water discharge of drilling 32
wastes. 33
34
• Sea Turtles: Potential impacts from noise during conductor installation, and from 35
collisions with support vessels. 36
37
• Marine Birds (including special status species): Potential impacts from noise during 38
conductor installation, and artificial lighting. 39
40
• Marine Mammals (including special status species): Potential impacts from noise 41
during conductor installation, and from collisions with support vessels. 42
43
8 Special status species are those species listed and protected under the ESA and/or the MMPA.

Draft Programmatic EA August 2018
2-11
• Commercial and Recreational Fisheries: Potential impacts due to disturbance of fish 1
by noise and sediment resuspension during conductor installation. 2
3
• Socioeconomics: None of the activities associated with the Proposed Action are 4
expected to significantly affect employment, income, State and local tax revenues, 5
population growth, housing, or community and social services. However, under 6
Alternatives 4 and 5 (No Action), oil and gas production may decline more quickly 7
than under any of the other alternatives, which could result in a more rapid decline in 8
local employment, income, and state and local tax revenues. 9
10
A number of resources and socioeconomic conditions are not expected to be affected by the 11
activities that could be permitted under the Proposed Action, and thus were not evaluated for 12
activity-related impacts. These resources and conditions are as follows: 13
14
• Geologic Resources/Seismicity: None of the activities that could be permitted are 15
expected to affect geologic resources on the POCS, and all APDs and APMs for drilling 16
would undergo review to ensure that the proposed drilling operations will not 17
communicate with active faults. 18
19
• Archeological Resources: No impacts on archeological resource are anticipated, 20
because none of the activities that could be permitted will affect seafloor areas where 21
such resources may occur. Bottom disturbance would only occur during conductor 22
installation. This would be restricted to an area within the footprint of an existing 23
platform, and such areas have previously been surveyed and cleared. 24
25
• Recreation and Tourism: Neither tourism nor recreation are expected to be affected, 26
because all activities that could be permitted would occur well offshore and away from 27
areas used for coastal recreation and tourism activities. Any permitted activities are 28
also not expected to affect offshore recreational boating, whale watching, or deep-sea 29
fishing, because support vessel traffic is not expected to result in visual or noise 30
annoyance to tourists or recreationists, or in recreational space-use conflicts. 31
32
• Marine Protected Areas, Parks, and Preserves: Because of the distance from the 33
active POCS platforms to any marine protected areas, activities that could be permitted 34
under the Proposed Action are not expected to affect the purpose or use of such areas. 35
36
• Military Training Areas: A variety of military use areas (air space and water areas) and 37
installations occur in coastal and offshore areas of Southern California, and some of 38
the POCS platforms are located within or near these areas and installations. Use of 39
military use areas would not be affected by any activities that could be permitted under 40
the Proposed Action. This is also the case for coastal military installations. The POCS 41
platforms are several nautical miles offshore from any coastal military installations, 42
and thus permitted activities that could occur at the platforms would not affect the 43
installations or interfere with their operations. Newly permitted activities would not 44
affect either danger zones (water areas used for target practice, bombing, rocket firing, 45
or other especially hazardous operations, normally for the armed forces) or restricted 46

Draft Programmatic EA August 2018
2-12
areas (water areas designated for the purpose of prohibiting or limiting public access in 1
order to provide security for government property and/or protection to the public from 2
the risks of damage or injury arising from the government’s use of that area). 3
4
• Environmental Justice: None of the activities that could be permitted under the 5
Proposed Action are expected to result in any adverse effects on minority or low-6
income populations. All the permitted activities would use existing infrastructure and 7
facilities, and would occur on already-operating platforms. Although some low-income 8
and minority populations occur around Port Hueneme and the Port of Los Angeles, 9
from which staging of supplies (e.g., conductors) and personnel could occur, none of 10
the permitted activities are expected to increase activities at these ports to levels that 11
could disproportionately affect low-income or minority populations. 12

Draft Programmatic EA August 2018
3-1
3 AFFECTED ENVIRONMENT 1
2
3
3.1 INTRODUCTION 4
5
The Proposed Action would apply to oil and gas operations and activities within 38 active leases 6
in Federal waters of the Pacific Outer Continental Shelf (POCS). For this Programmatic 7
Environmental Assessment (PEA), the 38 leases where the permitted activities may be carried out 8
represent the project area for the Proposed Action (Figure 1-1). The affected environment 9
described within this chapter includes the project area, and those additional areas outside of the 10
project area where the direct or indirect effects of the proposed action may occur. 11
12
13
3.2 AIR QUALITY 14
15
3.2.1 Ambient Air Quality Standards 16
17
Under the Clean Air Act (CAA), the U.S. Environmental Protection Agency (EPA) has established 18
the National Ambient Air Quality Standards (NAAQS) for six principal pollutants (known as 19
“criteria” pollutants) (40 CFR 50). These pollutants are ozone (O3), particulate matter (PM) with 20
aerodynamic diameters of 10 microns (m) or less and 2.5 m or less (PM10 and PM2.5, 21
respectively), carbon monoxide (CO), nitrogen dioxide (NO2), sulfur dioxide (SO2), and lead (Pb) 22
(EPA 2017a). Collectively, the levels of these criteria pollutants are indicators of the overall quality 23
of the ambient air. The California Air Resources Board (ARB) has established separate standards, 24
the California Ambient Air Quality Standards (CAAQS) (ARB 2017a), for the same NAAQS six 25
criteria pollutants. In general, the CAAQS are more stringent than the NAAQS, except for the 1-hr 26
NO2 and SO2 standards established in 2010. 27
28
3.2.2 Area Designations 29
30
The EPA and ARB each designate whether areas are in attainment9 with the NAAQS and CAAQS, 31
respectively. The four counties that border the Southern California OCS (Santa Barbara, Ventura, 32
Los Angeles, and Orange counties) are all in attainment with NAAQS and CAAQS for CO, NO2, 33
and SO2, while one or more of the counties are in nonattainment for one or more of the other 34
criteria pollutants (Table 3-1). 35
36
3.2.3 Air Emissions 37
38
The estimated average annual emissions of criteria pollutants and reactive organic gases (ROG), 39
which play a major role in the generation of photochemical oxidants in the atmosphere, in each of 40
the four coastal counties along the project area are presented in Table 3-2 (ARB 2017c). Los 41
Angeles County accounts for about two-thirds of the total annual emissions of all criteria pollutants 42
and ROG; Orange County is the second-highest contributor to regional emissions; and Santa 43
Barbara and Ventura counties are the smallest contributors.44
9 An area may be in attainment for one criteria pollutant but in nonattainment for the others. Areas may also be
designated as unclassified; that is, there is insufficient information to determine attainment.

Draft Programmatic EA August 2018
3-2
TABLE 3-1 Summary of State and Federal Attainment Designation Statusa for Criteria Pollutants 1 in Santa Barbara, Ventura, Los Angeles, and Orange Counties 2
O3
PM10
PM2.5
CO
NO2
SO2
Pb
County State Fed.
State Fed.
State Fed.
State Fed.
State Fed.
State Fed.
State Fed.
Santa Barbara N A/U
N U
U A/U
A A/U
A A/U
A U
A A/U
Ventura N N
N U
A A/U
A A/U
A A/U
A A
A A/U
Los Angeles N N
N A/U
NP NP
A A/U
A A/U
A A/U
A NP
Orange N N
N A
N N
A A/U
A A/U
A A
A A/U
a A = attainment; N = nonattainment; NP = nonattainment in part of the county; and U = unclassified. Nonattainment is 3 highlighted in gray. 4
Sources: ARB (2017b); EPA (2017b). 5
6 TABLE 3-2 2012 Estimated Average Annual Emissions (tons per day) of Criteria Pollutants and 7 Reactive Organic Gases by County and by Source Category 8
Emission Source
ROG CO NOx SOx PM10 PM2.5 County
Santa Barbara 31.24 99.09 72.55 12.18 14.53 5.49 Ventura 35.77 130.17 41.27 1.90 16.42 5.81 Los Angeles 293.02 1,339.74 348.82 15.84 98.03 43.86 Orange 92.70 413.84 81.47 1.51 23.00 10.52
Four-county total 452.73 1,982.84 544.11 31.43 151.98 65.68 Source Category
Fuel Combustion 11.15 54.94 47.92 6.97 6.74 5.87 Waste Disposal 9.01 1.24 2.08 0.56 0.32 0.22 Cleaning & Surface Coatings 39.09 0.05 0.09 0.01 1.34 1.29 Petroleum Production & Marketing 34.20 5.66 1.44 2.41 1.76 1.53 Industrial Processes 8.86 0.83 0.62 0.62 16.57 6.51 Solvent Evaporation 102.41 0.00 0.00 0.00 0.01 0.01 Miscellaneous Processes 12.70 66.63 19.70 0.52 90.30 27.98 On-road Motor Vehicles 142.02 1,193.61 265.71 1.72 23.61 12.14 Other Mobile Sources 93.29 659.88 206.55 18.62 11.33 10.13
Four-county total 452.73 1,982.84 544.11 31.43 151.98 65.68
Source: ARB (2017c). 9 10 11 Natural emission sources in the project area include biogenic emissions from plants and trees, 12 geogenic emissions from marine seeps on the continental shelf, wildfires, and windblown dust. In 13 Santa Barbara and Ventura counties, natural emissions are comparable to or higher than man-made 14 emissions for ROG or PM (ARB 2017c). Geogenic emissions in this region are largely limited to 15 Santa Barbara and Ventura counties, where they are as much as 60% and 11%, respectively, of 16 average annual man-made ROG emissions totals for these counties. 17

Draft Programmatic EA August 2018
3-3
In general, greenhouse gas (GHG) emissions data are not available at the county level. In 1
California, the total Statewide gross10 GHG emissions in 2012 (the most recent year for which 2
information is available) were estimated to be about 442 million metric tons (MMT) carbon 3
dioxide equivalent (CO2e)11 (ARB 2017d), which would be about 6.6% of the total GHG 4
emissions for the United States (EPA 2017c). About 84% of the California total GHG emissions 5
are carbon dioxide (CO2), followed by methane (CH4, 9.0%), high-global-warming potential 6
GHGs12 (3.9%), and nitrous oxide (N2O, 2.8%). Transportation (about 37%) is the single largest 7
source of GHG emissions in California, followed by industrial sources (24%) and electricity 8
production (20%). 9
10
3.2.4 Regulatory Controls on OCS Activities Affecting Air Quality 11
12
The EPA has promulgated requirements (40 CFR Part 55) to control air pollution from POCS 13
sources. However, it has delegated its oversight of offshore facilities (including the POCS 14
platforms) to the local air districts that regulate the facilities. These local air districts regulate 15
emissions from offshore platforms with Permits to Operate that define permitted emissions from 16
specified platform-based equipment (e.g., diesel engines) and service vessels. 17
18
19
3.3 ACOUSTIC ENVIRONMENT 20
21
Along the U.S. west coast, long-term monitoring data suggest an average increase of about 22
3 decibels (dB) per decade in low-frequency ambient noise as shipping in the region has increased 23
(Andrew et al. 2002; McDonald et al. 2006, 2008). Ambient noise levels at a given frequency and 24
location may vary widely on a daily basis, and a wider range of ambient noise levels occurs in 25
shallow water (depths less than 656 ft. [200 m]) than in deeper water. Ambient noise sources 26
(especially noise from wave and tidal action) can cause particularly high ambient noise levels in 27
coastal environments. 28
29
Natural sources of ambient noise in the POCS are wind and wave activity, including surf noise 30
near the beaches; noise from rain and hail; lightning noise; and biological noise from marine 31
mammals, fishes, and crustaceans (Greene 1995; URI 2017). Anthropogenic noise sources in the 32
project area include transportation, dredging and construction, oil and gas operations, geophysical 33
surveys, and sonar. Noise levels from most human activities are greatest at relatively low 34
frequencies (<500 Hertz [Hz]). Offshore oil and gas activities produce a variety of underwater and 35
airborne noises, and these are generally below 1,000 Hz (Greene and Moore 1995). Onshore 36
coastal construction activities may also propagate into coastal waters (Greene and Moore 1995). 37
38
10 Excluding GHG emissions removed due to forestry and other land uses.
11 A measure to compare the emissions from various GHGs on the basis of the global warming potential (GWP),
defined as the ratio of heat trapped by one unit mass of the GHG to that of one unit mass of CO2 over a specific
time period. For example, GWP is 25 for CH4, 298 for N2O, and 22,800 for sulfur hexafluoride (SF6). Accordingly,
CO2e emissions are estimated by multiplying the mass of a gas by the GWP.
12 These are the fluorinated GHGs, including SF6, nitrogen trifluoride (NF3), perfluorocarbons (PFCs), and
hydrofluorocarbons (HFCs).

Draft Programmatic EA August 2018
3-4
Transportation-related noise sources include aircraft (both helicopters and fixed-wing aircraft), 1
commercial and recreational boating, and commercial ship traffic (e.g., supply ships serving the 2
POCS platforms, large container vessels, and supertankers). In shallow water, shipping traffic more 3
than 6 mi (10 kilometers [km]) away from a receiver generally contributes only to background 4
noise. However, in deep water, low-frequency components of ship traffic noise may be detectable 5
up to 2,485 mi (4,000 km) away and may contribute to background noise levels (Greene 1995). 6
7
8
3.4 WATER QUALITY 9
10
3.4.1 Regulatory Framework 11
12
Section 402 of the Clean Water Act (CWA) authorizes the EPA to issue National Pollutant 13
Discharge Elimination System (NPDES) permits to regulate the discharges of pollutants to waters 14
of the United States, the territorial sea, contiguous zone, and ocean. Since the introduction of the 15
NPDES program, the Southern California Bight (SCB), in which the project area is located, has 16
seen great reductions in pollutants from all sources, including 50% reductions in suspended solids, 17
90% in combined trace metals, and more than 99% in chlorinated hydrocarbons. These decreases 18
have occurred despite great increases in population and in volumes of discharged wastewater 19
(MMS 2001). Source control, pretreatment of industrial wastes, and treatment plant upgrades have 20
combined to accomplish these reductions (MMS 2001; Lyon and Stein 2009). 21
22
Discharges from the POCS platforms are regulated under NPDES General Permit No. CAG 23
280000 (effective March 1, 2014, through February 28, 2019) (EPA 2013a).The NPDES General 24
Permit regulates 22 types of platform discharges, and sets forth effluent limitations and monitoring 25
and reporting requirements, including pollutant monitoring and toxicity testing of effluents. The 26
point of compliance for effluents is the edge of the mixing zone, which extends laterally 328 ft. 27
(100 m) in all directions from the discharge point and vertically from the ocean surface to the 28
seabed. The NPDES General Permit does not apply to discharges from vessels supporting platform 29
operations, which are regulated by the U.S. Coast Guard. 30
31
3.4.2 Regional Water Quality 32
33
Water quality in the SCB is generally good, particularly in the Santa Maria Basin area and points 34
north because of low population and lack of major industry in adjacent coastal areas. In contrast, 35
the Santa Barbara Channel region, which extends from Point Conception to Point Fermin and 36
includes 12 of the 19 producing POCS oil platforms, has larger influxes of pollutants from coastal 37
municipal sewage treatment discharges, power plant cooling water discharges, and industrial waste 38
sources than points further to the north. Recent water quality surveys have found that at a bight-39
wide scale, natural nutrient sources make a larger contribution of nutrients than anthropogenic 40
sources, but at smaller spatial scales, anthropogenic and natural nitrogen sources were comparable 41
within orders of magnitude in some locations (Howard et al. 2012, 2014). 42

Draft Programmatic EA August 2018
3-5
Major sources of pollutants to the project area include agricultural runoff, publicly owned 1
treatment work (POTW) and chlorinated power plant cooling water outfalls, and atmospheric 2
fallout from metropolitan areas (MMS 2001, 2005; Kaplan et al. 2010; Lyon and Stein 2010). 3
Among these, POTWs represent the largest point source contributors to the SCB. Other important 4
regional inputs include chemicals from harbors, dumping activities, dredging, vessel traffic, 5
military activities, and industrial activities such as oil production (Kaplan et al. 2010). Untreated 6
stormwater runoff from the SCB watershed represents a large non-point source of suspended 7
solids, pollutants, and nutrient loads to the SCB. Noble et al. (2003) found that 96% of the shoreline 8
met water quality standards during dry weather, but 58% of the shoreline failed water quality 9
standards during wet weather, typically from late fall to early spring. Stormwater is an episodic 10
input to the SCB, producing visible turbidity plumes, while POTWs produce continuous inputs. 11
12
Offshore oil and gas operations are relatively smaller contributors of pollution but contribute 13
relatively higher amounts of hydrocarbon pollutants than the other anthropogenic sources 14
mentioned (Lyon and Stein 2010). The largest contributors of hydrocarbons to offshore waters are 15
the naturally occurring seeps within the Santa Barbara Channel. These seeps often produce 16
localized, visible sheens on the water and lead to the production of tar balls commonly found on 17
beaches after weathering and oxidation of oil (Hostettler et al. 2004; Farwell et al. 2009). 18
Approximately 50 oil seeps occur off the shore of Southern California between Point Arguello and 19
Huntington Beach. At least 38 of these seeps are located in the Santa Barbara Channel and release 20
an estimated 40–670 bbl of crude per day to the channel, with the greatest releases near the Coal 21
Oil Point Seep (MMS 2005). This seep field off the shore of Goleta, California, is approximately 22
6.9 mi2 (18 km2) and emits an estimated 50–170 bbl of oil and 100–130 tons of natural gas per 23
day (Hornafius et al. 1999). Farwell et al. (2009) has described an associated 55-mi2 (90-km2) 24
plume on the near-west seafloor estimated to contain 3.1 × 10⁴ metric tons of petroleum in the top 25
1.9 in. (5 cm) of sediments. 26
27
3.4.3 Discharges from Offshore Oil and Gas Activities 28
29
Offshore discharges from past and present oil and gas operations in State and Federal waters 30
include cooling water, produced water, sanitary waste, fire control system test water, well 31
completion fluids, and miscellaneous other liquids. Of these, produced water represents by far the 32
greatest discharge of petroleum-related chemical constituents. Well completion and treatment 33
fluids represent the second-largest (but relatively minor) source of chemical discharges to POCS 34
waters. 35
36
Offshore facilities may discharge treated produced water to the ocean per the NPDES General 37
Permit or may inject it into an offshore subsurface reservoir. Producing platforms that do not 38
discharge produced water transfer the water either to other platforms or to an onshore facility for 39
treatment and disposal. The onshore facilities may dispose of the produced water through injection 40
to a subsurface reservoir, or may transfer the treated water back to an offshore platform for disposal 41
via injection or permitted discharge to the ocean. All permitted ocean discharges must meet the 42
permit discharge limits and are tracked through quarterly Discharge Monitoring Reports required 43
by the NPDES permits (Kaplan et al. 2010). All discharges in compliance with the NPDES General 44
Permit contribute negligible degradation to water quality of the project area. 45

Draft Programmatic EA August 2018
3-6
All platforms that discharge produced water under the NPDES General Permit do so either directly 1 or via another platform (Houseworth and Stringfellow 2015). Platforms Irene, Ellen, and Eureka 2 primarily reinject produced water into producing formations. Platform Elly, a processing-only 3 platform, sends the produced water it receives from other platforms to platforms Ellen and Eureka 4 for subsequent reinjection. Other NPDES-permitted platform discharges are associated with well 5 treatment, workover, and completion fluids (Kaplan et al. 2010). These chemicals fall into three 6 categories: 7 8
• Production-treating chemicals: scale inhibitors, corrosion inhibitors, biocides, 9 emulsion breakers, and water-treating chemicals, including reverse emulsion breakers, 10 coagulants, and flocculants; 11
12 • Gas-processing chemicals: hydrate inhibitors, dehydration chemicals, and occasionally 13
H2S removal chemicals; and 14 15
• Stimulation and workover chemicals: mineral acids, dense brines, and other additives. 16 17 Detailed descriptions of the amounts and compositions of the various permitted discharges 18 (e.g., produced water, drilling wastes, operational fluids) that may occur at the POCS platforms 19 can be found in BSEE and BOEM (2016). 20 21 22 3.5 MARINE AND COASTAL INVERTEBRATES 23 24 The POCS platforms in the Santa Maria Basin are located within the cold-temperate waters of the 25 Oregonian Province, while the platforms within the Santa Barbara Channel and San Pedro Bay fall 26 within the warm-temperate waters of the San Diego Province (NMFS 2015z). The physical and 27 water quality conditions of the two provinces and the transition zone between them have resulted 28 in the development of variety of distinctive subtidal benthic habitats and communities in the 29 project area (Seapy and Littler 1978; Blanchette and Gaines 2007). The subtidal zone is the 30 permanently submerged area below the low tide line. Because of the water depths at which the 31 POCS platforms occur (95–1,200 ft. [29–366 m]), only subtidal habitats in deeper waters have a 32 potential to be affected under the Proposed Action. Benthic community composition within these 33 habitats is strongly determined by bottom type, which can be hard bottom (e.g., rock, cobble, 34 boulder) or soft sediment (sand, mud, or a mixture). 35 36 A variety of corals and anemones, starfish and sea urchins, sponges, worms, and crustaceans 37 dominate the benthic communities in hard-bottom habitats (Blake and Lissner 1993; Diener and 38 Lissner 1995). The POCS platforms and pipelines also provide hard surfaces for hard-bottom 39 communities in the project area, and surveys of some platforms and pipelines in the project area 40 have found diverse hard-bottom communities growing on these structures (CSA 2005; Love and 41 York 2005). Soft-bottom subtidal habitats in the project area also support diverse invertebrate 42 communities, dominated by a variety of amphipod crustaceans, polychaetes, echinoderms, and 43 molluscs (MMS 2001 citing SAIC 1986; Hyland et al. 1990; Blake and Lissner 1993; Bergen et al. 44 2001; Allen et al. 2011; Ranasinghe et al. 2012; Gillette et al. 2017). 45

Draft Programmatic EA August 2018
3-7
The benthic habitats and communities of the SCB appear to be generally healthy, with less than 1 2% classified as moderate to highly disturbed (these are mostly in estuarine and marina areas) 2 (Schiff et al. 2016; Gillette et al. 2017). More detailed discussions of the benthic resources in the 3 project area can be found in BSEE and BOEM (2016). 4 5 Special-Status Invertebrate Species. The black abalone (Haliotis cracherodii) and the white 6 abalone (H. sorenseni) are listed as endangered (74 FR 1937 and 66 FR 29054, respectively) under 7 the ESA. Critical habitat has been designated under the ESA only for the black abalone in a variety 8 of rocky subtidal and intertidal areas in the project area, including the shorelines of the Channel 9 Islands and the coastline south of Point Conception (76 FR 66841). The range of the white abalone 10 extends along the Pacific Coast from Point Conception south to Punta Abreojos, Baja California, 11 Mexico. 12 13 The black abalone populations along the California coast south of Monterey County, California, 14 have been estimated to have declined by as much as 95% (Neuman et al. 2010), while there has 15 been a 99% reduction in white abalone abundance since the 1970s (Smith et al. 2003). Regulatory 16 measures the State of California has taken during the past 30 years, including the closure of the 17 white abalone fishery in 1996 and the closure of all abalone fisheries in Central and Southern 18 California waters in 1997, have proven inadequate for recovery (NMFS 2008a). Historical and/or 19 ongoing threats to both species include commercial overfishing, habitat destruction, and, more 20 recently in the case of the black abalone, withering syndrome disease. Additional life history 21 information, including recovery efforts, for these species can be obtained from the U.S. Fish and 22 Wildlife Service (USFWS) Endangered Species Program (www.fws.gov/endangered). 23 24 25 3.6 MARINE AND COASTAL FISH AND ESSENTIAL FISH HABITAT 26 27 The following sections provide summary overviews of the marine and coastal fishes and essential 28 fish habitat (EFH) in the project area. More detailed discussions of these resources appear in BSEE 29 and BOEM (2016). 30 31 3.6.1 Marine and Coastal Fish 32 33 The POCS supports a diverse fish community reflective of the diverse habitats and the presence 34 of cold and warm water masses divided by Point Conception (Dailey et al. 1993). Of the 35 554 species of California marine fishes, more than 480 species may occur in the SCB (Horn 1974 36 cited in MMS 2001). The life history varies greatly differ among species in terms of seasonal 37 movements and occurrence; spawning location, season, and frequency; and depth and habitat 38 distribution. Broadly, fish species found in the POCS can be characterized as diadromous, pelagic, 39 soft-bottom demersal, or reef-associated, based on habitat associations and life history traits. 40 41 Diadromous fish, such as salmon, are species that move from oceanic feeding grounds to inland 42 freshwater streams for spawning. The predominant diadromous species found in Southern 43 California waters is the federally endangered steelhead salmon (Oncorhynchus mykiss), which is 44 further discussed in Section 3.6.3. 45

Draft Programmatic EA August 2018
3-8
Pelagic species occur at various depths throughout the water column and occupy a number of 1
trophic levels. Pelagic species common in Southern California waters include plankton-feeding 2
northern anchovy, Pacific sardine, Pacific herring, and Pacific mackerel, and larger predatory fish 3
such as tuna, swordfish, and sharks. Some species are migratory and may be present in the POCS 4
only in certain seasons. Commercial and recreational fisheries harvested in the project area include 5
many pelagic fish species (Section 3.10). 6
7
Soft-bottom demersal fish are bottom-dwelling species associated with sand and mud-bottom 8
habitats. More than 150 species of fish have been identified from such habitats in Southern 9
California waters (Allen et al. 2011); some of the more abundant and widespread are various 10
species of soles and sanddab (Allen et al. 2011; Miller and Schiff 2012). Other common soft-11
bottom demersal species include croaker, surfperch, turbot, rockfish, sculpin, and Pacific hake 12
(Miller and Schiff 2012). 13
14
Reef fish are structure-oriented species inhabiting hard-bottom habitats and their associated sessile 15
communities (e.g., mussel and kelp beds). More than 75 reef fish species have been reported in the 16
SCB, including common species such as kelp bass, California sheephead, garibaldi, and black 17
perch (Pondella et al. 2012). Reef fish also congregate around the POCS platforms and associated 18
pipelines, which provide highly productive fish habitats (Claisse et al. 2014). Rockfish and lingcod 19
are frequently observed species near platforms, while rockfishes, sanddabs, and comb fishes are 20
typically found along pipelines (Love and York 2005). 21
22
3.6.2 Essential Fish Habitat and Managed Species 23
24
EFH pertains to habitat “required to support a sustainable fishery and the managed species’ 25
contribution to a healthy ecosystem,” and is defined as the water and substrate necessary for fish 26
spawning, breeding, feeding, and growth to maturity (50 CFR Part 600). The Magnuson-Stevens 27
Fishery Conservation and Management Act (MSA; 16 U.S.C. 1801 et seq.) as amended by the 28
Sustainable Fisheries Act on October 11, 1996, requires regional fishery management councils, 29
with assistance from the National Marine Fisheries Service (NMFS), to delineate EFH and habitat 30
areas of particular concern (HAPCs) in Fishery Management Plans (FMPs) for all Federally 31
managed fisheries. The Pacific Fishery Management Council (PFMC) has designated species-32
specific EFHs for four fishery management groups in the Pacific region, and FMPs have been 33
developed for each group: 34
35
• Pacific coast groundfish, 87 species; 36
• Coastal pelagic species, 9 species; 37
• Highly migratory species, 13 species; and 38
• Pacific coast salmon, 3 species. 39
40
The EFHs for these species cover all waters and substrate with depths less than or equal to 2 mi 41
(3,500 m), the upriver extent of saltwater intrusion in coastal rivers, and seamounts in depths 42
greater than 2 mi (3.5 km). It is not uncommon for EFHs to overlap within and across the four 43
fishery management groups. All the POCS leases and platforms are located within multiple 44
designated EFHs. 45
46

Draft Programmatic EA August 2018
3-9
The FMPs for two of the four management groups identify a number of HAPCs (PFMC 2016a). 1
No HAPCs have been designated for coastal pelagic or highly migratory species (PFMC 2016b). 2
The Pacific Coast Salmon FMP designates five HAPCs for the salmonids (PFMC 2016c). 3
Estuaries and submerged aquatic vegetation are the primary HAPCs in the project area. The Pacific 4
Coast Groundfish FMP identifies a number of HAPCs for groundfish, including estuaries, canopy 5
kelp, seagrass, rocky reefs, and “areas of interest,” which in the project area include the Cowcod 6
Conservation Areas and the Channel Islands National Marine Sanctuary. 7
8
3.6.3 Special-Status Fish Species 9
10
Several species of marine and coastal fish in Southern California waters have been Federally listed 11
as threatened or endangered under the ESA. These species are the green sturgeon (Acipenser 12
medirostris), the steelhead (Oncorhynchus mykiss), the scalloped hammerhead shark (Sphyrna 13
lewini), and the tidewater goby (Eucyclogobius newberryi). Information regarding life histories, 14
distribution, status, and recovery efforts for these species can be obtained from the USFWS 15
Endangered Species Program (www.fws.gov/endangered). Of these, only the steelhead may 16
possibly occur near the POCS platforms and be potentially affected by the proposed activities. 17
18
Steelhead. The NMFS has identified 10 distinct evolutionarily significant units (ESUs)13 of 19
steelhead, two of which are listed as endangered and eight of which are listed as threatened 20
(50 CFR 223 and 224). Only the Southern California steelhead ESU (endangered) may occur in 21
the project area. The range of this ESU extends from the Santa Maria River basin to the U.S.–22
Mexico border. The Santa Ynez, Ventura, and Santa Clara Rivers, as well as the Matilija Creek, 23
have had significant historical steelhead runs (Good et al. 2005). The distribution and life history 24
of the steelhead are described in NMFS (2012). 25
26
27
3.7 SEA TURTLES 28
29
Five species of sea turtle occur in the POCS offshore of Southern California. Three species are 30
Federally endangered: the hawksbill sea turtle (Eretmochelys imbricata bissa), leatherback sea 31
turtle (Dermochelys coriacea), and loggerhead sea turtle (North Pacific Ocean Distinct Population 32
Segment [DPS]) (Caretta caretta); and two species are Federally threatened: the green sea turtle 33
(Chelonia mydas) (East Pacific DPS) and olive ridley sea turtle (Lepidochelys olivacea). No 34
known nesting habitat for any of the five species occurs in the project area. Threats to sea turtles 35
throughout their ranges include incidental capture, entanglement, and injury/death from fishing 36
gear; marine debris; environmental contamination; disease, loss, or degradation of nesting habitat; 37
beach armoring; artificial lighting; non-native vegetation; and directed harvest (NMFS 2014c). 38
Additional life history information, including recovery efforts, for these species is available from 39
the National Oceanic and Atmospheric Administration (NOAA) Fisheries, Protected Species 40
Program (http://www.nmfs.noaa.gov/pr/species/turtles). 41
42
13 An ESU is a population of organisms considered distinct for conservation purposes. To be considered an ESU, the
population must be reproductively isolated from other populations of the same species and must represent an
important component of the evolutionary legacy of the species (61 FR 4722).

Draft Programmatic EA August 2018
3-10
Green Sea Turtle. Although the green sea turtle is uncommon along the California coast, it may 1
be present year-round off Southern California, with highest numbers observed in July through 2
September (BSEE 2011). It is usually seen in El Niño years when ocean temperatures are warmer 3
than normal. A few green sea turtles are regularly seen in Orange County near the San Gabriel 4
River (California Herps 2017). Similarly, a Long Beach power plant warms the waters of the San 5
Gabriel River (Sahagun 2008), where a small colony of green sea turtles now resides (California 6
Herps 2017). This colony is inshore from the San Pedro Bay Platforms. 7
8
Hawksbill Sea Turtle. The hawksbill sea turtle is only occasionally observed in waters from Point 9
Conception to the U.S.–Mexico border and usually during El Niño years (California Herps 2017). 10
It therefore may occasionally be present near the POCS platforms. This species is most commonly 11
associated with healthy coral reefs but also inhabits coastal waters in rocky areas, mangrove-12
bordered bays, estuaries, mud-bottomed lagoons, and, occasionally, deep water (NMFS 2014d; 13
California Herps 2017). 14
15
Leatherback Sea Turtle. The leatherback sea turtle may be most common sea turtle in U.S. waters 16
north of Mexico but is rarely seen (PXP 2012). This species may be sighted from Port Arguello 17
southward through the Santa Barbara Channel (California Herps 2017), but is absent from the area 18
in winter. Critical habitat has been designated in the coastal area from Point Arguello northward 19
and inshore of the 3,000-m depth contour (NMFS 2012), which is near Platform Irene in the San 20
Maria Basin. 21
22
Loggerhead Sea Turtle. The loggerhead sea turtles found in Southern California waters are 23
presumed to be members of the North Pacific Ocean DPS (NMFS and USFWS 2011). Most 24
sightings off the California coast are of juveniles and tend to occur from July to September, 25
although in El Niño years observations can occur over most of the year. This species is primarily 26
pelagic but occasionally enters coastal bays, lagoons, salt marshes, estuaries, creeks, and mouths 27
of large rivers, and in the project area has been observed at scattered locations from Point 28
Conception southward to the U.S.–Mexico border (California Herps 2017). 29
30
Olive Ridley Sea Turtle. The olive ridley sea turtle is the most abundant sea turtle in the world, 31
with an estimated 800,000 females nesting annually (NMFS 2014d). This species is highly 32
migratory and spends much of its non-breeding life cycle in the oceanic zone (NMFS and USFWS 33
2014d), but is known to inhabit coastal areas (e.g., bays, estuaries) (NMFS 2014d). This species 34
rarely occurs along the California coast but has been reported off Point Conception (California 35
Herps 2017). 36
37
38
3.8 MARINE AND COASTAL BIRDS 39
40
A diverse assemblage of birds occurs within Southern California. Some species breed in the area 41
and others occur only as non-breeding summer residents, winter residents, or migrants. The 42
Channel Islands are especially important areas, providing essential nesting and feeding grounds 43
for 99% of seabirds in Southern California, and important wintering areas and stopover points for 44
shorebirds (Kaplan et al. 2010; NPS 2017). More than 385 species have been recorded in the 45
immediate vicinity of the northern Channel Islands (Collins 2011). NMSP (2008), Collins (2011), 46

Draft Programmatic EA August 2018
3-11
SAIC (2011), and PXP (2012) list the coastal and marine bird species and their occurrence. 1
Additional information can be found in BSEE and BOEM (2016), as well as in the cited references. 2
3
3.8.1 Seabirds 4
5
More than 50 seabird species have been documented between Cambria, California, and the 6
Mexican border, an area that includes the POCS platforms (Mason et al. 2007). Common nearshore 7
seabird species (e.g., loons, grebes, gulls, terns) (Mason et al. 2007) in general are unlikely to occur 8
with any regularity near the POCS platforms. More likely to occur near platforms are the pelagic 9
seabirds (e.g., shearwaters, storm-petrels, cormorants, phalarope, albatross, and the California 10
brown pelican [Pelecanus occidentalis]), which generally occur over deeper waters (Mason et al. 11
2007). Although they are generally present throughout the year, their abundance varies seasonally. 12
13
Twenty seabird species are known to breed in Southern California, almost entirely on the Channel 14
Islands. These include the California brown pelican, Scripps’s murrelet (Synthliboramphus 15
scrippsi), Cassin’s auklet (Ptychoramphus aleuticus), and double-crested cormorant 16
(Phalacrocorax auritus) (Mason et al. 2007; NPS 2017). Other areas of elevated seabird 17
abundance within the project area include Point Conception, the Santa Monica Basin, Anacapa 18
Island, Bolsa Bay, and Palos Verdes/Bolsa Chica (Sydeman et al. 2012). For many seabirds, the 19
region off Point Conception is a particularly important foraging area (SAIC 2011). 20
21
Some seabird species (e.g., California brown pelican, cormorants, gulls) habitually use the 22
substructure of POCS platforms for nighttime roosting (Johnson et al. 2011). This association is 23
due more to the availability of appropriate structures for roosting than to the lighting on the 24
platforms (Johnson et al. 2011). 25
26
3.8.2 Shorebirds 27
28
While more than 40 shorebird (e.g., plovers, sandpipers) species have been recorded from Southern 29
California, fewer than 25 species occur regularly in the project area. Few shorebirds (e.g., black 30
oystercatcher [Haematopus bachmani]) breed in the area (Arata and Pitkin 2009; Rodriguez et al. 31
2011), with most species migrating to the area in the fall to overwinter and leaving in spring for 32
northern breeding grounds. The Channel Islands are a particular important wintering and migratory 33
stopover area (NPS 2017). Areas adjacent to the Southern California POCS and commonly used 34
by shorebirds include Mugu Lagoon, the Santa Clara River mouth, Carpinteria Marsh, Goleta 35
Slough, and the Santa Ynez River mouth (MMS 2001). 36
37
3.8.3 Waterfowl and Wading Birds 38
39
Waterfowl and wading birds inhabit coastal freshwater, brackish, and saltwater wetlands, such as 40
Carpinteria Marsh and Mugu Lagoon and various river and stream mouths. About 25 species of 41
wading birds (e.g., herons, egrets, rails, and coot) have been reported from the coastal regions of 42
Southern California. About 40 waterfowl species (geese, ducks, and mergansers) also occur in the 43
coastal areas of Southern California. 44

Draft Programmatic EA August 2018
3-12
3.8.4 Special-Status Bird Species 1
2
Eighteen special-status species, including four Federally listed species, have been reported from 3
the Southern California POCS and may occur in the project area. Species accounts for the Federally 4
listed species can be obtained from the USFWS Endangered Species Program 5
(www.fws.gov/endangered), while species accounts for California-listed species can be obtained 6
from the California Department of Fish and Wildlife Bird Species of Special Concern Program 7
(www.wildlife.ca.gov/Conservation/SSC/Birds). The following paragraphs present short 8
summaries of the presence of each of the Federally listed threatened or endangered species. 9
10
Light-footed Ridgway’s Rail (Rallus obsoletus levipes). This Federally endangered species 11
inhabits coastal salt marshes from Santa Barbara County south to Baja California (Zembal et al. 12
1989, 1998; Zembal and Hoffman 1999). No critical habitat has been designated for this species. 13
Marshes in the vicinity of the project area where nesting pairs have been documented include 14
Mugu Lagoon in Ventura County and Seal Beach, Bolsa Chica, Huntington Beach Wetlands, and 15
Upper Newport Bay in Orange County (Zembal et al. 2016). 16
17
Western Snowy Plover (Charadrius n. nivosus). The Pacific Coast DPS of the western snowy 18
plover is Federally listed as threatened. Its critical habitat is associated with coastal beach-dune 19
ecosystems along the Pacific Coast, and 23 critical habitat units have been designated along the 20
project area. These critical habitat units represent 11% of the total designated critical habitat for 21
the species (USFWS 2012). This plover breeds and winters along the coasts of Santa Barbara, 22
Ventura, Los Angeles, and Orange counties and on several of the Channel Islands. 23
24
Marbled Murrelet (Brachyramphus m. marmoratus). This Federally threatened species is found 25
in Washington, Oregon, and California, where it spends most of its life in the nearshore marine 26
environment but nests and roosts inland. There is no critical habitat for this species designated near 27
the project area (USFWS 2016). This murrelet is a very rare late summer, fall, and winter visitor 28
to the Santa Barbara County coast, but a somewhat more regular visitor in late summer in the 29
Vandenberg Air Force Base area (Marantz 1986; Lehman 2014). This species occurs less 30
frequently south of Point Conception, but occasionally is observed off Ventura and Malibu and in 31
Santa Monica Bay (eBird 2017). 32
33
California Least Tern. A summer visitor to California, this Federally listed endangered species 34
breeds on sandy beaches close to estuaries and embayments from San Francisco Bay south into 35
Baja California. In the project area, California least terns breed along the coasts of Santa Barbara, 36
Ventura, Los Angeles, and Orange counties. No critical habitat has been designated for this 37
species. Fall migration to wintering grounds in Central and South America begins in late July and 38
ends by mid-September (USFWS 2006). 39
40
41
3.9 MARINE MAMMALS 42
43
The waters offshore of Southern California support a diverse marine mammal community 44
(Jefferson et al. 2014a; Carretta et al. 2016a,b; Muto et al. 2016a,b) which includes a variety of 45
whales, dolphins, porpoises, seals, and the southern sea otter (Enhydra lutris nereis). All marine 46

Draft Programmatic EA August 2018
3-13
mammals that occur in the project area are protected under the Marine Mammal Protection Act 1
(MMPA), and eight species are Federally listed under the ESA. The blue whale (Balaenoptera m. 2
musculus), fin whale (Balaenoptera physalus physalus), humpback whale (Megaptera 3
novaeangliae), North Pacific right whale (Eubalaena japonica), sei whale (Balaenoptera borealis 4
borealis), and sperm whale (Physeter macrocephalus) are endangered, while the Guadalupe fur 5
seal (Arctocephalus townsendi) and the southern sea otter are threatened. All the Federally listed 6
species are under the jurisdiction of the NMFS, except the southern sea otter, which is under the 7
jurisdiction of the USFWS. The following sections provide summaries of the marine mammals 8
that may occur in the project area. 9
10
3.9.1 Whales, Dolphins, and Porpoises 11
12
At least 8 species of baleen whales and 23 species of toothed whales have been reported from the 13
Southern California Planning Area (Carretta et al. 2016a,b; Jefferson et al. 2014b; Kaplan et al. 14
2010; Maxon Consulting 2014; Muto et al. 2016a,b; NMFS 2015a–y; 2016a,c,e,f; 2017a–d; 15
Smultea and Jefferson 2014). 16
17
In general, the species most often observed in coastal and shelf waters are the humpback and gray 18
whales, and the bottlenose, Risso’s dolphin, and long-beaked common dolphins. The sperm whale 19
is observed most often in pelagic waters, and blue whales, fin whales, short-beaked common 20
dolphins, Pacific white-sided dolphins, and Dall’s porpoise in coastal, shelf, and pelagic waters 21
(Campbell et al. 2014, 2015; Douglas et al. 2014). The following paragraphs discuss Federally 22
listed threatened and endangered whales, dolphins, and porpoises that may be present in the project 23
area. Additional information on these species is available from NOAA Fisheries 24
(http://www.nmfs.noaa.gov/pr/species/mammals). 25
26
Blue Whale. The blue whale is a Federally listed endangered species (USFWS 1970). The Eastern 27
North Pacific stock, which frequents the waters off California, has been estimated to be about 28
1,600 individuals (Carretta et al. 2016a). Within the project area, blues whales are observed most 29
often in the central and eastern portions of the Santa Barbara Channel (Whale Alert-West Coast 30
2017). Most observations occur in July and August, with fewer observations in January through 31
April (Širović et al. 2015; Debich et al. 2017; Whale Alert-West Coast 2017). Concentrations of 32
feeding animals have been reported from June through October in the following areas: 33
34
• The area of Point Conception/Arguello, close to the Santa Maria Basin platforms and 35
western portion of the Western Santa Barbara Channel platforms; 36
37
• Santa Barbara Channel and the San Miguel area, close to the Western Santa Barbara 38
Channel platforms; and 39
40
• Santa Monica Bay to Long Beach, close to the San Pedro Bay platforms (Calambokidis 41
et al. 2015). 42
43
Fin Whale. The fin whale is Federally listed as endangered, typically occurring in social groups 44
of two to seven individuals. While fin whales may be present year-round off Southern California, 45
the greatest number of observations typically occur in summer (Debich et al. 2017; Whale 46

Draft Programmatic EA August 2018
3-14
Alert-West Coast 2017). Within the project area, most observations have been in the eastern 1
portion of the Santa Barbara Channel (Whale Alert-West Coast 2017). 2
3
Gray Whale. The Western North Pacific stock of gray whales is Federally listed as endangered, 4
but the Eastern North Pacific stock is de-listed (USFWS and NMFS 1994). However, it is 5
impossible to visually differentiate between the two stocks, and gray whales from the Western 6
North Pacific stock are rare visitors to the Southern California POCS. Each year, gray whales 7
migrate along the California coast between summer feeding grounds in the Arctic and calving 8
grounds in lagoons on the Baja Peninsula. In the project area, the peak southbound migration is in 9
January, and the peak northbound migration is in March, with individuals observed moving in both 10
directions during January and February (CMLPAI 2009). In the project area, most observations 11
are from the eastern portion of the Santa Barbara Channel, including in the immediate vicinity of 12
the POCS platforms in that area (Whale Alert-West Coast 2017). 13
14
Humpback Whale. The humpback whale is Federally listed as endangered. While reported 15
sightings in Southern California waters typically peak in May through September, this species has 16
been observed year-round (Debich et al. 2017; Whale Alert-West Coast 2017). In the project area, 17
relatively high concentrations of feeding whales have been reported from March through 18
September in the Santa Barbara Channel–San Miguel area (Calambokidis et al. 2015), and 19
numerous observations have been in the eastern portion of the Santa Barbara Channel, including 20
in the immediate vicinity of the POCS platforms in that area (Whale Alert-West Coast 2017). 21
22
North Pacific Right Whale. The North Pacific right whale is Federally listed as endangered 23
(NMFS 2008b). Sightings of this species off the coast of California and Mexico are rare, and there 24
is no evidence that these areas were ever regularly frequented by this species (Reilly et al. 2008). 25
Although this species has been observed in the past off the Channel Islands in 1981, 1990, and 26
1992 (Kaplan et al. 2010), there have been no observations in the project area since 1999 (Whale 27
Alert-West Coast 2017). Thus, North Pacific right whales are not expected to occur near any of 28
the POCS platforms. 29
30
Sei Whale. The sei whale is Federally listed as endangered. This species is very uncommon, and 31
where it occurs it is usually observed alone or in small groups of two to five animals 32
(NMFS 2015f). Observations in Southern California waters are extremely rare (Kaplan et al. 33
2010). During extensive surveys conducted between 1991 and 2008, only nine confirmed sightings 34
of sei whales were made in California, Oregon, and Washington waters (BOEM and BSEE 2017b). 35
Thus, sei whales are not expected to occur near any of the POCS platforms. 36
37
Sperm Whale. The sperm whale is Federally listed as endangered. This species tends to occur in 38
deep waters (depths >3,280 ft. [1,000 m]) (Kaplan et al. 2010; Maxon Consulting 2014; NMFS 39
2017c). The sperm whale is widely distributed and may be found year-round in Southern California 40
waters, with peak occurrence from April through mid-June and from the end of August through 41
mid-November (Maxon Consulting 2014). Within the project area, there have been only sporadic 42
observations since 1999, with one observation in March 2004 near the Santa Barbara Channel-43
East Platforms (Whale Alert-West Coast 2017). However, more than 50 sperm whales, including 44
mothers and calves, were observed off Orange County in October 2014 during a period of 45
unusually warm ocean temperatures (Kim 2015). 46

Draft Programmatic EA August 2018
3-15
3.9.2 Seals, Sea Lions, and Sea Otters 1
2
Seven species of marine mammals other than whales and dolphins occur in the project area: two 3
species of true seals (the northern elephant seal and Pacific harbor seal), four species of eared seals 4
(California sea lion, Guadalupe fur seal, northern fur seal, and the Steller sea lion), and the southern 5
sea otter. Although these species are all protected under the MMPA, only the Guadalupe fur seal 6
and the southern sea otter are listed under the ESA. Within the project area, these species occur 7
throughout portions of coastlines of the Southern California POCS. Mainland coastal areas and the 8
northern Channel Islands support numerous haul-out and rookery sites for the Pacific harbor seal, 9
the California sea lion, the Guadalupe fur seal, the northern elephant seal, and the northern fur seal. 10
The following paragraphs discuss the two Federally listed species that may be present in the project 11
area. 12
13
Guadalupe Fur Seal. The Guadalupe fur seal was Federally listed as threatened in 1985 and since 14
that time has seen a significant increase in numbers. Breeding occurs almost entirely on Isla de 15
Guadalupe, Mexico, from May to July (CMLPAI 2009; NMFS 2015r). In recent years, several 16
Guadalupe fur seals have been consistently observed at San Miguel Island, and a single pup was 17
reported born in 1997 (Seal Conservation Society 2011; NPS 2018). Aquatic habitats used by the 18
Guadalupe fur seal do not tend to coincide with areas of the POCS platforms. 19
20
Southern Sea Otter. The southern sea otter is Federally listed as threatened. The range of the 21
mainland population extends from Marin County in northern California southward to Santa 22
Barbara County (USFWS 2017). Since 1998, southern sea otters have occupied areas south of 23
Point Conception (Tinker et al. 2017), and there is a population near San Nicolas Island off Ventura 24
County. Over the last 15 years, numbers near the project area have steadily increased (Tinker and 25
Hatfield 2016). In California, sea otters live in waters less than 59 ft. (18 m) deep and rarely move 26
more than 1 mi (1.6 km) offshore (Riedman and Estes 1990). Thus, the southern sea otter is not 27
expected to occur near any of the POCS platforms. 28
29
30
3.10 RECREATIONAL AND COMMERCIAL FISHERIES 31
32
3.10.1 Commercial Fisheries 33
34
About 64 commercial fish and shellfish species are fished in Southern California water, the 35
majority from nearshore coastal waters of Los Angeles to Monterey Counties and from waters just 36
off the Channel Islands. Fishery seasons are established and regulated by the California 37
Department of Fish and Wildlife (CDFW). Seaweeds, especially kelp, are also commercially 38
harvested within the project area (CDFW 2004). Although the harvest of kelp has declined in 39
recent years, an average of 7 million pounds (lb.) (3.18 million kg) of kelp was commercially 40
harvested annually from California waters during the 2006 to 2013 period (CDFW 2014b). 41
42
During 2015, landings of more than 49 million lb. (22.2 million kg) of fish and shellfish with a 43
value of approximately $50 million were reported for the Santa Barbara reporting area, and more 44
than 15 million lb. (6.8 million kg), worth approximately $12 million, were reported for the 45
Los Angeles reporting area. Combined 2015 and 2016 commercial catch data for the two reporting 46

Draft Programmatic EA August 2018
3-16
areas indicate that more than 50% of all commercial landings occur from June through September, 1
although November and December each account for more than 10% of the annual catch. 2
3
3.10.2 Recreational Fisheries 4
5
Southern California is a leading recreational fishing area along the U.S. west coast, where weather 6
and sea conditions allow for year-round fishing. Recreational fishing includes hook-and-line 7
fishing from shore (e.g., piers, docks, breakwaters, and beaches), from private or rental boats, and 8
from commercial passenger fishing vessels. Recreational fishing also includes activities such as 9
dive, spear, and net fishing. Recreational fisheries in Southern California access nearshore and 10
offshore areas, targeting both bottom and mid-water fish species, including surfperch, rockfish, 11
lingcod, yellowtail, yellowfin tuna, Pacific mackerel, and California halibut. August was the month 12
with the greatest portion (more than 25%) of the total annual recreational catch for the two districts; 13
more than 66% of the total recreational catch occurs from June through September. 14
15
16
3.11 SOCIOECONOMICS 17
18
The socioeconomic region of interest (ROI) for the Proposed Action encompasses Santa Barbara, 19
Ventura, Los Angeles, and Orange counties. The ROI captures the area that would experience any 20
potential impacts of offshore oil and gas production, where workers would spend their wages and 21
salaries, and where many of the vendors reside that would supply materials, equipment, and 22
services supporting oil and gas production under the proposed action. The following presents ROI 23
data on population, employment, and income. 24
25
Population. In 2016, the estimated population within the four-county ROI was more than 26
14.6 million people. The estimated population within the ROI has increased between 2010 and 27
2016; the increase over the 6-year period ranges from 3.2% for Ventura County to 5.4% for Orange 28
County. The Statewide population has increased an estimated 5.4% during this time. 29
30
Employment and Income. For the ROI in 2016, about 6.9 million people in the civilian labor 31
force were employed, and more than 362 thousand civilian workers were unemployed. 32
Unemployment rates ranged from 4.0% for Orange County to 5.2% for Ventura and Los Angeles 33
counties. Within the ROI, only 6,168 (0.11%) of paid employees were part of the mining, 34
quarrying, and oil and gas extraction sector in 2015. Per-capita annual income ranged from 35
$53,521 for Los Angeles County to $57,749 for Orange County, bracketing the Statewide average 36
of $53,741. 37
38

Draft Programmatic EA August 2018
4-1
4 ENVIRONMENTAL CONSEQUENCES 1
2
3
This chapter describes the environmental consequences that may occur on the Pacific Outer 4
Continental Shelf (POCS) with implementation of each of the five alternatives, including the 5
No-Action alternative (Section 2.4.1). The evaluation of environmental consequences presented in 6
this Programmatic Environmental Assessment (PEA) focuses on those resources and societal 7
conditions most likely to be affected under each of the five alternatives and on potential impacts 8
that may occur due to the accidental release of hydrocarbons during any of the activities identified 9
for the Proposed Action. 10
11
12
4.1 PROPOSED ACTION AND ALTERNATIVES 13
14
Under Alternative 1, the Proposed Action, BSEE will continue to accept and review Applications 15
for Permits to Drill (APDs) for well drilling and conductor installation and Applications for 16
Permits to Modify (APMs) for downhole operations (see Section 2.2.2). These may be submitted 17
for any of the 19 production platforms located on the 38 active leases on the POCS. Table 2-2 18
presents likely levels of activity that could be newly permitted under the Proposed Action during 19
a 5 year action period. A similar level of activity would occur under Alternative 2, which differs 20
from the Proposed Action with regard to when conductor installation may occur. Alternative 3 is 21
also similar to the Proposed Action, except there would be no conductor installation. Under 22
Alternatives 1–3, BSEE would continue to accept and review APMs on a case-by-case basis for 23
activities included on BSEE Operations Form 0124 but not included in the Proposed Action. Under 24
Alternative 4, BSEE would accept and review APMs only for downhole activities deemed 25
necessary to ensure safe operations or pollution prevention of currently permitted activities. Under 26
Alternative 5, No Action, BSEE would no longer accept or approve any APDs or APMs for any 27
of the operating POCS platforms, including any APMs for activities related to safety or pollution 28
prevention. Previously permitted activities, as well as routine production and safety operations not 29
requiring permitting, would continue under each of the five alternatives. 30
31
32
4.2 ASSESSMENT APPROACH 33
34
The evaluation of environmental consequences characterizes potential effects with regard to the 35
spatial extent (e.g., localized around platforms or affecting a much larger portion of the POCS), 36
magnitude (e.g., small vs. large increase in air pollutants, individual biota or populations affected), 37
and duration (e.g., short term [hours, days or weeks] or long term [months or longer]) of any 38
potential effects. 39
40
4.2.1 Impacting Factors 41
42
For this PEA, impact-producing factors were identified for the activities that could be newly 43
permitted under the Proposed Action (Table 2-1), and these are depicted in Figure 4-1. Under the 44
Proposed Action, natural resources and socioeconomic conditions may be affected by (1) noise 45
generated during conductor installation and drilling, as well as by platform supply vessels and 46
47

Draft Programmatic EA August 2018
4-2
1
FIGURE 4-1 Impacting Factors Associated with Alternative 1, the Proposed Action 2 3
4
BSEE helicopter flights; (2) air emissions from platform equipment, supply vessels, and 5
helicopters; (3) platform lighting; (4) drilling waste disposal; (5) seafloor disturbance; and 6
(6) support vessel and BSEE helicopter traffic. 7
8
The nature, location, magnitude, and duration of each impacting factor (and any subsequent 9
environmental effects) will vary among the activities included in the Proposed Action. For 10
example, noise generated during hydraulic hammering will occur at a specific platform location, 11
will be relatively short in duration but very high in magnitude, and will cease once conductor 12
installation is completed. In contrast, noise from associated supply vessels will be of lower 13
magnitude, occur along shore-to-platform ship routes, be transient along those routes, and cease 14
once conductor installation has been completed. 15
16
Natural resources that could be affected by activities permitted under the Proposed Action include 17
air and water, the acoustic environment (i.e., noise levels), and marine and coastal biota and their 18
habitats. Table 4-1 identifies the impacting factors for each of the natural resources evaluated in 19
this PEA. An accidental oil spill, depending on its location, duration, and magnitude, may affect a 20
wide variety natural resources in the POCS. 21
22
Sociocultural resources and conditions would largely not be affected under Alternative 1. In 23
addition, newly permitted downhole operations, such as reperforating a portion of an existing well 24
or installing a submersible pump used to enhance production, will have no more than negligible 25
effects, with the possible exception of temporary, short-duration, and very localized minor 26
additional air emissions if diesel engines are used in the operations. 27
28
4.2.2 Assessment of Oil Spill Impacts 29
30
The Bureaus do not consider oil spills to be a direct effect of the Proposed Action, because such 31
accidental releases are neither authorized nor intended to occur. Although the overall risk of an oil 32

Draft Programmatic EA August 2018
4-3
TABLE 4-1 Natural Resources Potentially Affected under Alternative 1, the Proposed Actiona 1
Resources
Impacting Factor and Source A
ir Q
uali
ty
Wat
er Q
uali
ty
Off
shor
e In
vert
ebra
tes
and
Hab
itats
Coa
stal
In
vert
ebra
tes
and
Hab
itats
Off
shor
e Fi
sh
and
EF
H
Coa
stal
Fis
h an
d E
FH
Sea
Tur
tles
Off
shor
e B
irds
Coa
stal
Bir
ds
and
Hab
itats
Off
shor
e M
arin
e M
amm
als
Coa
stal
Mar
ine
Mam
mal
s
Noise
Conductor installation X X X X
Well drilling X X X X
Helicopter traffic X X X X
Ship traffic X X X X X X X
Air Emissions
Platform equipment X
Helicopter traffic X
Ship traffic X
Platform Lighting X
Turbidity
Drilling waste discharge X X X X X X
Conductor installation X X X X X
Support Traffic
Supply ships X X X X
BSEE helicopters X X X X X
a An X only indicates that the resource category may be affected. It does not imply any level of effect or resulting impact. In some cases, the effect or impact may be negligible.
2 3 spill occurring in the POCS has declined over time in part due to declining reservoir pressures, 4 other factors such as human error or equipment failure present a risk of an oil spill, and some small 5 spills (e.g., <50 bbl in size) are reasonably foreseeable as long as oil is being produced. 6 7 In the POCS, reservoir pressures have dropped to near zero in the majority of the fields that are 8 now in production, and enhanced production approaches (such as artificial lift) are being used to 9 maintain oil production. Under these conditions, the risk of a loss of well control (i.e., a blowout) 10 resulting in a catastrophic spill is exceedingly small. The largest oil spill in the POCS region 11 occurred in 1969, spilling an estimated 80,000 bbl into the Santa Barbara Channel. Over the next 12 44-year period (1970 to 2014) a cumulative total of 919 bbl was spilled in the POCS region; the 13 largest spill was a 164-bbl spill from a Platform Irene pipeline in September 1997. However, in 14 the course of day-to-day routine platform operations, certain smaller oil spills (under 50 bbl) have 15 occurred throughout oil and gas activities on the POCS. These smaller spills are reasonably 16 foreseeable and thus expected to continue to occur under all alternatives evaluated in this PEA. 17

Draft Programmatic EA August 2018
4-4
Of the recorded oil spills between 1970 and 2014, only 3.4% (49 of 1,435) were greater than 1 bbl; 1 together these totaled 828 bbl. BOEM estimates that a reasonably foreseeable maximum spill 2 volume for all oil and gas operations on the POCS is 200 bbl, and that there is an 84.4% probability 3 of occurrence of 1.86 spills in the “50 to less than 1,000 bbl” size range, and has identified likely 4 trajectories of potential spills (BOEM and BSEE 2017a,b). BOEM’s trajectory analysis identified 5 potentially affected locations, while the Los Angeles—Long Beach Area Contingency Plan 6 (www.wildlife.ca.gov/OSPR/Preparedness/LA-LB-Spill-Contingency-Plan) identifies potentially 7 affected environmental, economic, and cultural sites and resources. An assumed 200-bbl 8 maximum likely oil spill (BOEM and BSEE 2017a,b) would cover a small area and last a short 9 time, resulting in small-scale cleanup and response activities. Therefore, effects on resources from 10 an accidental oil spill of this size at one of the POCS production platforms would be localized and 11 temporary, and would be negligible to minor overall. Due to the maximum 200-bbl spill size and 12 the short-term and temporary impacts that could result to all resources discussed in this EA, oil 13 spills are not discussed further. 14 15 4.2.3 Impact Levels 16 17 A four-level classification scheme to characterize the impacts that could result with 18 implementation of each of the alternatives considered in this draft PEA. Table 4-2 presents the 19 impact levels used to evaluate potentially affected resources. For biota, these levels are based on 20 population-level effects rather than on effects on individuals. 21 22 23 TABLE 4-2 Impact Levels 24
Impact Level Definition
Negligible • No measureable impacts.
Minor • Most impacts could be avoided with proper mitigation. • If impacts occur, the resource will recover completely without mitigation once the impacting
factor ceases.
Moderate • Impacts are unavoidable. • The viability of the affected resource or societal condition is not threatened, although some
impacts may be irreversible. • The affected resource or societal condition would recover completely if proper mitigation is
applied once the impacting factor ceases.
Major • Impacts are unavoidable. • The viability of the affected resource or societal condition may be threatened. • The affected resource or societal condition would not fully recover even if proper mitigation
is applied during the life of the project or remedial action is implemented once the impacting stressor is eliminated.
25 4.2.4 Cumulative Impacts 26 27 The Council on Environmental Quality defines cumulative impacts as those resulting from the 28 incremental impact of an action when added to those of other past, present, and reasonably 29 foreseeable future actions, regardless of the initiator of such other actions (40 CFR 1508.7). Thus, 30

Draft Programmatic EA August 2018
4-5
even minor actions may together produce significant impacts over time through additive or 1 interactive (synergistic) processes. 2 3 Potential cumulative effects consider the effects of activities that could be permitted under the 4 Proposed Action on marine and coastal resources, in combination with the effects of other past, 5 ongoing, or future activities on the same resources. Chapter 3 characterizes the current condition 6 of the affected environment within the project area as affected by past and present actions, and 7 Chapter 4 evaluates the potential direct and indirect impacts of the activities that could be newly 8 permitted under the Proposed Action. Cumulative impacts analysis qualitatively considers the 9 current condition of, and stresses on, a given affected resource, along with the resilience and 10 sustainability of that resource. Because activities that could be permitted under the Proposed 11 Action would have no or negligible impacts on archeological resources, areas of special concern, 12 recreation and tourism, or environmental justice, there would be no cumulative impacts on these 13 resources and therefore are not discussed further. 14 15 4.2.5 Incomplete or Unavailable Information 16 17 The Bureaus used the best available scientific information to prepare this draft PEA. The analyses 18 conducted are based on scientifically credible information that was publicly available at the time 19 this PEA was prepared. Where necessary, extrapolations from existing or new information 20 employing accepted methodologies were used to make reasoned estimates and conclusions 21 regarding both current resource baseline conditions and expected impacts from the alternatives. 22 The subject-matter experts who prepared this draft PEA conducted a diligent search for pertinent 23 information, and the Bureaus’ evaluations of impacts are based upon scientifically accepted 24 approaches or methods. The analyses for this PEA did not suffer from the existence of the 25 incomplete or unavailable information. For these reasons, the Bureaus have met their NEPA 26 obligations in this PEA: to consider the best available science and information relevant to the 27 proposed action, alternatives, and impact analyses; and to consider to what extent incomplete or 28 unavailable information impedes that analyses and the ability to make a decision among the 29 alternatives as to whether a Finding of No Significant Impact (FONSI) is appropriate in light of 30 the available and incomplete information (50 CFR 1502.22). 31 32 33 4.3 ENVIRONMENTAL CONSEQUENCES 34 35 For each alternative, potential impacts are discussed resource by resource. 36 37 4.3.1 Air Quality 38 39 The EPA has delegated air quality regulatory control of offshore oil and gas platforms to their 40 corresponding onshore area (COA) air districts: 15 platforms offshore of Santa Barbara County to 41 the Santa Barbara County Air Pollution Control District (SBCAPCD), four platforms offshore of 42 Ventura County to the Ventura County Air Pollution Control District (VCAPCD), and four 43 platforms offshore of the City of Long Beach (near the boundary of Los Angeles County and 44 Orange County) to the South Coast Air Quality Management District (SCAQMD). 45

Draft Programmatic EA August 2018
4-6
Air emission sources associated with the activities that could be permitted under Alternatives 1, 2, 1
and to a lesser extent 3, include equipment used for conductor installation, well drilling and 2
downhole operations, and support vessels transporting supplies such as conductor pipe and drilling 3
materials; and helicopter traffic transporting BSEE inspectors (Table 4-1). These sources would 4
emit criteria pollutants such as NOx and reactive organic gases (ROGs), hazardous air pollutants 5
(HAPs) such as benzene, and greenhouse gases (GHGs) such as CO2, as well as small amounts of 6
primary particulate matter (PM) and CO. Of the 19 production platforms currently operating on 7
the POCS, all but four receive their power from onshore electricity generation sources via seafloor 8
cables. Thus, newly permitted conductor installation or drilling employing diesel engines would 9
occur only at Platforms Edith, Harmony, Harvest, and Hidalgo. Any diesel engines used for 10
conductor installation or drilling at these four platforms would be permitted by the appropriate 11
county air districts. There would be no such emissions under Alternatives 4 and 5. 12
13
Assuming an average of 16 conductor installations per year over a 5-year period under 14
Alternatives 1 and 2 (Table 2-2), each employing diesel engines, maximum annual emissions of 15
criteria pollutants from conductor installation would be less than 0.05% of the estimated daily 16
emissions of these criteria pollutants from all sources in the four-county area (Table 4-3). 17
Similarly, the estimated 31 tons of CO2 produced during this same level of conductor installations 18
using diesel engines would also be a tiny fraction of statewide annual GHG emissions, which are 19
estimated at 442 million metric tons CO2e (Section 3.2.3). Thus, potential impacts of conductor 20
installation on ambient air quality under either alternative would be very localized, short term, and 21
temporary, and would be no more than minor under both alternatives. No such emissions would 22
occur under Alternatives 3, 4, or 5. 23
24
Table 4-4 presents estimated average daily emissions during drilling of a single well under 25
Alternatives 1, 2, or 3, assuming the use of a 1,785-hp diesel engine over a 90-day total drilling 26
and testing period.14 Such emissions represent a negligible percentage of the average daily 27
emissions from the four COA counties (Table 4-4), and no pollutant would exceed the 25-ton (over 28
12 months) permit exemption threshold for offshore equipment in effect in the Santa Barbara 29
County Air Pollution Control District. Thus, emissions during drilling under any of these three 30
alternatives would have at most minor impacts on air quality. In addition, an estimated 2,900 tons 31
of CO2 emissions for drilling a single well is 0.00059% of annual statewide emissions of 32
442 million metric tons CO2e. Sidetracking would produce similar daily emissions, assuming 33
similar power requirements. 34
35
14 The diesel engine power requirement of 1,785 hp and well construction duration of 90 days are from Table 5.4-1
in Appendix 5.4 of MMS (2001) for delineation drilling in the Bonito formation in the project area using a Mobile
Offshore Drilling nit (MODU). A fuel requirement of 257,400 gal of diesel for one well is taken from Appendix
Table 5.2.1-2. The 90-day total well construction period includes 23.5 days for drilling; 20.75 days for tripping,
casing, and logging; and 27.5 days for testing. The remaining 18.25 days are for other related operations; thus,
90 days is a conservative period for platform-based drilling. Emission factors for criteria pollutants are taken from
Table 1 in DieselNet (2017). The emission factor for SO2 assumes the use of ultra-low sulfur fuel with 15 ppm
sulfur content. NOx and ROG are assumed to be 100% and 10%, respectively, of the combined standard,
considering the low volatility of diesel fuel. All PM is from engine exhaust is assumed to be PM2.5. An emission
factor for CO2 of 10.21 kg CO2/gal diesel is from EPA (2014).

Draft Programmatic EA August 2018
4-7
TABLE 4-3 Projected Air Emissions from Diesel-Powered Conductor Installation 1
Criteria Pollutant
Average Daily Four-County-Wide
Emissions (lb.)
Average Annual Emissions (lb.) Assuming 16 Diesel-
Powered Conductor Installations/yr
Average Annual Emission from Conductor Installation
as Percentage of Total Daily Emissions
CO 3,970,000 342 (21.4/conductor) 0.009 NOx 1,090,000 391 (24.4) 0.04 PM2.5 131,000 19.6 (1.2) 0.01 SO2 63,000 0.59 (0.04) 0.0009 ROG 905,000 39.1 (2.4) 0.004
2 3
TABLE 4-4 Projected Air Emissions from Diesel-Powered Well Installation 4
Criteria Pollutant
Average Daily Four-County-Wide
Emissions (lb.)
Average Daily Emissions (lb.) per Well Installation, Assuming 90-day Completion Period
Per-Well Emissions (tons) and Percentage of SBCAPCD 25-tpy
Permit Exemption Thresholda
Average Daily Drilling Emission as
Percentage of Average Daily Four-County-
Wide Emissions (lb.)
CO 3,960,000 190 8.5 (34%) 0.005 NOx 1,080,000 351 15.8 (63%) 0.032 PM2.5 131,000 11 0.50 (2%) 0.008 SO2 63,000 0.6 0.027 (0.11%) 0.001 ROG 905,000 35.1 1.6 (6.3%) 0.004
a A permit shall not be required for equipment, including associated marine vessels, used for pile driving 5 adjacent to or in waterways, or cable and pipe-laying vessels/barges or derrick barges if the potential to 6 emit of such equipment per stationary source is less than 25 tons per year of any affected pollutant during 7 any consecutive 12-month period (SBCAPCD Rule 202.F.7). 8
9 10 Given an expected 10 new wells and up to 33 sidetracks over a 5-year period (Table 2-2), potential 11 effects of diesel-powered new well drilling and sidetracking on ambient air quality under 12 Alternatives 1, 2, and 3 would be temporary and localized, and result in no more than minor 13 impacts. No such emissions would occur under Alternatives 4 or 5. 14 15 Under Alternatives 1 and 2, and to a lesser extent under Alternative 3, as many as 123 additional 16 vessel trips and a similar number of helicopter flights would support conductor installation, 17 drilling, and associated BSEE inspections over a 5-year period (Table 2-2). Emissions from this 18 additional traffic under each alternative would be minimal in comparison to emissions from 19 ongoing routine support vessel traffic and BSEE inspections, and to total air emissions from the 20 four COA counties. Similarly, emissions from platform diesel sources supporting newly permitted 21 downhole operations, such as powering submersible pumps in artificial lift operations, would be 22 periodic and short term, and largely limited to the four POCS platforms that are not electrified. 23 Thus, these activities would produce negligible impacts on air quality in the project area. Because 24 no additional support vessel or helicopter traffic would be expected under Alternatives 4 or 5, there 25 would be no additional emissions from vessel and helicopter traffic under any of these three 26

Draft Programmatic EA August 2018
4-8
alternatives, while authorization of any safety- or pollution prevention-related APMs under 1 Alternative 4 could result in only very small and temporary air emissions, and thus have a 2 negligible impact on air quality. 3 4 Under each alternative, air emissions associated with POCS oil and gas activities would continue 5 from currently permitted operations; from routine inspection, maintenance, and repair activities; 6 and from supporting supply ship and helicopter traffic. However, as oil and gas reserves continue 7 to decline, so will production and associated air emissions. With declining reserves and no further 8 authorization of APDs for conductor installation and drilling or of APMs for enhanced production 9 activities, oil and gas production may be expected to decline more rapidly under Alternatives 4 10 and 5 than under Alternatives 1–3, and air emissions may be expected to similarly decline more 11 rapidly. While the limited approval of some APMs under Alternative 4 may allow some wells to 12 continue operation, under Alternative 5 there would be no such permit approval, and for wells with 13 safety or pollution prevention concerns BSEE would enforce shut-in of the wells. As a result, oil 14 and gas production may decline more rapidly than under Alternative 4 and air emissions may be 15 expected to similarly decline. Thus, air emissions under No Action may be the lowest among all 16 alternatives, although overall impacts on ambient air quality would be negligible. 17 18 Table 4-5 presents estimated downstream GHG emissions associated with consumption of the oil 19 and gas that could be produced from new wells and sidetracks under each of the action alternatives. 20 These estimates assume the maximum number of new wells and sidetracks as identified for 21 Alternative 1 (Table 2-2), maximum daily and annual production rates based on maximum daily 22 per well oil and gas production estimates, and the noted emission factors. 23 24 25 TABLE 4-5 Estimated Maximum Downstream Greenhouse Gas Emissions Associated with New 26 Wells and Sidetracking under the Alternative 1—Proposed Action 27
Estimated Maximum Annual GHG Emissions
Estimated Maximum Annual Production of
New Wells
Emission Factor
(kg CO2e)
From Consumption of New Production
As Percentage of GHG
Emissions within
Alternative
Max. No. of New Wells
Oil
(bbl/yr)a Gas
(Mcf/yr)b
Oil (per
bbl) Gas (per
Mcf)
MT CO2e
California United States
1–3 43 4,826,213 8,197,695 429.6 54.5 2,520,071 0.57% 0.038%
4 and 5 0 0 0 429.6 54.5 0 0.00% 0.000% a Based on a maximum daily per well production estimate of 307.5 bpd from Platform Irene. 28 b Based on a maximum daily per well production estimate of 522.3 Mcf per day from Platform Harmony. 29 Sources: ARB (2017d); BSEE (2016, 2017a); EIA (2017c); EPA (2014, 2017c). 30

Draft Programmatic EA August 2018
4-9
Under Alternatives 1, 2, and 3, estimated maximum annual downstream GHG emissions from the 1
consumption of new oil and gas production would be about 2.5 million metric tons 2
(2.8 million tons) CO2e, which accounts for about 0.57% of statewide GHG emissions and 0.038% 3
of U.S. GHG emissions (ARB 2017d; EPA 2017c) (Table 4-5). Because overall oil and gas 4
production on the POCs has been declining steadily since the late 1990s, production from new 5
wells under Alternatives 1, 2, and 3 would likely only slow or maintain the ongoing decline and 6
not act to increase overall production. Thus, the consumption of oil and gas newly produced on 7
the POCS under any of these three alternatives would not be expected to result in increases in 8
GHG emissions. Under Alternatives 4 and 5 (No Action), there would be no new drilling or 9
enhanced production activities, and thus no new production or associated downstream 10
GHG emissions. 11
12
4.3.1.1 Cumulative Impacts 13
14
Given the estimated negligible to minor potential impacts from newly permitted activities under 15
any of the alternatives, incremental impacts of the Proposed Action and alternatives are not 16
expected to result in any cumulative effects on regional air quality or on climate change, when 17
combined with other ongoing or possible future emissions. 18
19
4.3.2 Noise 20
21
This section discusses potential noise impacts on the acoustic environment associated with POCS 22
platforms. Later sections of this chapter evaluate the effects of such noise on natural resources 23
(e.g., fish and marine mammals). 24
25
Under Alternatives 1 and 2, conductor installation may be carried out either by jet drilling or by 26
impulsive installation using a hydraulic hammer (Appendix B), but no conductor installation 27
would occur under Alternatives 3, 4, or 5. Of these two methods, noise from impulsive installation 28
is of greatest concern, primarily because of its potential to adversely impact marine mammals. This 29
analysis assumes any new conductor installation would be similar to that of the 2014 impulsive 30
installation at Platform Harmony (BOEM 2014b), namely conductor pipe setup and welding taking 31
approximately 3 to 7 hours per pipe section, and pile driving using a hydraulic hammer for 2 to 32
4 hours for each pipe section, with active hammering for about 5 to 8% of the total installation 33
time (Appendix B). During such installation, noise may emanate from the underwater portion 34
(from the sea surface to the seafloor) and the above–sea-level portion (from the platform and the 35
sea surface) of the conductor. 36
37
Because of the absence of available open slots, there would be no conductor installation at 38
Platforms Heritage, Hondo, Henry, or Eureka. In addition, based on operator plans for a 5-year 39
period, no conductor installation is anticipated at any of the four Santa Maria Basin platforms, at 40
three of the Santa Barbara West platforms, at Platform Eureka in the San Pedro Basin, or at 41
Platforms Gina, Habitat, and Henry in the Santa Barbara East platform group (Figure 1-1). Thus, 42
noise impacts from conductor installation under Alternatives 1 and 2 would be limited to only nine 43
of the POCS production platforms (two of the San Pedro Basin platforms and seven of the Santa 44
Barbara East platforms). 45

Draft Programmatic EA August 2018
4-10
During the 2014 conductor installation at Platform Harmony, measured peak mean underwater 1
sound levels at 10 m from the conductor pipe were about 205 dB rms re 1 µPa during pile driving 2
(MacGillivray and Schlesinger 2015). Under the Proposed Action, such underwater sound levels 3
would occur at no more than nine platforms and only during active pile driving. As a result, there 4
would be no widespread or long-term increase in underwater noise levels on the POCS. Thus, 5
impacts on the underwater acoustic environment from pile driving would be short term, temporary, 6
localized, and minor. The potential impacts of noise on marine mammals and other marine life 7
with respect to the NMFS effects thresholds are evaluated in later sections. 8
9
A number of mitigation measures are available to reduce sound levels during impulsive conductor 10
installation. Bubble curtains may be used to dampen the transmission of pile-driving noise (based 11
on the physical phenomenon of sound scattering and on the resonance of vibrating air bubbles). 12
Foam-walled and double-walled temporary noise attenuation piles have also been used to reduce 13
underwater sound transmission. Cushions between the hammer and the conductor have been used 14
to dampen the impulse delivered to the piles by the hammer, which reduces airborne noise 15
generation but not the underwater propagation environment (e.g., see MacGillivray and 16
Schlesinger 2014). Under Alternatives 1 and 2, mitigations would be identified and applied on a 17
case-by-case basis at the permitting stage. 18
19
Measured mean airborne sound levels on the deck of Platform Harmony during the 2014 pile 20
driving, and without noise mitigation, were about 112 dBA15 (MacGillivray and 21
Schlesinger 2014). As with the generation of underwater sound, airborne sound from pile driving 22
would occur at no more than nine platforms and only during active pile driving. Thus, there would 23
be no widespread or long-term increase in airborne noise levels on the POCS, and impacts on the 24
airborne acoustic environment from pile driving would be short term, temporary, localized, and 25
minor. Thus, under Alternative 1 impacts on the airborne acoustic environment from conductor 26
installation would be minor. 27
28
Sources of underwater drilling noise originating from platforms include diesel-, gas-, or electric-29
powered engines, the platform itself, and the drill bit. Noise recorded at four platforms on the 30
POCS (Gales 1982) found platform noise to be so weak it was nearly undetectable even alongside 31
a platform during sea states ≥3.16 The strongest tones from all four platforms were at very low 32
frequencies, around 5 Hz, with received levels of 119–127 dB re 1 µPa at near-field measurement 33
locations. In comparison, recent ambient sound levels near Platform Harmony ranged from 102 to 34
114 dB re 1 μPa, with a median level of 105 dB re 1 μPa (MacGillivray and Schlesinger 2015). 35
Airborne sound levels from newly permitted drilling operations estimated assuming use of a 36
1,785-hp diesel engine had a mean source level of 125.2 dBA re 20 µPa (Beranek and Ver 1992). 37
15 A-weighting (denoted by dBA) is widely used to account for human sensitivity to frequencies of sound (i.e., less
sensitive to lower and higher frequencies and most sensitive to sounds between 1 and 5 kilohertz [kHz]), which
correlates well with a human’s subjective reaction to sound.
16 Sea state is a measure of the intensity of the ocean’s movement as characterized by such parameters as wind speed
and wave height (Richardson et al. 1995). Sea states vary from 0, which represents calm conditions, to 9, which is
characterized by wind speeds of more than 33 m/s and wave heights of more than 14 m. Sea state 3 is defined as a
wind speed of 5.7–8.2 m/s and a wave height of 0.5–1.2 m, which corresponds to typical conditions in the project
area.

Draft Programmatic EA August 2018
4-11
In contrast to the relatively few platforms where new conductor installation could occur, new well 1
drilling and sidetracking could be permitted under the Proposed Action at any of the POCS 2
production platforms. Underwater and airborne sound generated during drilling and sidetracking 3
would also be short term, temporary, and limited to individual platform locations, and would not 4
result in any long-term increases in noise levels. Thus, under Alternative 1 drilling and sidetracking 5
would have no more than a minor impact on the acoustic environment of the POCS. 6
7
Supply vessel and helicopter traffic associated with activities that could be permitted under 8
Alternative 1 would temporarily add to the local noise levels at the platforms, at seaports or airports 9
used by the support vessels and helicopters, and along the traffic routes to and from the platforms. 10
Noise generated by these ships and helicopters would be transient, variable in intensity, and limited 11
in range. Therefore, under Alternative 1 impacts of supply vessel and helicopter traffic on the 12
acoustic environment of the POCS would be negligible. 13
14
Under Alternative 2, impacts to the underwater and airborne acoustic environment would be the 15
same as identified for Alternative 1 (ranging from negligible to minor), except there would be no 16
generation of conductor installation-related noise (including that from associated support vessel 17
traffic and helicopter flights) during any conductor installation exclusion period. 18
19
Under Alternative 3, there would be no noise generation from conductor installation (or from any 20
associated supply vessel and helicopter traffic). Underwater and airborne noise generated during 21
drilling and authorized downhole operations and supporting vessel and helicopter traffic would 22
otherwise be similar to those under Alternatives 1 and 2, ranging from negligible to minor. 23
24
Noise generation at the POCS platforms under Alternatives 4 and 5 would result only from 25
currently permitted operations; routine inspection, maintenance, and repair activities; supply ship 26
and helicopter traffic associated with current production; and additionally for Alternative 4 from 27
any newly permitted safety- or pollution prevention–related downhole operations. None of these 28
activities would add to the ambient noise levels at any of the POCS platforms. With declining 29
reserves and no further authorization of APDs or APMs, oil and gas production may be expected 30
to decline more rapidly under each of these alternatives than under Alternatives 1, 2, or 3, and 31
production-related noise may similarly decline more rapidly. Thus, potential impacts of 32
Alternatives 4 and 5 to the acoustic environment at POCS platforms would be negligible. 33
34
4.3.2.1 Cumulative Impacts 35
36
Sound is not additive unless noise sources are at a similar level, are relatively close together or a 37
similar distance from a receptor, and occur at the same time. Other noise sources around the project 38
area, including shipping traffic, would be minimally additive with project-related sources because 39
of the separation distance and the nature of platform noise sources, which are intermittent, short 40
term, or limited in range. Thus, the incremental impacts of Alternative 1, the Proposed Action 41
would not result in any cumulative effects on the acoustic environment in the project area. 42
43

Draft Programmatic EA August 2018
4-12
4.3.3 Water Quality 1
2
Under Alternative 1, water quality could be affected by the introduction of turbidity from bottom 3
disturbance during newly permitted conductor installation, and by the discharge of drill cuttings 4
and drilling muds from newly permitted well drilling and sidetracking (Table 4-1). Effects from 5
currently permitted activities (including NPDES-permitted discharges) and from ongoing routine 6
inspection, maintenance, and repair activities would have negligible impacts on water quality. 7
8
During conductor installation, there would be a short-term “puff” release of turbidity originating 9
on the seafloor as the conductor contacts the sea floor. Further, as the conductor is driven into the 10
sea floor, smaller puffs of sediment would arise from the sea floor and dissipate down current. 11
This brief increase in turbidity would have a negligible effect on water quality given its small size, 12
episodic nature, and point of origin at the seafloor. Installation of conductors by jet drilling of 13
sediments would similarly produce a plume of turbidity originating from the seafloor. This plume 14
would drift along the seafloor with the prevailing current away from the source point and slowing 15
dissipate and/or settle to the seafloor. The plume would have little effect at shallow depths where 16
most marine life resides. Even with multiple conductors being installed (sequentially, at 17
approximately 14-day intervals) at any single platform, the effects of the associated increases in 18
turbidity would be similarly short term, temporary, and localized, and have minor effects on water 19
quality. In addition, conductor installation would only occur at nine of the POCS platforms, thus 20
further limiting the area of the POCS that could be affected. The total effect of all foreseeable 21
installations that could be permitted under Alternative 1 would likewise be temporary, localized, 22
and minor. 23
24
All drilling-, production-, and downhole operations-related discharges at POCS platforms are 25
regulated through NPDES General Permit No. CAG280000 (the NPDES Permit; see 26
Section 3.4.1), and thus are not expected to result in adverse effects on water quality.17 The 27
NPDES permit sets effluent concentration limits and defines maximum allowable annual discharge 28
volumes for drilling fluids, cuttings and excess cement for each of the producing platforms 29
(EPA 2013a)18. Among effluent discharge limitations specified in the NPDES General Permit are 30
limits on total volume, toxicity, presence of free oil, and prohibition of oil-based drilling fluids or 31
diesel. 32
33
Permitted open-water discharges of drilling fluids (muds) and cuttings from the drilling platform 34
will introduce turbidity for the duration of drilling, beginning at the point of discharge, which is 35
typically 30–40 m (100–130 ft.) below the sea surface (MMS 2005). Cuttings will fall more 36
quickly through the water column than drilling muds and remain in the water column for a 37
relatively short time (e.g., an hour or less). Cuttings would deposit mostly near platform discharge 38
point due to their large grain size, and have little direct impact on water quality (MMS 2005). 39
However, up to a third of the volume of cuttings would be adhering drilling muds, and these could 40
produce a continuous plume of turbidity emanating from the falling cuttings as well as making up 41
17 Note that an exceedance of an NPDES permit limit would not necessarily constitute a significant impact.
18 Annual limits on cuttings range from 13,350 to 90,000 bbl; for drilling fluids, from 36,650 to 200,000 bbl; and for
excess cement slurry, from 1,200 to 6,500 bbl. Permittees must provide EPA verbal notice at least 48 hours prior
to the final mud dump upon completion of each well.

Draft Programmatic EA August 2018
4-13
a portion of the cuttings pile on the seafloor. Minor concentrations of residual drilling mud 1
chemicals (e.g., clays, lime, bicarbonate, cellulose fiber) could leach from the solid cuttings. 2
However, most operators on the POCS currently dispose of drill cuttings in onshore landfills, and 3
in such cases none of the effects of open-ocean disposal of drill cuttings would occur. 4
5
Bulk discharge of drilling muds may occur at the end of use of a mud system (formulation), 6
producing a turbidity plume from the point of discharge.19 Finer-grained material associated with 7
residual drilling muds would drift farther afield with currents, becoming diluted in the process. 8
Mid-depth and near-bottom currents would disperse drilling mud discharges initially, while bottom 9
currents would further disperse muds via resuspension (MMS 2005). Any effects on water quality 10
from discharged drilling muds would thus be distributed over a larger area and water volume. The 11
NPDES-permitted discharge of drill cuttings and muds would not occur continuously, but rather 12
would be episodic, occurring during drilling. Given the localized, short-term, temporary, and 13
episodic nature of the NPDES-permitted disposal of drilling muds, such disposal would have no 14
more than minor effects on water quality due to minor introduced turbidity. 15
16
Under Alternative 2, potential impacts on water quality would be the same as those described for 17
Alternative 1, and be localized, temporary, and minor. However, potential impacts from turbidity 18
associated with conductor installation would not occur during periods of restricted conductor 19
installation. Under Alternative 3, potential impacts of newly permitted activities on water quality 20
would be the same as those identified for Alternatives 1 and 2 (localized, temporary, and minor), 21
but there would be no impacts from turbidity associated with conductor installation. 22
23
None of the impacts identified for activities that could be authorized under Alternatives 1, 2, or 3 24
would occur under Alternatives 4 or 5. Any downhole activities permitted under Alternative 4 in 25
support of safety or pollution prevention would have negligible effect on water quality. Thus, 26
overall impacts on water quality from oil and gas activities at POCS platforms under Alternatives 4 27
and 5 (No Action) would be negligible. 28
29
4.3.3.1 Cumulative Impacts 30
31
The NPDES General Permit has, and will continue to, regulate discharges from the POCS 32
platforms related to drilling and production, while similar permits limit other point-source 33
discharges in the region. Since its inception, the NPDES program has continuously improved the 34
quality of receiving waters throughout the country and notably within the project area 35
(Section 3.4.1). Non-point sources, which are more difficult to control and regulate, will continue 36
to contribute runoff loads to waters in the project area. Within this context, other current and future 37
factors that will impact ocean waters in the project area include oil and gas production; oil spills; 38
natural oil seeps; offshore tankering discharges from vessels; POTW and industrial discharges; 39
urban, industrial, and agricultural runoff; storm-water runoff; agricultural and municipal nutrient 40
inputs; and offshore oil and gas infrastructure decommissioning activities. The future permitted 41
platform discharges will add to these inputs and to turbidity generated during conductor installation 42
19 If an operator is conducting a drilling program where several wells are planned to be drilled in succession, large
portions of the drilling mud mixture maybe retained and refurbished for the next well so that a large mud dump
would only occur at the end of the last well.

Draft Programmatic EA August 2018
4-14
associated with the Proposed Action. Thus, the incremental impacts of permitted platform 1 discharges and turbidity from new conductor installation drilling under the Proposed Action would 2 not result in any cumulative impacts on water quality. 3 4 4.3.4 Marine and Coastal Invertebrates 5 6 Under Alternative 1, marine and coastal invertebrates and their habitats may be affected by noise 7 and turbidity generated during conductor installation, and by the permitted discharge of drilling 8 wastes (Table 4-1). 9 10 High-amplitude, low-frequency noise and vibration from pile driving could temporarily affect 11 nearby marine invertebrates (Edmunds et al. 2016). Invertebrates could experience physical 12 damage to organs and masking of intraspecific communications, while species that are more 13 mobile could temporarily leave the area during pile driving (Hawkins and Popper 2017). Studies 14 on individual invertebrate species have shown mixed results; some finding no detectible effects 15 and others reduced larval growth and development (Normandeau Associates 2012; Edmonds et al. 16 2016). Population-level impacts are unlikely because of the temporary nature, short duration, and 17 limited range of the noise generated during conductor installation. Thus, any impacts on marine 18 invertebrates from conductor installation-related noise are anticipated to be temporary and no more 19 than minor. Because of the distance from the POCS platforms to coastal areas, noise from 20 conductor installation is not anticipated to affect coastal invertebrates. Any turbidity generated 21 during conductor installation would dissipate within a short time (see Section 4.3.3) and result in 22 no more than temporary, short-term, and localized minor impacts on benthic organisms and their 23 habitats in the vicinity of platforms where conductor installation was occurring, and would not 24 affect coastal invertebrates. 25 26 Any effects on marine invertebrates, such as displacement of mobile species, of drilling noise 27 would be negligible because of the low intensity and intermittent nature of the drilling noise. 28 Turbidity (and subsequent sedimentation) generated during the NPDES-permitted open-water 29 discharges of drilling waste could impact marine invertebrates and habitats in the vicinity of the 30 platforms were such discharges would occur. Past studies on the POCS indicate that discharged 31 drilling muds may spread over several kilometers of seafloor (Battelle 1991, cited in MMS 2001). 32 Following the cessation of drilling waste discharges, the impacts on soft-bottom invertebrate 33 communities would be primarily related to changes in sediment grain size on the ocean floor near 34 the platform (Battelle 1991, cited in MMS 2001). Prior studies also indicate that NPDES-permitted 35 discharges of drilling wastes at POCS platforms have not caused detectable changes to nearby 36 hard-bottom communities (Diener and Lissner 1995), and that the effects of discharged drilling 37 muds are largely limited to within 1 km of the discharge site (Lissner et al. 1987, cited in MMS 38 2001). Thus, turbidity from the discharge of drilling wastes generated during new drilling would 39 result in no more than temporary, short-term, and localized minor impacts on marine invertebrates 40 and their habitats near the platforms. No impacts on coastal invertebrates and their habitats would 41 occur, due to their distance from the POCS platforms. 42 43 Two endangered abalone species (Haliotis sorenseni and H. cracherodii) occur on the POCS and 44 may be affected by conductor installation and well drilling. Populations of the endangered white 45 and black abalone have been declining for decades, primarily due to overharvesting and disease 46

Draft Programmatic EA August 2018
4-15
(66 FR 29054; 74 FR 1937). The NMFS critical habitat rule (76 FR 66805) identified increased 1
sedimentation, drilling muds, and oil spills as having the potential to affect endangered black 2
abalone. Neither endangered abalone species is likely to be affected. Both these species are very 3
rare in the Southern California Bight (Pondella et al. 2012; Blanchette et. al 2015), and the POCS 4
platforms occur in waters deeper than those inhabited by abalone. Thus neither species is likely to 5
be exposed to turbidity and sediment plumes associated with conductor installation and drilling 6
waste discharge. In addition, bottom-disturbing activities would primarily affect soft-bottom 7
habitats where endangered abalone would not be found. A 2017 Biological Assessment (BA) 8
prepared for the NMFS (BOEM and BSEE 2017b) regarding the potential effects of POCS oil and 9
gas operations on the federally listed species identified only oil spills as a potential impacting 10
factor for these abalone species. The BA made a determination that ongoing oil and gas activities 11
are “not likely to adversely affect” these species. Similarly, the EPA found that routine discharges 12
under the NPDES permit would not affect the white abalone, or any other listed species 13
(EPA 2013b). Thus, impacts on the abalone from activities that could be permitted under 14
Alternative 1 would be negligible. 15
16
Under Alternative 2, potential impacts on marine invertebrates would be the same as for 17
Alternative 1 (localized, short term, temporary, and ranging from negligible to minor). Potential 18
minor impacts would be primarily associated with temporary localized increases in turbidity. 19
Because marine invertebrates do not generally exhibit seasonal migrations, seasonal restrictions of 20
conductor installation would not decrease the severity of any conductor-installation-related effects 21
on marine invertebrates. 22
23
Under Alternative 3, there would be no permitting of conductor installation. Therefore, impacts 24
under this alternative would be primarily associated with turbidity generated during drilling waste 25
discharge. These impacts would be similar to those under Alternatives 1 and 2: localized, short 26
term, temporary, and minor. 27
28
None of the effects identified for Alternatives 1, 2, and 3 would occur under Alternatives 4 or 5. 29
Effects from any limited downhole activities that could be authorized under Alternative 4 would 30
be negligible. Thus, overall impacts on marine and coastal invertebrates under Alternatives 4 or 5 31
would be negligible. 32
33
4.3.4.1 Cumulative Impacts 34
35
Marine and coastal invertebrate habitat and communities on the POCS have been affected by past 36
and ongoing activities such as commercial and recreational harvesting, beach development, subsea 37
cable installation and operations, and point-source and non-point-source discharges. Under the 38
Proposed Action, conductor installation would generate additional seafloor disturbance (a turbidity 39
plume), and drilling wastes would increase turbidity in the water column and sedimentation of the 40
seafloor. However, these effects would be temporary and affect only a small area. The Proposed 41
Action and the other action alternatives would have temporary and no more than minor incremental 42
impacts on marine invertebrates and their habitats, and would not result in cumulative impacts on 43
benthic resources of the POCS. 44

Draft Programmatic EA August 2018
4-16
4.3.5 Marine and Coastal Fish and Essential Fish Habitat 1
2
Under Alternative 1, marine and coastal fish and essential fish habitat (EFH) may be affected by 3
noise and turbidity during conductor installation, by noise and the discharge of drilling wastes 4
during drilling, and by noise from supply vessels supporting conductor installation and drilling 5
(Table 4-1). Ongoing permitted oil and gas production activities, supply ship and helicopter traffic, 6
and routine inspection, maintenance, and repair activities would have little to no effect on marine 7
fish and EFH. 8
9
The exposure of fish to pile-driving noise depends not only on the intensity and duration of the 10
pile driving, but also on the mobility of the fish. The effects of any such exposure also depend on 11
these factors, as well whether exposed fish have swim bladders or not. Mobile fish would be able 12
to flee the sound source, thus reducing exposure and associated effects. Laboratory studies of fish 13
exposed to pile-driving noise found damage primarily to the swim bladder, while fish with no 14
swim bladder were minimally impacted (Casper et al. 2016). Although they would be nearest to 15
the noise and vibration source, bottom-dwelling fish generally lack a swim bladder and may be 16
less sensitive to noise. Field studies found minimal avoidance by fish of pile-driving sound up to 17
162 dB (Iafrate et al. 2016). Modeling suggests that sound levels exceeding NMFS safety 18
recommendations would likely be restricted to within a few meters from the source (MacGillivray 19
and Schelsinger 2014), and thus would only affect fish nearest the platform where conductor 20
installation is occurring. Overall impacts on marine fish from pile-driving noise are anticipated to 21
be temporary, short term, localized, and minor, and thus no population-level impacts on fish are 22
expected under Alternative 1. 23
24
Conductor installation will result in a temporary and localized increase in turbidity due to sediment 25
resuspension (see Section 4.3.3), which could temporarily displace fish from the area, reduce 26
feeding efficiency, and affect gills of exposed fish. However, due to the temporary and localized 27
nature of any such increases in turbidity, exposure of marine fish to turbidity from conductor 28
installation is expected to be localized, short term, and temporary, and to result in no more than 29
minor impacts on affected fish. 30
31
There is no evidence that fish populations on the POCS have been adversely affected by noise 32
from past well drilling activities (NCE 2007). While drilling noise has the potential to displace 33
fish, noise levels would be much less than during conductor installation and would not be 34
reasonably expected to injure or kill fish. Therefore, no population-level impacts are expected from 35
drilling under Alternative 1, and overall impacts of drilling noise on fish (temporary displacement) 36
would be negligible. 37
38
The NPDES-permitted discharge of drilling muds can spread over several kilometers from the 39
discharge point, depending on discharge depth, regional hydrodynamics, and the characteristics of 40
the drill muds (Battelle 1991, cited in MMS 2001). The resultant turbidity could cause mobile fish 41
to avoid the area of the turbidity plume. Studies of the effects of discharged drilling muds and 42
cuttings found no changes to nearby hard-bottom communities (Diener and Lissner 1995). Shell 43
mounds consisting of discharged drilling solids and shell scrapings from platforms were not found 44
to contaminate seafloor EFH (Bemis et al. 2014). Thus, drilling waste discharge would have no 45

Draft Programmatic EA August 2018
4-17
more than temporary, short-term, and localized minor impacts on marine fish and their soft-1
bottom, hard-bottom, and water column habitat (including EFH). 2
3
Noise generated by ship traffic supporting conductor installation and drilling could affect nearby 4
fish. Although as many as 123 support vessel trips could be associated with Alternative 1 to support 5
conductor installation and well drilling (Table 2-2), any associated noise disturbance of fish would 6
be very localized, short term, and transitory (e.g., along the ship route between a platform and a 7
port of call), and ship noise levels would be far below levels that cause injury in fish. Impacts on 8
fish from additional vessel traffic would thus be negligible. 9
10
The potential impacts of Alternative 1 on marine fish and EFH discussed above may apply to 11
ESA-listed species in Southern California waters. The scalloped hammerhead shark has shallow-12
water nursery areas in the northern Gulf of California and Bahía Almejas on the Pacific coast of 13
Baja California Sur, which would not be affected by any of the activities that could be permitted 14
under Alternative 1. The geographic range of the Southern California steelhead includes the project 15
area (Section 3.6.3). The EPA concluded that regulated discharges would have no effect on 16
USFWS or NMFS listed species, including the steelhead trout (EPA 2013b). Furthermore, critical 17
habitat for the Southern California steelhead includes only rivers; therefore, no impacts on critical 18
habitat are expected to result from routine oil and gas production activities. In addition, as for other 19
marine fish in the area, any exposure of, and impacts on, the steelhead trout under Alternative 1 20
from noise, bottom disturbance, and turbidity would be temporary, short term, and localized, and 21
not expected to impact the Southern California population of this species, which is unlikely to be 22
common in the vicinity of the POCS platforms. 23
24
Under Alternative 2, potential impacts on marine and coastal fish and EFH would be the same as 25
those described for Alternative 1, namely short-term, localized, and temporary minor impacts from 26
conductor installation (noise and turbidity) and drilling waste discharge (turbidity). However, 27
potential impacts associated with conductor installation would not occur during periods of 28
restricted conductor installation. Potential impacts under Alternative 3 would be the same as those 29
identified for Alternatives 1 and 2, except there would be conductor installation-related impacts 30
on marine fish and EFH. Potential impacts would be associated with drilling waste discharge, and 31
would be localized, short term, temporary, and minor. 32
33
None of effects on marine fish and EFH identified for Alternatives 1, 2, or 3 would be expected 34
under Alternatives 4 or 5. Any downhole operations authorized under Alternative 4 to ensure safety 35
or pollution prevention would have negligible impacts on marine fish or EFH. Thus, the overall 36
impacts of Alternatives 4 and 5 on marine fish and EFH would be negligible. 37
38
4.3.5.1 Cumulative Impacts 39
40
Activities that have historically caused adverse impacts on EFH and fish communities on the 41
POCS include noise, dredging, dredging discharge, wastewater discharge, oil and hazardous waste 42
spills, coastal development, agricultural runoff, and commercial and recreational fisheries. Noise, 43
seafloor disturbance, and discharge of drilling wastes associated with Alternative 1 represent 44
minor, temporary, and localized incremental increases in impacts on fish and EFH. Such activities 45

Draft Programmatic EA August 2018
4-18
would contribute negligible incremental increases in POCS noise levels and would not result in 1
cumulative impacts on fish, including ESA-listed fish species. 2
3
4.3.6 Sea Turtles 4
5
Under Alternative 1, activities potentially affecting sea turtles include conductor installation, 6
drilling, open-water disposal of drilling wastes, and supply ship and BSEE helicopter traffic 7
(Table 4-1). Ongoing permitted oil and gas production activities, supply ship and helicopter traffic, 8
and routine inspection, maintenance, and repair activities would have little to no effect on sea 9
turtles. Considering their rarity in Southern California waters of the project area, exposure of any 10
of the five sea turtle species to these activities would be minimal. 11
12
Under Alternative 1, sea turtles may be affected by turbidity and noise generated during pile 13
driving of conductors. Potential effects may include behavioral disruptions, displacement or 14
reduction of prey, and injury or death (PEPC 2012a,b; Popper et al. 2014), although mortality from 15
pile-driving noise has not been documented. Noise levels generated during pile driving may injure 16
sea turtles or disrupt their behavior. Sea turtles would be expected to move away from areas of 17
auditory discomfort, so physical injury from pile driving noise is not anticipated. However, pile-18
driving noise may elicit temporary avoidance or displacement from around the platforms where 19
conductor installation is occurring, and affect behaviors such as foraging. Because sea turtles do 20
not rely on acoustics for foraging or other behaviors, the extent of any behavioral effects is unclear. 21
In its assessment of conductor installation at Platform Harmony, NMFS (2014a) concluded that 22
conductor installation at that platform using pile driving would not adversely affect sea turtles. 23
Because pile driving would be limited to only nine platforms, and would be short term and 24
temporary, and because sea turtles are scarce in the project area, it is unlikely sea turtles would be 25
close enough to be harmed by pile driving sounds. Overall, conductor installation would have 26
negligible impacts on sea turtles. Noise mitigation for pile driving (Section 4.3.2) would mitigate 27
potential impacts on sea turtles, while visual monitoring, soft-start (ramp-up) procedures, and shut-28
down protocols may further reduce the likelihood of impacts. 29
30
Under Alternative 1, sea turtles could be affected by drilling noise and by the open-water disposal 31
of drilling waste. Whereas sea turtles are most sensitive to low-frequency sounds in the 50 Hz to 32
1.6 kHz range (CSA Ocean Sciences Inc. 2014), drilling noise is strongest at even lower 33
frequencies (around 5 Hz; Section 4.3.2) and so may be less likely to disturb sea turtles. If present 34
during discharge of drilling wastes, sea turtles would avoid the resultant sediment plume, and any 35
impacts such as disruption of feeding would be short term, very localized, and likely to affect very 36
few individuals. Because of the temporary and localized nature of well drilling and the general 37
scarcity of sea turtles in the project area, impacts on sea turtles from well drilling noise and waste 38
discharge will be negligible. 39
40
Ship traffic has been reported to startle sea turtles, producing stress and increasing collision risk 41
(NRC 1990), and such effects may occur with the additional support ship traffic under 42
Alternative 1. Most such effects would be short term, temporary, and localized to the ship routes, 43
and would affect very few individuals, and thus likely have negligible impacts on sea turtles. 44
However, collisions with supply ships may have moderate impacts, because a strike may result in 45
the injury or death of the affected individual. However, collisions are unlikely, because sea turtles 46

Draft Programmatic EA August 2018
4-19
are infrequent in the project area and spend less than 4% of their time at the surface 1
(PEPC 2012a,b). Safe vessel operations to limit vessel strikes, such as limiting vessel speeds and 2
avoiding areas where sea turtles are observed, would further reduce the likelihood of ship strikes. 3
4
Under Alternatives 2 and 3, potential impacts on sea turtles would be the same as those described 5
for Alternative 1 (localized, short term, temporary, and negligible to minor). However, under 6
Alternative 2 potential strikes from supply ships supporting conductor installation would not occur 7
during periods of restricted conductor installation. Although sea turtles are rare in the area, they 8
are most likely present in Southern California during warm water months (NMSP 2008). Thus a 9
summer restriction period would minimize potential ship strikes during that time. Under 10
Alternative 3, there would be no conductor installation impacts. 11
12
None of the impacts identified for Alternatives 1, 2, or 3 would be expected under Alternatives 4 13
or 5. Any downhole operations authorized under Alternative 4 to ensure safety or pollution 14
prevention would have negligible impacts on sea turtles. Similarly, ongoing permitted oil and gas 15
production activities, supply vessel and helicopter traffic, and routine inspection, maintenance, and 16
repair activities would have little to no effect on sea turtles, with the exception of possible minor 17
impacts from ship strikes. However, in the absence of new drilling or enhanced production 18
activities, oil and gas production on the POCS may decline more rapidly under Alternatives 4 and 19
5 than under the other alternatives. As a result, supply vessel traffic servicing the platforms may 20
be expected to decline as well, thus reducing the potential for ship strikes. 21
22
4.3.6.1 Cumulative Impacts 23
24
The 2017 NMFS BA (BOEM and BSEE 2017b) identifies collisions and oil spills as a potential 25
impacting factor for the leatherback, loggerhead, green, and olive ridley sea turtles and made a 26
determination of “not likely to adversely affect” from ongoing oil and gas activities for each of 27
these species, noting little or no spatial overlap with ongoing operations. Under Alternative 1, 28
impacts on sea turtles from proposed activities would be added to impacts from entanglement or 29
incidental capture in fishing gear, vessel strikes, ingestion or entanglement in marine debris, 30
environmental contamination, and disease. In areas outside of Southern California, impacts include 31
those from loss of nesting habitat, beach armoring, artificial light, harvesting of eggs and meat, 32
and non-native vegetation (Kaplan et al. 2010; NMFS 2014b,c; NMFS 2016a,b). Because 33
Alternative 1 would add a negligible incremental increase in ship strikes on the POCS, and 34
considering the different nature most other impacts to sea turtles (almost exclusively non-oil and 35
gas related), this alternative would not result in significant cumulative impacts on sea turtles. 36
37
4.3.7 Marine and Coastal Birds 38
39
Under Alternative 1, impacting factors that could affect marine and coastal birds include conductor 40
installation and drilling noise, platform lighting, drilling waste discharge, and support vessel and 41
BSEE helicopter traffic (Table 4-1). Ongoing permitted oil and gas production activities, supply 42
ship and helicopter traffic, and routine inspection, maintenance, and repair activities would have 43
little to no effect on marine and coastal birds and their habitats. 44

Draft Programmatic EA August 2018
4-20
Impacting factors associated with conductor installation include noise from pile driving and 1
platform lighting. Birds on the water surface, perched on the platform, or flying near the platform 2
could be harassed by exposure to pile-driving noise, but may be expected to leave the area before 3
injury could occur. Diving birds such as diving ducks, cormorants, and pelicans could be exposed 4
to impulsive underwater sounds from pile driving. However, impacts are unlikely, because 5
conductor installation would occur beneath the platform where diving birds are not expected to 6
congregate or dive. Exposure of marine birds to pile-driving noise would be temporary and 7
minimal. In addition, because of the distance of the POCS platforms from the coast, birds in coastal 8
habitats would not be affected by airborne sound generated at platforms during conductor 9
installation. Because noise from conductor installation will have no more than temporary and 10
localized effects on marine birds and no effect on coastal birds, overall impacts of conductor 11
installation on birds would be minor. In addition, mitigation such as gradually ramping up sound 12
levels would encourage most birds to leave the platform area before underwater noise reached 13
potentially injurious levels (BOEM 2014c). 14
15
Nighttime lighting of offshore structures, including POCS platforms and commercial and 16
recreational boats, may cause disorientation, mortality from collisions with lighted structures, and 17
interruption of natural behaviors (BOEM and BSEE 2017b). All the POCS platforms are currently 18
well lit at night, and any additional lighting associated with conductor installation under 19
Alternative 1 would be temporary, short term, and limited to only a few POCS platforms. Thus, 20
this additional lighting would have a negligible impact on marine and coastal birds. 21
22
Marine and coastal birds could be affected by drilling noise and drilling waste discharges. 23
Underwater noise levels from drilling would be only marginally greater than ambient levels around 24
the platforms (Gales 1982; MacGillivray and Schlesinger 2015), and well below noise levels 25
generated during conductor installation (Section 4.3.2). Seabirds are attracted to offshore 26
structures (BOEM 2016) and show no evidence of being adversely affected by drilling noise. 27
Diving birds may be exposed to turbidity plumes resulting from NPDES-permitted drilling waste 28
discharge, but such exposure would be unlikely and short term. Any associated impacts would 29
most likely be indirect, consisting primarily of the temporary displacement or reduction of prey 30
species within the plume area, and would affect only birds that can dive deep enough to encounter 31
the plume. Thus, impacts on marine birds would be negligible. 32
33
Because of the transitory nature of support vessel and BSEE helicopter traffic that would occur 34
under Alternative 1, and the mobility of marine birds, it is unlikely that marine birds will be 35
affected by support vessel and helicopter traffic. Although support vessel and helicopter traffic 36
may elicit an avoidance responses in birds present along the ship and helicopter routes and at the 37
platforms, any such disturbance would be occasional and transient, and any resultant impacts 38
would be negligible. 39
40
Under Alternatives 2 and 3, potential impacts would be similar to those described for Alternative 1. 41
However, potential impacts from noise and support vessel traffic during conductor installation 42
would not occur under Alternative 2 during periods of restricted conductor installation, and they 43
also would not occur at any time under Alternative 3. Thus, overall impacts under either of these 44
alternatives would be negligible. 45
46

Draft Programmatic EA August 2018
4-21
None of the effects on marine and coastal birds identified for Alternatives 1, 2, and 3 would be 1
expected under Alternatives 4 or 5, and any downhole operations authorized under Alternative 4 2
to ensure safety or pollution prevention would have negligible impacts. Previously permitted 3
activities, supply vessel and helicopter traffic, and routine inspection, maintenance, and repair 4
activities would continue to occur and would have little to no effect on marine and coastal birds. 5
Thus, overall impacts of Alternatives 4 and 5 on marine and coastal birds would be negligible. 6
7
4.3.7.1 Cumulative Impacts 8
9
Because the impacts of Alternative 1 on marine and coastal birds would be negligible, there would 10
be no incremental increase in impacts from ongoing habitat loss, bird collisions, and stressors from 11
other land- and ocean-based human activities (Halpern et al. 2009). The 2017 BA (BOEM and 12
BSEE 2017a) identified an oil spill as a potential impacting factor for four federally listed bird 13
species, and artificial lighting and noise as additional factors for one species. A “likely to adversely 14
affect” determination was made only for an oil spill and only for the western snowy plover and the 15
California least tern. These are both coastal species that would be unlikely to be exposed to a 16
200-bbl maximum spill anticipated for Alternative 1 (Section 4.2.2). Thus, this alternative would 17
not result in cumulative impacts on marine and coastal birds, including ESA-listed species. 18
19
4.3.8 Marine Mammals 20
21
Under Alternative 1, marine mammals may be affected by noise generated during conductor 22
installation and drilling, by exposure to turbidity associated with drilling waste discharge, and by 23
disturbance from or interactions with support vessel and BSEE helicopter traffic (Table 4-1). 24
Ongoing permitted oil and gas production activities, supply ship and helicopter traffic, and routine 25
inspection, maintenance, and repair activities would have little to no effect on marine mammals. 26
27
The primary concern for conductor installation is harassment from noise. The Marine Mammal 28
Protection Act (MMPA) amendments of 1994 define harassment as any act of pursuit, torment, or 29
annoyance, which may cause Level A or Level B harassment. Level A harassment has the potential 30
to injure a marine mammal or marine mammal stock in the wild. Level B harassment does not 31
have injury potential, but rather the potential to disturb a marine mammal or marine mammal stock 32
in the wild by causing disruption of behavioral patterns including, but not limited to, migration, 33
breathing, nursing, breeding, feeding, or sheltering. The NMFS (2017g) has developed interim 34
threshold sound levels corresponding to MMPA Level A (injury) and Level B (behavioral 35
disturbance) harassments for cetaceans and pinnipeds (Table 4-6). 36
37
Impulsive pile-driving sound can cause behavioral changes and auditory masking in marine 38
mammals. Masking is the obscuring of sounds of interest (e.g., sound of prey or predators) by 39
other, stronger sounds, often at similar frequencies (Erbe et al. 2016). Pile-driving sound would 40
likely be within the audible range of marine mammals present in the project area, which ranges 41
from 7 Hz to as high as 160 kHz (BOEM 2016; NMFS 2016f). 42

Draft Programmatic EA August 2018
4-22
TABLE 4-6 NMFS Interim Sound Threshold Guidance 1
Criterion Criterion Definition Threshold
In-water acoustic thresholds (excludes tactical sonar and explosives)a Level A PTSb (injury) conservatively based on TTSb 190 dBrms
b for pinnipeds 180 dBrms for cetaceans
Level B Behavioral disruption for impulsive noise (e.g., impact pile driving) 160 dBrms Level B Behavioral disruption for non-pulse noise (e.g., vibratory pile driving,
drilling) 120 dBrms
c
In-air acoustic thresholdsd Level A PTS (injury) conservatively based on TTS None established Level B Behavioral disruption for harbor seals 90 dBrms Level B Behavioral disruption for non-harbor seal pinnipeds 100 dBrms
a All decibels referenced to 1 micro-Pascal (re: 1 µPa), and all thresholds are based on root mean square (rms) 2 levels. 3
b PTS = permanent threshold shift; TTS = temporary threshold shift, dB = decibel. 4 c The 120-dB threshold may be slightly adjusted if background noise levels are at or above this level. 5 d All decibels referenced to 20 micro-Pascals (re: 20 µPa). Note all thresholds are based on rms levels. 6 Source: NMFS (2017e). 7
8 9 Modeling of underwater and airborne sound transmission from conductor installation at Platform 10 Harmony estimated underwater pile-driving sound exceeding the Level A (injury) threshold to 11 extend from the conductor out 54 m (177 ft.) for cetaceans and out to 9 m (30 ft.) for pinnipeds 12 (Table 4-7) (MacGillivray and Schlesinger 2015). The estimated maximum distance at which the 13 Level B (behavioral disturbance) threshold was exceeded was 1,189 m (3,900 ft.) for both 14 cetaceans and pinnipeds (Table 4-7). Modeled airborne sound levels exceeding Level B 15 harassment extended out to 46 m (150 ft.) from the conductor pipe for harbor seals and out to 14 m 16 (46 ft.) for all other pinnipeds (Table 4-7) (MacGillivray and Schlesinger 2014). Similar threshold 17 distances would apply at other platforms on the POCS during conductor installation. Airborne 18 sound from pile driving would occur at a few platforms, would be brief and temporary, and would 19 not result in any long-term increase in airborne noise levels on the POCS. 20 21 Noise can cause permanent threshold shifts (PTSs) or temporary threshold shifts (TTSs) in the 22 hearing of marine mammals. If hearing is impaired for hours or days, the impact may be 23 ecologically significant (Kastelein et al. 2015). Table 4-8 summarizes the PTSs and TTSs for 24 marine mammal hearing groups. The TTS is often used as the maximum desirable noise exposure 25 criteria for marine mammals (Duncan and McCauley 2008). Because the TTS levels are similar to 26 the Level A and Level B threshold levels, threshold levels may extend similar distances from the 27 conductor pipe during pile driving. 28

Draft Programmatic EA August 2018
4-23
TABLE 4-7 Maximum Distances (in meters) from the Conductor Pipe at Platform Harmony for 1 Interim Level A and Level B Exposure Thresholds to Marine Mammals Based on Maximum 2 Hammer Energy (90 kJ) 3
Underwater Airbornea
Level A Exposureb Level B Exposurec Level B Exposurec
Marine Mammal Group Threshold (dBrms)d
Maximum Distance
(m)
Threshold (dBrms)d
Maximum Distance
(m)
Threshold (dBrms)e
Maximum Distance
(m)
Cetaceans 180 54 160 1,189 not applicable Pinnipeds (harbor seals) 190 9 160 1,189 90 46 Pinnipeds (non-harbor seals) 190 9 160 1,189 100 14
a NMFS has not established an interim threshold for Level A exposure. 4 b Interim exposure levels for potential to injure a marine mammal or marine mammal stock in the wild. 5 c Interim exposure levels for potential to disturb a marine mammal or marine mammal stock in the wild by causing 6
disruption of behavioral patterns, including, but not limited to, migration, breathing, nursing, breeding, feeding, or 7 sheltering. 8
d Rms pressure based on 1 µPa for underwater decibels. 9 e Rms pressure based on 20 µPa for airborne decibels. 10 Sources: Howorth (2014); Maxon Consulting, Inc. (2015); MacGillivray and Schlesinger (2015). 11
12 TABLE 4-8 Summary of PTS and TTS Acoustic Thresholds for Marine Mammals 13
PTS Onset Acoustic Thresholds
(Received Level)
Hearing Group Impulsive Non-impulsive Weighted TTS
Onset Threshold
Low-frequency Cetaceans 219 dB (peak) 183 dB (cumulative)
199 dB (cumulative)
Mid-frequency Cetaceans 230 dB (peak) 185 (cumulative)
198 dB (cumulative) 178 dB
High-frequency Cetaceans 202 dB (peak) 155 dB (cumulative)
173 dB (cumulative) 153 dB
Phocid Pinnipeds (underwater) 218 (peak) 185 (cumulative)
201 dB (cumulative) 181 dB
Otariid Pinnipeds (underwater) 232 dB (peak) 203 dB (cumulative)
219 dB (cumulative) 199 dB
Source: NMFS (2016f). 14 15 16 Assuming threshold exceedance distances similar to those estimated for Platform Harmony, under 17 Alternative 1 the potential for injury or TTS during pile driving would be limited to within 60 m 18 (200 ft.), and behavioral disturbance would be limited to within 1,200 m (3,900 ft.) of a platform. 19 It is unlikely that any large cetaceans (i.e., whales) would be present within these distances, 20 although smaller cetaceans (e.g., dolphins), especially pinnipeds, are more likely to be present 21

Draft Programmatic EA August 2018
4-24
within such distances. However, due to the nature of impulsive pile driving (Section 4.3.2), 1
exposure to such noise levels would be intermittent and short term, and marine mammals would 2
be expected to quickly leave the area with the onset of hydraulic hammering. Thus, conductor 3
installation has the potential to result in minor to moderate impacts on marine mammals. 4
5
Possible mitigation measures for Level A and Level B harassment of marine mammals during 6
impulsive conductor installation include visual monitoring, passive acoustic monitoring, ramp-up 7
(soft-start) procedures, and shutdown protocols. Further mitigations include acoustic thresholds in 8
combination with corresponding buffer and exclusion zones (NMFS 2014a). NMFS-qualified 9
Protected Species Observers may conduct visual monitoring during active installation. Emergency 10
shutdown procedures for North Pacific right whales and blue, fin, sei, humpback, or sperm whales 11
may also be undertaken. Ramp-up procedures would also mitigate potential noise impacts on 12
marine mammals, including pinnipeds that haul out on platforms (BOEM 2014b), allowing any 13
nearby animal to flee the area before the hammer energy reaches maximum levels. 14
15
BOEM and BSEE do not anticipate a Level A “take” (i.e., injury or death) of any marine mammals 16
caused by sound from impulsive conductor installation. In the Pacific, when disturbance of marine 17
mammals is anticipated on a given installation, operators are expected to obtain incidental 18
harassment authorization (IHA) from the NMFS. An intra-service or joint-agency ESA 19
consultation with NMFS would be conducted when specific project information becomes available 20
(BOEM and BSEE 2017b). The Bureaus expect operators to obtain an IHA from the NMFS before 21
any conductor installation could occur, and mitigations would be developed and applied to the 22
extent needed to meet the requirements of the IHA.20 To issue such an IHA, NMFS would be 23
required to find, among other things, that the activity will not result in more than a negligible 24
impact on the species or stock and that it will result in the taking of only small numbers of marine 25
mammals. NMFS would also impose appropriate mitigations to effect the smallest practicable 26
adverse impact on the species. For these reasons, conductor installation is expected to result in 27
only negligible impacts with application of an IHA. 28
29
Marine mammals may be affected by drilling noise and by turbidity plumes generated during 30
permitted open-water discharge of drilling waste. Drilling noise typically falls between 4.5 and 31
30 Hz, which is generally below reported hearing ranges for marine mammals (Kaplan et al. 2010). 32
It is strongest at very low frequencies, peaking at 5 Hz (BOEM 2012), with highest frequencies of 33
about 1.2 kHz (BOEM and BSEE 2017b). Because of the relatively small amount of drilling 34
expected under Alternative 1 (Table 2-2), the temporary duration of drilling, and the general 35
scarcity or irregular occurrence of marine mammals in the vicinity of the POCS platforms, 36
exposure of marine mammals to drilling noise would be only occasional and temporary. Drilling 37
noise would not cause hearing effects, and exposed individuals would likely move away from the 38
source (BOEM 2012). Thus, impacts from drilling noise on marine mammals would be negligible. 39
20 An IHA may be issued under Section 101(a)(5)(D) of the MMPA for no more than a 1-year period (but may be
renewed for additional terms) and applies if the action results in harassment only. A Letter of Authorization (LOA)
under Section 101(a)(5)(A) and issued pursuant to incidental take regulations would apply if the action results in
harassment only but is planned for multiple years (up to five), or if the action results in serious injury or mortality.
The issuance of an Incidental Take Authorization, while not anticipated under the proposed action, would require
NMFS to comply with both NEPA and Section 7 of the Endangered Species Act as well.

Draft Programmatic EA August 2018
4-25
Permitted open-water discharge of drilling waste may cause marine mammals to avoid the resultant 1
turbidity plumes (PEPC 2012a,b). Given the small amount of anticipated drilling, disturbance of 2
marine mammals by such turbidity plumes would have negligible impacts. 3
4
Under Alternative 1, marine mammals may be affected by ship and helicopter noise or by collisions 5
with supply vessels supporting conductor installation and well drilling (Table 2-2). Although ship 6
noise can disturb animals in the immediate vicinity of the ship, any disturbance would be transitory 7
(BOEM 2012). Support vessel sound levels would be ≤180 dB, which are similar to those of larger 8
commercial fishing vessels in the area (BOEM and BSEE 2017b). However, broadband sound 9
levels for service vessels are in the range of 150 to 170 dB, which is within the audible range for 10
all cetaceans and pinnipeds, and may exceed the NMFS threshold for Level B harassment for non-11
pulse noise (Table 4-7). Thus, noise from support vessels may elicit a startle and/or avoidance 12
reaction, or mask sound reception. Because of the limited routes support vessels would take to and 13
from platforms, and the temporary and transient nature of the vessel traffic, impacts on marine 14
mammals from noise generated by additional support ship trips under Alternative 1 would be no 15
more than minor. Underwater sound from helicopter overflights may be within the frequency 16
hearing range of most marine mammals (BOEM 2016), and thus may affect marine mammals. 17
Occasional overflights may elicit a startle response in cetaceans due to noise or presence. However, 18
minimal impacts are expected. Helicopters fly more than 500 ft. above the water and most 19
cetaceans are submerged the majority of the time (BOEM and BSEE 2017b). Sound levels in water 20
generated from helicopter flyovers have been reported at 109 dB re 1 µPa (BOEM 2014b), well 21
below Level A, Level B, and TTS levels. Thus, impacts of helicopter overflights on marine 22
mammals will be transient, temporary, and negligible to minor. 23
24
Under Alternative 1 there could be up to 123 additional support vessel trips, and marine mammals 25
could be injured or killed in collisions with these ships. Slow-moving cetaceans or those that spend 26
extended time at the surface are most vulnerable (Vanderlaan and Taggert 2007). However, ship 27
strikes off the coast of southern California are infrequent (Berman-Kowaleski et al. 2010). There 28
have been very few documented instances of a support vessel striking a pinniped in the POCS 29
(MMS 2005), and no known ship strikes of marine mammals by support vessels serving the POCS 30
platforms. Support vessel traffic under Alternative 1 would be temporary and associated with only 31
a handful of platforms, and would occur along the same routes used by the supply ships that support 32
current oil and gas production activities on the POCS. Although ship strikes are unlikely, because 33
of the protected status of marine mammals, impacts from ship strikes under Alternative 1 activities 34
would be moderate. 35
36
Under Alternative 2, potential impacts on marine mammals would be similar to those described 37
for Alternative 1. However, Alternative 2 includes seasonal restrictions on impulsive conductor 38
installation to minimize potential noise impacts when marine mammals may be present or most 39
abundant.21 For example, a summer closure period could minimize potential noise impacts on blue 40
whales when they may be most abundant (but still uncommon) in the eastern Santa Barbara 41
Channel and the San Pedro Basin lease areas (Table 2-3). Other species (e.g., humpback and 42
Pacific gray whales) would be most abundant in the fall and winter. Thus, such seasonal closures 43
21 Time-period restrictions have been employed to minimize impacts on marine mammals for activities such as
seismic surveys, pile driving, and commercial fishing.

Draft Programmatic EA August 2018
4-26
represent a tradeoff between different species, and no one closure period offers protection to all 1
marine mammal species in the project area. Any reduction of overall impacts on marine mammals 2
from seasonal restrictions under this alternative would thus likely be small due to the mentioned 3
tradeoffs. Thus, potential impacts under Alternative 1 from impulsive conductor installation may 4
be somewhat less for species most abundant during the conductor installation restriction period, 5
but the same for all species during other times. 6
7
Under Alternative 3, potential impacts would be the same as those identified for Alternatives 1 8
and 2 (minor), except there would be no conductor installation and thus no associated impacts on 9
marine mammals. Because there would be no conductor installation under Alternative 3, there 10
would be less support vessel traffic and thus a reduced ship strike potential (although still a minor 11
impact) than under Alternatives 1 and 2. 12
13
None of the potential impacts identified for Alternatives 1, 2, and 3 would occur under 14
Alternatives 4 or 5, and any downhole operations authorized under Alternative 4 to ensure safety 15
or pollution prevention would have negligible impacts on marine mammals. Previously permitted 16
activities, supply vessel and helicopter traffic, and routine maintenance, inspection, and repair 17
activities would continue and would have little to no effect on marine mammals, with the possible 18
exception of potential strikes from ongoing supply ship traffic. As with the other alternatives, ship 19
strikes are unlikely. Thus, overall impacts on marine mammals under Alternatives 4 and 5 would 20
be negligible from all activities with a possible exception of unlikely but minor impacts should a 21
ship strike occur. 22
23
4.3.8.1 Cumulative Impacts 24
25
Past and ongoing impacts on marine mammals on the POCS include those from oil and gas 26
production; natural oil seeps; industrial, municipal, and agricultural runoff and discharges; marine 27
debris; vessel and air traffic; non-native species; urban development; military testing and training 28
activities; commercial and recreational fishing; commercial shipping; recreational boating, 29
anthropogenic and natural toxins; unusual mortality events (UMEs), and increases in marine 30
predators. For example, commercial fishing may accidentally entangle and drown or injure 31
cetaceans (Northridge and Hoffman 1999, cited in NOAA 2014). Weather (e.g., storms and 32
El Niño events) and climate change may also affect marine mammals. Impacts from these factors 33
range from chronic and sporadic sublethal effects to mortality of individuals and possible 34
population-level changes (Cassoff et al 2011; Halpern et al. 2009; Kaplan et al. 2010). Negligible 35
to minor, incremental contributions from Alternative 1 would not result in cumulative impacts on 36
marine mammal populations. The 2017 NFMS BA (BOEM and BSEE 2017b) identifies noise, 37
ship strikes, and oil spills as potential impacting factors for seven ESA-listed whales potentially 38
affected by ongoing oil and gas operations: blue whale, fin whale, humpback whale, north pacific 39
right whale, sei whale, sperm whale, western gray whale, and from an oil spill for the listed 40
Guadalupe fur seal (see Section 3.9). The BA made a determination of “not likely to adversely 41
affect” for each of these species, noting little or no spatial overlap with ongoing operations. 42
43

Draft Programmatic EA August 2018
4-27
4.3.9 Commercial and Recreational Fisheries 1
2
Under the Proposed Action, commercial and recreational fish species could be affected in the same 3
manner as other marine species (see Sections 4.3.4 and 4.3.5). Pile driving noise and turbidity 4
generated during conductor installation and during drilling waste disposal could temporarily 5
displace fish and potentially disrupt fishing, but result in no more than minor localized and 6
temporary impacts on nearby commercial and recreational fisheries. The additional vessel traffic 7
that could be needed over a 5-year period to support conductor installation and drilling activities 8
(Table 2-2) would follow routes routinely traveled by supply vessels currently servicing the 9
platforms on a daily basis, and would cease after completion of conductor installation and drilling 10
activities. Thus, support vessel traffic would not be expected to interfere with access to commercial 11
or recreational fishing areas, and would have a negligible impact on commercial or recreational 12
fishing activities in areas long accustomed to the presence of oil and gas activities. 13
14
Under Alternatives 2 and 3, potential impacts on commercial and recreational fishing would be 15
similar to those described for Alternative 1. However, potential impacts associated with conductor 16
installation (i.e., noise impacts during pile-driving) would not occur under Alternative 2 during 17
periods when installation is restricted, and no conductor-related impacts would occur under 18
Alternative 3. Overall impacts under both alternatives would be negligible. 19
20
Under Alternatives 4 and 5, none of the potential impacts identified for Alternatives 1, 2, and 3 21
would occur. Thus, overall impacts on commercial and recreational fishing from implementation 22
of Alternatives 4 or 5 would be negligible. 23
24
4.3.9.1 Cumulative Impacts 25
26
Past, current, and anticipated future impacts on recreational and commercial fisheries on the POCS 27
include the effects of overharvesting, vessel traffic, underwater construction activities, point-28
source and non-point-source discharges, and anthropogenic alteration of habitat (e.g., dredging or 29
conversion of wetlands used by fishery species). The negligible incremental effects of 30
Alternative 1 would not result in cumulative impacts on recreational and commercial fisheries. 31
32
4.3.10 Socioeconomics 33
34
None of the activities that could be permitted under Alternative 1 or 2 are expected to significantly 35
affect employment, income, State and local tax revenues, population growth, housing, or 36
community and social services. None of the activities that could be permitted would not require 37
any significant increase in platform crew over current operations, and there would be no noticeable 38
change in the workforce, routine supply vessel traffic, or helicopter traffic. Temporary and 39
occasional increases in port activities associated with conductor installation or new drilling are 40
expected to result in very localized and limited economic benefits for area businesses. Overall, the 41
socioeconomic impacts of activities that could be permitted under Alternatives 1 or 2 would be 42
negligible. 43
44
Under Alternative 3 there would be no noticeable change in the workforce, routine supply vessel 45
traffic, or helicopter traffic supporting platform operations. Because no conductor installation 46

Draft Programmatic EA August 2018
4-28
would occur with this alternative, any temporary increases in port activities would be associated 1
primarily with new drilling, and any limited and temporary economic benefits for area businesses 2
would be even less than under Alternatives 1 or 2. Overall, socioeconomic impacts of activities 3
that could be permitted under Alternative 3 would be negligible. 4
5
Alternative 4 is not expected to result in any socioeconomic impacts on the local or regional 6
economies in the short term, because currently permitted oil and gas production activities would 7
continue. Oil and gas production on the POCS has been steadily declining as reserves become 8
depleted, and would continue at a similar rate under Alternatives 1, 2 and 3. However, in the 9
absence of new drilling and/or implementation of enhanced production activities as would occur 10
under Alternative 4, oil and gas production may decline more rapidly than under any of the other 11
action alternatives. Over time, this would result in a decline in POCS-related employment, income, 12
and State and local tax revenues, and would result in minor socioeconomic impacts, although 13
offshore oil and gas extraction is not a large component of the regional economy. 14
15
Impacts under Alternative 5, No Action, would be similar to those identified for Alternative 4. 16
However, under Alternative 5 there would be no authorization of activities related to safe 17
operations or pollution prevention, which would allow production to continue at wells where safety 18
or pollution prevention concerns are identified. Instead, BSEE would enforce a shut-in of such 19
wells by issuing an Incident of Noncompliance, and no further production would occur at the well. 20
Thus, oil and gas production could decline more rapidly and result in a more rapid decline in 21
employment, income, and State and local tax revenues than under Alternative 4. While such 22
declines may occur more quickly under the No Action alternative, overall socioeconomic impacts 23
would still be minor, because offshore oil and gas extraction is not a large component of the 24
regional economy. 25
26
4.3.10.1 Cumulative Impacts 27
28
Because of Alternative 1 would have negligible socioeconomic impacts, there would be no 29
cumulative socioeconomic impacts. 30
31
32
4.4 SUMMARY OF THE ENVIRONMENTAL IMPACTS OF THE PROPOSED 33
ACTION AND ALTERNATIVES 34
35
Under the Proposed Action, the activities that could be approved and permitted have the potential 36
to affect a variety of resources. The nature and magnitude of the potential impacts would be similar 37
among Alternatives 1–3, except there would be no conductor installation–related impacts under 38
Alternative 3. Impacts of these three alternatives are estimated to be negligible to minor, with the 39
possible exception of potentially moderate impacts on marine mammals from conductor 40
installation noise, and from collisions of sea turtles and marine mammals with supply ships. In 41
contrast, none of the potential effects identified for the Proposed Action would be expected with 42
Alternative 4, under which only temporary well abandonment or casing pressure repair would be 43
authorized if deemed necessary for safety or pollution prevention. They also would not be expected 44
with Alternative 5, No Action, under which there would be no further APD or APM approvals. 45
Given the small number, limited locations, and temporary duration of the activities that are 46

Draft Programmatic EA August 2018
4-29
reasonably foreseeable under Alternative 1, none of the alternatives would result in more than 1
short-term, temporary, and localized minor impacts on the environment, with the possible 2
exception of short-term, temporary, and localized moderate impacts on sea turtles and marine 3
mammals from ship strikes (Table 4-9). 4
5
Oil and gas production on the POCS has been declining over the last 20 years, and is expected to 6
continue to do so under each of the alternatives. Under Alternative 4, in the absence of new drilling 7
and authorization of enhanced production activities, oil and gas production would decline more 8
quickly than under any of the other action alternatives. As a consequence, overall employment, 9
revenue, and State and local taxes may be expected to decline more rapidly than under 10
Alternatives 1–3. Under Alternative 5, there would be no authorization of APMs, which could 11
allow some wells (i.e., those with safety or pollution prevention concerns) to continue production. 12
Rather, BSEE would enforce shut-in at such wells by issuing an Incident of Noncompliance, and 13
production at the well would cease. Thus, Under Alternative 5, oil and gas production could decline 14
more rapidly than under Alternative 4, and thus result in a more rapid decline in employment, 15
income, and State and local tax revenues. 16
17
Given the temporary, short-term, and highly localized activities that could be permitted under the 18
Proposed Action, the incremental contribution of impacts from the Proposed Action on area 19
resources are not expected to result in significant cumulative impacts when added to past, current, 20
and foreseeable future impacts on these resources. 21
22
Although an accidental hydrocarbon release during well drilling and subsequent production may 23
also affect a variety of resources, all four alternatives have a similarly low potential for an 24
accidental oil spill of a maximum likely size of 200 bbl (Section 4.2.2). An assumed 200-bbl 25
maximum likely oil spill would cover a small area and last a short time, and would be further 26
ameliorated by the resulting cleanup and response activities. Therefore, the exposure of resources 27
to an accidental oil spill of this size occurring at one of the POCS production platforms would be 28
very localized and temporary, and associated impacts would be negligible to minor. In addition, 29
potential impacts on climate change from an anticipated small oil spill (200 bbl) would be 30
negligible. 31

Draft P
rogramm
atic EA
A
ugust 2018
4-30
TABLE 4-9 Summary Comparison of Potential Effects Among Alternatives 1
Resource Alternative 1—Proposed
Action
Alternative 2—Time-Restricted Conductor
Installation Alternative 3—No Conductor
Installation
Alternative 4—Approval of Permits Needed Only for
Safety or Pollution Prevention Alternative 5—No Action
Air Quality Negligible to minor temporary and localized impacts from conductor installation, well drilling, and associated support ship and BSEE helicopter traffic. Emissions from ongoing oil and gas operations would continue, and overall emissions would decline as oil and gas production on the POCS continues to decline. Contributions to regional GHG levels would be negligible.
Similar to Alternative 1, except no conductor-related emissions during restricted installation times.
Similar but reduced emissions compared to Alternative 1, because no new conductor installation would occur.
None of the emissions (including GHG emissions) identified for Alternative 1 would occur. Emissions from ongoing operations would continue but may decline more rapidly as reserves decline and there is no authorization of new drilling or enhanced production activities.
Same as Alternative 4.
Acoustic Environment (Noise)
Minor temporary, short-term, and localized impacts from impulsive conductor installation and well drilling; negligible impacts from support ship and helicopter traffic. Noise would continue to be generated by ongoing operations, but overall levels would decline as production continues to decline.
Similar to Alternative 1, except no noise impacts related to conductor installation during restricted installation times.
Similar but reduced impacts from conductor-related noise compared to Alternative 1, because no new conductor installation would occur.
None of the impacts identified for Alternative 1 would occur. Noise from ongoing operations would continue to be generated but levels may decline more rapidly as reserves decline and there is no authorization of new drilling or enhanced production activities.
Same as Alternative 4.
Water Quality Negligible to minor temporary, short-term, and localized impacts due to turbidity from conductor installation and from NPDES-permitted open-water discharge of drilling wastes.
Similar to Alternative 1, except no conductor-related impacts during restricted installation times.
Similar to but reduced impacts from turbidity compared to Alternative 1, because no new conductor installation would occur.
None of the impacts identified for Alternative 1. NPDES-permitted discharges from ongoing operations would continue, but overall level may decline as reservoirs decline and there is no authorization of new drilling or enhanced production activities.
Same as Alternative 4.
2

Draft P
rogramm
atic EA
A
ugust 2018
4-31
TABLE 4-9 (Cont.) 1
Resource Alternative 1—Proposed
Action
Alternative 2—Time-Restricted Conductor
Installation Alternative 3—No Conductor
Installation Alternative 4—No Conductor Installation or Well Drilling
Marine/Coastal Invertebrates
Negligible to minor temporary, short-term, and localized impacts from turbidity during conductor installation and the discharge of drilling wastes. Negligible impacts from noise and ongoing permitted and routine operations.
Similar to Alternative 1, except no conductor-related impacts during restricted installation times.
Similar but reduced impacts from turbidity compared to Alternative 1, because no new conductor installation would occur.
None of the impacts identified for Alternative 1 would occur.
Same as Alternative 4.
Marine/Coastal Fish and Essential Fish Habitat
Minor temporary, short-term, and localized impacts from noise during impulsive conductor installation, and from turbidity during conductor installation and discharge of drilling wastes; negligible impacts from drilling noise and support vessel traffic.
Similar to Alternative 1, except no conductor-related noise and turbidity impacts during restricted installation times.
Similar but reduced impacts from noise compared to Alternative 1, because no new conductor installation would occur.
None of the impacts identified for Alternative 1 would occur.
Same as Alternative 4.
Sea Turtles Negligible to minor temporary, short-term, and localized impacts from noise during impulsive conductor installation and drilling, and from turbidity during conductor installation and drilling waste discharge; and moderate but very unlikely impacts from vessel strikes along supply routes. A very low potential for strikes from vessels supporting ongoing oil and gas production would continue.
Similar to Alternative 1, except no conductor-related noise, turbidity, or vessel strike impacts during restricted installation times.
Similar to but reduced impacts from noise, turbidity, and ship strikes compared to Alternative 1, because no new conductor installation would occur.
None of the impacts identified for Alternative 1 would occur. A very low potential for strikes from vessels supporting ongoing production would continue, but may decline as production activities decline in the absence of new drilling or enhanced production activities.
Same as Alternative 4.
2

Draft P
rogramm
atic EA
A
ugust 2018
4-32
TABLE 4-9 (Cont.) 1
Resource Alternative 1—Proposed
Action
Alternative 2—Time-Restricted Conductor
Installation Alternative 3—No Conductor
Installation Alternative 4—No Conductor Installation or Well Drilling
Marine and Coastal Birds
Negligible to minor temporary, short-term, and localized impacts from noise during impulsive conductor installation and drilling; negligible impacts from turbidity, additional platform lighting, and support vessel and helicopter traffic during conductor installation and drilling.
Similar to Alternative 1, except no conductor-related noise impacts during restricted installation times.
Similar to but reduced impacts from noise compared to Alternative 1, because no new conductor installation would occur.
None of the impacts identified for Alternative 1 would occur.
Same as Alternative 4.
Marine Mammals Minor to moderate temporary, short-term, and localized impacts from noise during impulsive conductor installation. Negligible to minor temporary, short-term, and localized impacts from drilling noise and supply vessel and helicopter traffic; moderate impacts from vessel strikes along supply routes.
Similar to Alternative 1, except no conductor-related noise impacts during restricted installation times when sensitive species may be present.
No impacts from impulsive conductor installation and similar but reduced impacts from vessel traffic compared to Alternative 1, because no new conductor installation would occur.
None of the impacts identified for Alternative 1 would occur. The very low potential for strikes from vessels supporting ongoing production would continue, but may be expected to be even lower as production activities decline in the absence of new drilling or enhanced production activities.
Same as Alternative 4.
Commercial and Recreational Fisheries
Negligible to minor temporary, short-term, and localized impacts from noise and turbidity during conductor installation and drilling waste discharge; negligible impacts from space use conflicts with support vessel traffic.
Similar to Alternative 1, except no conductor-related noise impacts during restricted installation times.
Similar but reduced noise impacts compared to Alternative 1, as no new conductor installation would occur.
None of the impacts identified for Alternative 1 would occur.
Same as Alternative 4.
2 3 4

Dra
ft Pro
gra
mm
atic E
A
Au
gu
st 201
8
4-3
3
TABLE 4-9 (Cont.) 1
Resource
Alternative 1—Proposed
Action
Alternative 2—Time-
Restricted Conductor
Installation
Alternative 3—No Conductor
Installation
Alternative 4—No Conductor
Installation or Well Drilling
Socioeconomics Negligible impacts from
temporary, short-term, and
localized increases in work
force and materials during
conductor installation and
drilling. Due to continued
expected decline in production,
overall levels of employment,
income, and local and state
revenues will likely slowly
decline.
Same as Alternative 1. Similar to Alternative 1. In the absence of authorizing
permits for new drilling or
enhanced production activities,
oil and gas production is
expected to decline more
rapidly than under
Alternative 1. As a result,
minor impacts may occur as
local employment, income, and
state and local tax revenues
decline more rapidly than
under Alternative 1.
Similar to Alternative 4, except
employment, income, and tax
revenues may decline more
rapidly as BSEE enforces shut-
in of wells posing safety or
pollution prevention concerns
rather than permitting
downhole operations to ensure
safe operations or pollution
prevention and continued
production.
2

Draft Programmatic EA August 2018
5-1
5 LIST OF PREPARERS 1 2 3 Table 5-1 presents information on the preparers of the Draft Programmatic Environmental 4 Assessment of Federally Regulated Offshore Oil and Gas Activities in the Southern California 5 Planning Area. The list of preparers is organized by agency or organization, and information is 6 provided on their contribution to the Environmental Assessment. 7 8 TABLE 5-1 List of Preparers 9
Name Education/Experience Contribution Bureau of Environmental Safety and Enforcement David Fish B.A. International Relations, M.A. Public
Policy; BSEE Senior Advisor and Chief, Environmental Compliance Division; 32 years of experience in safety and environmental preparedness, response, and enforcement including Federal On-Scene Coordinator for the U.S. Coast Guard and BSEE.
BSEE Project Manager; subject matter expert; technical expertise, support, and review.
Glenn Degnitz B.S Environmental Studies, M.S. Environmental Policy and Management; Level II Certified Contract Manager; 20 years of experience in contract support and environmental management and protection.
Project management support; subject matter expert coordination.
Jordan Creed B.S. Marine Biologist, M.S. Marine Science; BSEE Environmental Protection Specialist; 5 years of experience in environmental compliance, preparedness, and response in multiple disciplines.
NEPA subject matter expert; technical expertise, project management support, and review.
Mark Fesmire B.S. Geological Engineering, B.S. Civil Engineering, Juris Doctorate; Regional Director, BSEE Alaska Outer Continental Shelf Region and Acting Regional Director, Pacific Outer Continental Shelf Region; licensed attorney and petroleum engineer; 40 years of experience as a petroleum engineer, Professor of Law, and Natural Resources Regulator at the Bureau Chief, Director, and Commissioner levels.
Subject matter expert, technical expertise, support, and review.
Rance Wall B.S. Civil Engineering, M.E. Petroleum Engineering; Deputy Regional Director for BSEE Pacific Region; 40 years of experience in civil and petroleum engineering positions with the Federal Government and private industry.
Subject matter expert, technical expertise, support, and review.
10

Draft Programmatic EA August 2018
5-2
TABLE 5-1 (Cont.)
Name Education/Experience Contribution James Salmons
B.S. Aeronautics, M.B.A. Human Resources Management and Organizational Development, M.Sc. Environmental Science and Policy, Juris Doctorate Candidate; 9 years of experience in environmental and social impact analyses.
Subject matter expert, technical expertise, support, and review.
Monica Chacon B.A. International Relations; BSEE Program Manager, Environmental Compliance Division; 10 years of environmental experience in addition to 13 years Federal oil and gas management.
Project management support and review.
Bureau of Ocean Energy Management
Richard Yarde B.S. Wildlife Science, M.S. Renewable Natural Resource Studies, J.D.; 20 years of experience in environmental analysis and policy; BOEM Pacific Regional Supervisor, Office of Environment.
BOEM Project Manager; general document and process support.
David Panzer B.S. Oceanography, B.A. Zoology; BOEM Chief, Environmental Analysis Section, Pacific Region; more than 30 years of experience in environmental assessment and EPA.
NEPA; technical expertise, support, and review.
Argonne National Laboratory
Ihor Hlohowskyj Ph.D. Zoology; 39 years of experience in ecological research; 37 years in environmental assessment.
Argonne Project Manager; purpose and need, proposed action and alternatives, review.
Kurt Picel Ph.D. Environmental Health Sciences; 38 years of experience in environmental health analysis; 20 years in environmental assessment.
Assistant Project Manager; proposed action and alternatives; water quality, review.
Young Soo Chang Ph.D. Chemical Engineering; 26 years of experience in air quality and noise impact analysis.
Air quality.
Mark Grippo Ph.D. Biology; 11 years of experience in aquatic resource studies and impact analysis.
Benthic resources; marine and coastal fish; essential fish habitat.
John Hayse Ph.D. Zoology; 29 years of experience in ecological research and environmental assessment.
Recreational and commercial fisheries.

Draft Programmatic EA August 2018
5-3
TABLE 5-1 (Cont.)
Name Education/Experience Contribution Pamela Richmond
M.S. Computer Information Systems; 19 years of experience in Website development and related technology.
Public website.
Carolyn Steele B.S. English, B.S. Rhetoric; 12 years of experience in technical editing.
Lead technical editor.
Katherine Obmascik B.A. Journalism, M.B.A. Marketing Communications; 35 years of experience in technical writing and editing.
Technical editor.
William Vinikour M.S. Biology with environmental emphasis; 40 years of experience in ecological research and environmental assessment
Marine mammals, marine and coastal birds, sea turtles, listed species, socioeconomics, environmental justice, cumulative impacts.
Emily Zvolanek B.A. Environmental Science; 8 years of experience in GIS mapping.
Technical lead for GIS mapping and analysis.
Robert Van Lonkhuyzen B.A. Biology; 28 years of experience in ecological research and environmental assessment.
Socioeconomics, recreation and tourism, areas of concern, environmental justice.
Barbara Simmons B.A. Technical Writing; 45 years of experience in publications management and technical editing.
Technical editor.
1

Draft Programmatic EA August 2018
A-1
APPENDIX A: 1 2
REFERENCES 3 4 5 Allen, M.J., et al., 2011, Southern California Bight 2008 Regional Monitoring Program: Volume 6 IV. Demersal Fishes and Megabenthic Invertebrates, Southern California Coastal Water Research 7 Project, Costa Mesa, CA. 8
Andrew, R.K., B.M. Howe, J.A. Mercer, and M.A. Dzieciuch, 2002, “Ocean Ambient Sound: 9 Comparing the 1960s with the 1990s for a Receiver off the California Coast,” Acoustics Research 10 Letters Online 3(2):65–70. 11
Arata, L., and M. Pritkin, 2009, Pocket Guide to Beach Birds of California, PRBO Conservation 12 Science, Petaluma, CA. Available at http://www.pointblue.org/pocketguides/beach. Accessed 13 Aug. 11, 2015. 14
ARB (Air Resources Board), 2017a, “California Ambient Air Quality Standards (CAAQS),” 15 California Environmental Protection Agency. Available at http://www.arb.ca.gov/research/aaqs/ 16 caaqs/caaqs.htm. Accessed April 5, 2017. 17
ARB, 2017b, “State Standard Area Designations,” California Environmental Protection Agency. 18 Available at http://www.arb.ca.gov/desig/statedesig.htm. Accessed April 5, 2017. 19
ARB, 2017c, “Emission Inventory Data: 2012 Base Year Emissions,” California Environmental 20 Protection Agency. Available at http://www.arb.ca.gov/ei/emissiondata.htm. Accessed 21 May 8, 2017. 22
ARB, 2017d, “California Greenhouse Gas Emission Inventory - 2016 Edition,” California 23 Environmental Protection Agency. Available at http://www.arb.ca.gov/cc/inventory/data/ 24 data.htm. Accessed May 8, 2017. 25
Battelle, 1991, California OCS Phase II Monitoring Program. Final Report, submitted to the 26 U.S. Department of the Interior, Minerals Management Service. 27
Bearzi, M., and C.A. Saylan, 2011, “Cetacean Ecology for Santa Monica Bay and Nearby Areas, 28 California, in the Context of the Newly Established MPAs,” Bulletin of the Southern California 29 Academy of Sciences 110(2):35–51. 30
Bemis, B.E., R.B. Spies, D.D. Hardin, and J.A. Johnson, 2014, Determining the Potential Release 31 of Contaminants into the Marine Environment from Pacific OCS Shell Mounds, OCS Study BOEM 32 2013-208, prepared by Applied Marine Sciences, Inc., for U.S. Department of the Interior, Bureau 33 of Ocean Energy Management, Camarillo, CA. 34
Beranek, L.L., and I.L. Ver, 1992, Noise and Vibration Control Engineering: Principles and 35 Applications, John Wiley & Sons, Inc., NY. 36

Draft Programmatic EA August 2018
A-2
Bergen M., S.B. Weisberg, R.W. Smith, D.B. Cadien, A. Dalkey, D.E. Montagne, J.K. Stull, 1 R.G. Velarde, and J.A. Ranasinghe, 2001, “Relationship between Depth, Sediment, Latitude, and 2 the Structure of Benthic Infaunal Assemblages on the Mainland Shelf of Southern California,” 3 Marine Biology 138:637–647 4
Berman-Kowalewski, M., et al., 2010, “Association Between Blue Whale (Balaenoptera 5 musculus) Mortality and Ship Strikes Along the California Coast,” Aquatic Mammals 6 36(1):59–66. 7
Blake, J.A., and A. Lissner, 1993, “Volume 1. Introduction, Benthic Ecology, Oceanography, 8 Platyhelminthes, and Nemertea,” in Taxonomic Atlas of the Santa Maria Basin and Western Santa 9 Barbara Channel, Oct. Available at https://invertebrates.si.edu/boem/reports/CAMP_Taxa1.pdf. 10 Accessed Aug. 9, 2017. 11
Blanchette, C.A., and S.D. Gaines, 2007, “Distribution, Abundance, Size and Recruitment of the 12 Mussel, Mytilus californianus, across a Major Oceanographic and Biogeographic Boundary at 13 Point Conception, California, USA,” Journal of Experimental Marine Biology and Ecology 14 340:268–279. 15
Blanchette, C.A., P.T. Raimondi, R. Gaddam, J. Burnaford, J. Smith, D.M. Hubbard, J.E. Dugan, 16 J. Altstatt, and J. Bursek, 2015, South Coast Baseline Program Final Report: Rocky Intertidal 17 Ecosystems, Jan. 30. Available at https://caseagrant.ucsd.edu/sites/default/files/SCMPA-22-Final-18 Report_0.pdf. Accessed June 14, 2018. 19
BOEM (Bureau of Ocean Energy Management), 2012, Gulf of Mexico OCS Oil and Gas Lease 20 Sales: 2012–2017; Western Planning Area Lease Sales 229, 233, 238, 246, and 248; Central 21 Planning Area Lease Sales 227, 231, 235, 241, and 247. Final Environmental Impact Statement, 22 OCS EIS/EA BOEM 2012-019, Gulf of Mexico OCS Region, New Orleans, LA, July. 23
BOEM, 2014a, 2011 National Assessment of Oil and Gas Resources: Assessment of the Pacific 24 Outer Continental Shelf Region, OCS Report BOEM 2014-667, K.A. Piper and C.O. Ojukwa 25 (eds.). 26
BOEM, 2014b, Environmental Assessment: Platform Harmony Conductor Installation 27 ExxonMobil Production Company Santa Ynez Unit Offshore Santa Barbara County, California, 28 Pacific OCS Region, Camarillo, CA. 29
BOEM, 2014c, Gulf of Mexico OCS Oil and Gas Lease Sales: 2015–2017 Central Planning Area 30 Lease Sales 235, 241, and 247 Final Supplemental Environmental Impact Statement, OCS EIS/EA 31 BOEM 2014-655, Gulf of Mexico OCS Region, New Orleans, LA, Sept. 32
BOEM, 2016, Gulf of Mexico OCS Oil and Gas Lease Sale: 2017 Central Planning Area Lease 33 SALE 247 Draft Supplemental Environmental Impact Statement, OCS EIS/EA BOEM 2016-006, 34 Gulf of Mexico OCS Region, New Orleans, LA, Feb. 35
BOEM and BSEE, 2017a, Offshore Oil and Gas Development and Production Activities in the 36 Southern California Planning Area: Biological Assessment U.S. Fish and Wildlife Service 37

Draft Programmatic EA August 2018
A-3
Regulated Endangered and Threatened Species, prepared for the U.S. Fish and Wildlife Service, 1 March. 2
BOEM and BSEE, 2017b, Offshore Oil and Gas Development and Production Activities in the 3 Southern California Planning Area: Biological Assessment Endangered and Threatened Species, 4 prepared for the National Marine Fisheries Service, March. 5
BOEMRE (Bureau of Ocean Energy, Management, Regulation, and Enforcement), 2011, 6 Commercial Wind Lease Issuance and Site Characterization Activities on the Atlantic Outer 7 Continental Shelf Offshore New Jersey, Delaware, Maryland, and Virginia, Draft Environmental 8 Assessment, OCS EIS/EA BOEMRE 2011-037, Office of Offshore Alternative Energy Programs, 9 July. Available at https://www.boem.gov/uploadedFiles/BOEM/Renewable_Energy_Program/ 10 Smart_from_the_Start/MidAtlanticWEAs_DraftEA.pdf. Accessed May 12, 2017. 11
BSEE (Bureau of Safety and Environmental Enforcement), 2011, Environmental Assessment 12 Platforms A, B and Hillhouse Pipeline Replacement Project, Pacific OCS Region, Camarillo, CA, 13 Nov. 29. 14
BSEE, 2016, POCSR Production and Development Statistics, Jan. 15
BSEE and BOEM, 2016, Programmatic Environmental Assessment of the Use of Well Stimulation 16 Treatments on the Pacific Outer Continental Shelf, Pacific OCS Regions, Camarillo, CA. 17 Available at pocswellstim.evs.anl.gov. 18
Calambokidis, J., G.H. Steiger, C. Curtice, J. Harrison, M.C. Ferguson, E. Becker, M. DeAngelis, 19 and S.M. Van Parijs, 2015, “Biologically Important Areas for Selected Cetaceans Within 20 U.S. Waters – West Coast Region,” Aquatic Mammals 41(1):39–53. 21
California Herps, 2017, “California Turtles.” Available at http://www.californiaherps.com/turtles/ 22 turtles.html. Accessed May 10, 2017. 23
Campbell, G., L. Roche, K. Whitaker, E. Vu, and J. Hildebrand, 2014, Marine Mammal 24 Monitoring on California Cooperative Oceanic Fisheries Investigation (CALCOFI) Cruises: 25 2012–2013, MPL TM-549, Marine Physical Laboratory of the Scripps Institution of 26 Oceanography, San Diego, CA, Feb. Available at http://cetus.ucsd.edu/Publications/Reports/ 27 CampbellMPLTM549-2014.pdf. Accessed May 26, 2015. 28
Campbell, G.S., L. Thomas, K. Whitaker, A.B. Douglas, J. Calambokidis, and J.A. Hildebrand, 29 2015, “Inter-Annual and Seasonal Trends in Cetacean Distribution, Density and Abundance off 30 Southern California,” Deep-Sea Research II: Topical Studies in Oceanography 112:143–157. 31
Carretta, J.V., et al., 2016a, U.S. Pacific Marine Mammal Stock Assessments: 2015, NOAA-TM-32 NMFS-SWFSC-561, U.S. Department of Commerce, National Oceanic and Atmospheric 33 Administration, National Marine Fisheries Service, Southwest Fisheries Science Center, May. 34 Available at http://www.nmfs.noaa.gov/pr/sars/pdf/pacific2015_final.pdf. Accessed 35 April 15, 2017. 36

Draft Programmatic EA August 2018
A-4
Carretta, J.V., et al., 2016b, U.S. Pacific Draft Marine Mammal Stock Assessments: 2016, NOAA-1 TM-NMFS-SWFSC-XXX, U.S. Department of Commerce, National Oceanic and Atmospheric 2 Administration, National Marine Fisheries Service, Southwest Fisheries Science Center. Available 3 at http://www.nmfs.noaa.gov/pr/sars/pdf/pac2016_draft.pdf. Accessed April 15, 2017. 4
Casper, B.M., T.J. Carlson, M.G. Halvorsen, and A.N. Popper, 2016, “Effects of impulsive pile 5 driving exposures on fishes.” Chapter 15 in A.N. Popper and A. Hawkins (eds.) The Effects of 6 Noise on Aquatic Life II. 7
Cassoff, R.M., K.M. Moore, W.A. McLellan, S.G. Barco, D.S. Rotsteins, and M.J. Moore, 2011, 8 “Lethal Entanglement in Baleen Whales,” Diseases of Aquatic Organisms 96:175–185. 9
CDFW (California Department of Fish and Wildlife), 2004, Annual Status of the Fisheries Report 10 through 2003, prepared for the Fish and Game Commission, Dec. Available at 11 https://nrm.dfg.ca.gov/FileHandler.ashx?DocumentID=34389&inline=true. 12 Accessed May 18, 2017. 13
CDFW, 2014b, “Review of Selected California Fisheries for 2013: Coastal Pelagic Finfish, Market 14 Squid, Groundfish, Highly Migratory Species, Dungeness Crab, Basses, Surfperch, Abalone, Kelp 15 and Edible Algae, and Marine Aquaculture,” Fisheries Review CalCOFI Report 55:11–50. 16 Available at http://calcofi.org/publications/calcofireports/v55/Vol_55_FisheriesReview.pdf. 17 Accessed May 17, 2017. 18
Claisse, J.T., D.J. Pondella II, M. Love, L.A. Zahn, C.M. Williams, J.P. Williams, and A.S. Bull, 19 2014, “Oil Platforms off California Are among the Most Productive Marine Fish Habitats 20 Globally,” Proceedings of the National Academy of Science 111:15462–15467. 21
CMLPAI (California Marine Life Protection Act Initiative), 2009, Regional Profile of the MLPA 22 South Coast Study Region (Point Conception to the California-Mexico Border), California 23 Department of Fish and Wildlife, Monterey, CA, June 25. Available at http://www.dfg.ca.gov/ 24 marine/mps/regionalprofile)sc.asp. Accessed May 26, 2015. 25
Collins, P.W., 2011, Channel Islands Bird Checklist, U.S. Department of the Interior, National 26 Park Service, Channel Islands National Park. Available at http://www.nps.gov/chis/learn/nature/ 27 upload/bird-list-all-final.pdf. Accessed Aug. 11, 2015. 28
CSA (Continental Shelf Associates), 2005, Survey of Invertebrate and Algal Communities on 29 Offshore Oil and Gas Platforms in Southern California, Final Report, OCS Study MMS 2005-30 070, prepared for the U.S. Department of the Interior, Minerals Management Service, Pacific Outer 31 Continental Shelf Region, Camarillo, CA, Dec. 32
CSA Ocean Sciences Inc., 2014, Quieting Technologies for Reducing Noise during Seismic 33 Surveying and Pile Driving Workshop, Summary Report, BOEM 2014-061, prepared for 34 U.S. Department of the Interior, Bureau of Ocean Management, March. 35
Dailey, D., J. Reish, and D.W. Anderson, 1993, Ecology of the Southern California Bight: 36 A Synthesis and Interpretation, University of California Press, Los Angeles, CA. 37

Draft Programmatic EA August 2018
A-5
Debich, A.J., B. Thayre, and J.A. Hildebrand, 2017, Marine Mammal Monitoring on California 1
Cooperative Oceanic Fisheries Investigation (CALCOFI) Cruises: Summary of Results 2012–2
2016, MPL Technical Memorandum 609, Marine Physical Laboratory, Scripps Institution of 3
Oceanography, University of California San Diego, La Jolla, CA, Feb. 4
Diener, and Lissner, 1995, “Hard bottom fauna,” in M. Steinhaoure and E. Imamura (eds), 5
California OCS Phase II Monitoring Program, Year-Three Annual Report, OCS Study MMS 90-6
0055, U.S. Department of the Interior, Minerals Management Service. 7
DieselNet, 2017, “Nonroad diesel engines.” Available at https://www.dieselnet.com/standards/ 8
us/nonroad.php#intro. Accessed Aug. 28, 2017. 9
Douglas, A.B., J. Calambokidis, L.M. Munger, M.S. Soldevilla, M.C. Ferguson, A.M. Havron, 10
D.L. Camacho, G.S. Campbell, and J.A. Hildebrand, 2014, “Seasonal Distribution and Abundance 11
of Cetaceans off Southern California Estimated from CalCOFI Cruise Data from 2004 to 2008,” 12
Fisheries Bulletin 112:197–220. 13
Duncan, A.J., and R.D. McCauley, 2008, “Environmental Impact Assessment of Underwater 14
Sound: Progress and Pitfalls,” in Proceedings of Acoustics 2008, Nov. 24–26, 2008, Geelong, 15
Victoria, Australia. Available at https://www.acpustics.asn.au/conference-proceedings/AAS2008/ 16
papers/pb.pdf. Accessed July 7, 2017. 17
eBird, 2017, “Species Maps.” Available at http://ebird.org/ebird/map. Accessed April 14, 2017. 18
Edmonds N.J., C.J. Firmin, D. Goldsmith, R.C. Faulkner, and D.T. Wood, 2016, “A review of 19
crustacean sensitivity to high amplitude underwater noise: Data needs for effective risk assessment 20
in relation to UK commercial species,” Marine Pollution Bulletin 108:5–11. 21
EIA (U.S. Energy Information Administration), 2017a, “Frequently Asked Questions: How Much 22
Oil is Consumed in the United States,” U.S. Department of Energy, Washington, DC. Available at 23
https://www.eia.gov/tools/faqs/#crudeoil. Accessed April 17, 2017. 24
EIA, 2017b, Natural Gas, “U.S. Natural Gas Total Consumption,” U.S. Department of Energy, 25
Washington, DC. Available at https://www.eia.gov/dnav/ng/hist/n9140us2m.htm. Accessed 26
April 17, 2017. 27
EIA, 2017c, “Petroleum Products Made from a Barrel of Crude Oil, 2016.” Available at 28
https://www.eia.gov/energyexplained/index.cfm?page=oil_home. Updated May 5, 2017. 29
EPA (U.S. Environmental Protection Agency), 2013a, Authorization to Discharge Under the 30
National Pollutant Discharge Elimination System for Oil and Gas Exploration, Development, and 31
Production Facilities, General Permit No. CAG280000, Dec. 20. 32
EPA, 2013b, Final NPDES Permit No. CAG280000 for Offshore Oil and Gas Exploration, 33
Development and Production Operations off Southern California, Addendum to Fact Sheet. 34
EPA, 2014, “Emission Factors for GHG Inventories.” Available at https://www.epa.gov/sites/ 35
production/files/2015-07/documents/emission-factors_2014.pdf. Accessed Aug. 23, 2017. 36

Draft Programmatic EA August 2018
A-6
EPA, 2017a, “NAAQS Table.” Available at https://www.epa.gov/criteria-air-pollutants/naaqs-1
table%20, last updated Dec. 20, 2016. Accessed April 5, 2017. 2
EPA, 2017b, Nonattainment Areas for Criteria Pollutants (Green Book). Available at 3
http://www.epa.gov/green-book. Accessed April 5, 2017. 4
EPA, 2017c, Inventory of U.S. Greenhouse Gas Emissions and Sinks: 1990–2015, EPA 430-P-17-5
001. Available at https://www.epa.gov/ghgemissions/inventory-us-greenhouse-gas-emissions-6
and-sinks-1990-2015. Accessed May 8, 2015. 7
Erbe, C., C. Reichmuth, K. Cunningham, K. Lucke, and R. Dooling, 2016, “Communication 8
Masking in Marine Mammals: A Review and Research Strategy,” Marine Pollution Bulletin 9
103:15–38. 10
Farwell, C., C.M. Reddy, E. Peacock, R.K. Nelson, L. Washburn, and D.L. Valentine, 2009, 11
“Weathering and the Fallout Plume of Heavy Oil from Strong Petroleum Seeps Near Coal Oil 12
Point, CA,” Environ. Sci. Technol. 4:3542–3548. 13
Gales, R.S., 1982, Effects of Noise of Offshore Oil and Gas Operations on Marine Mammals, An 14
Introductory Assessment, Technical Report 844 Volumes I and II, prepared by the Naval Ocean 15
Systems Center, San Diego, CA, for the U.S. Department of the Interior, Bureau of Land 16
Management, Sept. 17
Gillette, D.J., L.L. Lovell and K.C. Schiff, 2017, Southern California Bight 2013 Regional 18
Monitoring Program: Volume VI. Benthic Infauna, Technical Report 971, Southern California 19
Coastal Water Research Project, Costa Mesa, CA. 20
Good, T.P., R.S. Waples, and P. Adams (eds.), 2005, Updated Status of Federally Listed ESUs of 21
West Coast Salmon and Steelhead, Technical Memorandum NMFS-NWFSC-66, U.S. Department 22
of Commerce, National Oceanic and Atmospheric Administration, National Marine Fisheries 23
Service, June. 24
Greene, C.R., Jr., 1995, “Ambient Noise,” Chapter 5 in Marine Mammals and Noise, Richardson 25
et al. (eds.), Academic Press, San Diego, CA. 26
Greene, C.R., Jr., and S.E. Moore, 1995, “Man-Made Noise,” Chapter 6 in Marine Mammals and 27
Noise, Richardson et al. (eds.), Academic Press, San Diego, CA. 28
Halpern, B.S., C.V. Kappel, K.A. Selkoe, F. Micheli, C.M. Ebert, C. Kontgis, C.M. Crain, 29
R.G. Martone, C. Shearer, and S.J. Teck, 2009, “Mapping Cumulative Human Impacts to 30
California Current Marine Ecosystems,” Conservation Letters 2:138–148. 31
Hawkins, A.D., and A.N. Popper, 2017, “A sound approach to assessing the impact of underwater 32
noise on marine fishes and invertebrates,” ICES Journal of Marine Science 74:635–651. 33
Hornafius, J.S., D. Quigley, and B.P. Luyendyk, 1999, “The World’s Most Spectacular Marine 34
Hydrocarbon Seeps (Coal Oil Point, Santa Barbara Channel, California): Quantification of 35
Emissions,” Journal of Geophysical Research 104(C9):20,703–20,711. 36

Draft Programmatic EA August 2018
A-7
Hostettler, F.D., R.J. Rosenbauer, T.D. Lorenson, and J. Dougherty, 2004, “Geochemical 1
Characterization of Tarballs on Beaches along the California Coast. Part I—Shallow Seepage 2
Impacting the Santa Barbara Channel Islands, Santa Cruz, Santa Rosa and San Miguel,” Organic 3
Geochemistry 35:725–746. 4
Houseworth, J., and W. Stringfellow, 2015, “A Case Study of California Offshore Petroleum 5
Production, Well Stimulation, and Associated Environmental Impacts,” Chapter 2 in 6
An Independent Scientific Assessment of Well Stimulation in California, Volume III, California 7
Council on Science and Technology. 8
Howard, M.D.A., et al., 2012, “Water Quality,” in Southern California Bight 2008 Regional 9
Monitoring Program: Volume VII, Technical Report 710, Southern California Coastal Water 10
Research Project, Costa Mesa, CA. 11
Howard M.D.A., et al., 2014, “Anthropogenic Nutrient Sources Rival Natural Sources on Small 12
Scales in the Coastal Waters of the Southern California Bight,” Limnology and Oceanography 59. 13
Howorth, P., 2014, Marine Mammal Mitigation Report, ExxonMobil Well Conductor Installation 14
Project at Platform Harmony, Gaviota, California, prepared by Marine Mammal Consulting 15
Group, Santa Barbara, CA, for ExxonMobil Production Company, Houston, TX, Jan. 16
Hyland, J., E. Baptiste, J. Kennedy, J. Campbell, R. Kropp, C. Robinson, and S. Williams, 1990, 17
Chapter 7, “Macroinfaunal Assemblages in the Santa Maria Basin off the Coast of Southern 18
California,” in California OCS Phase II Monitoring Program, Year-three Annual Report, OCS 19
Study MMS 90-0055, M. Steinhauer and E. Imamura (eds.), U.S. Department of the Interior, 20
Minerals Management Service. 21
Iafrate, J.D., S.L. Watwood, E.A. Reyier, D.M. Scheidt, G.A. Dossot, and S.E. Crocker, 2016, 22
“Effects of Pile Driving on the Residency and Movement of Tagged Reef Fish,” PLoS ONE 23
11(11):e0163638. doi:10.1371/journal.pone.0163638. 24
Jefferson, T.A., et al., 2014a, “Southern California Bight Marine Mammal Density and Abundance 25
from Aerial Surveys, 2008-2013,” Journal of Marine Animals and Their Ecology 7(2):14–30. 26
Jefferson, T.A., et al., 2014b, “Global Distribution of Risso’s Dolphin Grampus griseus: A Review 27
and Critical Evaluation,” Mammal Review 44:56–68. 28
Johnson, J.A., J. Storrer, K. Fahy, and B. Reitherman, 2011, Determining the Potential Effects of 29
Artificial Lighting from Pacific Outer Continental Shelf (POCS) Region Oil and Gas Facilities on 30
Migrating Birds, OCS Study BOEMRE 2011-047, prepared by Applied Marine Sciences, Inc., and 31
Storrer Environmental Services for U.S. Department of the Interior, Bureau of Ocean Energy 32
Management, Regulations and Enforcement, Camarillo, CA, Sept. 33
Kaplan, B., C.J. Beegle-Krause, D. French McCay, A. Copping, and S. Geerlofs (eds.), 2010, 34
Updated Summary of Knowledge: Selected Areas of the Pacific Coast, OCS Study BOEMRE 35
2010-014, U.S. Department of the Interior, Bureau of Ocean Energy Management, Regulation, 36
and Enforcement, Pacific Outer Continental Shelf Region, Camarillo, CA. 37

Draft Programmatic EA August 2018
A-8
Kastelein, R.A., R. Gransier, M.A.T. Marijt, and L. Hoek, 2015, “Hearing Frequency Thresholds 1 of Harbor Porpoises (Phocoena phocoena) Temporarily Affected by Played Back Offshore Pile 2 Driving Sounds,” Journal of the Acoustical Society of America 137(2):556–564. 3
Kim, J., 2014, “Rare Marine Life Visited Southern California in Record Numbers in 2014.” 4 Available at http://www.scpr.org/news/2015/01/05/49034/rare-marine-life-visited-southern-5 california-in-re/. Accessed March 28, 2017. 6
Lehman, P.E., 2014, The Birds of Santa Barbara County, California (Revised), Vertebrate 7 Museum, University of California, Santa Barbara, CA. 8
Lissner A.L., G.L. Taghon, D.R. Diener, and S.C. Schroeter, 1987, Review of Recovery and 9 Recolonization of Hard Substrate Communities of the Outer Continental Shelf, MMS OCS Study 10 88-0034. 11
Love, M.S., and A. York, 2005, “A Comparison of the Fish Assemblages Associated with an 12 Oil/Gas Pipeline and Adjacent Seafloor in the Santa Barbara Channel, Southern California Bight,” 13 Bulletin of Marine Science 77:101–117. 14
Lyon, G.S., and E.D. Stein, 2009, “How effective has the Clean Water Act been at reducing 15 pollutant mass emissions to the Southern California Bight over the past 35 years?” Environmental 16 Monitoring and Assessment 154:413–426. 17
Lyon, G.S., and E.D. Stein, 2010, “Effluent Discharges from Offshore Oil Platforms to the Outer 18 Continental Shelf of Southern California in 2005,” pp. 29–43 in Southern California Coastal 19 Water Research Project 2010 Annual Report, S.B. Weisberg and K. Miller (eds.), Southern 20 California Coastal Water Research Project, Costa Mesa, CA. Available at 21 http://ftp.sccwrp.org/pub/download/DOCUMENTS/AnnualReports/2010AnnualReport/ar10_02922 _043.pdf. Accessed June 24, 2015. 23
MacGillivray, A., and A. Schlesinger, 2015, Harmony Platform 2014 Conductor Driving Acoustic 24 Monitoring: Final Report, JASCO Document 00964, Version 3.0, prepared by JASCO Applied 25 Sciences Ltd. for ExxonMobil Production Company. 26
Marantz, C., 1986, The Birds of San Luis Obispo, California: Their Status and Distribution, 27 California Polytechnic State University, School of Science and Mathematics, Biological Sciences 28 Department, San Luis Obispo, CA. 29
Mason, J.W., et al., 2007, “At-Sea Distribution and Abundance of Seabirds off Southern 30 California: A 20-Year Comparison,” Studies in Avian Biology, No. 33. 31
Maxon Consulting, Inc., 2015, Harmony Platform Acoustic Monitoring: Installation of Conductor 32 No. 2., prepared by Maxon Consulting, Inc., for ExxonMobil Production Company 33 San Diego, CA. 34

Draft Programmatic EA August 2018
A-9
McDonald, M.A., J.A. Hildebrand, and S.M. Wiggins, 2006, “Increases in Deep Ocean Ambient 1 Noise in the Northeast Pacific West of San Nicolas Island, California,” Journal of the Acoustical 2 Society of America 120(2):711–718. 3
McDonald, M.A., J.A. Hildebrand, S.M. Wiggins, and D. Ross, 2008, “A 50-Year Comparison of 4 Ambient Ocean Noise near San Clemente Island: A Bathymetrically Complex Coastal Region off 5 Southern California,” Journal of the Acoustical Society of America 124(4):1985–1992. 6
Miller, E.F., and K. Schiff, 2012, “Descriptive Trends in Southern California Bight Demersal Fish 7 Assemblages, 1994–2008,” CalCOFI Rep., Vol. 53. 8
MMS (Minerals Management Service), 2001, Delineation Drilling Activities in Federal Waters 9 Offshore Santa Barbara County, California Draft Environmental Impact Statement, MMS 2001-10 046, U.S. Department of the Interior, Mineral Management Service, Pacific Outer Continental 11 Shelf Region. 12
MMS, 2005, Environmental Information Document for Post-Suspension Activities on the Nine 13 Federal Undeveloped Units and Lease OCS-P 0409: Offshore Santa Barbara, Ventura, and San 14 Luis Obispo Counties, prepared by the Aspen Environmental Group, Jan. 15
MMS, 2009, Environmental Assessment, ExxonMobil Production Company’s Santa Ynez Unit C1 16 Cable Repair, Pacific OCS Region. Available at www.boem.gov/Environmental-Assessments-17 Pacific-Region. 18
Muto, M.M., et al., 2016a, Alaska Marine Mammal Stock Assessments, 2015, NOAA Technical 19 Memorandum NMFS-AFSC-323, U.S. Department of Commerce, National Oceanic and 20 Atmospheric Administration, National Marine Fisheries Service, Alaska Fisheries Science Center, 21 June. Available at http://www.nmfs.noaa.gov/pr/sars/pdf/alaska2015_final_corrected_.pdf. 22 Accessed April 15, 2017. 23
Muto, M.M., et al., 2016b, Alaska Marine Mammal Stock Assessments: 2016, Alaska Fisheries 24 Science Center, Seattle, Marine Mammal Laboratory, WA. Available at http://www.nmfs.noaa. 25 gov/pr/sars/pdf/ak2016_draft.pdf. Accessed April 15, 2017. 26
NCE (Noise Control Engineering), 2007, Review of Existing and Future Potential Treatments for 27 Reducing Underwater Sound from Oil and Gas Industry Activities, NCE Report 07-001, prepared 28 by Noise Control Engineering, Inc., Dec. 31. 29
Neuman, M., B. Tissot, and G. Vanblaricom, 2010, “Overall Status and Threats Assessment of 30 Black Abalone (Haliotis Cracherodii Leach, 1814) Populations in California,” Journal of Shellfish 31 Research 29:577–586. 32
NMFS (National Marine Fisheries Service), 2008a, Final White Abalone Recovery Plan (Haliotis 33 sorenseni), prepared by White Abalone Recovery Team for National Oceanic and Atmospheric 34 Administration, National Marine Fisheries Service, Office of Protected Resources. Available at 35 http://www.nmfs.noaa.gov/pr/pdfs/recovery/whiteabalone.pdf. Accessed May 17, 2015. 36

Draft Programmatic EA August 2018
A-10
NMFS, 2008b, “Endangered and Threatened Species; Endangered Status for North Pacific and 1 North Atlantic Right Whales,” Federal Register 73(45):12024–12030. 2
NMFS, 2012, “Endangered and Threatened Species: Final Rule to Revise the Critical Habitat 3 Designation for the Endangered Leatherback Sea Turtle,” Federal Register 77(17):4170–4201. 4
NMFS, 2014a, Issuance of an Incidental Harassment Authorization to ExxonMobil Production 5 Company to Take Marine Mammals by Harassment Incidental to Conductor Pipe Installation 6 Activities at Harmony Platform in the Santa Barbara Channel Offshore of California, Office of 7 Protected Resources, Permits and Conservation Division, Silver Springs, MD. 8
NMFS, 2014b, “Threats to Sea Turtles.” Updated June 16. Available at 9 http://www.nmfs.noaa.gov/pr/species/turtles/threats.html. Accessed March 24, 2017. 10
NMFS, 2014c, “Hawksbill Turtle (Eretmochelys imbricata). Updated Oct. 30. Available at 11 http://www.fisheries.noaa.gov/pr/species/turtles/hawksbill.html. Accessed March 24, 2017. 12
NMFS, 2014d, “Olive Ridley Turtle (Lepidochelys olivacea).” Updated Oct. 30. Available at 13 http://www.fisheries.noaa.gov/pr/species/turtles/oliveridley.htm. Accessed May 11, 2015. 14
NMFS, 2015a, “Northern Fur Seal (Callorhinus ursinus).” Updated Jan. 2. Available 15 at http://www.fisheries.noaa.gov/pr/species/mammals/seals/northern-fur-seal.html. Accessed 16 May 11, 2015. 17
NMFS, 2015b, “Fin Whale (Balaenoptera physalus).” Updated Jan. 15. Available at 18 http://www.fisheries.noaa.gov/pr/species/mammals/whales/fin-whale.html. 19 Accessed May 26, 2015. 20
NMFS, 2015c, “Gray Whale (Eschrichtius robustus).” Updated Jan. 15. Available at 21 http://www.fisheries.noaa.gov/pr/species/mammals/whales/gray-whale.html. 22 Accessed May 26, 2015. 23
NMFS, 2015d, “Minke Whale (Balaenoptera acutorostrata).” Updated Jan. 15. Available at 24 http://www.fisheries.noaa.gov/pr/species/whales/minke-whale.html. Accessed May 11, 2015. 25
NMFS, 2015e, “North Pacific Right Whale (Eubalaena japonica).” Updated Jan. 15. Available at 26 http://www.fisheries.noaa.gov/pr/species/mammals/whales/north-pacific-right-whale.html. 27 Accessed May 26, 2015. 28
NMFS, 2015f, “Sei Whale (Balaenoptera borealis).” Updated Jan. 15. Available at 29 http://www.fisheries.noaa.gov/pr/species/mammals/whales/sei-whale.html. 30 Accessed May 11, 2015. 31
NMFS, 2015g, “Cuvier’s Beaked Whale (Ziphius cavirostris).” Updated Jan. 15. Available at 32 http://www.fisheries.noaa.gov/pr/species/mammals/whales/cuvier’s-beaked-whale.html. 33 Accessed March 24, 2017. 34

Draft Programmatic EA August 2018
A-11
NMFS, 2015h, “Dall’s Porpoise (Phocoenoides dalli).” Updated Jan. 15. Available at 1
http://www.fisheries.noaa.gov/pr/species/mammals/porpoises/dalls-porpoise.html. Accessed 2
March 24, 2017. 3
NMFS, 2015i, “Dwarf Sperm Whale (Kogia sima).” Updated Dec. 15. Available at 4
http://www.fisheries.noaa.gov/pr/species/mammals/whales/dwarf-sperm-whale.html. Accessed 5
March 24, 2017. 6
NMFS, 2015j, “Long-Beaked Common Dolphin (Delphinus capensis).” Updated Jan. 15. 7
Available at http://www.fisheries.noaa.gov/pr/species/mammals/dolphins/common-dolphin_ 8
long-beaked.html. Accessed May 11, 2015. 9
NMFS, 2015k, “Blainville’s Beaked Whale (Mesoplodon densirostris).” Updated Jan. 15. 10
Available at http://www.fisheries.noaa.gov/pr/species/mammals/whales/blainvilles-beaked-11
whale.html. Accessed May 1, 2017. 12
NMFS, 2015l, “Stejneger’s Beaked Whale (Mesoplodon stejnegeri).” Updated Jan. 15. Available 13
at http://www.fisheries.noaa.gov/pr/species/mammals/whales/beaked-whale-stejnegers.html. 14
Accessed March 24, 2017. 15
NMFS, 2015m, “Northern Right Whale Dolphin (Lissodelphis borealis).” Updated Jan. 15. 16
Available at http://www.fisheries.noaa.gov/pr/species/mammals/dolphins/northern-right-whale-17
dolphin.html. Accessed May 11, 2015. 18
NMFS, 2015n, “Pygmy Sperm Whale (Kogia breviceps).” Updated Dec. 15. Available at 19
http://www.fisheries.noaa.gov/pr/species/mammals/whales/pygmy-sperm-whale.html. Accessed 20
March 24, 2017. 21
NMFS, 2015o, “Short-finned Pilot Whale (Globicephala macrorhynchus).” Updated Jan. 15. 22
Available at http://www.fisheries.noaa.gov/pr/species/mammals/whales/short-finned-pilot-23
whale.html. Accessed May 11, 2015. 24
NMFS, 2015p, “Striped Dolphin (Stenella coeruleoalba).” Updated Jan. 15. Available 25
at http://www.fisheries.noaa.gov/pr/species/mammals/dolphins/striped-dolphin.html. Accessed 26
May 11, 2015. 27
NMFS, 2015q, “California Sea Lion (Zalophus californianus).” Updated Jan. 15. Available at 28
http://www.fisheries.noaa.gov/pr/species/mammals/sealions/california-sea-lion.html. Accessed 29
May 27, 2015. 30
NMFS, 2015r, “Guadalupe Fur Seal (Arctocephalus townsendi).” Updated Jan. 15. Available 31
at http://www.fisheries.noaa.gov/pr/species/mammals/seals/guadalupe-fur-seal.html. Accessed 32
May 11, 2015. 33
NMFS, 2015s, “Bottlenose Dolphin (Tursiops truncatus).” Updated Jan. 16. Available at 34
http://www.fisheries.noaa.gov/pr/species/mammals/dolphins/bottlenose-dolphin.html. Accessed 35
May 26, 2015. 36

Draft Programmatic EA August 2018
A-12
NMFS, 2015t, “Pacific White-Sided Dolphin (Lagenorhynchus obliquidens).” Updated Jan. 16. 1 Available at http://www.fisheries.noaa.gov/pr/species/mammals/dolphins/pacific-white-sided-2 dolphin.html. Accessed May 11, 2015. 3
NMFS, 2015u, “Northern Elephant Seal (Mirounga angustirostris).” Updated Jan. 16. Available 4 at http://www.fisheries.noaa.gov/pr/species/mammals/seals/northern-elephant-seal.html. 5 Accessed May 27, 2015. 6
NMFS, 2015v, “Risso’s Dolphin (Grampus griseus).” Updated Jan. 21. Available 7 at http://www.fisheries.noaa.gov/pr/species/mammals/dolphins/rissos-dolphin.html. Accessed 8 May 11, 2015. 9
NMFS, 2015w, “Short-Beaked Common Dolphin (Delphinus delphis).” Updated Jan. 21. 10 Available at http://www.fisheries.noaa.gov/pr/species/mammals/dolphins/short-beaked-common-11 dolphin.html. Accessed May 11, 2015. 12
NMFS, 2015x, “Harbor Porpoise (Phocoena phocoena).” Updated March 24. Available 13 at http://www.fisheries.noaa.gov/pr/species/mammals/porpoises/harbor-porpoise.html.htm. 14 Accessed May 11, 2015. 15
NMFS, 2015y, “Baird’s Beaked Whale (Berardius bairdii).” Updated Sept. 28. Available at 16 http://www.fisheries.noaa.gov/pr/species/mammals/whales/bairds-beaked-whale.htm. Accessed 17 March 24, 2017. 18
NMFS 2015z, “Our Living Oceans: Habitat. Status of the Habitat of U.S. Living Marine 19 Resources,” NOAA Technical Memo NMFS-F/SPO-75, U.S. Department of Commerce. 20
NMFS, 2016a, “Blue Whale (Balaenoptera musculus).” Updated Feb. 10. Available at 21 http://www.fisheries.noaa.gov/pr/species/mammals/whales/blue-whale.html. 22 Accessed March 24, 2017. 23
NMFS, 2016b, “Leatherback Turtle (Dermochelys coriacea).” Updated Feb. 10. Available at 24 http://www.fisheries.noaa.gov/pr/species/turtles/leatherback.html. Accessed March 24, 2017. 25
NMFS, 2016c, “2015-2017 Guadalupe Fur Seal Unusual Mortality Event in California.” Updated 26 Feb. 23. Available at http://www.fisheries.noaa.gov/pr/health/immune/guadalupefurseals 27 2015.html. Accessed March 24, 2017. 28
NMFS, 2016d, “Steller Sea Lion (Eumetopias jubatus).” Updated June 17. Available 29 at http://www.fisheries.noaa.gov/pr/species/mammals/sealions/steeer-sea-lion.html. Accessed 30 March 30, 2017. 31
NMFS, 2016e, “Harbor Seal (Phoca vitulina).” Updated Nov. 16. Available at 32 http://www.fisheries.noaa.gov/pr/species/mammals/seals/harbor-seal.html. 33 Accessed March 24, 2017. 34

Draft Programmatic EA August 2018
A-13
NMFS, 2016f, Technical Guidance for Assessing the Effects of Anthropogenic Sound on Marine 1 Mammal Hearing: Underwater Acoustic Thresholds for Onset of Permanent and Temporary 2 Threshold Shifts, Technical Memorandum NMFS-OPR-55, July. 3
NMFS, 2017a, “Killer Whale (Orcinus orca).” Updated Jan. Available at http://www.fisheries. 4 noaa.gov/pr/species/mammals/whales/killer-whale.html. Accessed March 24, 2017. 5
NMFS, 2017b, “Humpback Whale (Megaptera novaeangliae).” Updated Jan. 10. Available 6 at http://www.fisheries.noaa.gov/pr/species/mammals/whales/humpback-whale.html. Accessed 7 March 24, 2017. 8
NMFS, 2017c, “Sperm Whale (Physeter macrocephalus).” Updated Jan. 10. Available 9 at http://www.fisheries.noaa.gov/pr/species/mammals/whales/sperm-whale.html. Accessed 10 March 24, 2017. 11
NMFS, 2017d, “Bryde’s Whale (Balaenoptera edeni).” Updated Feb. 8. Available at 12 http://www.fisheries.noaa.gov/pr/species/mammals/whales/brydes-whale.html. 13 Accessed May 1, 2017. 14
NMFS, 2017e, “Interim Sound Threshold Guidance,” West Coast Region. Available 15 at http://www.westcoast.fisheries.noaa.gov/protected_species/marine_mammals/threshold_ 16 guidance.html. Accessed July 7, 2017. 17
NMFS and USFWS (U.S. Fish and Wildlife Service), 2011, “Endangered and Threatened Species; 18 Determination of Nine Distinct Population Segments of Loggerhead Sea Turtles as Endangered or 19 Threatened,” Federal Register 76(184):58868–58952. 20
NMFS and USFWS, 2014, Olive Ridley Sea Turtle (Lepidochelys olivacea) 5-Year Review: 21 Summary and Evaluation, National Marine Fisheries Service, Office of Protected Resources, 22 Silver Springs, MD, and U.S. Fish and Wildlife Service, Southeast Region, Jacksonville 23 Ecological Services Field Office, Jacksonville, FL, June. 24
NMSP (National Marine Sanctuary Program), 2008, Channel Islands National Marine Sanctuary 25 Final Management Plan/Final Environmental Impact Statement, Silver Springs, MD, Nov. 26
NOAA (National Oceanic and Atmospheric Administration), Marine Mammal Stock Assessment 27 Reports (SARs) by Species/Stock. Available at www.nmfs.noaa.gov/pr/sars/species.htm. 28
Noble, R.T., S.B. Weisberg, M.K. Leecaster, C.D. McGee, J.H. Dorsey, P. Vainik, and B. Orozco-29 Borbon, 2003, “Storm Effects on Regional Beach Water Quality along the Southern California 30 Shoreline,” Journal of Water and Health 1:23–31. 31
Normandeau Associates, Inc., 2012, Effects of Noise on Fish, Fisheries, and Invertebrates in the 32 U.S. Atlantic and Arctic from Energy Industry Sound-Generating Activities, prepared for the 33 U.S. Department of the Interior, Bureau of Ocean Energy Management. 34

Draft Programmatic EA August 2018
A-14
Northridge, S.P., and R.J. Hoffman, 1999, “Marine Mammal Interaction with Fisheries,” pp. 99–1 119 in J.R. Twiss and R.R. Reeves (eds.), Conservation and Management of Marine Mammals, 2 Smithsonian Institution, Washington. 3
NPS (National Park Service), 2017, “Channel Islands National Park, California: Seabirds & 4 Shorebirds.” Available at http://www.nps.gov/chis/learn/nature/seabirds.htm. Accessed 5 April 10, 2017. 6
NPS, 2018, “Guadalupe Fur Seal.” Available at https://www.nps.gov/chis/learn/nature/guadalupe-7 fur-seal.htm. Accessed March 19, 2018. 8
NRC (National Research Council), 1990, Decline of Sea Turtles: Causes and Prevention, National 9 Academy Press, Washington, DC. 10
PEPC (Plains Exploration and Production Company), 2012a, Revisions to the Platform Hidalgo 11 Development and Production Plan to Include Development of the Western Half NW/4 of 12 OCS-P 0450, Accompanying Information Volume Environmental Evaluation, submitted to Bureau 13 of Ocean Energy Management, Pacific Outer Continental Shelf Region, Oct. 14
PEPC 2012b, Revisions to the Platform Hidalgo Development and Production Plan to Include 15 Development of the Western Half NW/4 of OCS-P 0450, Accompanying Information Volume 16 Biological Evaluation of Threatened and Endangered Species, submitted to Bureau of Ocean 17 Energy Management, Pacific Outer Continental Shelf Region, Oct. 18
PFMC (Pacific Fishery Management Council), 2016a, Pacific Coast Groundfish Fishery 19 Management Plan for the California, Oregon, and Washington Groundfish Fishery. 20
PFMC, 2016b, Fishery Management Plan for U.S. West Coast Fisheries for Highly Migratory 21 Species as Amended through Amendment 3. 22
PFMC, 2016c, Pacific Coast Salmon Fishery Management Plan for Commercial and Recreational 23 Salmon Fisheries off the Coasts of Washington, Oregon, and California as Revised through 24 Amendment 19. 25
Pondella, D., J. Williams, J. Claisse, R. Schaffner, K. Ritter, and K. Schiff, 2012, “Rocky Reefs,” 26 Volume V in Southern California Bight 2008 Regional Monitoring Program. Southern California 27 Coastal Water Research Project, Costa Mesa, CA. 28
Popper, A.N., A.D. Hawkins, R.R. Fay, D.A. Mann, S. Bartol, T.J. Carlson, S. Coombs, W.T. 29 Ellison, R.L. Gentry, M.B. Halvorsen, S. Løkkeborg, P.H. Rogers, B.L. Southall, D.G. Zeddies, 30 and W.N. Tavolga, 2014, Sound Exposure Guidelines for Fishes and Sea Turtles, ASA S3/SC1.4 31 TR-2014, prepared by ANSI-Accredited Standards Committee S3/SC1. Available at 32 https://www.researchgate.net/profile/Arthur_Popper/publication/279347068_Sound_Exposure_G33 uidelines/links/5596735d08ae99aa62c777b9/Sound-Exposure-Guidelines.pdf. 34 Accessed June 14, 2018. 35

Draft Programmatic EA August 2018
A-15
PXP (Plains Exploration and Production Company), 2012, Revisions to the Platform Hidalgo 1
Development and Production Plan to Include Development of the Western Half NW/4 of 2
OCS-P 0450, Accompanying Information Volume Environmental Evaluation, submitted to Bureau 3
of Ocean Energy Management, Pacific Outer Continental Shelf Region, Oct. 4
Ranasinghe, J.A., K.C. Schiff, C.A. Brantley, L.L. Lovell, D.B. Cadien, T.K. Mikel, R.G. Velarde, 5
S. Holt, and S.C. Johnson, 2012, Southern California Bight 2008 Regional Monitoring Program: 6
VI. Benthic Macrofauna, Technical Report 665, Southern California Coastal Water Research 7
Project, Costa Mesa, CA. 8
Reilly, S.B., et al., 2008, “Eubalaena japonica,” in The IUCN Red List of Threatened Species 2008. 9
Available at http://www.iucnredlist.org/details/41711/0. Accessed Sept. 27, 2015. 10
Richardson, W.J., C.R. Greene, Jr., C.I. Malme, and D.H. Thomson, 1995, Marine Mammals and 11
Noise, Academic Press, San Diego, CA. 12
Riedman, M.L., and J.A. Estes, 1990, The Sea Otter (Enhydra lutris): Behavior, Ecology, and 13
Natural History, U.S. Department of the Interior, U.S. Fish and Wildlife Service, Washington, DC, 14
Sept. Available at https://www.fort.usgs.gov/sites/default/files/products/publications/2183/ 15
2183.pdf. Accessed May 11, 2017. 16
Rodriguez, D.A., A. Chapman, and R. Cartwright, 2011, Shorebird Abundance and Distribution 17
on Beaches of Ventura County, California 2007–2010, BOEMRE OCS Study 2010-24, California 18
State University Channel Islands, Camarillo, CA, Dec. 19
Sahagun, L., 2008, “Turtles at New Frontier,” Los Angeles Times, Aug. 30. Available at 20
http://articles.latimes.com/2008/aug/30/local/me-turtles30. Accessed April 27, 2017. 21
SAIC (Science Applications International Corporation), 1986, Assessment of Long-Term Changes 22
in Biological Communities in the Santa Maria Basin and Western Santa Barbara Channel: Phase 23
I, Vol. II, prepared for Minerals Management Service, Pacific OCS Region. 24
SAIC, 2011, Final Environmental Impact Report for the Ellwood Pipeline Company Line 96 25
Modification Project, Santa Barbara County EIR No. 09EIR-00000-00005, prepared by Marine 26
Research Specialist, Science Applications International Corporation, for County of Santa Barbara, 27
July. 28
Salmons, J., 2017, personal communication, “Information on Approved APDs and APMS,” from 29
Salmons (Environmental Compliance Officer, Office of Field Operations, BSEE Pacific Region, 30
Camarillo, CA) to I. Hlohowskyj (Environmental Science Division, Argonne National Laboratory, 31
Argonne, IL), Oct. 16. 32
Schiff, K., D. Greenstein, N. Dodder, and D.J. Gillett, 2016, “Southern California Bight Regional 33
Monitoring,” Regional Studies in Marine Science 4:34–46 34

Draft Programmatic EA August 2018
A-16
Seal Conservation Society, 2011, “Guadalupe Fur Seal (Arctocephalus townsendi).” Available at 1
http://www.pinnipeds.org/seal-information/species-information-pages/sea-lions-and-fur-2
seals/guadalupe-fur-seal. Accessed May 5, 2017. 3
Seapy, R.R., and M.M. Littler, 1978, “Biogeography of Rocky Intertidal Macroinvertebrates of 4
the Southern California Islands,” pp. 307–323 in Proceedings of 2nd California Islands 5
Multidisciplinary Symposium. 6
Širović, A., et al., 2015, “Seven Years of Blue and Fin Whale Call Abundance in the Southern 7
California Bight,” Endangered Species Research 28:61–76. 8
Smith, G., C. Stamm, and F. Petrovic, 2003, Haliotis cracherodii. The IUCN Red List of 9
Threatened Species. Available at http://www.iucnredlist.org/details/41880/0. Accessed June 14, 10
2018.Smultea, M.A., and T.A. Jefferson, 2014, “Changes in Relative Occurrence of Cetaceans in 11
the Southern California Bight: A Comparison of Recent Aerial Survey Results with Historical Data 12
Sources,” Aquatic Mammals 40(1):32–43. 13
Sydeman, W.J., et al., 2012, Hotspots of Seabird Abundance in the California Current: 14
Implications for Important Bird Areas, March 23. Available at http://www.audubon.org/sites/ 15
default/files/documents/report_audubon_ibas_011813.pdf. Accessed August 13, 2015. 16
Tinker, M.T., and B.B. Hatfield, 2016, California Sea Otter (Enhydra lutris nereis) Census 17
Results, Spring 2016, Data Series 1018, U.S. Geological Survey, Reston, VA. Available at 18
https://pubs.usgs.gov/ds/1018/ds1018.pdf. Accessed May 11, 2017. 19
Tinker, M.T., et al., 2017, Southern Sea Otter Range Expansion and Habitat Use in the Santa 20
Barbara Channel, California, Open-File Report 2017-1001. U.S. Geological Survey, Reston, VA. 21
URI (University of Rhode Island), 2017, Discovery of Sound in the Sea. Available at 22
http://www.dosits.org. Accessed March 17, 2017. 23
USFWS (U.S. Fish and Wildlife Service), 1970, “Title 50—Wildlife and Fisheries, Chapter I—24
Bureau of Sport Fisheries and Wildlife, Fish and Wildlife Service, Department of the Interior, 25
Subchapter B—Hunting and Possession of Wildlife, Part 17—Conservation of Endangered 26
Species and Other Fish or Wildlife, Appendix D—United States List of Endangered Native Fish 27
and Wildlife,” Federal Register 35(199):16047–16048. 28
USFWS, 2006, Five-Year Review of the California Least Tern (Sternula antillarum browni), 29
Carlsbad, CA. 30
USFWS, 2012, “Endangered and Threatened Wildlife and Plants; Revised Designation of Critical 31
Habitat for the Pacific Coast Population of the Western Snowy Plover,” Federal Register 32
77(118):36728–36869. 33
USFWS, 2016, “Endangered and Threatened Wildlife and Plants; Determination of Critical 34
Habitat for the Marbled Murrelet,” Federal Register 81(150):51348–51370. 35

Draft Programmatic EA August 2018
A-17
USFWS, 2017, “Southern Sea Otter,” Ventura Fish and Wildlife Office. Available at 1
https://www,fws.gov/ventura/endangered/species/info/sso.html. Accessed May 11, 2017. 2
USFWS and NMFS, 1994, “Endangered and Threatened Wildlife and Plants; Final Rule to 3
Remove the Eastern North Pacific Population of the Gray Whale from the List of Endangered 4
Wildlife,” Federal Register 59(115):31094–31095. 5
Vanderlaan, A.S.M., and C.T. Taggert, 2007, “Vessel Collisions with Whales: The Probability of 6
Lethal Injury Based on Vessel Speed,” Marine Mammal Science 23(1):144–156. 7
Whale Alert—West Coast, 2017, “Channel Islands Region.” Available at 8
http://westcoast.whalealert.org. Accessed May 11, 2017. 9
Zembal, R., B.W. Massey, and J.M. Fancher, 1989, “Movements and Activity Patterns of the 10
Light-Footed Clapper Rail,” Journal of Wildlife Management 53:39–42. 11
Zembal, R., S.M. Hoffman, and J.R. Bradley, 1998, Light-Footed Clapper Rail Management and 12
Population Assessment, 1997, Report 98-01, California Department of Fish and Game, Bird and 13
Mammal Conservation Program. 14
Zembal, R., and S.M. Hoffman, 1999, Light-Footed Clapper Rail Management and Study, 1999, 15
U.S. Fish and Wildlife Service and California Department of Fish and Game. 16
Zembal, R., et al., 2016, Status and Distribution of the Light-footed Ridgway’s (Clapper) Rail in 17
California – 2016 Season, Nongame Wildlife Program 2016-04, Final Report to State of 18
California, Department of Fish and Wildlife, South Coast Region, San Diego, CA, Sept. 15. 19

Draft Programmatic EA August 2018
B-1
APPENDIX B: 1
2
ACTIVITIES UNDER THE PROPOSED ACTION THAT REQUIRE AN 3
APPLICATION FOR PERMIT TO DRILL (APD) OR AN 4
APPLICATION FOR PERMIT TO MODIFY (APM) 5
6
7
B.1 CONDUCTOR INSTALLATION 8
9
Installation of a conductor is the first step of drilling a new well on the Pacific Outer Continental 10
Shelf (POCS). A conductor provides protection, stability, and structural support to the wellbore, 11
prevents caving of the wellbore, and provides a conduit for the return of drill muds and cuttings to 12
the platform for processing. A conductor typically consists of multiple sections of large-diameter 13
steel pipe (e.g., 26–32 in. [66–81 cm] in diameter) welded together end to end to a desired length. 14
On the POCS, all installed conductors extend from the platform to below the seafloor (Figure B-1), 15
and some total as much as 1,600 ft. (500 m) in length. 16
17
18
19
FIGURE B-1 Schematic of General Platform Configuration Showing Platform Area at Sea Level 20 and Water Depth (left), and Photograph Showing Exposed Conductor Pipes and Harmony Platform 21 Infrastructure at Sea Level (right) (NMFS 2014) 22 23
24
Two methods of conductor installation have been employed on the POCS: installation by 25
impulsive hammering, which uses a deck-mounted hydraulic hammer to drive the conductor to its 26
desired depth, and installation by drilling, which uses a jet bit to bore into the seafloor sediment, 27
followed by a conventional bit to drill into the underlying rock. The method used depends on the 28
geologic conditions at the location of the planned conductor installation. The most recent 29
conductor installation on the POCS was at Platform Harmony. Because of the geologic conditions 30
at that location, pipe driving with a hydraulic hammer, also referred to as “pile driving,” was 31

Draft Programmatic EA August 2018
B-2
determined to be the only proven conductor installation method that would enable management of 1
potential interferences with the existing platform infrastructure and that would allow the conductor 2
to reach the desired target depth. 3
4
In a typical conductor installation by impulsive hammering, installers weld pipe sections together 5
on the platform and lower the lengthening conductor into the water column through a metal 6
conductor guide attached to the jacket structure of the platform. The guide orients the conductor 7
and directs it to a desired location on the seafloor, where the weight of the conductor pipe passively 8
drives the initial seafloor penetration of the conductor. After this, a deck-mounted hydraulic 9
hammer is used to drive the conductor to its target depth below the seabed. 10
11
Hydraulic hammering may last several hours for each added section, depending primarily on 12
sediment physical properties, which affect penetration rate. Several cycles of welding (each lasting 13
several hours) and hydraulic hammering are needed for the conductor to reach its target sub-14
seafloor depth. Thus, active hammering occurs only intermittently and may account for 35 to 40% 15
of the total installation time for a single conductor. Altogether, it may take several days to complete 16
installation. To reduce overall installation costs, operators typically install several conductors 17
sequentially at a given platform. Impulsive conductor installation generally requires little or no 18
increase in platform crew over routine operations, and no noticeable change in routine supply boat 19
or helicopter traffic. However, some additional vessel traffic associated with delivery of conductor 20
pipe sections may be expected. 21
22
Where sediment and sub-seafloor conditions are suitable, jet drilling may be used for conductor 23
installation. In such installations, the weight of the conductor is again used to initially embed the 24
conductor into the seafloor sediments. Next, a jet bit inserted to the bottom of the conductor uses 25
high-pressure seawater to further bore deeper into the seafloor with the conductor following. The 26
solids (cuttings) produced by the jet bit are carried up the inside of the conductor by the high-27
pressure seawater to the platform, where they are collected for processing and disposal. Upon 28
hitting solid rock, a drill bit replaces the jet bit and boring continues to the target depth, again using 29
high-pressure seawater to flush out drilling solids while the conductor pipe follows the drill bit. 30
The installation is completed by cementing the conductor into place. Cement is forced down the 31
conductor, out of the bottom of the pipe, and up the outside of the pipe into the annulus between 32
the conductor pipe and the rock surface of the borehole. The cemented conductor provides a sealed 33
drilling path from the platform deck into the target rock formation. 34
35
Conductors may be installed to support immediate drilling of a new wellbore or in anticipation of 36
future drilling at a platform. Only 363 (33%) of the 1,111 total slots on the active POCS production 37
platforms are available for new well drilling, and 305 of these would require conductor installation 38
before drilling could begin (Table B-1). The number of slots for conductor installation varies 39
among the platforms. For example, of the 10 slots available for new well drilling at Platform 40
Eureka, all have previously installed conductors. In contrast, Platform Irene has 40 slots available 41
and no conductors (Table B-1). 42

Draft Programmatic EA August 2018
B-3
TABLE B-1 Open Slots, by Platform, Available for New Conductor Installation and Well Drilling 1 (Platforms Grace and Gail have entered the decommissioning process and therefore are not 2 included.) 3
Platform Groupings and Platforms
Slots Currently Available for Conductor Installation or Drilling (available/total)
Number of Available Slots
With Conductorsa Without Conductorsb
Santa Maria Basin Platformsc
140/226 (69% availability)
22
118
Harvest 29/50 (58%) 6 23 Hermosa 32/48 (67%) 16 16 Irene 40/72 (55%) 0 40 Hidalgo 39/56 (69%) 0 39
Santa Barbara Channel—West Platformsd 7/148 (5%) 5 2
Heritage 0/60 (0%) 0 0 Hondo 0/28 (0%) 0 0 Harmony 7/60 (12%) 5 2
Santa Barbara Channel— East Platformse 142/525 (27%) 11 131
Gina 3/15 0 3 Gilda 34/96 0 34 Habitat 3/24 1 2 Henry 0/24 0 0 Hillhouse 10/60 0 10 Hogan 26/66 0 26 Houchin 24/60 0 24 A 7/57 5 2 B 10/63 3 7 C 25/60 2 23
San Pedro Bay Platformsf 77/212 (36%) 20 57
Edith 50/72 9 41 Ellen 17/80 1 16 Eureka 10/60 10 0 Ellyg NA NA NA
Total 363/1,111 (33% availability) 58 305
a Total number of slots available for new drilling with conductor casing already in place. 4 b Total number of slots available for new drilling without a conductor in place. 5 c Includes Lease Blocks 315, 316, 437, 438, 440, 441, 450, and 451. 6 d Includes Lease Blocks 180, 181, 182, 183, 187, 188, 189, 190, 191 192, 193, 194, 195, 326, 329, and 461. 7 e Includes Lease Blocks 202, 203, 216, 234, 240, 241, and 346. 8 f Includes Lease Blocks 296, 300, 301, and 306. 9 g Platform Elly is a process-only platform, and no drilling or hydrocarbon production occurs there. 10

Draft Programmatic EA August 2018
B-4
B.2 NEW WELLS AND SIDETRACKING 1
2
The Proposed Action includes acceptance and review of Applications for Permit to Drill (APDs) 3
for drilling new wellbores beginning at the seafloor, and Applications for Permit to Modify 4
(APMs) for sidetracking from an existing wellbore. These well types are described in the following 5
paragraphs. 6
7
B.2.1 New Wells 8
9
Drilling a new well includes deployment of a drill string and a casing string, and placement of a 10
wellhead, blowout preventer, and riser connecting the wellhead to the platform. Drilling a new 11
well from a platform can only occur through a conductor, the availability of which varies 12
considerably among the platforms (Table B-1). Drilling proceeds with the installation of a 13
sequence of successively smaller diameter bores as the well accesses greater depths, each with a 14
casing cemented into place (Figure B-2). For each drilled interval, a motor mounted on the 15
platform rotates the drill string. Water-based drilling fluid (i.e., drilling mud) is pumped at a high 16
rate down the drill string and circulates drilling cuttings back up through the casing annulus. On 17
the platform deck, vibrating shakers remove the cuttings from the drilling fluid. The drilling fluid 18
is treated and restored with chemical additives and recirculated in a continuous process. Drill 19
cuttings may be disposed of in an onshore landfill, by reinjection into the formation, or by 20
permitted open-water discharge. On the POCS, spent drilling muds may be disposed of via open-21
water discharge under the National Pollutant Discharge Elimination System (NPDES) General 22
Permit. Once the producing zone of the formation has been reached, well completion involves 23
installing a slotted casing or perforating a solid casing with a cement sheath in place to allow 24
hydrocarbons to flow to the inside of the well casing, and then installing packers and tubing inside 25
the well casing to conduct oil and gas to the platform surface. 26
27
B.2.2 Sidetracking 28
29
A sidetrack is a secondary wellbore that is drilled 30
away from an original wellbore to either bypass an 31
unusable section of the original wellbore or to access 32
a nearby productive portion of the formation when 33
production in the original wellbore has dropped below 34
desired levels. It is not uncommon to have multiple 35
sidetracks from a single original wellbore. 36
Sidetracking also requires the permanent plugging 37
(i.e., plugback) of the original wellbore. With 38
sidetracking, there is no new conductor installation, 39
and all drilling and plugback occurs at depths well 40
below the seafloor surface (Figure B-2). 41
FIGURE B-2 Existing and Sidetrack Wells

Draft Programmatic EA August 2018
B-5
B.3 TEMPORARY WELL ABANDONMENT 1
2
Temporary well abandonment may occur for a variety of reasons (e.g., for extended well workover 3
or repair), the requirements for which are specified in Bureau of Safety and Environmental 4
Enforcement (BSEE) regulations (30 Code of Federal Regulations [CFR] 250, Subpart Q, 5
§250.1721–1723). To isolate downhole hydrocarbons from the surface for temporary 6
abandonment, a plug is set at the base of the deepest casing string and another plug is set no more 7
than 1,000 ft. (304.8 m) below the mud line. Temporary well abandonment uses existing platform 8
infrastructure (e.g., permitted diesel-engine pumps). There were 30 approved APMs for temporary 9
well abandonments at POCS platforms between 2012 and 2017. 10
11
12
B.4 ENHANCED PRODUCTION 13
14
The Proposed Action includes two enhanced production operations: (1) well washing and 15
desanding, involving wellhead removal; and (2) artificial lift. A recent Preliminary Environmental 16
Assessment (PEA) addressed review and approval of APMs for acidizing and hydraulic fracturing, 17
which are two other enhanced production activities PEA (BSEE and BOEM 2016). Therefore this 18
PEA does not evaluate these activities. 19
20
B.4.1 Well Washing and Desanding 21
22
Sand removal is identified in BSEE regulations as a routine operation that generally does not 23
require written approval from the BSEE District Manager (30 CFR 250, Subpart F, §§250.601 and 24
250.613), and dozens have been performed as routine operations between 2012 and 2017. An APM 25
is not required in cases that do not require wellhead removal, such as those using a coiled-tubing 26
unit. In cases in which wellhead removal is necessary, an APM is required, and such an operation 27
involves temporarily plugging the well and removing the wellhead, which is accomplished using 28
existing platform infrastructure. Sand generated by well washing and desanding is collected on the 29
platform for processing and permitted disposal. There were six approved APMs for well 30
washing/desanding operations at POCS platforms between 2012 and 2017. 31
32
B.4.2 Artificial Lift 33
34
Artificial lift is the general term for any means used to help bring produced fluids to the surface. 35
The most commonly used offshore artificial lift methods are gas lift and pumps. Both methods use 36
existing platform infrastructure. There were 65 approved APMs for artificial lift operations at 37
POCS platforms between 2012 and 2017. 38
39
Gas lift is currently the most widely used approach to enhance oil production. Inert gas is injected 40
into the producing hydrocarbon fluid at high pressure through one or more subsurface gas-lift 41
valves in the well and propels the fluids to the surface. Commonly used gases include CO2 or 42
natural gas produced from the well. A gas compressor on the platform provides the required 43
pressure to open the gas-lift valves. As the gas enters the tubing, it forms bubbles, which reduce 44
the fluid density. This lightened fluid density, along with the bubbles, forces the produced fluid up 45

Draft Programmatic EA August 2018
B-6
the tubing string to the platform. The gas produced from the well can be separated from the 1
produced fluids and reinjected into the well (this is known as a closed-loop gas lift). 2
3
Pumps used for artificial lift at POCS platforms include sucker-rod pumps, hydraulic pumps, 4
progressive cavity pumps, electric submersible pumps (ESPs), and jet pumps. Sucker-rod pumps 5
and hydraulic pumps are similar in operation. Both are placed at the bottom of the tubing string, 6
and each uses a rod-actuated plunger and two or more check valves which control the direction of 7
oil flow. As the plunger moves up and down, oil is drawn in to the pump and then lifted up the 8
tubing. In a sucker-rod pump, the rod extends from the pump to the surface and connects to a 9
pumping unit on the platform. In contrast, the rod in hydraulic pumps is short and extends only to 10
an engine piston that is part of the downhole pump. 11
12
Progressive cavity pumps use a rotating helical rotor within a stator (a metal tube with internally 13
molded cavities). The stator is typically run down the bottom of the production tubing, while the 14
rotor is connected to the bottom of a rod string extending from the platform. Rotation of the rod 15
string by means of a drive system on the platform causes the rotor to spin within the fixed stator, 16
creating a pumping action that moves the produced fluids to the surface. With ESP artificial lift, 17
an electric motor-driven pump placed at the bottom of the well pushes production fluids to the 18
surface. Transformers on the platform provide electrical power for the pumps. Sixty APMs for 19
replacing existing ESPs at POCS platforms were approved between 2012 and 2017. 20
21
A jet pump powered by a pump on the platform is inserted into the production fluids in the wellbore 22
and injects a pressurized fluid (the power fluid, typically consisting of refined oil, produced water, 23
or a mixture of the two). As power fluid exits the jet pump nozzle at a high velocity, production 24
fluid in the wellbore is passively drawn into a low-pressure section of the pump where it mixes 25
with the power fluid. This mixed fluid then enters another portion of the pump where higher 26
pressure brings the mixed fluid to the surface through a second tubing string. This operation is 27
accomplished using existing platform pumps and infrastructure. The number of existing jet pumps 28
at POCS platforms has been declining, and when one fails it is likely replaced by an ESP. There 29
was only a single approved APM for enhancing production using a jet pump at POCS platforms 30
between 2012 and 2017. 31
32
33
B.5 WORKOVER 34
35
The Proposed Action includes two workover operations: tubing changes and casing pressure 36
repair. 37
38
B.5.1 Tubing Change 39
40
Because tubing size affects the velocity of the fluid flowing up the well, replacing existing tubing 41
with smaller-diameter tubing may improve fluid movement to the surface. A tubing change may 42
also be required because of mechanical issues, such as corrosion of downhole equipment, the 43
collection of debris or scale in the wellbore, and the production of formation sand. Production 44
tubing is suspended from a casing hanger (which is part of the wellhead), and thus can be readily 45
removed and replaced. Prior to removal, a heavy fluid is placed into the well to prevent flow of 46

Draft Programmatic EA August 2018
B-7
reservoir fluids during tubing extraction. The casing hanger is then removed from the wellhead, 1
the tubing string is pulled from the well, and a new tubing string is installed. Tubing changes use 2
existing platform infrastructure (e.g., permitted diesel engines, electric generators). There were 89 3
approved APMs for tubing changes at POCS platforms between 2012 and 2017. 4
5
B.5.2 Casing Pressure Repair 6
7
Casing repairs address excessive casing pressure or casing leaks. The method of repair depends on 8
the size and condition of the casing, the depth and extent of the leak, and the productivity of the 9
well. Casing repair techniques include squeezing cement22 into a problematic void space at a 10
desired location in the well, running a casing liner or patch, and in some cases removing and 11
replacing the casing. Casing repairs use existing platform infrastructure (e.g., permitted diesel 12
engines, electric generators). There were 18 approved APMs for casing repair at POCS platforms 13
between 2012 and 2017. 14
15
16
B.6 UTILITY 17
18
The Proposed Action includes two utility operations: the injection of additional fluids in a 19
designated injection well, and conversion of an existing well to an injection well. 20
21
B.6.1 Injection of Additional Fluids 22
23
In order to increase low reservoir pressures, produced water may be injected into a reservoir. While 24
produced water is the most commonly used injection fluid, other fluids such as brine and polymer 25
solutions may also be injected to enhance hydrocarbon production. Injected fluids become part of 26
the produced fluids and are separated from the hydrocarbon product, reinjected, or disposed of in 27
accordance with the NPDES General Permit for the platforms. This utility operation requires no 28
changes to existing platform infrastructure. There was only a single approved APM for the use of 29
additional injection fluids at POCS platforms between 2012 and 2017. 30
31
B.6.2 Conversion of Existing Well (Production Well to Injection Well) 32
33
An existing production well can be converted to an injection well, saving the effort of drilling a 34
new injection well. Injection wells are fundamentally the same as production wells, the main 35
difference being the direction of flow. Well conversion requires mounting some directional-flow 36
components that control the amount of fluid injected into the well. Otherwise, no additional 37
platform-based infrastructure is necessary. There were seven approved APMs for well conversion 38
at POCS platforms between 2012 and 2017. 39
40
22 Squeeze refers to the application of pump pressure to force a treatment fluid or slurry into a specific zone within a
well. In a cement squeeze, a cement slurry is forced through holes or splits in a casing or liner into the surrounding
formation, where the relevant holes and voids will fill with cement that then cures to form an impenetrable barrier.

Draft Programmatic EA August 2018
B-8
B.7 COMPLETION 1
2
Completion is the process of making a well ready for production (or injection) once drilling has 3
been completed. The Proposed Action includes four completion operations: initial completion, 4
reperforation, perforation modification, and change in the zone of perforation. Completion 5
operations are accomplished using existing platform equipment. Each completion operation 6
includes well perforation to establish hydrocarbon flow between the wellbore and the reservoir. 7
Perforations also provide injection points for enhancing production. Well sections within a 8
reservoir are typically perforated in several intervals with short sections of unperforated casing 9
between intervals. 10
11
B.7.1 Initial Completion 12
13
Initial completion involves cementing and perforating the well casing, gravel packing, and 14
installing a production tree. As drilling progresses, steel pipe casing is joined together to make a 15
continuous hollow tube (the casing string) that is run into the wellbore. The casing stabilizes the 16
wellbore and, once cemented, isolates different formations to prevent unwanted flow of formation 17
fluid. Cementing the casing involves pumping cement slurry at high pressure down the inside of 18
the casing string and out of the bottom, displacing drilling fluids and filling in the space between 19
the casing and the surrounding rock surface of the wellbore with cement as it rises back up the 20
outside of the casing string. To improve hydraulic performance when drilling deeper wells, liners 21
may be used instead of full casing strings. A liner is a casing string that does not extend back to 22
the wellhead, but instead is hung from another casing string. 23
24
The use of shape-charge explosives is the most common method of perforating. Shape charges 25
penetrate well casings and cement with a jet of high-pressure, high-velocity gas. The charges are 26
arranged in a tool called a gun and lowered into the well to the desired depth opposite the producing 27
zone. The charges are then fired by electronic or mechanical means from the platform surface, 28
resulting in several perforations that allow reservoir fluids to flow into the wellbore. 29
30
Some wells require gravel packing to prevent sand from entering the wellstream. In such an 31
operation, a slurry of appropriately sized coarse sand or gravel is pumped into the well between 32
the slotted or perforated casing and the sides of the wellbore. The gravel pack filters out sand 33
entrained in the formation fluid before it enters the production stream. There were 23 approved 34
APMs for initial completion at POCS platforms between 2012 and 2017. 35
36
B.7.2 Reperforation 37
38
Reperforation involves creating new holes within an existing perforated zone of the wellbore, 39
without increasing or decreasing the size of the zone. The process can be performed at any point 40
in the life of a well. There were 27 approved APMs for reperforation at POCS platforms between 41
2012 and 2017. 42
43

Draft Programmatic EA August 2018
B-9
B.7.3 Perforation Modification 1
2
A perforated zone can become plugged with scale or other solid particles, or become compacted, 3
reducing formation permeability and inflow to the well. In other cases, lower portions of a 4
perforated zone may be primarily producing formation water. To address such issues, an operator 5
may request permission to modify the perforation zone, with the intent of increasing or decreasing 6
the perforation interval. This may involve creating new perforations above or below the existing 7
perforated zone, or squeeze-cementing a portion of a perforated zone to limit inflow of formation 8
water. There were 23 approved APMs for modifying perforations at POCS platforms between 9
2012 and 2017. 10
11
B.7.4 Change in Zone 12
13
A zone change (recompletion) involves abandoning one perforated zone and opening another. 14
Recompletion work varies depending on whether the new zone is above or below the currently 15
perforated zone. If above, the lower zone would be abandoned via squeeze-cementing or installing 16
a cement plug or a mechanical bridge plug, and the new zone perforated. If the new zone is below 17
the current zone, the existing zone will probably be squeeze-cemented (in the same manner as 18
repairing casing), the cement in the wellbore drilled out, and the lower zone perforated. There were 19
seven approved APMs for changing perforation zones at POCS platforms between 2012 and 2017. 20
21
22
B.8 REFERENCES 23
24
BSEE and BOEM, 2016, Programmatic Environmental Assessment of the Use of Well Stimulation 25
Treatments on the Pacific Outer Continental Shelf, Pacific OCS Regions, Camarillo, CA. 26
Available at pocswellstim.evs.anl.gov. 27
28
NMFS, 2014, Issuance of an Incidental Harassment Authorization to ExxonMobil Production 29
Company to Take Marine Mammals by Harassment Incidental to Conductor Pipe Installation 30
Activities at Harmony Platform in the Santa Barbara Channel Offshore of California, Office of 31
Protected Resources, Permits and Conservation Division, Silver Springs, MD. 32
33
34